profile of teachers in the u.s.2011
TRANSCRIPT

EMBARGOED FOR RELEASE: Friday, July 29, 2011, 10:00 a.m.
CONTACT: 202-822-8280 [email protected]
PROFILE OF
TEACHERS
IN THE U.S.2011
C. Emily Feistritzer
NATIONAL CENTER FOR
EDUCATION INFORMATION
Copyright 2011 by the National Center for Education Information
All rights reserved. No part of this publication may be reproduced in any form -- except for brief quotations
(not to exceed 1,000 words) in a review or professional work -- without written permission of the publisher.
The National Center for Education Information (NCEI) is a private, non-partisan research organization in
Washington, D. C. specializing in survey research and data analysis. Founded in 1979, NCEI has conducted
several national and state studies which include: surveys of teachers, school administrators, school board
presidents, state departments of education, local school districts and individuals interested in becoming teachers.
NCEI has produced 38 data-based reports including: PROFILE OF TEACHERS IN THE U.S. (2011, 2005,
1996. 1990, 1986); THE CONTEXT OF TEACHING (2010); PROFILE OF ALTERNATE ROUTE
TEACHERS (2005); ALTERNATIVE TEACHER CERTIFICATION: A State by State Analysis, 2010, 2009,
2008. 2007, 2006, 2005, 2004, 2003, 2002, 2001, 2000, 1998-99, 1997, 1996, 1995, 1993-94, 1992-93, 1991
and 1990; PROFILE OF TROOPS TO TEACHERS (2005 and 1998); CERTIFICATION OF PRINCIPALS
AND SUPERINTENDENTS IN THE U.S.(2002); THE MAKING OF A TEACHER: A Report on Teacher
Preparation in the U.S. (1999 and 1984); PROFILE OF TEACHERS IN THE U.S. (1996, 1990 and 1986);
WHO WANTS TO TEACH? (1992); SURVEY OF ARMY PERSONNEL INTERESTED IN TEACHING
(1992); PROFILE OF SCHOOL BOARD PRESIDENTS IN THE U.S. (1989); PROFILE OF SCHOOL
ADMINISTRATORS IN THE U.S. (1988); TEACHER SUPPLY AND DEMAND SURVEYS (1988); THE
CONDITION OF TEACHING: A State-by-state Analysis, 1987 and 1985; TEACHER CRISIS: MYTH OR
REALITY? (1986); CHEATING OUR CHILDREN: WHY WE NEED SCHOOL REFORM (1985); THE
AMERICAN TEACHER (1983), EDUCATION DEPARTMENT (1981 and 1980); GUIDE TO EDGAR
(1980).
Copies of PROFILE OF TEACHERS IN THE U.S. 2011 can be obtained for $35, plus $10 shipping and
handling, from:
NATIONAL CENTER FOR EDUCATION INFORMATION
4401A Connecticut Ave., N.W., PMB 212
Washington, D.C. 20008
Phone: 202-822-8280
Web sites: www.ncei.com and www.teach-now.org
Library of Congress
ISBN 1-928665-18-7

TABLE OF CONTENTS
LIST OF TABLES ............................................................................................................................................... V
LIST OF CHARTS .......................................................................................... ERROR! BOOKMARK NOT DEFINED.
INTRODUCTION ........................................................................................................................................... VIII
EXECUTIVE SUMMARY .................................................................................................................................. IX
DEMOGRAPHICS ........................................................................................................................................... 12
GENDER ............................................................................................................................................................. 12
AGE ................................................................................................................................................................... 12
RACE ................................................................................................................................................................. 15
WHERE TEACHERS TEACH ...................................................................................................................................... 16
GRADE LEVELS ..................................................................................................................................................... 16
WHAT SUBJECTS TEACHERS TEACH .......................................................................................................................... 17
HIGHEST ACADEMIC DEGREE TEACHERS HOLD ........................................................................................................... 19
YEARS OF TEACHING EXPERIENCE ............................................................................................................................ 19
ROUTES TO TEACHING .................................................................................................................................. 20
NCES DATA ON EDUCATION DEGREES AND WHO GOES INTO TEACHING ....................................................... 10
CONTRIBUTION OF ALTERNATIVE ROUTES TO TEACHER PRODUCTION ............................................................................. 10
2011 NCEI TEACHER SURVEY DATA ON TEACHER PREPARATION ROUTES ...................................................... 21
COMPOSITION OF PUBLIC SCHOOL TEACHERS BY ROUTE TO TEACHING ........................................................................... 21
ROUTE TO TEACHING BY YEAR BEGAN FIRST TEACHING POSITION .................................................................................. 21
ROUTE TO TEACHING BY YEARS OF TEACHING EXPERIENCE ........................................................................................... 22
ROUTE TO TEACHING BY GENDER ............................................................................................................................ 23
ROUTE TO TEACHING BY RACE ................................................................................................................................ 23
RATING TEACHER PREPARATION PROGRAMS ............................................................................................................. 24
LENGTH OF COMPONENTS OF TEACHER PREPARATION PROGRAM .................................................................................. 25
WOULD TEACHERS RECOMMEND THE PREPARATION PROGRAM THEY WENT THROUGH? .................................................. 25
TYPE OF TEACHER PREPARATION PROGRAM, BY TYPE OF COMMUNITY ....................................................... 26
TYPE OF TEACHER PREPARATION PROGRAM, BY GRADE LEVEL TAUGHT .......................................................................... 28
PERCEPTIONS OF PREPARATION ROUTES BY GRADE LEVELS TAUGHT .............................................................................. 28
TEACHER PREPARATION ................................................................................................................................ 29
HIGHEST ACADEMIC DEGREE HELD .......................................................................................................................... 29
EFFECTIVENESS OF ASPECTS OF TEACHER PREPARATION PROGRAMS .............................................................................. 30
SEMESTER HOURS OF EDUCATION COURSES TAKEN .................................................................................................... 32
PERCEIVED COMPETENCE TO TEACH ......................................................................................................................... 33
PERCEIVED COMPETENCE TO TEACH BY PREPARATION ROUTE ...................................................................................... 35
PERCEIVED COMPETENCE TO TEACH BY YEARS OF EXPERIENCE ...................................................................................... 36
WHAT’S MOST VALUABLE IN DEVELOPING COMPETENCE TO TEACH .............................................................................. 37
TEACHERS’ VIEWS ON CURRENT REFORM PROPOSALS ................................................................................. 40
MEASUREMENTS TO DETERMINE TEACHER QUALIFICATION .......................................................................................... 40

PERCEPTIONS OF CRITERIA USED TO QUALIFY TEACHERS BY PREPARATION ROUTE ............................................................ 41
WHAT WOULD STRENGTHEN TEACHING AS A PROFESSION ........................................................................................... 42
ALTERNATIVE VS. TRADITIONALLY PREPARED TEACHERS’ VIEWS ON WAYS TO IMPROVE THE TEACHING PROFESSION ............... 43
TEACHER-FAVORED WAYS TO IMPROVE THE TEACHING PROFESSION .............................................................................. 43
PROPOSALS TO IMPROVE AMERICA’S EDUCATIONAL SYSTEM ........................................................................................ 45
TEACHER-FAVORED WAYS TO IMPROVE EDUCATION ................................................................................................... 45
ALTERNATE VS. TRADITIONAL PREPARED TEACHERS ON EDUCATION REFORM PROPOSALS .................................................. 46
PERCENT OF TEACHERS THAT FAVOR REFORM PROPOSALS, BY YEARS OF TEACHING EXPERIENCE ......................................... 47
HELPFULNESS OF SUPPORT TO TEACHERS .................................................................................................................. 48
SATISFACTION .............................................................................................................................................. 49
CURRENT TEACHER SATISFACTION ........................................................................................................................... 49
TEACHER SATISFACTION ACROSS SUB-GROUPS .......................................................................................................... 50
COMMENTS .................................................................................................................................................... 51
TEACHER DEMAND AND MOBILITY .............................................................................................................. 52
WHERE TEACHERS ARE WILLING TO TEACH ............................................................................................................... 52
TEACHER RELOCATION UNLIKELY ............................................................................................................................. 53
PROXIMITY BETWEEN BIRTHPLACE AND COLLEGE EDUCATION SITE ................................................................................ 55
PROXIMITY BETWEEN BIRTHPLACE AND TEACHING SITE ............................................................................................... 55
PLANS FIVE YEARS FROM NOW .................................................................................................................... 56
WHAT TEACHERS EXPECT TO BE DOING FIVE YEARS FROM NOW .................................................................................. 56
Teachers' Future Plans by Sub-groups …………………………………………………………………………………….…………………47
APPENDIX: MASTER TABLES OF SURVEY RESPONSES ................................................................................ 58

National Center for Education Information Profile of Teachers in the U.S. 2011 | v
LIST OF TABLES
Table 1. Demographic Profile of Teachers in the U.S. ..................................................................................... 11
Table 2. Demographics of Public School Teachers by Race 2011 .................................................................... 14
Table 3. Subjects Teachers Teach .................................................................................................................... 18
Table 4. Preparation Program Ratings by Grade Level Taught ........................................................................ 28
Table 5. Rating Competencies When Began Teaching and Now ..................................................................... 34
Table 6. Valuable Criteria in Developing Competence to Teach ..................................................................... 38
Table 7. Helpfulness of Support in Developing Competence to Teach ......................................................... 41
Table 8. Measurements to Determine Teacher Qualification ......................................................................... 41
Table 9. Suggestions to Improve the Teaching Profession .............................................................................. 42
Table 10. Teacher Satisfaction with Aspects of Teaching by Year Surveyed ................................................... 49
Table 11. Communities Teachers Teach and Are Willing to Teach in by Preparation Route .......................... 52
Table 12. Likelihood to Move to Meet the Demand for Teachers .................................................................... 54
Table 13. Five-year Projection for Teachers .................................................................................................... 57

vi | Profile of Teachers in the U.S 2011 National Center for Education Information
LIST OF CHARTS Chart 1. Gender ............................................................................................................................. 12
Chart 2. Teacher Age over Time .................................................................................................... 13
Chart 3. Teacher Age, 1986-2011 .................................................................................................. 13
Chart 4. Race ................................................................................................................................. 15
Chart 5. Race by Preparation Route .............................................................................................. 15
Chart 6. Where Teachers Teach .................................................................................................... 16
Chart 7. Grades Taught by Preparation Route .............................................................................. 16
Chart 8. Subjects Taught ............................................................................................................... 17
Chart 9. Highest Degree Held ........................................................................................................ 19
Chart 10. Years of Teaching Experience ........................................................................................ 19
Chart 11. Number of Teachers Certified Through Alternate Routes, 1985-2009 ......................... 20
Chart 12. Pathways to Teacher Certification ................................................................................ 21
Chart 13. Preparation Route to Teaching by Year Began First Teaching Position ........................ 22
Chart 14. Route to Teaching by Years of Teaching Experience ..................................................... 22
Chart 15. Route to Teaching by Gender ........................................................................................ 23
Chart 16. Route to Teaching by Race ............................................................................................ 23
Chart 17. Teacher Preparation Program Rating ............................................................................ 24
Chart 18. How Teachers Rate Their Preparation Program, by Sub-groups ................................... 24
Chart 19. Length of Components of Teacher Preparation Program ............................................. 25
Chart 20. Would you recommend your preparation program to others? .................................... 25
Chart 21. Would Recommend Preparation Program to Others, by Sub-groups ........................... 26
Chart 22. Type of Teacher Preparation Program, by Type of Community .................................... 26
Chart 23. Teacher Preparation Program Ratings, by Type of Community .................................... 27
Chart 24. Length of Pre-Teaching Courses Required, by Type of Community .............................. 27
Chart 25. Length of Classroom Teaching Experiences, by Type of Community ............................ 27
Chart 26. Would Recommend Preparation Program, by Type of Community .............................. 27
Chart 27. Type of Teacher Preparation Program, by Grade Level Taught .................................... 28
Chart 28. Highest Degree Held, by Preparation Route ................................................................. 29
Chart 29. Aspects of Teacher Preparation Program Rated "Very Effective" ................................. 30
Chart 30. Aspects of Teacher Preparation Program Rated "Very Effective", by Route to
Teaching ......................................................................................................................... 31
Chart 31. College Semester Hours of Education Courses Taken ................................................... 32
Chart 32. Semester Hours of Education Courses Taken, by Preparation Route ........................... 32
Chart 33. Areas of Teaching Perceived "Very Competent" to Teach ............................................ 33
Chart 34. Perceived "Very Competent" when Began Teaching by Preparation Route ................. 35
Chart 35. Teachers Who Feel “Very Competent" Now, by Preparation Route ............................. 35

National Center for Education Information Profile of Teachers in the U.S. 2011 | vii
Chart 36. Perceived "Very Competent" Now, by Years' Experience ............................................. 36
Chart 37. Rated "Very Valuable" in Developing Competence to Teach by Year ........................... 37
Chart 38. Criteria Rated Very Valuable in Developing Competence to Teach, by
Preparation Route .......................................................................................................... 38
Chart 39. Criteria Rated Very Valuable in Developing Competence to Teach, by
Number of Semester Hours of Education Courses Taken ............................................... 39
Chart 40. Support Rated Very or Somewhat Helpful, by Preparation Route ................................ 58
Chart 41. Teacher-approved Criteria to Determine Teacher Qualification ................................... 40
Chart 42. Teacher-disputed Criteria to Determine Teacher Qualification .................................... 40
Chart 43. Teacher-favored Ways to Improve the Profession, by Type of Preparation Program ......................................................................................................................................................... 43
Chart 44. Pay teachers based on seniority .................................................................................... 44
Chart 45. Pay teachers based on performance ............................................................................. 44
Chart 46. Get rid of tenure for teachers ....................................................................................... 44
Chart 47. Teacher-favored Ways to Improve Education ............................................................... 45
Chart 48. Teacher-favored Ways to Improve Education, by Preparation Route ........................... 46
Chart 49. Percent of Teachers That Favor Reform Proposals, by Years’ Experience .................... 47
Chart 50. Teacher Satisfaction with Aspects of Teaching ............................................................. 50
Chart 51. Willingness to Teach in Community, by Preparation Route .......................................... 52
Chart 52. Very or Somewhat Unlikely to Move Despite Demand ................................................. 53
Chart 53. Question: Did you complete your undergraduate college education within
150 miles of the place where you were born? ................................................................ 55
Chart 54. Question: Are you now teaching within 150 miles of the place where you were born? ............................................................................................................................................. 55
Chart 55. What Teachers Expect to Be Doing in Five Years ....................................................... 56
Chart 56. Proportion of Teachers Aged under 30 and over 50 in 2005 and in 2011 ....................... 56

viii | Profile of Teachers in the U.S 2011 National Center for Education Information
INTRODUCTION
There are 3.2 million public school teachers educating the nation’s 49.4 million children
attending public PK-12 schools, according to the U.S. Department’s National Center for Education
Statistics (NCES).
NCES Schools and Staffing Surveys also show that, in 2007-08 (the latest year for which these
data are published), about 146,500 of these teachers (4.3 percent) were new hires who had never
taught before – 92,500 were new college graduates and 54,000 were “delayed entrants (people who
had a college degree but had not entered teaching right out of college). SASS
Who teachers are, where they are coming from and what they think are of great interest to every
segment of society. The National Center for Education Information (NCEI) has been studying
teachers since 1979. It has conducted five national surveys of teachers -- in 1986, 1990, 1996, 2005
and 2011 – all designed to find out who they are and what they think about a wide array of issues
facing the teaching profession and education in general. NCEI’s sample surveys of teachers in all
years have been drawn from Market Data Retrieval’s database of teachers. NCEI’s samples of
teachers in each year surveyed are drawn to reflect the distribution of teachers by state in the United
States.
In 2011, NCEI surveyed 2,500 randomly selected K-12 public school teachers from MDR’s
database of teachers, November 10, 2010 – June 20, 2011 using a 33-item mail and online survey
questionnaire. Usable surveys were completed by 1,076 teachers, representing a 43 percent response
rate. This report, PROFILE OF TEACHERS IN THE U.S. 2011 is based on the results of NCEI’s
2011 survey of public school teachers in the United States. Many questions asked in the earlier surveys
of teachers were also asked in 2011, so comparisons are made between teachers now and in those
earlier years.
For the sake of simplicity, a year at the head of a column in this publication refers to public school
teachers surveyed by NCEI in that year. In some cases, totals do not add to 100 percent, due to
rounding.
We have also included in an appendix tables of responses to the questions in the survey for all
respondents, as well as by route to teaching, years’ teaching experience, age groups, gender and race.
Many people helped make this project a success. I wish to thank those who helped design the
questionnaire, which, thanks to their input, underwent numerous revisions and improvements. I am
grateful to the Studer Group who provided support for this project and to Janet Pilcher and Robin
Largue for their input and editing all along the way.
Special thanks go to Steven Griffin of the Florida State University’s Center for Interactive Media
who came through, once again, with data entry and analysis programs that enabled us to analyze the
data thoroughly.
I am most grateful to Alice Linnajarvi whose tireless efforts in generating tables and charts paid off
and have made this report so informative and graphic.
Lastly, thanks to all the teachers who took the time to complete the survey and made it possible to
provide this informative profile of teachers in the United States.
Emily Feistritzer
July 29, 2011

National Center for Education Information Profile of Teachers in the U.S. 2011 | ix
EXECUTIVE SUMMARY
K-12 public school teachers in the United States are amazingly similar over time. They constitute a
unique profession that has self-propagated itself for at least the last half century. But, due to an influx
of individuals from non-traditional backgrounds entering teaching through non-traditional preparation
programs, the teaching force may be changing.*
One-third of first-time public school teachers hired since 2005 entered the profession through an
alternative program other than a college campus-based teacher education program.
The findings throughout this survey illustrate striking differences between this non-traditional
population of new teachers and teachers who enter teaching through undergraduate and graduate
college campus-based teacher education programs, especially in attitudes concerning current proposed
school reform measures and ways to strengthen teaching as a profession, such as:
Getting rid of tenure for teachers
Performance-based pay
Market-driven teacher pay – paying teachers more to teach in high needs schools and high
demand subjects
Recruiting individuals from other careers into teaching and school administration
Using student achievement to evaluate teacher effectiveness
The findings also show amazing similarities among all teachers surveyed, regardless of their
backgrounds, how they prepared to teach, their age, how long they’ve been teaching and other variables
we analyzed the data by. Public school teachers surveyed:
Strongly support getting rid of incompetent teachers regardless of seniority
Are generally satisfied with their jobs and various aspects of teaching
Think they are competent to teach
Rate their teacher preparation programs highly
Consider the same things as valuable in developing competence to teach – their own
teaching experiences and working with other teachers/colleagues top the list
Plan to be teaching K-12 five years from now
_________________________________________________________________________________
*In order to teach in a public school in the United States, one has to have at least a bachelor’s degree and a certificate from the state in which one is teaching. Teaching has historically drawn its teachers from college graduates who majored in education or at least participated in a college teacher education program that was approved by the state and which culminated in a teaching certificate or at least eligibility to receive one.
In the mid-1980s a few states started creating “alternative routes to teacher certification” which were designed for the explicit purpose of attracting individuals who already had at least a bachelor’s degree – usually in a field other than education – into the teaching profession. Since the mid-1980s, hundreds of such alternative programs have been created and are being implemented in nearly every state. They are now producing about 60,000 new teachers per year. For more information about these programs, visit www.teach-now.org.

x | Profile of Teachers in the U.S 2011 National Center for Education Information
Demographics
The proportion of public school teachers who have five or fewer years of teaching experience
increased from 18 percent in 2005 to 26 percent in 2011. At the other end of the spectrum, the
proportion of teachers with 25 or more years’ experience dropped from 27 percent in 2005 to 17 percent
in 2011. These newer teachers are considerably more open to proposed reforms in the profession and
in American education.
Reversing a trend toward an older teaching force that began in the 1990’s, the proportion of teachers
under 30 years of age rose dramatically from the 2005 survey to 2011, while the proportion of teachers
50 and older dropped. More than one in five (22 percent) teachers surveyed in 2011 was under the age
of 30, compared with only 11 percent in 2005 and in 1996. The proportion of teachers 50 and older
dropped from 42 percent in 2005 to 31 percent in 2011. Clearly, the older teachers are retiring and
being replaced once again by teachers in their 20s and 30s.
Teaching is still an overwhelmingly female occupation. The profession is also strikingly White,
but there is some shift toward more people of color entering the ranks of teaching. Hispanics are the
fastest growing non-White group entering teaching.
More than half of public school teachers hold at least a Master’s degree. In the overall teaching
force, there has been a slight shift in highest degree held. In 2005, a master’s degree in education was
the highest degree held by nearly half of the teaching force (47 percent); an additional 10 percent held a
Master’s degree in a field other than education. In 2011, the proportion of the teaching force holding
masters’ degrees in education as their highest degree was 43 percent; 12 percent held Master’s degrees.
The proportion of teachers whose highest degree is a non-education degree rose from 21percent in
2005 to 27 percent in 2011.

National Center for Education Information Profile of Teachers in the U.S. 2011 | 11
Table 1. Demographic Profile of Teachers in the U.S.
PUBLIC SCHOOL TEACHERS
2011 2005 1996 1990 1986
N = 1,076 1,028 1,018 2,380 1,144
Age ≤29 21 11 11 15 11
30-39 27 22 21 37 36
40-49 22 26 44 35 31
50+ 31 42 24 13 22
Gender % % % % %
Male 16 18 26 29 31
Female 84 82 74 71 69
Race White 84 85 89 92 91
Black 7 6 7 5 6
Hispanic 6 4 2 2 2
Other 4 5 2 1 0
Highest Degree Earned Bachelor’s - Education 29 31
Bachelor’s - Other 15 11
Master’s - Education 43 47
Master’s - Other 12 10
Doctorate - Education 1 1
Years of experience
1-5 26 18 12 16 8
6-9 16 14 18 18 16
10-14 16 16 13 21 24
15-24 23 25 37 33 37
25+ 17 27 20 12 15

12 | Profile of Teachers in the U.S 2011 National Center for Education Information
DEMOGRAPHICS
Gender
Despite much attention and some effort to get more males into K-12 teaching, the public school
teaching force in the United States continues to get more female. Eighty-four percent of public school
teachers are female. This is up from 82 percent in 2005, 74 percent in 1996, 71 percent in 1990 and 69
percent in 1986.
Alternative preparation routes produce a higher proportion of male teachers. Twenty-two percent of
teachers coming through alternate routes are men, compared with 16 percent of teachers entering the
profession through traditional programs.
Chart 1
Age
The proportion of teachers under 30 years of age rose dramatically from 2005 to 2011, while the
proportion of teachers 50 and older dropped reversing a trend toward an older teaching force that began
in the 1990’s.
More than one in five (22 percent) teachers in 2011 was under the age of 30, compared with only 11
percent in 2005 and in 1996. The proportion of teachers 50 and older dropped from 42 percent in 2005
to 31 percent in 2011. Clearly, the older teachers are retiring and being replaced once again by teachers
in their 20s and 30s.
16 18
26 29 31
84 82
74 71 69
0
10
20
30
40
50
60
70
80
90
100
20112005199619901986
Pe
rce
nt
Gender
Male
Female
National Center for Education Information Profile of Teachers in the U.S. 2011 | 13
Chart 2
Chart 3
0
5
10
15
20
25
30
35
40
45
50
20112005199619901986
Teacher Age over Time
≤29
30-39
40-49
50+
21
11
11
15
11
27
22
21
37
36
22
26
44
35
31
31
42
24
13
22
0% 20% 40% 60% 80% 100%
2011
2005
1996
1990
1986
Teacher Age, 1986-2011
≤29
30-39
40-49
50+

14 | Profile of Teachers in the U.S 2011 National Center for Education Information
Table 2. Demographics of Public School Teachers by Race 2011
White Black Hispanic Other
N= 768 62 65 33
% % % %
Gender
Female 85 90 78 73
Male 15 10 22 27
Age
≤29 23 10 30 12
30-39 26 32 38 33
40-49 21 29 17 27
50+ 30 30 16 27
Highest Degree Held
Bachelor’s - Education 30 21 32 25
Bachelor’s - Other 17 21 30 22
Master’s - Education 40 38 19 38
Master’s - Other 11 12 16 16
Doctorate - Education 1 5 2 0
Other Advanced Degree 0 3 2 0
Grades Taught
PK-4 47 38 52 52
5-8 30 28 27 18
9-12 25 33 20 30
Type of Community Taught in
Rural 24 17 10 15
Town 20 3 19 15
City 28 59 56 45
Suburb 28 20 16 24

National Center for Education Information Profile of Teachers in the U.S. 2011 | 15
Race
There is a slight shift in the teaching force toward more persons of color. The proportion of K-12
teachers who are white has dropped from 91 percent in 1986 to 84 percent in 2011. The fastest growing
groups of non-white teachers are persons of Hispanic origin and races other than black. Hispanics also
have higher percentages of males entering teaching – 22 percent of Hispanic teachers and 27 percent of
teachers who represent races other than White, Black or Hispanic are male (Table 2).
Again, alternate routes are bringing in more minorities than are traditional preparation programs.
While 87 percent of teachers who have entered the profession through traditional college,
campus-based teacher preparation programs are White, 30 percent of teachers entering through
alternative teacher preparation programs are non-White – 15 percent are Hispanic, 11 percent are Black
and 4 percent other races (Chart 5).
Chart 4
Chart 5
84
85
89
92
91
7
6
7
5
6
6
4
2
2
2
4
5
2
1
0% 20% 40% 60% 80% 100%
2011
2005
1996
1990
1986
Race
White
Black
Hispanic
Other
87
70
5
11
4
15
3
4
0% 20% 40% 60% 80% 100%
Traditional
Alternative
Race by Preparation Route
White
Black
Hispanic
Other

16 | Profile of Teachers in the U.S 2011 National Center for Education Information
Where Teachers Teach
About one-third (31 percent) of all teachers in our survey teach in cities, 26 percent in
suburbs, 19 percent in towns and about one-fourth (23 percent) in rural areas of the country.
Chart 6
White teachers -- who make up 84 percent of the total teaching force – are fairly evenly distributed
across these four types of communities. However, they are dramatic differences in the distribution of
teachers by color in different communities. More than half of black and Hispanic teachers are
teaching in cities, compared with 28 percent of white teachers who are.
Only 20 percent of black teachers and 16 percent of Hispanics are teaching in suburban
communities, compared to 28 percent of white teachers who teach in suburban schools (Table 2).
Grade Levels
About half (48 percent) of teachers surveyed in 2011 taught in grades PK- 4. A little over one-fourth
(26 percent) taught in grades 5 - 8 and 27 percent taught grades 9 – 12.
By preparation route, a much smaller percentage of teachers enter elementary school teaching
through alternative routes, as shown in Chart 7.
While 53 percent of traditionally prepared teachers teach PK – 4 students, only one-third (34
percent) of alternatively prepared teachers teach elementary grades. Three-fourths (74 percent) of
teachers entering teaching through alternative routes are teaching in grades 5 – 8 (44 percent) or grades
9 – 12 (30 percent).
Chart 7
23%
19%
31
26%
Where Teachers Teach
Rural
Town
City
Suburb
53
34
26
44
24
30
0% 20% 40% 60% 80% 100%
Traditional
Alternate
Grades Taught by Preparation Route
PK-4
5-8
9-12

National Center for Education Information Profile of Teachers in the U.S. 2011 | 17
What Subjects Teachers Teach
Nearly half (48 percent) of teachers prepared through traditional college teacher education
programs teach Elementary education. More alternatively prepared teachers are teaching in the high
demand subjects – math, science, special education and bilingual education (Chart 8 and Table 3).
Chart 8
48
21
16
11
11
10
8
5
5
5
4
4
4
4
3
3
3
2
2
2
1
1
1
1
1
1
1
1
1
1
1
1
1
1
1
0
0
29
22
29
9
5
16
13
11
9
6
6
5
3
0
5
3
2
4
3
1
8
4
3
2
2
2
1
1
1
0
2
1
0
0
0
1
1
0 10 20 30 40 50
General elementary
English/Language arts
Mathematics
Reading
Kindergarten
Social studies/Social science
General or other science
Special education, general
History
English as a second language
Biology/Life science
Gifted
Art/Music
Basic skills and remedial education
Physical science
Specific learning disabilities
Emotionally disturbed
Geology/Earth science/ Space science
Chemistry
Speech/Language impaired
Bilingual education
Spanish
Physics
Computer science
Physical education/ Health
Dance/Drama/Theater
Orthopedically impaired
Mentally retarded
Journalism
Mildly handicapped
All others
Visually handicapped
American Indian/Native American studies
Deaf or hard-of-hearing
Other special education
Severely handicapped
Business, marketing
Percent
Subjects Taught
Traditional
Alternative

18 | Profile of Teachers in the U.S 2011 National Center for Education Information
Table 3. Subjects Teachers Teach
Traditional Alternative
% %
General elementary 48 29
English/Language arts 21 22
Mathematics 16 29
Reading 11 9
Kindergarten 11 5
Social studies/Social science 10 16
General or other science 8 13
Special education, general 5 11
History 5 9
English as a second language 5 6
Biology/Life science 4 6
Gifted 4 5
Art/Music 4 3
Basic skills and remedial education 4 0
Physical science 3 5
Specific learning disabilities 3 3
Emotionally disturbed 3 2
Geology/Earth science/ Space science 2 4
Chemistry 2 3
Speech/Language impaired 2 1
Bilingual education 1 8
Spanish 1 4
Physics 1 3
Computer science 1 2
Physical education/ Health 1 2
Dance/Drama/Theater 1 2
Orthopedically impaired 1 1
Mentally retarded 1 1
Journalism 1 1
Mildly handicapped 1 0
All others 1 2
Visually handicapped 1 1
American Indian/Native American studies 1 0
Deaf or hard-of-hearing 1 0
Other special education 1 0
Severely handicapped 0 1
Business, marketing 0 1

National Center for Education Information Profile of Teachers in the U.S. 2011 | 19
Highest Academic Degree Teachers Hold
In the overall teaching force, there has been a slight shift in highest degree held. In 2005, a
master’s degree in education was the highest degree held by nearly half of the teaching force (47
percent), followed by 31 percent who held a bachelor’s degree in education. In 2011, the proportion of
the teaching force holding masters’ degrees in education as their highest degree was 43 percent,
followed by 29 percent who held bachelor’s in education degrees.
The proportion of teachers whose highest degree is a non-education degree rose from 21 in 2005 to
27 percent in 2011 (Chart 9).
Chart 9
Years of Teaching Experience
The proportion of the K-12 public school teaching force that had 25 or more years of teaching
experience almost doubled from the first year we started surveying teachers in 1986 – from 15 percent
to 27 percent in 2005, as shown in Chart 10.
However, from 2005 to 2011, that proportion of teachers with 25+ years’ experience has dropped to
17 percent, while the proportion of teachers with five or fewer years’ experience rose from 18 percent
in 2005 to 26 percent in 2011.
Chart 10
The obvious explanation is that older, more experienced teachers are leaving in greater numbers due
to retirement, and younger, less experienced teachers are replacing them.
But something else is going on. The routes these new teachers are taking to enter the profession are
different than the traditional college-based education programs their older counterparts took.
29
31
15
11
43
47
12
10
1
1
0% 20% 40% 60% 80% 100%
2011
2005
Highest Degree Held
Bachelor’s - Education
Bachelor’s - Other
Master’s - Education
Master’s - Other
Doctorate - Education
26
18
12
16
8
16
14
18
18
16
16
16
13
21
24
23
25
37
33
37
17
27
20
12
15
0% 20% 40% 60% 80% 100%
2011
2005
1996
1990
1986
Years of Teaching Experience
1-5
6-9
10-14
15-24
25+

20 | Profile of Teachers in the U.S 2011 National Center for Education Information
ROUTES TO TEACHING
Popular wisdom has it that the primary source of new teachers in the United States is individuals who get an undergraduate degree in education. But, as NCEI surveys of states and this 2011 survey of teachers show – as well as data from the National Center for Education Statistics – that is no longer the case.
NCES DATA ON EDUCATION DEGREES AND WHO GOES INTO TEACHING
Data from the latest National Center for Education Statistics’ Baccalaureate and Beyond (B&B:08/09) Longitudinal Study that looked at the percentage distribution of 2007-08 bachelor’s degree recipients by K-12 teaching experience in 2009 indicates that of Bachelor’s degree recipients in 2007-08 who majored in education, about 35 percent were not teaching in 2009 – 16.0 percent had prepared to teach but had not taught; 3.7 percent were considering teaching but had not taught or prepared to teach; 15.4 percent had not prepared for teaching or taught, and were not even considering teaching. About half (50.8 percent) had started teaching after receiving their Bachelor’s in Education degree and 14.1 percent reported that they had taught or started to teach before completing their bachelor’s degree. (B & B 08/09, Table 8)
The 2001 B&B report showed that that about 21 percent of BA recipients in 2000-01 who were teaching during the year following graduation were neither prepared nor certified to teach during their undergraduate studies. Furthermore, the 2001 B & B report showed that of the BA recipients who were certified and/or had prepared to teach as part of their undergraduate program in 2000-01, 23 percent were not teaching within a year of graduating.
An older NCES report uses longitudinal data from the 1992-93 Baccalaureate and Beyond Study (B&B: 93/03) to analyze the teaching career choices of 1992-93 Bachelor's degree recipients. As of 2003, 40 percent of Education majors were not teaching at the elementary/secondary level in 1994, 1997, or 2003.
Contribution of Alternative Routes to Teacher Production
The National Center for Education Information (NCEI) has been tracking teacher preparation routes since 1983. Alternative routes to teacher certification began in the mid-1980s and took off in the late 1990s. Alternative routes to teacher certification are state-defined routes through which an individual who already has at least a Bachelor’s degree can obtain certification to teach without necessarily having to go back to college and complete a college campus-based teacher education program.
As shown in the figure below, the numbers of teachers obtaining certification through alternative routes have increased substantially in the last decade.
Chart 11
Source: National Center for Education Information. Alternative Teacher Certification: A State-by-State Analysis 2010
Number of Teachers Certified Through Alternate Routes, 1985-2009
275 550 1,303
3,891
7,2735,690
3,0343,863
6,223 6,0996,932 7,158
6,028
12,283
15,879
20,355
25,970
33,225
38,519
50,000
59,000
57,000
62,000
59,000
0
10,000
20,000
30,000
40,000
50,000
60,000
70,000
1985-
86
1986-
87
1987-
88
1988-
89
1989-
90
1990-
91
1991-
92
1992-
93
1993-
94
1994-
95
1995-
96
1996-
97
1997-
98
1998-
99
1999-
00
2000-
01
2001-
02
2002-
03
2003-
04
2004-
05
2005-
06
2006-
07
2007-
08
2008-
09
Year
Nu
mb
er C
erti
fied

National Center for Education Information Profile of Teachers in the U.S. 2011 | 21
2011 NCEI TEACHER SURVEY DATA ON TEACHER PREPARATION ROUTES
Composition of Public School Teachers by Route to Teaching
In 2011, about two out of three (65 percent) teachers surveyed had entered the profession through a
traditional college-campus-based undergraduate teacher education program and an additional 18
percent had prepared to teach through a traditional graduate teacher education program. Sixteen
percent of current public school teachers reported entering teaching through various alternatives to
these college campus-based programs (Chart 12).
Chart 12
Route to Teaching by Year Began First Teaching Position
Analyses of the survey data by when teachers began their first teaching position shows a striking
trend in preparation routes, as shown in Chart 13. Almost all (97 percent) of teachers who entered the
profession before 1980 entered through an undergraduate (88 percent) or graduate (9 percent)
traditional college, campus-based teacher education program.
The proportion of new teachers hired from the pool of traditional undergraduate programs steadily
declined from 1980 to 2005 as the proportion of new hires from traditional graduate programs and
alternative routes rose (Chart 13).
The burst of new hires from alternative preparation programs really took off in the last five years,
with 4 out of 10 new hires coming from these routes. The proportion of new hires between 2005 and
2010 coming from undergraduate teacher education programs dropped to 50 percent and from graduate
college, campus-based teacher education programs to 10 percent.
65%
18%
8%
3% 5% 1%
Pathways to Teacher Certification
Traditional college campus-basedundergraduate teacher education program
Traditional college campus-based graduateteacher education program
Alternative school-based programadministered by a college
Alternative school-based programadministered by a school district
Alternative program but don’t know who it was administered by
Not sure

22 | Profile of Teachers in the U.S 2011 National Center for Education Information
Chart 13
Route to Teaching by Years of Teaching Experience
An analysis of the 2011 teacher survey results by years of experience categories also reveals a
noticeable trend away from entry into teaching being almost exclusively through traditional college,
campus-based preparation programs. 95 percent of teachers with 25 or more years’ experience were
prepared to teach through a traditional campus-based undergraduate (82 percent) or graduate (13
percent) teacher education program, as shown in Chart 14.
At the other end of the spectrum, about 4 out of 10 (39 percent) teachers with five or fewer years’
teaching experience in 2011entered teaching through alternative teacher preparation programs.
Chart 14 also illustrates that the trend toward hiring teachers with non-traditional backgrounds
started changing about 20 years ago, which coincidentally, was when alternative routes to traditional
teacher education programs started taking hold across the states as ways to certify and bring individuals
who already had at least a bachelor’s degree into teaching. These data illustrate just how significant
alternate routes have been in altering the composition of the teaching force.
Chart 14
88
78
72
51
50
9
16
20
26
10
1
3
6
15
14
1
1
1
4
11
1
1
1
3
14
1
1
1
0 20 40 60 80 100
Before 1980
1980-89
1990-99
2000-04
2005-10
Percent
Ye
ar B
ega
n F
irst
Te
ach
ing
Po
siti
on
Preparation Route to Teaching by Year Began First Teaching Position
Traditional college campus-based undergraduate teachereducation programTraditional college campus-based graduate teachereducation programAlternative school-basedprogram administered by acollegeAlternative school-basedprogram administered by aschool districtAlternative program but don’t know who it was administered by Not sure
51
50
67
75
82
9
21
21
20
13
15
15
9
2
2
9
9
1
1
1
15
4
2
1
1
1
1
0% 20% 40% 60% 80% 100%
1-5
6-9
10-14
15-24
25+
Ye
ars
of
Exp
eri
en
ce
Route to Teaching by Years of Teaching Experience
Traditional college-basedundergraduate teacher program
Traditional college-basedgraduate teacher program
Alternative school-based programadministered by a college
Alternative school-based programadministered by a school district
Alternative program but don’t know who it was administered by
Not sure

National Center for Education Information Profile of Teachers in the U.S. 2011 | 23
Route to Teaching by Gender
A higher proportion of men than women are entering teaching through alternative routes, as shown
in Chart 15. While men constitute only 16 percent of all public school teachers, one-third of them (32
percent) – compared with 22 percent of women –entered teaching through an alternative route to
traditional college campus-based teacher education route.
Chart 15
Route to Teaching by Race
Non-whites are entering teaching through alternative routes at higher rates than are white teachers,
as shown in Chart 16. While only 18 percent of white teachers entered teaching through alternative
routes, more than half (53 percent) of Hispanic teachers, four out of 10 (39 percent) of Black teachers
and one-fourth (24 percent) of teachers form all other races entered teaching through alternative routes
to college campus-based teacher education programs.
Chart 16
NOTE: These data are self-reported survey data. But, NCEI’s analyses of data supplied by state
departments of education in each of the states over the last several years corroborate the findings.
There are striking differences – as well as surprising similarities – between teachers who enter the
profession through college campus-based programs and alternative routes. Those differences and
similarities will be revealed by the survey data analyzed throughout this report.
48
63
18
15
16
12
8
4
8
6
1
1
0% 20% 40% 60% 80% 100%
Male
Female
Route to Teaching by Gender Traditional college campus-basedundergraduate teacher educationprogramTraditional college campus-basedgraduate teacher education program
Alternative school-based programadministered by a college
Alternative school-based programadministered by a school district
Alternative program but don’t know who it was administered by
Not sure
66
46
37
48
16
15
11
27
18
39
53
24
0% 20% 40% 60% 80% 100%
White
Black
Hispanic
Other
Route to Teaching by Race
Traditional - Undergraduate
Traditional - Graduate
Alternative

24 | Profile of Teachers in the U.S 2011 National Center for Education Information
Rating Teacher Preparation Programs
Teachers are generally satisfied with their preparation programs. About a quarter (24 percent) of all
teachers says their preparation program was “Excellent”. Forty-one percent rated their program as
“Very Good”, and another 24 percent said it was “Good”. Only 1 percent of all teachers rated their
preparation program “Poor” (Chart 17).
Chart 17
Traditional route teachers rated their preparation programs higher than did alternate route teachers,
as shown in Chart 18. Nearly one in five (18 percent) of alternate route teachers, compared with just 9
percent of teachers who entered the profession through college campus-based teacher education
programs, said their preparation programs were just “Okay” or “Poor”.
Teachers with 1-5 years of experience gave their program the highest ratings, with a third (34
percent) saying their program was “Excellent” and 43 percent rating it as “Very Good”. By contrast,
only 1 in 5 (22 percent) teachers with 25 or more years of experience said their preparation program
was “Excellent”, while 35 percent said it was “Very Good”. Fifteen percent of this group said it was
just “Okay” and two percent rated their preparation program “Poor”.
Chart 18
24 41 24 9 1
0% 20% 40% 60% 80% 100%
All Teachers
Teacher Preparation Program Rating Excellent
Very Good
Good
Okay
Poor
24
26
25
34
23
23
20
22
27
27
22
22
22
27
24
27
33
27
41
41
39
43
39
41
44
35
45
41
42
40
40
41
42
44
38
30
24
23
18
15
22
26
27
27
19
21
27
24
23
22
22
20
19
30
9
8
15
6
15
9
8
15
7
10
8
11
13
9
10
8
6
12
1
1
3
2
1
1
1
2
2
1
1
3
2
2
1
3
0% 10% 20% 30% 40% 50% 60% 70% 80% 90% 100%
All
Traditional
Alternative
1-5
6-9
10-14
15-24
25+
20s
30s
40s
50+
Male
Female
White
Black
Hispanic
Other
How Teachers Rate Their Preparation Program, by Sub-groups
Excellent
Very Good
Good
Okay
Poor
Ye
ars
of
Ex
pe
rie
nce
A
ge
Ge
nd
er
Rac
e

National Center for Education Information Profile of Teachers in the U.S. 2011 | 25
Length of Components of Teacher Preparation Program
There is much discussion in the United States now concerning lengthening the clinical experience in
teacher preparation programs. NCEI asked teachers what they thought about the length of their actual
classroom teaching experiences and about the length of the pre-teaching courses required in their
teacher preparation program.
Three-quarters (74 percent) of teachers surveyed said that the length of pre-teaching courses
required by their teacher preparation program was “About right”. Thirteen percent said it was too long,
while 9 percent thought it was too short.
One-third third (33 percent) of all teachers said that the classroom teaching component of their
teacher preparation program was too short, 61 percent thought it was about right, and only one percent
said it was too long.
Chart 19
Would Teachers Recommend the Preparation Program They Went Through?
Nearly 9 out of 10 teachers (88 percent) say they would recommend the teacher preparation
program they went through to others interested in becoming teachers.
Chart 20
The teachers most likely to recommend their preparation programs are those with 5 of fewer years
of experience, at 92 percent. Meanwhile, the people least likely to recommend the preparation program
they went through to others are those with 25 or more years of experience, at 80 percent (Chart 21).
This might be interpreted as an indication preparation programs are getting better or it could mean
experience rules out in the end and preparation program is a distant memory.
Traditional route teachers seem to recommend their programs more than alternate route teachers.
Eighty-nine percent of teachers prepared through traditional college campus-based teacher education
programs, compared with 86 percent of those who entered the profession through alternative routes,
said they would recommend the program they went through to others interested in becoming teachers.
(This is a statistical dead heat.)
9
33
13
1
74
61
4
4
0% 20% 40% 60% 80% 100%
Pre-teaching Courses required
Classroom Teaching Experience
Length of Components of Teacher Preparation Program
Too short
Too long
About right
Not applicable
88%
12%
Would you recommend the preparation program you went through to others?
Yes
No

26 | Profile of Teachers in the U.S 2011 National Center for Education Information
Chart 21
Type of Teacher Preparation Program, by Type of Community
There is no significant difference in the ways individuals enter teaching in the various types of
communities they teach in. Nor are there any significant differences in the ways teachers in different
communities perceive their preparation programs (Charts 22 – 26).
Chart 22
88
89
86
92
87
91
89
80
91
91
90
84
86
89
89
88
89
91
75 80 85 90 95 100
All
Traditional
Alternative
1-5
6-9
10-14
15-24
25+
20s
30s
40s
50+
Male
Female
White
Black
Hispanic
Other
Percent
Would Recommend Preparation Program to Others, by Sub-groups
Ye
ars
of
Ex
pe
rie
nce
A
ge
Ge
nd
er
Rac
e
65
64
60
62
17
18
19
19
8
7
9
8
4
4
5
4
6
7
7
7
1
1
1
0% 20% 40% 60% 80% 100%
Rural
Town
City
Suburb
Type of Teacher Preparation Program, by Type of Community
Traditional college campus-basedundergraduate teacher educationprogramTraditional college campus-basedgraduate teacher educationprogramAlternative school-based programadministered by a college
Alternative school-based programadministered by a school district
Alternative program but don’t know who it was administered by
Not sure

National Center for Education Information Profile of Teachers in the U.S. 2011 | 27
Chart 23
Chart 24
Chart 25
Chart 26
24
24
25
25
42
42
42
41
23
23
21
22
9
9
11
10
2
2
2
2
0% 20% 40% 60% 80% 100%
Rural
Town
City
Suburb
Teacher Preparation Program Ratings, by Type of Community
Excellent
Very Good
Good
Okay
Poor
9
9
8
9
13
13
13
13
75
75
75
73
3
3
4
4
0% 20% 40% 60% 80% 100%
Rural
Town
City
Suburb
Length of Pre-Teaching Courses Required, by Type of Community
Too short
Too long
About right
Not applicable
34
35
32
33
1
2
2
1
60
58
60
60
5
5
6
5
0% 20% 40% 60% 80% 100%
Rural
Town
City
Suburb
Length of Classroom Teaching Experiences, by Type of Community
Too short
Too long
About right
Not applicable
90 89 88 89
50
60
70
80
90
100
RuralTownCitySuburb
Pe
rce
nt
Would Recommend Preparation Program, by Type of Community
28 | Profile of Teachers in the U.S 2011 National Center for Education Information
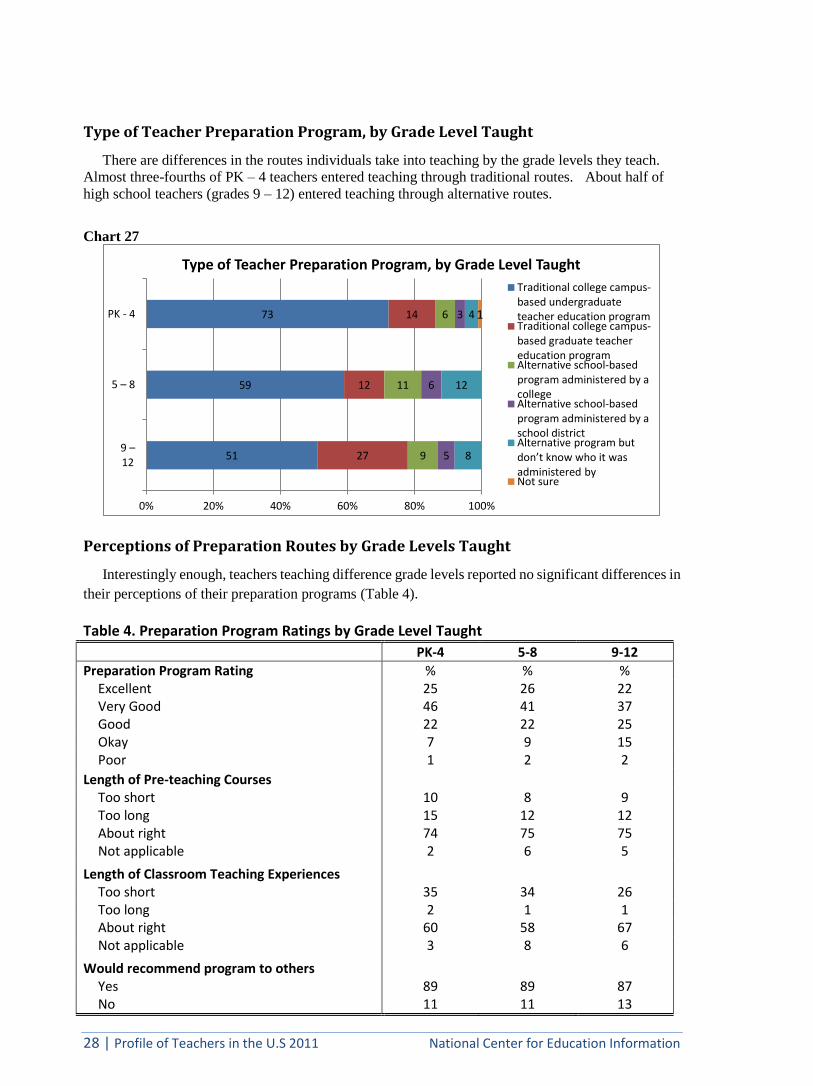
Type of Teacher Preparation Program, by Grade Level Taught
There are differences in the routes individuals take into teaching by the grade levels they teach.
Almost three-fourths of PK – 4 teachers entered teaching through traditional routes. About half of
high school teachers (grades 9 – 12) entered teaching through alternative routes.
Chart 27
Perceptions of Preparation Routes by Grade Levels Taught
Interestingly enough, teachers teaching difference grade levels reported no significant differences in
their perceptions of their preparation programs (Table 4).
Table 4. Preparation Program Ratings by Grade Level Taught
PK-4 5-8 9-12
Preparation Program Rating % % % Excellent 25 26 22 Very Good 46 41 37 Good 22 22 25 Okay 7 9 15 Poor 1 2 2
Length of Pre-teaching Courses
Too short 10 8 9 Too long 15 12 12 About right 74 75 75 Not applicable 2 6 5
Length of Classroom Teaching Experiences Too short 35 34 26 Too long 2 1 1 About right 60 58 67 Not applicable 3 8 6
Would recommend program to others Yes 89 89 87 No 11 11 13
73
59
51
14
12
27
6
11
9
3
6
5
4
12
8
1
0% 20% 40% 60% 80% 100%
PK - 4
5 – 8
9 – 12
Type of Teacher Preparation Program, by Grade Level Taught
Traditional college campus-based undergraduateteacher education programTraditional college campus-based graduate teachereducation programAlternative school-basedprogram administered by acollegeAlternative school-basedprogram administered by aschool districtAlternative program but don’t know who it was administered by Not sure

National Center for Education Information Profile of Teachers in the U.S. 2011 | 29
TEACHER PREPARATION
Highest Academic Degree Held
In order to teach in public K-12 schools in the United States, one has to have earned at least a
bachelor’s degree and hold a teaching certificate in the state in which one is teaching. In 2011, more
than half (55 percent) of teachers held a Master’s degree, one percent held a doctorate and 44 percent
held a Bachelor’s degree as the highest degree earned.
By route to teaching, there are dramatic differences in highest degree held by teachers, as shown in
Chart 28. For teachers who entered the profession through a traditional college-based route, 46
percent hold a master’s in education as their highest degree and 37 percent hold a bachelor’s degree in
education.
On the other hand, for teachers who entered through alternative routes, 61 percent of alternate route
teachers hold as their highest academic degree a bachelor’s degree in a field other than education and
19 percent have master’s degrees in non-education fields (Chart 28).
Chart 28
The 2005 survey of teachers who entered through alternative routes to teacher certification
conducted by NCEI showed that 57 percent of those teachers held a bachelor’s degree in a field other
than education and 18 percent of them held as their highest degree a master’s degree in a non-education
field (PROFILE OF ALTERNATE ROUTE TEACHERS 2005).
37
3
7
61
46
14
10
19
1
1 1
0% 20% 40% 60% 80% 100%
Traditional
Alternative
Highest Degree Held, by Preparation Route
Bachelor’s - Education
Bachelor’s - Other
Master’s - Education
Master’s - Other
Doctorate - Education
Other Advanced Degree

30 | Profile of Teachers in the U.S 2011 National Center for Education Information
Effectiveness of Aspects of Teacher Preparation Programs
NCEI teacher survey respondents in 2011 were asked to rate the effectiveness of 15 aspects of their
teacher preparation programs. Their responses, ranked by “Very effective” are shown in Chart 29 for
all teachers, and in Chart 30 for teachers who entered teaching through a traditional college
campus-based teacher education program and teachers who entered the profession through alternative
routes.
“Discussions with fellow teachers” was seen as most effective in preparing teachers to be effective
teachers, followed by “actual teaching part of the program”.
Chart 29
75
66
50
46
44
37
36
34
31
27
25
25
20
16
14
0 20 40 60 80
Discussions with fellow teachers
Actual teaching part of the program
Practical experiences of instructors
Assistance provided by mentors at the school
Working with other school district staff
Assistance provided by instructors
Knowledge and backgrounds of instructors
Education courses taken after beginning teaching
Learning materials provided by instructors
Lectures/learning sessions with experts inparticular areas of teaching
Education courses before teaching in theprogram
On-going assessments of my progress in theprogram
Group study seminars/meetings
Working with college faculty in the school whereI was teaching
Keeping portfolios, journals
Percent
Aspects of Teacher Preparation Program Rated "Very Effective" - All Teachers

National Center for Education Information Profile of Teachers in the U.S. 2011 | 31
Chart 30
75
71
50
48
43
38
36
35
31
27
27
26
19
17
14
73
48
56
50
43
42
44
32
39
30
34
34
22
17
21
0 20 40 60 80
Discussions with fellow teachers
Actual teaching part of the program
Practical experiences of instructors
Assistance provided by mentors at the school
Working with other school district staff
Assistance provided by instructors
Knowledge and backgrounds of instructors
Education courses taken after beginningteaching
Learning materials provided by instructors
Education courses before teachingin theprogram
Lectures/learning sessions with experts inparticular areas of teaching
On-going assessments of my progress in theprogram
Group study seminars/meetings
Working with college faculty in the schoolwhere I was teaching
Keeping portfolios, journals
Percent
Aspects of Teacher Preparation Program Rated "Very Effective", by Route to Teaching
Traditional
Alternative
32 | Profile of Teachers in the U.S 2011 National Center for Education Information
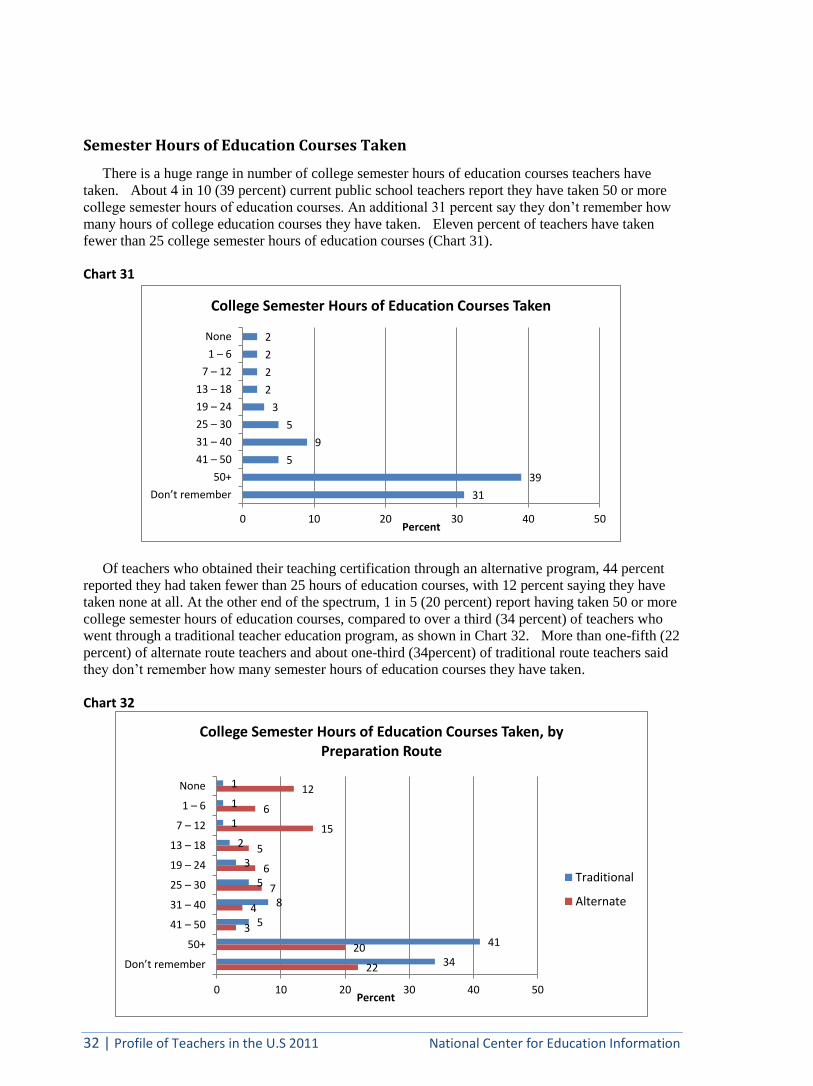
Semester Hours of Education Courses Taken
There is a huge range in number of college semester hours of education courses teachers have
taken. About 4 in 10 (39 percent) current public school teachers report they have taken 50 or more
college semester hours of education courses. An additional 31 percent say they don’t remember how
many hours of college education courses they have taken. Eleven percent of teachers have taken
fewer than 25 college semester hours of education courses (Chart 31).
Chart 31
Of teachers who obtained their teaching certification through an alternative program, 44 percent
reported they had taken fewer than 25 hours of education courses, with 12 percent saying they have
taken none at all. At the other end of the spectrum, 1 in 5 (20 percent) report having taken 50 or more
college semester hours of education courses, compared to over a third (34 percent) of teachers who
went through a traditional teacher education program, as shown in Chart 32. More than one-fifth (22
percent) of alternate route teachers and about one-third (34percent) of traditional route teachers said
they don’t remember how many semester hours of education courses they have taken.
Chart 32
2
2
2
2
3
5
9
5
39
31
0 10 20 30 40 50
None
1 – 6
7 – 12
13 – 18
19 – 24
25 – 30
31 – 40
41 – 50
50+
Don’t remember
Percent
College Semester Hours of Education Courses Taken
1
1
1
2
3
5
8
5
41
34
12
6
15
5
6
7
4
3
20
22
0 10 20 30 40 50
None
1 – 6
7 – 12
13 – 18
19 – 24
25 – 30
31 – 40
41 – 50
50+
Don’t remember
Percent
College Semester Hours of Education Courses Taken, by Preparation Route
Traditional
Alternate

National Center for Education Information Profile of Teachers in the U.S. 2011 | 33
Perceived competence to teach
Teachers surveyed were asked to rate how competent they felt they were when they first began
teaching and how competent they think they are now in eight areas of teaching.
Of teachers surveyed in 2011, virtually all feel competent in their ability to teach the subject matter.
More than nine out of ten (93 percent) teachers now feel “very competent” to teach the subjects they
teach – up from 44 percent of teachers who felt “very competent” to teach the subject matter when they
first began teaching.
Generally, when they began teaching, about one-fourth to nearly half of teachers reported feeling
“very competent” in all eight of the areas of teaching surveyed: ability to teach subject matter (44
percent), ability to motivate students (39 percent), dealing with fellow teachers (44 percent), organizing
instruction (35 percent), managing time (26 percent), dealing with the administrative hierarchy (32
percent), classroom management (27 percent) and classroom discipline (25 percent).
How “very competent” teachers feel now in these areas ranged from 73 percent in dealing
with the administrative hierarchy to 93 percent in ability to teach subject matter in 2011
(Chart 33).
Chart 33
While feelings of incompetence all but disappear from when teachers first began teaching
to now, it is noteworthy that 9 to 28 percent of them felt incompetent to deal with these
aspects of the profession when they first began teaching:
Classroom discipline – 24 percent “not very competent” and 4 percent “not at all competent”
Classroom management – 22 percent “not very competent” and 3 percent “not at all
competent”
Time management – 19 percent “not very competent” and 2 percent “not at all competent”
Deal with administrative hierarchy – 18 percent “not very competent” and 5 percent “not at all
competent”
Organizing instruction – 14 percent “not very competent” and 2 percent “not at all competent”
Ability to motivate students – 11 percent “not very competent” and 1 percent “not at all
competent”
Deal with fellow teachers – 10 percent “not very competent” and 2 percent “not at all
competent”
Ability to teach subject matter -- 8 percent “not very competent” and 1 percent “not at all
competent”
44
35
27
44
39
25
26
32
93
85
84
84
78
78
77
73
0 20 40 60 80 100
Ability to teach the subject matter
Organizing instruction
Classroom management
Dealing with fellow teachers
Ability to motivate students
Classroom discipline
Ability to manage time
Dealing with administrative hierarchy
Percent
Areas of Teaching Perceived "Very Competent" to Teach
WhenBeganTeaching
Now

34 | Profile of Teachers in the U.S 2011 National Center for Education Information
Table 5. Rating Competencies When Began Teaching and Now
When Began Teaching Now
% % Ability to teach subject matter
Very competent 44 93 Somewhat competent 47 7 Not very competent 8 0 Not at all competent 1 0 Not sure 0 0
Ability to motivate students Very competent 39 78 Somewhat competent 48 20 Not very competent 11 1 Not at all competent 1 0 Not sure 0 0
Ability to manage time Very competent 26 77 Somewhat competent 53 22 Not very competent 19 1 Not at all competent 2 0 Not sure 0 0
Classroom management Very competent 27 84 Somewhat competent 49 15 Not very competent 22 1 Not at all competent 3 0 Not sure 0 0
Classroom discipline Very competent 25 78 Somewhat competent 48 21 Not very competent 24 1 Not at all competent 4 0 Not sure 0 0
Organizing instruction Very competent 35 85 Somewhat competent 49 15 Not very competent 14 0 Not at all competent 2 0 Not sure 0 0
Dealing with fellow teachers Very competent 44 84 Somewhat competent 44 15 Not very competent 10 1 Not at all competent 2 0 Not sure 0 0
Dealing with administrative hierarchy Very competent 32 73 Somewhat competent 45 24 Not very competent 18 2 Not at all competent 5 1 Not sure 1 0
National Center for Education Information Profile of Teachers in the U.S. 2011 | 35
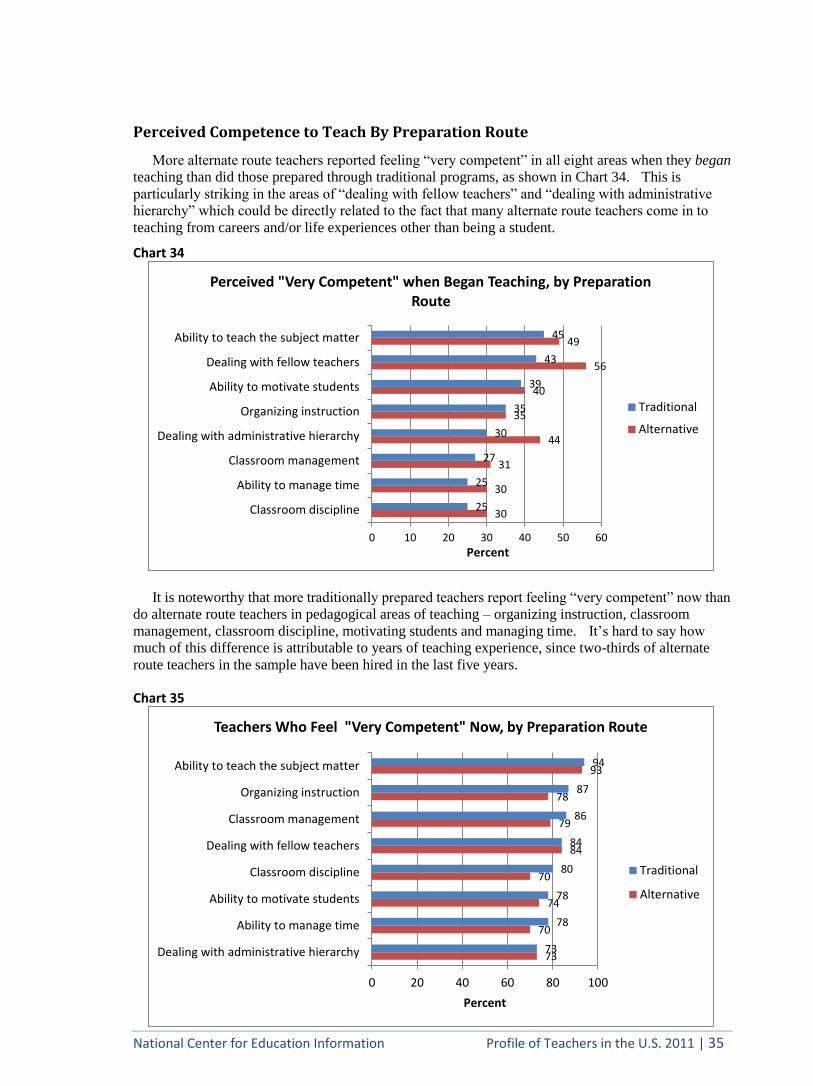
Perceived Competence to Teach By Preparation Route
More alternate route teachers reported feeling “very competent” in all eight areas when they began
teaching than did those prepared through traditional programs, as shown in Chart 34. This is
particularly striking in the areas of “dealing with fellow teachers” and “dealing with administrative
hierarchy” which could be directly related to the fact that many alternate route teachers come in to
teaching from careers and/or life experiences other than being a student.
Chart 34
It is noteworthy that more traditionally prepared teachers report feeling “very competent” now than
do alternate route teachers in pedagogical areas of teaching – organizing instruction, classroom
management, classroom discipline, motivating students and managing time. It’s hard to say how
much of this difference is attributable to years of teaching experience, since two-thirds of alternate
route teachers in the sample have been hired in the last five years.
Chart 35
45
43
39
35
30
27
25
25
49
56
40
35
44
31
30
30
0 10 20 30 40 50 60
Ability to teach the subject matter
Dealing with fellow teachers
Ability to motivate students
Organizing instruction
Dealing with administrative hierarchy
Classroom management
Ability to manage time
Classroom discipline
Percent
Perceived "Very Competent" when Began Teaching, by Preparation Route
Traditional
Alternative
94
87
86
84
80
78
78
73
93
78
79
84
70
74
70
73
0 20 40 60 80 100
Ability to teach the subject matter
Organizing instruction
Classroom management
Dealing with fellow teachers
Classroom discipline
Ability to motivate students
Ability to manage time
Dealing with administrative hierarchy
Percent
Teachers Who Feel "Very Competent" Now, by Preparation Route
Traditional
Alternative

36 | Profile of Teachers in the U.S 2011 National Center for Education Information
Perceived Competence to Teach by Years of Experience
Experience does seem to matter in most aspects of teaching, especially in managing a classroom,
classroom discipline and motivating students, as shown in Chart 36.
Chart 36
89
85
81
76
75
73
72
70
94
79
81
82
69
67
72
73
97
86
91
89
73
81
83
79
94
86
88
92
73
83
80
85
97
84
91
92
71
85
82
89
0 10 20 30 40 50 60 70 80 90 100
Ability to teach the subject matter
Dealing with fellow teachers
Organising instruction
Classroom management
Dealing with administrative hierarchy
Ability to motivate students
Ability to manage time
Classroom discipline
Percent
Perceived "Very Competent" Now, by Years' Experience
1-5 years
6-9 years
10-14 years
15-24 years
25+ years

National Center for Education Information Profile of Teachers in the U.S. 2011 | 37
What’s Most Valuable in Developing Competence to Teach NCEI has asked teachers in its 1996, 2005 and 2011 surveys to rate variables on their value in
developing competence to teach. There has not been much change in teachers’ perceptions of what is
most valuable to them in developing competence to teach over time. One’s own teaching experiences
and working with other teachers/colleagues top the list of variables most valuable in developing
competence to teach, followed by subject-area courses and life experiences in general (Chart 37).
Chart 37
No matter how the data are cut, actual experience teaching and working with other teachers rank
highest, and education courses and college of education faculty rank toward the bottom. See Chart 38
(by preparation route) and Chart 39 (by number of semester hours of education courses taken).
Not surprisingly, alternate route teachers ranked life experiences in general, experiences in a
non-school occupation and studying on one’s own more highly than did traditional route teachers.
Traditional route teachers, on the other hand, ranked clinical experiences, education courses and
education faculty higher. This could be directly related to the kinds of life and preparation
experiences each of these groups had before entering teaching.
Eighty-three percent of all teachers in 2011, compared with 92 percent in 1996 and 91 percent in
2005, said their own teaching experience was “very valuable” in their developing competence to
teach. Eighty-five percent of teachers who were certified through a traditional teacher education
program and 80 percent of those who went through an alternative program consider their own
teaching experience “very valuable” in developing competence to teach.
Clinical and field-based experiences are considered “very valuable” by 83 percent of teachers. 87
percent of traditional route teachers agreed with this assessment, compared with 72 percent of
alternate route teachers.
About three-quarters (76 percent) of the respondents in 2011 rank other teachers and colleagues
“very valuable”. This compares to 72 percent in 1996 and 73 percent in 2005.
83
76
64
64
45
38
35
32
23
22
91
73
66
63
46
40
37
42
26
22
92
72
72
41
37
43
17
0 20 40 60 80 100
One's own teaching experiences
Other teachers/colleagues
Life experiences in general
Courses in subjects being taught
Professional development activities
The faculty in one's subject area major
Education methods courses
Studying on one's own
Experiences in non-school occupation
The college of education faculty
Percent
Rated "Very Valuable" in Developing Competence to Teach by Year
2011
2005
1996

38 | Profile of Teachers in the U.S 2011 National Center for Education Information
Nearly two-thirds (64 percent) of teachers surveyed in 2011 ranked “life experiences in general”
as “very valuable”, compared to 66 percent in 2005. Alternate route teachers considered life
experiences more valuable in developing competence to teach than traditional route teachers, with 72
percent of the former and 63 percent of the latter ranking the variable “very valuable”.
Experience in a non-school occupation was considered very or somewhat valuable by 73 percent of
teachers. Thirty-eight percent of alternate route teachers ranked the variable “very valuable”, compared
to only 21 percent of traditional route teachers.
Table 6. Valuable Criteria in Developing Competence to Teach
Very valuable
Somewhat valuable
Not very valuable
Not at all valuable
Not sure
% % % % %
One's own teaching experiences 83 16 1 0 0
Clinical/field-based experiences 83 15 1 0 1
Other teachers/colleagues 76 22 2 0 0
Life experiences in general 64 33 2 1 0
Courses in subjects being taught 64 32 4 0 0
Professional development activities 45 45 9 1 0
The faculty in one's subject area major 38 46 11 2 4
Education methods courses 35 50 12 2 1
Studying on one's own 32 47 18 2 1
Experiences in non-school occupation 23 50 18 4 5
The college of education faculty 22 53 18 3 4
Chart 38
87
85
77
65
63
46
39
38
31
25
21
72
80
73
63
72
48
30
39
36
18
38
0 20 40 60 80 100
Clinical/field-based experiences
One's own teaching experiences
Other teachers/colleagues
Courses in subjects being taught
Life experiences in general
Professional development activities
Education methods courses
The faculty in one's subject area major
Studying on one's own
The college of education faculty
Experiences in non-school occupation
Percent
Criteria Rated Very Valuable in Developing Competence to Teach by Preparation Route
Traditional
Alternative

National Center for Education Information Profile of Teachers in the U.S. 2011 | 39
Chart 39
21
68
59
39
77
33
70
13
34
31
61
26
70
68
36
66
28
85
11
40
30
66
43
87
72
45
74
32
83
28
41
26
64
31
78
63
30
65
28
87
21
38
25
61
31
90
69
45
83
33
90
24
48
24
76
44
87
65
51
73
36
83
27
40
23
65
0 20 40 60 80 100
Education methods courses
Clinical/field-based experiences
Courses in subjects being taught
Professional development activities
Other teachers/colleagues
Studying on one's own
One's own teaching experiences
The college of education faculty
The faculty in one's subject areamajor
Experiences in non-school occupation
Life experiences in general
Percent
Criteria Rated Very Valuable in Developing Competence to Teach by Number of Semester Hours of Education Courses Taken
≤12
13-24
25-30
31-40
41-50
50+
Number of

40 | Profile of Teachers in the U.S 2011 National Center for Education Information
TEACHERS’ VIEWS ON CURRENT REFORM PROPOSALS
Measurements to Determine Teacher Qualification
Public school teachers are strongly opposed to using “academic progress of students as measured by
standardized test scores” to determine whether or not a teacher is qualified to teach. Only 6 percent of
public school teachers surveyed “strongly agree” that this would be a good measure to use; 42 percent
“somewhat agree” that it would be a good measurement to use. About one-quarter (27 percent)
“somewhat disagree” that it would, and another quarter (25 percent) of public school teachers “strongly
disagree” that standardized test scores of students would be a good measurement to use in determining
whether or not a teacher is qualified to teach (Charts 41 and 42).
About nine out of ten (91 percent) of teachers agree that “successful completion of a teacher
preparation program” and that “evaluation by an administrator that includes direct classroom
observation” would be good measurements to use in determining teacher qualification. Following
closely behind were “being fully certified by the state” (87 percent), “level of education” (82 percent),
and “evaluation by peers that includes direct classroom observation” (81 percent). “Passing a test of
subject matter proficiency” is seen as a better measurement of qualification (78 percent) than “passing
a test of teaching skills proficiency” (69 percent).
Chart 41
Chart 42
52
49
50
27
39
29
33
20
6
39
42
37
55
42
49
42
49
42
0 20 40 60 80 100
Completion of a teacher preparation program
Evaluation by administrator with classroom observation
Being fully certified by the state to teach
Level of education
Evaluation by peers with classroom observation
Passing a test of subject matter proficiency
Experience—length of time as a teacher in K-12
Passing a test of teaching skills proficiency
Standardized test scores of students
Percent
Teacher-approved Criteria to Determine Teacher Qualification
StronglyAgree
SomewhatAgree
25
7
8
6
3
6
3
1
2
27
22
18
15
15
12
10
7
6
0 10 20 30 40 50 60
Standardized test scores of students
Passing a test of teaching skills proficiency
Experience—length of time as a teacher in K-12
Passing a test of subject matter proficiency
Level of education
Evaluation by peers with classroom observation
Being fully certified by the state to teach
Completion of a teacher preparation program
Evaluation by administrator with classroom observation
Percent
Teacher-disputed Criteria to Determine Teacher Qualification
StronglyDisagree
SomewhatDisagree
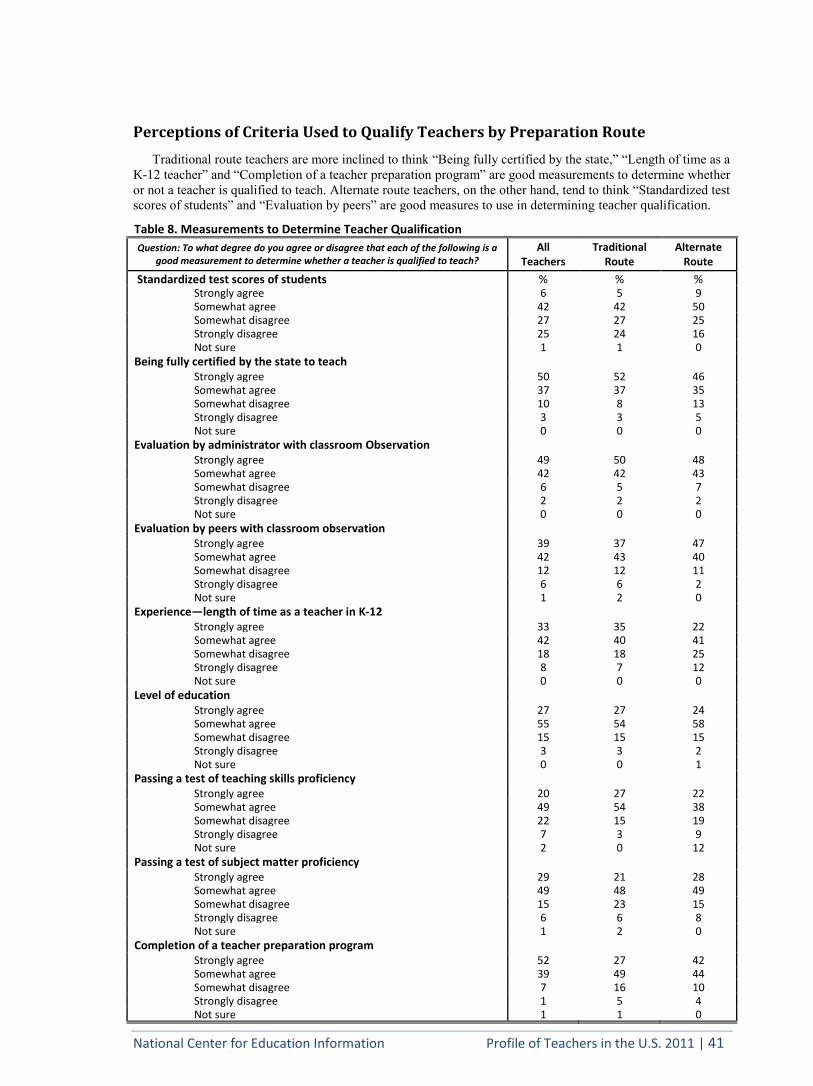
National Center for Education Information Profile of Teachers in the U.S. 2011 | 41
Perceptions of Criteria Used to Qualify Teachers by Preparation Route
Traditional route teachers are more inclined to think “Being fully certified by the state,” “Length of time as a
K-12 teacher” and “Completion of a teacher preparation program” are good measurements to determine whether
or not a teacher is qualified to teach. Alternate route teachers, on the other hand, tend to think “Standardized test
scores of students” and “Evaluation by peers” are good measures to use in determining teacher qualification.
Table 8. Measurements to Determine Teacher Qualification
Question: To what degree do you agree or disagree that each of the following is a good measurement to determine whether a teacher is qualified to teach?
All Teachers
Traditional Route
Alternate Route
Standardized test scores of students %
%
% Strongly agree 6 5 9
Somewhat agree 42 42 50 Somewhat disagree 27 27 25 Strongly disagree 25 24 16 Not sure 1 1 0
Being fully certified by the state to teach Strongly agree 50 52 46 Somewhat agree 37 37 35 Somewhat disagree 10 8 13 Strongly disagree 3 3 5 Not sure 0 0 0
Evaluation by administrator with classroom Observation Strongly agree 49 50 48 Somewhat agree 42 42 43 Somewhat disagree 6 5 7 Strongly disagree 2 2 2 Not sure 0 0 0
Evaluation by peers with classroom observation Strongly agree 39 37 47 Somewhat agree 42 43 40 Somewhat disagree 12 12 11 Strongly disagree 6 6 2 Not sure 1 2 0
Experience—length of time as a teacher in K-12 Strongly agree 33 35 22 Somewhat agree 42 40 41 Somewhat disagree 18 18 25 Strongly disagree 8 7 12 Not sure 0 0 0
Level of education Strongly agree 27 27 24 Somewhat agree 55 54 58 Somewhat disagree 15 15 15 Strongly disagree 3 3 2 Not sure 0 0 1
Passing a test of teaching skills proficiency Strongly agree 20 27 22 Somewhat agree 49 54 38 Somewhat disagree 22 15 19 Strongly disagree 7 3 9 Not sure 2 0 12
Passing a test of subject matter proficiency Strongly agree 29 21 28 Somewhat agree 49 48 49 Somewhat disagree 15 23 15 Strongly disagree 6 6 8 Not sure 1 2 0
Completion of a teacher preparation program Strongly agree 52 27 42 Somewhat agree 39 49 44 Somewhat disagree 7 16 10 Strongly disagree 1 5 4 Not sure 1 1 0

42 | Profile of Teachers in the U.S 2011 National Center for Education Information
What Would Strengthen Teaching as a Profession
NCEI has asked teachers in its surveys since 1990 what they think about various proposed ways to
strengthen teaching as a profession. There are noticeable shifts in thinking among teachers on some
current “hot button” issues, such as:
The percent of teachers who agree paying teachers based on job performance would
strengthen teaching as a profession rose from 42 percent in 2005 to 59 percent in 2011.
Agreement on market-driven pay for teachers who teach in high-demand subject areas rose
from 15 percent in 1996 to 30 percent in 2005 to 40 percent in 2011
Giving teachers more autonomy in what and how they teach rose from 72 percent in 2005 to
78 percent in 2011.
While still not a popular notion among teachers, getting rid of tenure for teachers was seen by
one-third of teachers surveyed in 2011 – up from 27 percent in 2005 and 28 percent in 1996
Getting rid of teacher unions is seen by nearly one in five teachers (19 percent) as a way to
strengthen teaching as a profession – a change from 13 percent in 2005 and 15 percent in 1996.
Nearly all (96-98 percent) teachers surveyed in 1990, 1996, 2005 and 2011 agree that greater
participation in decision-making at all levels would make teaching more a profession.
Table 9. Suggestions to Improve the Teaching Profession
Question: To what degree do you agree or disagree that the
following changes would strengthen teaching as a profession?
All Teachers
Agree
2011 2005 1996 1990
% % % %
Pay teachers based on job performance 59 42 N/A N/A Pay teachers based on seniority 65 74 N/A N/A
Pay teachers based on level of education 81 85 N/A N/A
Let the market determine how much teachers get paid, e.g., pay people more for teaching in high-needs schools
50 47 N/A N/A
Let the market determine how much teachers get paid, e.g., pay people more to teach in high demand subject areas such as math and science
40 30 15 21
Have career ladders to afford upward mobility within the ranks of teaching
77 79 70 70
Introduce a national proficiency exam for entry into teaching similar to the Bar Exam for lawyers or the CPA exam for accountants
55 51 65 65
Give individuals more autonomy in determining what and how they teach
78 72 75 84
Give teachers greater participation in decision-making at the district level
97 96 96 97
Give teachers greater participation in decision-making at the school-building level
98 97 96 98
Get rid of tenure for teachers 33 27 28 N/A
Get rid of the teachers’ unions 19 13 15 N/A

National Center for Education Information Profile of Teachers in the U.S. 2011 | 43
Alternative vs. Traditionally Prepared Teachers’ Views on Ways to Improve the
Teaching Profession
Nowhere in the survey were there greater differences between traditionally prepared and
alternatively prepared teachers than on several current suggestions for ways to improve teaching as a
profession.
Alternate route teachers are much more in favor of the following suggested ways to strengthen
teaching as a profession than are their traditionally prepared counterparts, as shown in Chart 43:
Career ladders for upward mobility within the ranks of teaching – 88 percent vs. 75 percent
Performance-based pay – 70 percent vs. 58 percent (Chart 45)
National proficiency exam – 62 vs. 53
Pay more for teaching in high needs schools – 67 vs. 49
Pay more for teaching high demand subjects – 65 vs. 37
Get rid of tenure for teachers – 52 vs. 31 (Chart 46)
Get rid of the teachers’ unions – 27 vs. 19
Traditional and alternate route teachers are equally--and overwhelmingly--in favor of greater levels
of participation at both the school-building level (98-99 percent) and the district level (96-97 percent).
About 4 out of 5 (78-79 percent) in both groups of teachers also agree that giving individuals more
autonomy in determining what and how they teach would strengthen teaching as a profession.
Teacher-favored Ways to Improve the Teaching Profession
Chart 43
98
97
81
78
75
67
58
53
49
37
31
19
99
96
76
79
88
48
70
61
67
65
52
27
0 10 20 30 40 50 60 70 80 90 100
Greater participation at the school-building level
Greater participation at the district level
Pay teachers based on level of education
Give individuals more autonomy
Have career ladders
Pay teachers based on seniority
Pay teachers based on job performance
Introduce a national proficiency exam
Pay more for teaching in high-needs schools
Pay more for teaching high demand subjects
Get rid of tenure for teachers
Get rid of the teachers' unions
Percent
Teacher-favored Ways to Improve the Profession, by Type of Preparation Program
Traditional
Alternative
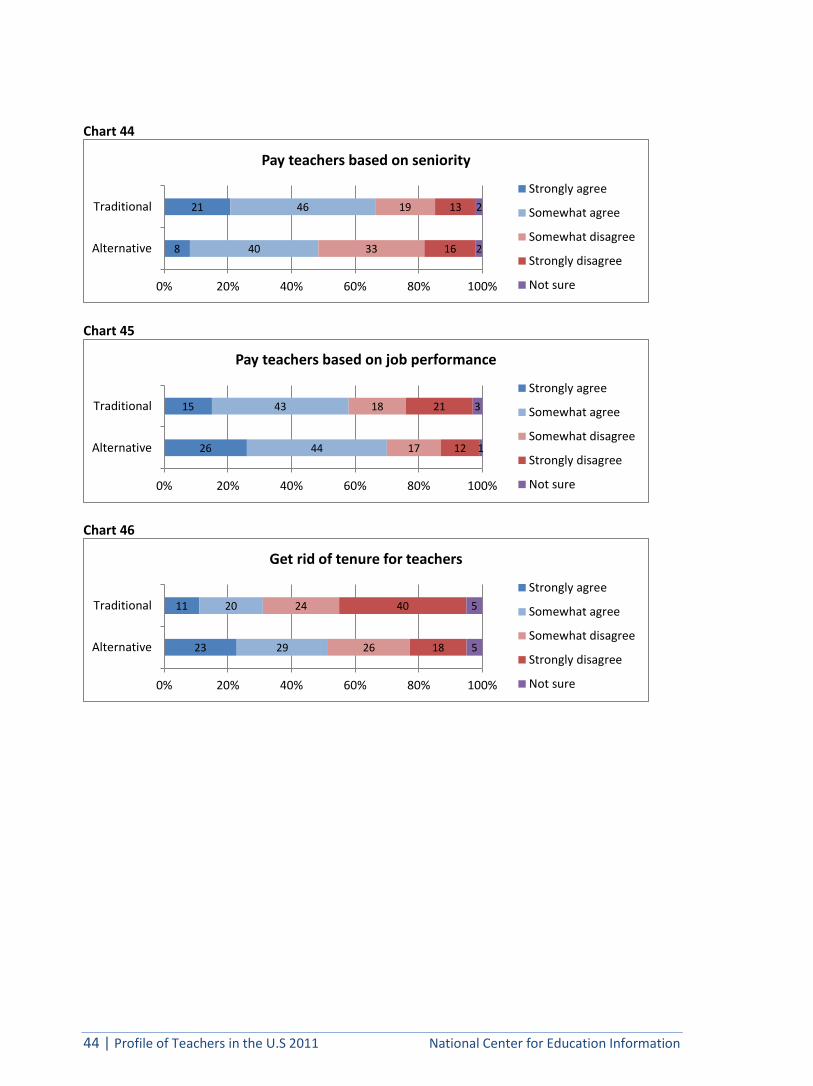
44 | Profile of Teachers in the U.S 2011 National Center for Education Information
Chart 44
Chart 45
Chart 46
21
8
46
40
19
33
13
16
2
2
0% 20% 40% 60% 80% 100%
Traditional
Alternative
Pay teachers based on seniority
Strongly agree
Somewhat agree
Somewhat disagree
Strongly disagree
Not sure
15
26
43
44
18
17
21
12
3
1
0% 20% 40% 60% 80% 100%
Traditional
Alternative
Pay teachers based on job performance
Strongly agree
Somewhat agree
Somewhat disagree
Strongly disagree
Not sure
11
23
20
29
24
26
40
18
5
5
0% 20% 40% 60% 80% 100%
Traditional
Alternative
Get rid of tenure for teachers
Strongly agree
Somewhat agree
Somewhat disagree
Strongly disagree
Not sure

National Center for Education Information Profile of Teachers in the U.S. 2011 | 45
Proposals to Improve America’s Educational System
NCEI asked teachers in 2011 whether or not they favored several proposals currently being
advanced to improve America’s educational system.
The results ranked by favorability are shown in Chart 47.
Nearly nine out of 10 (89 percent) public school teachers are in favor of removing incompetent
teachers regardless of seniority.
However, only about one-third (32 percent) of teachers favors getting rid of tenure for teachers.
Sixty-five percent of teachers favor stricter requirements for high school graduation. However,
when asked about requiring students to pass standardized examinations for promotion from grade to
grade, fewer than half (47 percent) favor this proposal.
Expanding the use of Charter Schools for children in low-performing public schools is favored by
43 percent of teachers.
Half (50 percent) of public school teachers think recruiting individuals from other careers into
teaching would improve America’s educational system.
Half of teachers (50 percent) also believe that recruiting teachers from the top third of all students
would be an improvement. However, only about a quarter (26 percent) thinks that recruiting
individuals from other careers into school administration would improve the educational system.
Teachers’ least favored propositions for improving the education system are contracting private,
for-profit corporations to operate schools (11 percent) and evaluating teachers’ effectiveness primarily
on student achievement (10 percent).
Teacher-favored Ways to Improve Education
Chart 47
89
65
50
50
47
43
32
26
11
10
0 20 40 60 80 100
Remove incompetent teachers regardless of seniority
Stricter requirements for high school graduation
Recruit individuals from other careers into teaching
Recruit teachers from the top third of all students
Require students to pass standardized exams forgrade promotion
Expand the use of Charter Schools for children in low-performing public schools
Get rid of tenure for teachers
Recruit individuals from other careers into schooladministration
Private, for-profit making corporations contracted tooperate schools
Evaluate a teacher’s effectiveness primarily on student achievement
Percent
Teacher-favored Ways to Improve Education

46 | Profile of Teachers in the U.S 2011 National Center for Education Information
Alternate vs. Traditional Prepared Teachers on Education Reform Proposals
Alternate route teachers far and away are more favorable to various proposals to improve America’s
educational system than are traditional route teachers, as shown in Chart 48.
The reform proposal alternate route and traditional routes both overwhelmingly think would
improve America’s educational system is to get rid of incompetent teachers regardless of seniority.
Ninety-two percent of alternate route teachers and 89 percent of traditional route teachers favor
getting rid of incompetent teachers regardless of seniority.
More than half (53 percent) of alternate route teachers think getting rid of tenure for teachers would
improve America’s educational system. This compares with 31 percent of traditional route teachers
who favor getting rid of teacher tenure as a way to improve American education.
Nearly 4 out of 5 (78 percent) alternate route teachers think that recruiting individuals from other
careers into teaching would improve the education system. Of traditional route teachers, less than half
(44 percent) agree. Only 1 in 5 traditional route teachers favor recruiting individuals from other careers
into school administration, while nearly half (48 percent) of alternate route teachers think this would
improve America’s educational system.
Six out of 10 alternate route teachers and 43 percent of traditional route teachers think the education
system would be improved by requiring students to pass standardized exams for grade promotion.
Nearly two thirds (62 percent) of alternate route teachers think that expanding the use of Charter
Schools for children in low-performing public schools would improve America’s education, while only
41 percent of traditional route teachers agree. Only about 1 in 10 traditional route teachers think that
for-profit corporations contracted to operate schools would be an improvement, while about a quarter
(24 percent) of alternate route teachers favors the proposition.
Meanwhile, only one out of ten traditional route teachers and 17 percent of alternative route
teachers believe that evaluating a teacher’s effectiveness primarily on student achievement would
improve American education.
Chart 48
89
64
49
44
43
41
31
21
12
10
92
67
55
78
59
64
52
48
25
17
0 20 40 60 80 100
Remove incompetent teachers regardless of seniority
Stricter requirements for high school graduation
Recruit teachers from the top third of all students
Recruit individuals from other careers into teaching
Require students to pass standardized exams forgrade promotion
Expand the use of Charter Schools for children in low-performing public schools
Get rid of tenure for teachers
Recruit individuals from other careers into schooladministration
Private, for-profit corporations contracted to operateschools
Evaluate a teacher’s effectiveness primarily on student achievement
Percent
Teacher-favored Ways to Improve Education, by Preparation Route
Traditional
Alternative

National Center for Education Information Profile of Teachers in the U.S. 2011 | 47
Percent of Teachers That Favor Reform Proposals, by Years of Teaching
Experience
Newer teachers are clearly more in favour of most current reform proposals for ways to improve
America’s educational system than their more experienced counterparts, as shown in Chart 49
Nearly half (47 percent) of teachers with five or fewer years’ experience favour getting rid of tenure for
teachers, and 16 percent favour evaluating a teacher’s effectiveness primarily on student achievement.
This compares with 8 – 10 percent of teachers with more than five years of experience teaching that
favour evaluating a teacher’s effectiveness primarily on student achievement.
Chart 49
50
71
18
55
54
31
93
47
51
16
44
59
12
52
50
29
90
33
42
8
42
66
15
40
55
23
92
25
50
9
49
62
15
36
50
21
88
31
53
10
41
59
6
33
44
23
83
26
57
8
0 20 40 60 80 100
Require public school students to passstandardized exams for grade promotion
Stricter requirements for high schoolgraduation
Private, for-profit corporations contracted tooperate schools
Expand the use of Charter Schools forchildren in low-performing public schools
Recruit individuals from other careers intoteaching
Recruit individuals from other careers intoschool administration
Remove incompetent teachers regardless ofseniority
Get rid of tenure for teachers
Recruit teachers from the top third of allstudents
Evaluate a teacher’s effectiveness primarily on student achievement
Percent
Percent of Teachers That Favor Reform Proposals, by Years of Teaching Experience
1-5
6-9
10-14
15-24
25+

48 | Profile of Teachers in the U.S 2011 National Center for Education Information
Helpfulness of Support to Teachers
Teachers surveyed report that the support provided to them by mentor teachers and other school
personnel was the most helpful in developing competence to teach (Table 7).
Fifty-five percent of teachers said their mentor teacher was “very helpful” and 20 percent said
“somewhat helpful” in their developing competence to teach. Other school personnel are seen as
helpful by 89 percent of teachers, while the school principal was considered helpful by 67 percent.
Seven percent of teachers report that the school principal was not at all helpful.
College/university personnel were seen as “very helpful” by 17 percent, and “somewhat helpful”
by 47 percent. Only 4 percent of teachers indicate that they were not at all helpful.
Seventeen percent of alternate route teachers said that state agency personnel was “very helpful” or
“somewhat helpful”, compared to 14 percent of traditional route teachers. The greatest disparity
between what traditional and alternate route teachers considered helpful support is for public/private
agency personnel, with 24 percent of alternate route teachers finding them helpful, compared against 7
percent of traditional route teachers. This is very likely due to the fact that most alternate route
programs are run by or at least involve public and/or private agency personnel in their preparation
programs.
Table 7. Helpfulness of support in developing competence to teach
Very
helpful Somewhat
helpful Not very helpful
Not at all helpful
No support provided
% % % % %
Mentor teacher
55 20 8 3 14
Other school personnel
47 42 7 1 3
School principal
26 41 22 7 4
College/university personnel
17 47 24 4 9
Public/Private agency personnel
3 7 12 6 73
State agency personnel
2 13 26 15 44
Chart 40
89
77
67
67
14
7
90
22
59
48
17
24
0 20 40 60 80 100
Other school personnel
Mentor teacher
School principal
College/university personnel
State agency personnel
Public/Private agency personnel
Percent
Support Rated Very or Somewhat Helpful, by Preparation Route
Traditional
Alternative

National Center for Education Information Profile of Teachers in the U.S. 2011 | 49
SATISFACTION
With few exceptions over the last two decades, teacher satisfaction across 10 satisfaction variables
has remained remarkably similar (Table 10).
Teachers surveyed in 2011 are slightly more satisfied with general working conditions and are more
satisfied with the status of teachers in the community than were teachers surveyed in 2005, 1996, 1990
and in 1986. Overall job satisfaction is higher than ever at 89 percent.
Table 10. Teacher Satisfaction with Aspects of Teaching by Year Surveyed
Question: How satisfied are you with the aspects of your teaching career listed below?
Very or Somewhat Satisfied
2011 2005 1996 1990 1986
% % % % %
General working conditions 86 81 71 69 73
Overall job satisfaction 89 83 83 83 84
Present curriculum 81 78 75 74 78
Present textbooks 70 63 58 67 71
Relationships with other teachers 96 94 93 93 95
Relationship with principal 84 85 79 80 83
Relationships with students 97 95 93 N/A N/A
Relationships with parents of students 92 84 84 83 85
Tests of student achievement 62 44 N/A N/A N/A
Salary 55 46 50 45 45
Status of teachers in this community 60 50 41 42 46
Professional development opportunities 72 N/A N/A N/A N/A
Quality of professional development received 69 N/A N/A N/A N/A
Current Teacher Satisfaction
Public school teachers are generally satisfied with most aspects of their jobs. They are most
satisfied with their relationships with students (97 percent) and with other teachers (96 percent);
however, their relationship with their principal fares less well -- with 16 percent expressing
dissatisfaction with their principals (Chart 50).
Teachers are least satisfied with their salary (55 percent), with the status of teachers in their
community (60 percent) and with tests of student achievement (62 percent).

50 | Profile of Teachers in the U.S 2011 National Center for Education Information
Chart 50
Teacher Satisfaction Across Sub-groups
With one notable exception, there is not much difference in satisfaction levels of teachers on any
aspect of teaching across any of the sub-groups, as shown in Appendix A.
Teachers who’ve been teaching for fewer than 15 years are more dissatisfied with current textbooks
than teachers who have more than 15 years’ experience. One can’t help but think this is directly related
to the creation of the Internet in the last 15 years and the rapidity of changing information and its
accessibility through means other than textbooks.
45
49
33
24
68
54
77
51
16
12
17
26
22
41
40
48
46
28
30
20
41
46
43
43
46
47
12
9
16
20
3
9
2
7
23
28
25
21
22
3
2
3
9
1
7
2
14
17
13
7
8
2
1
1
1
0% 20% 40% 60% 80% 100%
General working conditions
Overall job satisfaction
Present curriculum
Present textbooks
Relationships with other teachers
Relationship with principal
Relationships with students
Relationships with parents of students
Tests of student achievement
Salary
Status of teachers in this community
Professional development opportunities
Quality of professional developmentreceived
Teacher Satisfaction with Aspects of Teaching
Verysatisfied
Somewhatsatisfied
Somewhatdissatisfied
Verydissatisfied
Not sure

National Center for Education Information Profile of Teachers in the U.S. 2011 | 51
COMMENTS
Almost all the comments written in by numerous survey respondents were expressions of strong
opposition to the current emphasis on student testing and dissatisfaction with school administrators.
Here are some representative comments from public school teacher survey respondents:
I feel I am being forced to teach to the "state achievement test" and I
HATE IT! I used to LOVE teaching until the administration started
telling us what exactly to do making us teach the way they want us to.
I’ve taught 40 years - after 25 years, no fun -- no longer able to do fun
projects and grade level subjects
My biggest complaint is enormous emphasis on test scores. I believe
NCLB is a joke and a way to privatize public education.
Teachers need more time to teach and less time training for and
taking tests!
I do not think standardized tests and teacher exams reflect good
teaching….
Sometimes the best teachers are the ones who don't have the upper
education; they don't teach to meet ALL the demands everyone keeps
stacking up, but (are) those who usually teach, LOVE the kids and
make learning fun and interesting!
Administrators block the teachers from improving, and in the long
run, affect the students. Our inflexible administrators want to get
positively noticed, but have no clue of their negative approach.
Unless systems (are) developed that will truly have learning of
students in mind there will be inaccurate results of assessments.
The same applies to assessing effectiveness of teachers.

52 | Profile of Teachers in the U.S 2011 National Center for Education Information
TEACHER DEMAND AND MOBILITY
About one-fourth (23 percent) of public school teachers surveyed teach in rural areas. Another
quarter (26 percent) teach in suburban areas, while one in five (20 percent) teach in towns. About a
third (31 percent) of all teachers surveyed teaches in cities (Table 11).
By preparation route to teaching, 39 percent of teachers entering through alternate routes
to teacher certification teach in cities. Teachers entering the profession through alternate routes
are more inclined to teach in cities because the programs through which they obtain their certification
to teach target these areas of need.
Table 11. Communities Teachers Teach and are Willing to Teach in by Preparation Route
Question: What type of community do you/would you be willing to teach in?
Currently Teach in Willing to Teach in
Traditional Alternate
Route Traditional
Alternate Route
% % % %
Rural 23 17 76 69
Town 20 20 85 78
City 31 39 63 70
Suburb 27 24 80 77
NCEI asked teachers if they would be willing to teach in different types of communities.
Relatively high proportions of teachers say they are willing to teach in all types of communities, with
cities being the least favored among traditional route teachers (Chart 51).
Where Teachers Are Willing to Teach
Chart 51
85
80
76
63
78
77
69
70
0 20 40 60 80 100
Town
Suburb
Rural
City
Percent
Willingness to Teach in Community, by Preparation Route
Traditional
Alternate Route

National Center for Education Information Profile of Teachers in the U.S. 2011 | 53
Teacher Relocation Unlikely
NCEI also asked teachers how likely they would be to move from where they currently live to where
the demand for teachers is greatest.
The demand for teachers in the United States is greatest in large inner cities and in outlying rural
areas.
When asked, “How likely would you be to move from where you live to where the demand for
teachers is greatest?” 74 percent of traditional route teachers and two-thirds (66 percent) of alternate
route teachers – say it is somewhat or very unlikely they would move to a large metropolitan city out
of state to meet such a need. They were slightly more inclined to move to a large city in their own
state – 62 percent of traditional route, compared with 50 of alternate route teachers, say it is somewhat
or very unlikely they would move to a large metropolitan city within the state if the demand for
teachers was great (Chart 52).
Teachers gave similar responses to the likelihood they would move to rural communities within
or out of state to meet the demand for teachers. (See Chart 52 below and Table 12), though
alternate route teachers were less inclined to move to rural areas than were traditional route
teachers.
Chart 52
Teachers are somewhat more inclined to move within the state to teach where the demand for jobs is
greatest than they are to move out of state. Forty-two percent say that it is very likely or somewhat
likely that they would move to a rural area within the state if demand for teachers were great, while only
23 percent say they’d be likely to move to a rural area out of state; 34 percent say it is very likely or
somewhat likely that they would move to a large metropolitan area within the state to meet the demand
for teachers, compared to only 20 percent for an out-of-state metropolitan area (Table 12).
Thirty-one percent indicate they would be very or somewhat likely to move to a metropolitan area
out of state and 22 percent say they would be very or somewhat likely to move to a rural area out of
state if the demand for teachers warranted such a move.
51
62
69
74
55
50
72
66
0 20 40 60 80 100
To a rural area within the state
To a large metropolitan city within thestate
To a rural area out of state
To a large metropolitan city out of state
Percent
Very or Somewhat Unlikely to Move Despite Demand
Traditional
Alternate Route

54 | Profile of Teachers in the U.S 2011 National Center for Education Information
Table 12. Likelihood to Move to Meet the Demand for Teachers
All Teachers
Traditional Route
Alternate Route
Rural area within the state % % %
Very likely 17 16 17
Somewhat likely 25 28 24
Somewhat unlikely 17 16 21
Very unlikely 37 35 34
Not sure 5 5 5
Large metropolitan city within the state
Very likely 11 11 18
Somewhat likely 23 22 26
Somewhat unlikely 16 17 17
Very unlikely 45 45 33
Not sure 5 5 6
Rural area out of state
Very likely 7 7 8
Somewhat likely 16 17 15
Somewhat unlikely 15 13 19
Very unlikely 57 56 53
Not sure 6 6 4
Large metropolitan city out of state
Very likely 6 6 12
Somewhat likely 14 13 17
Somewhat unlikely 15 14 19
Very unlikely 60 60 47
Not sure 6 6 5

National Center for Education Information Profile of Teachers in the U.S. 2011 | 55
Proximity Between Birthplace and College Education Site
Teaching has historically been a rather provincial occupation. Individuals who became teachers
tended to get their college education and teaching jobs very close to home.
In the 2011 NCEI survey, six out of 10 (60 percent) public school teachers who went through
traditional teacher education programs got their undergraduate college education within 150 miles of
where they were born. About 4 out of 10 (42 percent) individuals entering teaching through alternate
routes completed their undergraduate college education within 150 miles of where they were born
(Chart 53).
Chart 53
Proximity Between Birthplace and Teaching Site
Teachers’ answers reflected a similar pattern when asked about current teaching sites, with 57
percent of traditional route teachers and 37 percent of alternate route teachers working within 150 miles
of the place where they were born (Chart 54).
Chart 54
60
42
40
58
0% 20% 40% 60% 80% 100%
Traditional
Alternate Route
Question: Did you complete your undergraduate college education within 150 miles of the place where you were born?
Yes
No
57
37
43
63
0% 20% 40% 60% 80% 100%
Traditional
Alternate Route
Question: Are you now teaching within 150 miles of the place where you were born?
Yes
No

56 | Profile of Teachers in the U.S 2011 National Center for Education Information
PLANS FIVE YEARS FROM NOW
What Teachers Expect to Be Doing Five Years from Now
Two thirds (67 percent) of current public school teachers expect to be teaching in K-12 schools
five years from now. Of the current teaching force, 15 percent expect to be in an education job other
than K-12 teaching. Only 5 percent expect to be employed in a non-education-related job (Chart
55).
Chart 55
Thirteen percent of current public school teachers expect to be retired five years from now. This
compares to 22 percent of teachers surveyed in 2005 who said they expected to be retired five years
hence. This is directly related to the fact that in 2005, more than 4 out of 10 (42 percent) surveyed
were 50 years of age or older, whereas, in 2011, the proportion of teachers 50 and older is under a
third (31 percent). Since 2005, a significant proportion of older teachers have already left the
profession. At the other end of the spectrum, the proportion of teachers in their 20s nearly doubled
from 11 percent in 2005 to 21 percent in 2011.
Chart 56
67
15
13
7
5
4
0 10 20 30 40 50 60 70 80
Teaching K-12
Non-teaching education job
Retired
Teaching postsecondary
Employed in an occupation outside of education
Other
Percent
What Teachers Expect to Be Doing in Five Years
21
11
31
42
0 10 20 30 40 50
2011
2005
Percent
Proportion of Teachers Aged Under 30 and over 50 by year
≤29
50+

National Center for Education Information Profile of Teachers in the U.S. 2011 | 57
Teachers’ Future Plans by Sub-Groups
Four out of 10 (40 percent) of current senior high school (grades 9-12) teachers expect not to be
teaching in K-12 schools in 2016. Twelve percent of them expect to be retired by then (Table 13).
While 70 percent of white teachers and 57 percent of Hispanic teachers expect to be teaching K-12
levels five years from now, less than half (43 percent) of black teachers expect to be teaching K-12.
On the other hand, 29 percent of black teachers expect to be employed in an education job other than
teaching, compared with 14 percent of white teachers and 24 percent of Hispanic teachers.
Two thirds (67-68 percent) of both traditional and alternative route teachers expect to still be
teaching K-12 in five years. However, 16 percent of traditional route teachers say they expect to be
retired compared to only 2 percent of alternate route teachers. Meanwhile, nearly a quarter (23 percent)
of alternate route teachers say they expect to be working in a job in education other than teaching five
years from now, compared to 13 percent of traditional route teachers.
Table 13. Five-year Projection for Teachers
Question: What do you expect to be doing five years from
now?
Teaching K-12
Teaching Post-seco
ndary
Non-Teaching Education Job
Outside Education
Retired Other
% % % % % % All
2011 67 7 15 5 13 4 2005 60 N/A 12 4 22 2
Preparation Route
Traditional 68 5 13 4 16 4 Alternate 67 12 23 7 2 5
Gender
Male 63 8 21 4 12 3 Female 68 6 15 5 13 4
Age
20s 68 6 25 6 0 9 30s 76 8 18 4 0 5 40s 80 8 14 4 3 1 50+ 48 4 6 5 41 0
Race
White 70 5 14 4 13 4 Black 43 19 29 9 12 5 Hispanic 57 7 24 12 8 4 Other 65 12 12 6 15 3
Grade Level Taught
Elementary 73 2 13 3 14 4 Middle School 67 8 20 3 11 5 Senior High 60 14 16 11 12 3
Years of Experience
1-5 75 8 21 5 1 7 6-9 67 11 21 7 1 9 10-19 76 6 15 4 5 2 20-29 57 3 5 3 38 1 30+ 31 3 4 5 66 0
Community
Rural 68 7 14 5 14 3 Town 68 7 15 5 13 4 City 68 8 18 5 11 4 Suburb 69 7 17 4 12 4

58 | Profile of Teachers in the U.S 2011 National Center for Education Information
APPENDIX
Master Tables of Survey Responses by All Teachers Surveyed
and By Preparation Route, Years of Teaching Experience, Age, Gender and Race

National Center for Education Information Profile of Teachers in the U.S. 2011 | 59
A1. Demographic Profile of Teachers by Preparation Route, Years of Experience, Age, Gender and Race
A1. Demographic Profile of Teachers by Preparation Route, Years' Experience, Age, Gender and Race
Traditional Alternative 1-5 6-9 10-14 15-24 25+ 20s 30s 40s 50+ Male Female White Black Hispanic Other
N= 1076 768 252 300 150 148 201 150 196 244 186 256 152 822 768 62 65 33
Age % % % % % % % % % % % % % % % % % %
≤29 21 20 25 55 21 0 0 0 100 0 0 0 16 22 23 10 30 12
30-39 27 26 33 26 54 52 10 1 0 100 0 0 26 28 26 32 38 33
40-49 22 22 24 12 16 30 48 11 0 0 100 0 24 22 21 29 17 27
50+ 31 32 17 8 11 18 42 88 0 0 0 100 34 28 30 30 16 27
Gender
Male 16 13 22 16 16 14 18 12 12 15 17 19 100 0 15 10 22 27
Female 84 87 78 84 84 86 82 88 88 85 83 81 0 100 85 90 78 73
Race
White 84 87 70 78 81 82 88 88 86 78 80 85 81 83 100 0 0 0
Black 7 5 11 5 7 8 6 7 3 7 9 8 4 7 0 100 0 0
Hispanic 6 4 15 13 6 6 4 3 9 10 6 4 9 6 0 0 100 0
Other 4 3 4 3 7 3 3 3 3 4 6 4 6 3 0 0 0 100
Highest Degree Earned
Bachelor’s - Education 29 37 3 41 18 27 25 30 44 28 23 25 17 31 30 21 32 25
Bachelor’s - Other 15 7 61 35 16 9 11 4 24 17 18 11 28 18 17 21 30 22
Master’s - Education 43 46 14 17 45 49 52 50 24 42 43 47 30 40 40 38 19 38
Master’s - Other 12 9 19 7 17 15 10 11 7 12 14 13 23 10 11 12 16 16
Doctorate - Education 1 1 1 0 1 1 1 3 0 1 0 2 1 1 1 5 2 0
Other Advanced Degree 0 0 1 0 2 0 0 0 0 0 1 0 1 0 0 3 2 0
Teaching Experience (years)
1-5 26 23 65 100 0 0 0 0 84 30 14 8 35 35 32 29 58 27
6-9 16 15 20 0 100 0 0 0 16 32 11 6 16 16 16 19 14 30
10-14 16 17 8 0 0 100 0 0 0 30 22 9 14 15 15 20 10 15
15-24 23 26 4 0 0 0 100 0 0 7 46 30 23 19 21 17 13 15
25+ 17 19 3 0 0 0 0 100 0 0 7 47 12 16 16 15 7 12
Grade Level Taught
PK-4 48 53 34 50 50 41 49 55 47 48 45 49 17 53 47 38 52 52
5-8 26 26 44 35 24 26 29 23 28 29 31 26 37 29 30 28 27 18
9-12 27 24 30 19 30 33 25 22 24 24 28 25 51 20 25 33 20 30
Community Teach In
Rural 23 23 17 16 15 19 29 28 19 20 23 27 20 22 24 17 10 15
Town 19 20 20 19 17 20 17 26 14 18 16 22 13 21 20 3 19 15
City 31 31 39 40 36 29 27 26 41 31 33 29 35 32 28 59 56 45
Suburb 26 27 24 25 32 32 26 20 25 31 28 21 31 25 28 20 16 24
Gender RacePreparation RouteAll
Years of Experience Age

60 | Profile of Teachers in the U.S 2011 National Center for Education Information
A2. Routes to and Components of Teacher Preparation Program by Preparation Route, Years of Experience, Age, Gender and Race
A2. Routes to and Components of Teacher Preparation by Preparation Route, Years of Experience, Age, Gender and Race
Traditional Alternative 1-5 6-9 10-14 15-24 25+ 20s 30s 40s 50+ Male Female White Black Hispanic Other
Preparation Program Type % % % % % % % % % % % % % % % % % %
Traditional college-based
undergraduate teacher program65 80 0 51 50 67 75 82 64 58 64 66 48 63 66 46 37 48
Traditional college-based graduate
teacher program18 20 0 9 21 21 20 13 11 17 16 21 18 15 16 15 11 27
Alternative school-based program
administered by a college8 0 54 15 15 9 2 2 7 10 10 7 16 12 10 19 21 12
Alternative school-based program
administered by a school district3 0 18 9 9 1 1 1 5 5 3 3 8 4 3 5 16 3
Alternative program but don’t know
who it was administered by5 0 28 15 4 2 0 1 12 9 5 2 8 6 5 15 16 9
Not sure 1 0 0 1 1 0 0 1 0 1 1 0 1 1 1 0 0 0
Education Courses Taken (credit hours)
None 2 1 12 6 4 1 1 0 8 3 1 2 3 4 3 2 6 3
1 – 6 2 1 6 5 1 1 0 0 3 3 1 0 3 2 2 2 3 3
7 – 12 2 1 15 5 4 0 2 1 5 3 2 2 7 4 4 2 11 0
13 – 18 2 2 5 3 1 1 4 1 3 1 4 2 4 2 2 2 5 3
19 – 24 3 3 6 3 4 1 2 5 3 2 5 2 3 3 3 3 5 6
25 – 30 5 5 7 7 6 6 3 7 7 6 3 7 9 5 6 3 5 3
31 – 40 9 8 4 6 8 11 7 6 9 8 7 8 12 6 7 10 3 9
41 – 50 5 5 3 4 6 4 5 5 4 5 7 4 5 5 5 3 3 0
50+ 39 41 20 31 36 39 39 44 29 41 39 39 31 36 35 42 33 45
Don’t remember 31 34 22 28 30 35 35 31 29 29 32 34 23 33 32 31 25 27
Proportion of Preparation Program
Online
None 77 82 40 52 71 82 94 95 57 71 84 87 63 74 75 68 60 67
1 – 25 percent 18 16 26 37 23 17 6 3 34 24 13 10 23 18 18 20 32 21
26 - 50 percent 2 1 6 5 4 1 0 1 4 3 1 1 5 2 2 5 3 6
51 – 75 percent 1 1 2 2 1 1 0 1 2 0 1 1 1 1 1 0 2 3
76 – 99 percent 0 0 6 4 1 0 0 0 2 0 0 0 1 1 1 0 2 0
100 percent 1 1 20 0 0 0 0 0 2 1 1 1 5 4 4 7 2 3
RacePreparation RouteAll
Years of Experience Age Gender

National Center for Education Information Profile of Teachers in the U.S. 2011 | 61
A3. Subje cts Taug ht by Pre parati on Route, Year s of Experie nce , Age, Ge nder a nd Race
A3. Subjects Taught by Preparation Route, Years of Experience, Age, Gender and Race
Traditional Alternative 1-5 6-9 10-14 15-24 25+ 20s 30s 40s 50+ Male Female White Black Hispanic Other
Subjects Taught % % % % % % % % % % % % % % % % % %
General elementary 44 48 29 44 47 41 45 47 44 44 39 45 25 46 43 33 44 48
English/Language arts 22 21 22 20 26 25 20 21 24 22 20 20 20 21 21 27 11 33
Mathematics 17 16 29 30 17 12 12 14 26 17 19 13 24 18 16 23 30 30
Social studies/Social
science 11 10 16 13 13 11 10 7 9 16 13 6 21 10 10 20 9 18
Reading 10 11 9 11 10 13 13 10 11 10 15 6 3 12 9 17 12 12
Kindergarten 9 11 5 7 6 11 13 15 4 10 11 11 0 11 10 5 6 3
General or other science 8 8 13 13 8 7 7 4 9 12 8 5 12 8 8 13 5 18
Special education, general 6 5 11 7 9 8 6 2 6 6 9 5 3 7 7 7 5 9
History 6 5 9 6 6 8 5 3 6 7 9 3 16 4 6 2 3 15
English as a second
language 5 5 6 7 6 4 6 4 6 7 4 4 3 6 5 3 9 9
Biology/Life science 4 4 6 5 2 3 5 5 4 3 4 5 9 3 4 3 6 6
Gifted 4 4 5 4 5 6 5 3 5 5 5 4 5 4 4 5 5 3
Art/Music 4 4 3 3 3 2 6 6 4 2 3 6 4 4 4 2 5 12
Basic skil ls and remedial
education 3 4 0 2 1 3 5 5 2 2 5 4 1 3 3 2 0 9
Physical science 3 3 5 4 3 3 3 3 5 2 4 3 8 2 3 3 2 6
Specific learning
disabilities 3 3 3 3 6 3 3 1 5 2 4 2 1 4 3 3 3 0
Emotionally disturbed 2 3 2 3 3 3 2 1 4 2 2 2 0 3 3 5 2 0
Geology/Earth science/
Space science 2 2 4 4 3 3 1 2 4 2 2 2 3 2 3 2 3 3
Chemistry 2 2 3 2 1 3 4 1 3 0 5 1 6 2 2 3 3 3
Bilingual education 2 1 8 5 3 3 2 2 1 4 4 3 3 3 1 0 30 3
Spanish 2 1 4 2 1 3 1 2 1 3 2 2 1 2 1 2 17 0
Speech/Language
impaired 1 2 1 2 2 2 1 0 3 0 3 0 1 2 1 2 3 0
Physics 1 1 3 2 1 2 1 1 3 0 3 0 5 1 2 0 3 3
Computer science 1 1 2 2 1 1 1 1 2 0 0 1 3 1 1 2 2 6
Physical education/
Health 1 1 2 1 2 1 2 1 1 1 2 1 3 1 1 2 3 3
Dance/Drama/Theater 1 1 2 1 1 1 1 1 1 0 1 1 0 1 0 3 3 0
RaceYears of ExperiencePreparation Route
All
Age Gender

62 | Profile of Teachers in the U.S 2011 National Center for Education Information
A3. Subjects Taught by Preparation Route, Years of Experience, Age, Gender and Race (cont.)
Traditional Alternative 1-5 6-9 10-14 15-24 25+ 20s 30s 40s 50+ Male Female White Black Hispanic Other
Subjects Taught % % % % % % % % % % % % % % % % % %
Orthopedically impaired 1 1 1 1 1 1 1 0 2 0 0 1 1 1 1 0 2 0
Mentally retarded 1 1 1 2 3 1 0 0 2 1 1 0 1 1 1 2 2 0
Journalism 1 1 1 1 1 0 1 0 2 1 1 1 0 1 1 0 0 0
Mildly handicapped 1 1 0 0 1 2 1 0 1 0 1 1 0 1 1 0 0 0
All others 1 1 2 1 1 1 1 1 1 0 1 1 2 1 1 2 5 0
Visually handicapped 0 1 1 1 1 1 0 0 2 0 1 0 1 1 1 2 0 0
American Indian/Native
American studies 0 1 0 0 0 0 1 1 0 0 1 1 0 0 0 2 0 0
Deaf or hard-of-hearing 0 1 0 1 1 1 0 0 2 0 1 0 0 1 1 2 2 0
Other special education 0 1 0 0 1 1 0 1 0 0 1 0 0 0 0 0 2 0
Severely handicapped 0 0 1 0 1 0 0 0 1 0 0 1 1 0 1 0 0 0
Business, marketing 0 0 1 0 1 1 1 0 0 0 1 0 1 0 0 2 2 0
Trade and industry 0 0 0 0 1 0 0 0 0 0 0 1 1 0 0 0 0 0
Other foreign language 0 0 0 0 0 0 0 0 0 0 1 0 1 0 0 0 0 3
Accounting 0 0 0 0 0 0 0 0 0 0 1 0 1 0 0 0 0 0
Technical 0 0 0 1 0 0 0 0 1 0 0 0 1 0 0 0 2 0
Military science 0 0 0 0 0 0 0 0 1 0 0 0 0 0 0 0 0 0
Home Economics 0 0 0 0 1 0 0 0 0 0 0 0 0 0 0 0 0 0
Health occupations 0 0 0 0 0 0 0 1 0 0 1 0 0 0 0 0 0 0
Philosophy/Religion 0 0 0 0 0 1 0 0 0 0 0 0 0 0 0 0 0 0Other vocational or
technical education 0 0 0 0 0 0 0 0 0 0 1 0 0 0 0 0 0 0
Gender Race
All
Preparation Route Years of Experience Age

National Center for Education Information Profile of Teachers in the U.S. 2011 | 63
A4. Rating Teacher Preparation Programs by Preparation Route, Years of Experience, Age, Gender and Race
A5. Effectiveness of Aspects of Teacher Pre paration Pr ogram by Pre paration Route , Years of Experience, Age , Gender a nd Race
A4. Rating Teacher Preparation Programs by Preparation Route, Years of Experience, Age, Gender and Race
TraditionalAlternative 1-5 6-9 10-14 15-24 25+ 20s 30s 40s 50+ Male Female White Black Hispanic Other
Preparation Program Rating % % % % % % % % % % % % % % % % % %
Excellent 24 26 25 34 23 23 20 22 27 27 22 22 22 27 24 27 33 27
Very Good 41 41 39 43 39 41 44 35 45 41 42 40 40 41 42 44 38 30
Good 24 23 18 15 22 26 27 27 19 21 27 24 23 22 22 20 19 30
Okay 9 8 15 6 15 9 8 15 7 10 8 11 13 9 10 8 6 12
Poor 1 1 3 2 1 1 1 2 2 1 1 3 2 2 1 0 3 0
Length of Pre-teaching Courses
Too short 9 9 7 7 8 6 10 17 7 5 9 14 7 9 9 10 6 9
Too long 13 14 7 12 16 11 15 10 16 13 11 13 14 12 13 7 14 12
About right 74 75 72 76 71 79 71 70 73 77 77 69 73 74 74 81 68 67
Not applicable 4 2 14 5 5 4 3 3 4 4 3 4 5 4 3 2 11 12
Length of Classroom Teaching
Experiences
Too short 33 37 27 28 30 36 38 43 24 35 30 40 29 35 36 24 19 36
Too long 1 2 1 2 3 1 1 1 3 1 1 2 1 2 1 0 0 9
About right 61 60 55 63 59 57 60 54 68 57 63 54 63 59 58 74 67 48
Not applicable 4 1 18 8 8 6 1 2 4 6 7 4 7 5 5 2 14 6
Would recommend program to others
Yes 88 89 86 92 87 91 89 80 91 91 90 84 86 89 89 88 89 91
No 12 11 14 8 13 9 11 20 9 9 10 16 14 11 11 12 11 9
All
Preparation Route Years of Experience Age Gender Race

64 | Profile of Teachers in the U.S 2011 National Center for Education Information
A5. Effectiveness of Aspects of Teacher Preparation Program by Preparation Route, Years of Experience, Age, Gender and Race
Traditional Alternative 1-5 6-9 10-14 15-24 25+ 20s 30s 40s 50+ Male Female White Black Hispanic Other
Education courses before
teaching in the program% % % % % % % % % % % % % % % % % %
Very Effective 25 27 29 30 22 30 25 23 22 25 28 25 18 28 23 52 42 30
Somewhat effective 57 58 41 55 52 57 58 51 58 58 57 52 57 53 57 40 37 55
Not very effective 11 12 8 6 16 9 13 18 10 9 10 15 10 11 12 0 6 6
Not at all effective 1 1 1 1 1 0 0 3 1 1 0 2 1 1 1 2 2 0
Not applicable 6 2 22 8 9 5 3 5 10 7 4 5 14 6 6 7 13 9
Actual teaching part of the
program
Very Effective 66 70 49 60 66 69 70 66 64 62 69 66 59 66 66 75 52 61
Somewhat effective 26 25 28 27 26 26 25 27 24 30 24 26 33 25 26 19 27 30
Not very effective 3 2 8 4 3 1 3 3 5 3 2 4 4 3 3 3 6 3
Not at all effective 1 1 2 2 1 0 0 2 1 2 0 1 0 1 1 2 0 0
Not applicable 4 2 13 8 5 4 2 3 6 4 5 4 4 5 4 2 15 6
Education courses taken
after beginning teaching
Very Effective 34 35 31 31 35 37 34 38 27 32 35 38 23 36 33 43 40 21
Somewhat effective 49 49 39 39 50 51 55 46 44 48 52 49 46 47 48 50 39 33
Not very effective 7 6 10 9 7 4 4 9 9 8 7 5 14 6 6 5 8 21
Not at all effective 1 1 1 2 1 0 1 1 2 1 1 1 3 1 1 0 0 3
Not applicable 10 9 19 19 8 8 7 5 18 11 5 8 15 11 11 2 13 21
Group study
seminars/meetings
Very Effective 20 20 22 20 18 23 21 20 15 20 22 22 17 21 18 31 34 21
Somewhat effective 50 50 36 46 49 57 47 47 51 50 51 47 40 49 50 42 44 39
Not very effective 15 16 15 19 20 9 18 9 19 18 14 12 23 14 15 12 16 21
Not at all effective 2 2 3 3 3 1 2 1 2 2 2 3 3 2 2 2 2 6
Not applicable 12 12 24 13 11 9 12 23 13 10 11 15 18 14 15 14 5 12
Gender RacePreparation RouteAll
Years of Experience Age
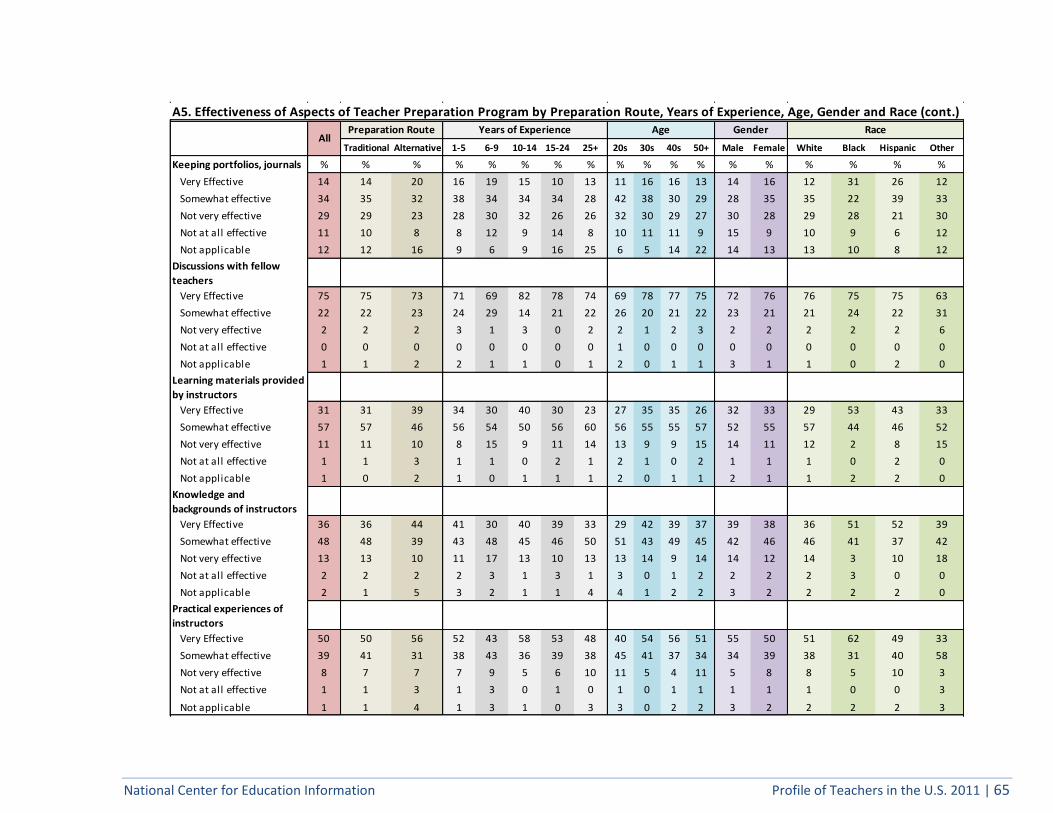
National Center for Education Information Profile of Teachers in the U.S. 2011 | 65
A5. Effectiveness of Aspects of Teacher Preparation Program by Preparation Route, Years of Experience, Age, Gender and Race (cont.)
Traditional Alternative 1-5 6-9 10-14 15-24 25+ 20s 30s 40s 50+ Male Female White Black Hispanic Other
Keeping portfolios, journals % % % % % % % % % % % % % % % % % %
Very Effective 14 14 20 16 19 15 10 13 11 16 16 13 14 16 12 31 26 12
Somewhat effective 34 35 32 38 34 34 34 28 42 38 30 29 28 35 35 22 39 33
Not very effective 29 29 23 28 30 32 26 26 32 30 29 27 30 28 29 28 21 30
Not at all effective 11 10 8 8 12 9 14 8 10 11 11 9 15 9 10 9 6 12
Not applicable 12 12 16 9 6 9 16 25 6 5 14 22 14 13 13 10 8 12
Discussions with fellow
teachers
Very Effective 75 75 73 71 69 82 78 74 69 78 77 75 72 76 76 75 75 63
Somewhat effective 22 22 23 24 29 14 21 22 26 20 21 22 23 21 21 24 22 31
Not very effective 2 2 2 3 1 3 0 2 2 1 2 3 2 2 2 2 2 6
Not at all effective 0 0 0 0 0 0 0 0 1 0 0 0 0 0 0 0 0 0
Not applicable 1 1 2 2 1 1 0 1 2 0 1 1 3 1 1 0 2 0
Learning materials provided
by instructors
Very Effective 31 31 39 34 30 40 30 23 27 35 35 26 32 33 29 53 43 33
Somewhat effective 57 57 46 56 54 50 56 60 56 55 55 57 52 55 57 44 46 52
Not very effective 11 11 10 8 15 9 11 14 13 9 9 15 14 11 12 2 8 15
Not at all effective 1 1 3 1 1 0 2 1 2 1 0 2 1 1 1 0 2 0
Not applicable 1 0 2 1 0 1 1 1 2 0 1 1 2 1 1 2 2 0
Knowledge and
backgrounds of instructors
Very Effective 36 36 44 41 30 40 39 33 29 42 39 37 39 38 36 51 52 39
Somewhat effective 48 48 39 43 48 45 46 50 51 43 49 45 42 46 46 41 37 42
Not very effective 13 13 10 11 17 13 10 13 13 14 9 14 14 12 14 3 10 18
Not at all effective 2 2 2 2 3 1 3 1 3 0 1 2 2 2 2 3 0 0
Not applicable 2 1 5 3 2 1 1 4 4 1 2 2 3 2 2 2 2 0
Practical experiences of
instructors
Very Effective 50 50 56 52 43 58 53 48 40 54 56 51 55 50 51 62 49 33
Somewhat effective 39 41 31 38 43 36 39 38 45 41 37 34 34 39 38 31 40 58
Not very effective 8 7 7 7 9 5 6 10 11 5 4 11 5 8 8 5 10 3
Not at all effective 1 1 3 1 3 0 1 0 1 0 1 1 1 1 1 0 0 3
Not applicable 1 1 4 1 3 1 0 3 3 0 2 2 3 2 2 2 2 3
Gender RaceAll
Preparation Route Years of Experience Age

66 | Profile of Teachers in the U.S 2011 National Center for Education Information
A5. Effectiveness of Aspects of Teacher Preparation Program by Preparation Route, Years of Experience, Age, Gender and Race (cont.)
Traditional Alternative 1-5 6-9 10-14 15-24 25+ 20s 30s 40s 50+ Male Female White Black Hispanic Other
Assistance provided by
instructors% % % % % % % % % % % % % % % % % %
Very Effective 37 38 40 41 32 42 39 35 32 37 40 37 35 39 36 49 44 39
Somewhat effective 50 52 39 45 53 50 49 50 51 52 49 47 49 49 51 37 44 48
Not very effective 10 8 13 11 10 7 9 8 12 8 11 10 9 10 10 10 10 9
Not at all effective 2 1 4 2 2 1 2 3 3 2 0 4 3 2 2 2 2 3
Not applicable 1 1 4 1 2 1 1 4 3 0 1 2 5 1 2 2 2 0
Assistance provided by
mentors at the school
Very Effective 46 48 50 51 46 51 46 41 50 51 46 40 43 49 47 47 55 52
Somewhat effective 32 31 25 31 31 32 31 30 33 33 30 29 35 29 31 29 32 15
Not very effective 8 7 13 10 12 6 6 8 11 7 9 9 9 9 9 8 5 15
Not at all effective 3 2 4 3 4 1 2 2 3 4 2 3 3 3 2 7 3 12
Not applicable 11 11 8 5 7 10 14 19 4 5 13 19 11 10 11 8 5 6
Working with other school
district staff
Very Effective 44 43 43 46 41 46 38 40 45 50 42 40 33 45 44 36 52 44
Somewhat effective 36 38 34 35 35 34 43 37 35 35 40 36 43 35 36 41 37 31
Not very effective 9 9 9 9 13 10 9 5 10 7 10 10 11 9 9 8 3 13
Not at all effective 2 1 3 2 1 1 3 1 2 1 1 2 5 1 2 5 0 0
Not applicable 9 9 11 8 10 9 6 16 8 6 7 12 8 10 9 10 8 13
Working with college faculty
in the school where I was
teaching
Very Effective 16 17 16 18 16 21 16 10 15 23 14 10 13 17 15 22 27 21
Somewhat effective 32 34 15 30 26 27 32 34 35 30 26 31 26 30 30 31 26 27
Not very effective 17 17 9 10 16 17 20 17 13 12 24 14 16 14 16 14 13 12
Not at all effective 3 3 3 2 1 3 4 4 2 1 3 5 5 2 3 2 2 3
Not applicable 33 30 57 39 42 32 28 35 34 34 32 39 40 35 36 31 32 36
AllPreparation Route Years of Experience Age Gender Race

National Center for Education Information Profile of Teachers in the U.S. 2011 | 67
A5. Effectiveness of Aspects of Teacher Preparation Program by Preparation Route, Years of Experience, Age, Gender and Race (cont.)
Traditional Alternative 1-5 6-9 10-14 15-24 25+ 20s 30s 40s 50+ Male Female White Black Hispanic Other
On-going assessments of my
progress in the program% % % % % % % % % % % % % % % % % %
Very Effective 25 26 32 30 23 29 23 26 26 26 23 24 22 27 24 47 36 13
Somewhat effective 46 47 38 46 46 40 45 45 47 49 40 43 44 45 46 34 43 35
Not very effective 17 16 17 13 15 22 19 16 15 13 25 18 19 16 17 12 13 35
Not at all effective 3 3 6 3 5 2 5 1 5 3 3 2 6 3 4 3 0 3
Not applicable 9 9 8 7 11 7 9 12 8 9 9 11 10 8 9 3 8 13
Lectures/learning sessions
with experts in particular
areas of teaching
Very Effective 27 28 32 30 28 28 27 30 23 30 33 26 24 29 26 46 42 31
Somewhat effective 50 49 41 49 47 45 50 45 50 50 44 51 50 47 50 36 42 41
Not very effective 12 13 9 9 16 15 14 11 13 13 12 11 10 13 13 5 3 9
Not at all effective 3 3 5 4 1 3 5 5 4 2 5 4 5 3 3 2 5 13
Not applicable 8 7 12 8 8 9 5 9 10 6 5 8 10 8 8 12 8 6
Gender RaceAll
Preparation Route Years of Experience Age
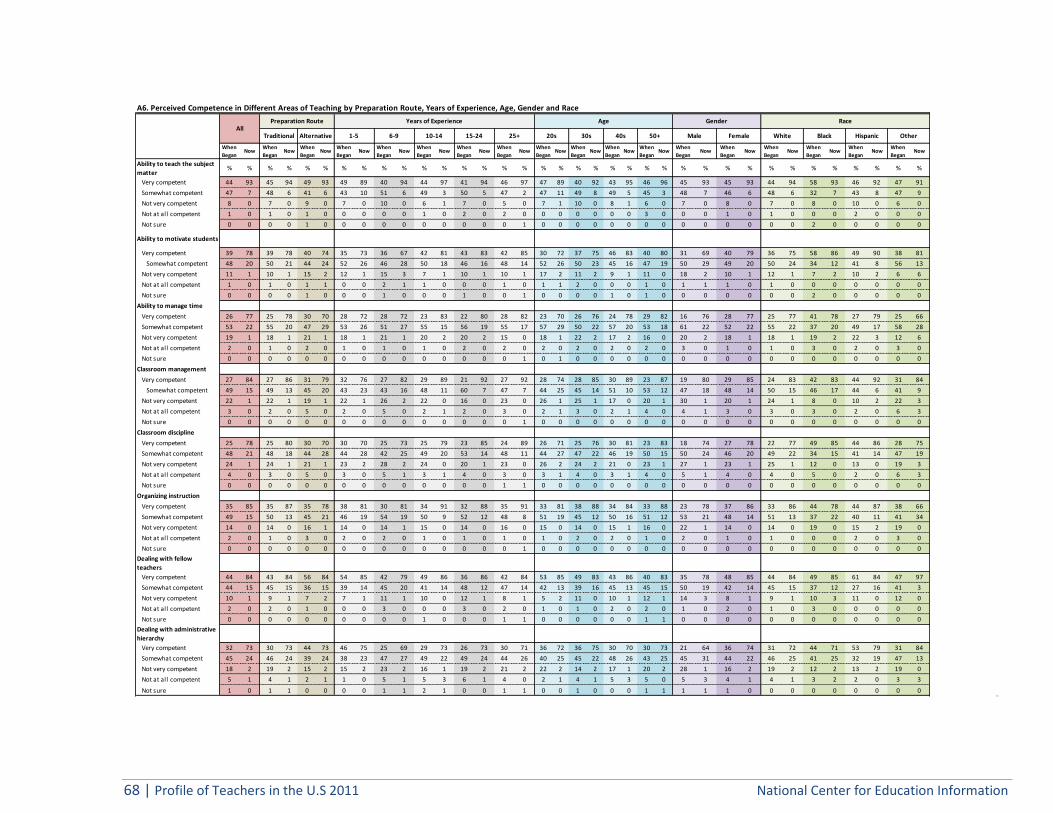
68 | Profile of Teachers in the U.S 2011 National Center for Education Information
A6. Perceived Competence in Different Are as of Tea chi ng by Pre paration Route, , Year s of Experie nce , Age, Ge nder a nd Race
A6. Perceived Competence in Different Areas of Teaching by Preparation Route, Years of Experience, Age, Gender and Race
When
BeganNow
When
BeganNow
When
BeganNow
When
BeganNow
When
BeganNow
When
BeganNow
When
BeganNow
When
BeganNow
When
BeganNow
When
BeganNow
When
BeganNow
When
BeganNow
When
BeganNow
When
BeganNow
When
BeganNow
When
BeganNow
When
BeganNow
When
BeganNow
Ability to teach the subject
matter% % % % % % % % % % % % % % % % % % % % % % % % % % % % % % % % % % % %
Very competent 44 93 45 94 49 93 49 89 40 94 44 97 41 94 46 97 47 89 40 92 43 95 46 96 45 93 45 93 44 94 58 93 46 92 47 91
Somewhat competent 47 7 48 6 41 6 43 10 51 6 49 3 50 5 47 2 47 11 49 8 49 5 45 3 48 7 46 6 48 6 32 7 43 8 47 9
Not very competent 8 0 7 0 9 0 7 0 10 0 6 1 7 0 5 0 7 1 10 0 8 1 6 0 7 0 8 0 7 0 8 0 10 0 6 0
Not at all competent 1 0 1 0 1 0 0 0 0 0 1 0 2 0 2 0 0 0 0 0 0 0 3 0 0 0 1 0 1 0 0 0 2 0 0 0
Not sure 0 0 0 0 1 0 0 0 0 0 0 0 0 0 0 1 0 0 0 0 0 0 0 0 0 0 0 0 0 0 2 0 0 0 0 0
Ability to motivate students
Very competent 39 78 39 78 40 74 35 73 36 67 42 81 43 83 42 85 30 72 37 75 46 83 40 80 31 69 40 79 36 75 58 86 49 90 38 81
Somewhat competent 48 20 50 21 44 24 52 26 46 28 50 18 46 16 48 14 52 26 50 23 45 16 47 19 50 29 49 20 50 24 34 12 41 8 56 13
Not very competent 11 1 10 1 15 2 12 1 15 3 7 1 10 1 10 1 17 2 11 2 9 1 11 0 18 2 10 1 12 1 7 2 10 2 6 6
Not at all competent 1 0 1 0 1 1 0 0 2 1 1 0 0 0 1 0 1 1 2 0 0 0 1 0 1 1 1 0 1 0 0 0 0 0 0 0
Not sure 0 0 0 0 1 0 0 0 1 0 0 0 1 0 0 1 0 0 0 0 1 0 1 0 0 0 0 0 0 0 2 0 0 0 0 0
Ability to manage time
Very competent 26 77 25 78 30 70 28 72 28 72 23 83 22 80 28 82 23 70 26 76 24 78 29 82 16 76 28 77 25 77 41 78 27 79 25 66
Somewhat competent 53 22 55 20 47 29 53 26 51 27 55 15 56 19 55 17 57 29 50 22 57 20 53 18 61 22 52 22 55 22 37 20 49 17 58 28
Not very competent 19 1 18 1 21 1 18 1 21 1 20 2 20 2 15 0 18 1 22 2 17 2 16 0 20 2 18 1 18 1 19 2 22 3 12 6
Not at all competent 2 0 1 0 2 0 1 0 1 0 1 0 2 0 2 0 2 0 2 0 2 0 2 0 3 0 1 0 1 0 3 0 2 0 3 0
Not sure 0 0 0 0 0 0 0 0 0 0 0 0 0 0 0 1 0 1 0 0 0 0 0 0 0 0 0 0 0 0 0 0 0 0 0 0
Classroom management
Very competent 27 84 27 86 31 79 32 76 27 82 29 89 21 92 27 92 28 74 28 85 30 89 23 87 19 80 29 85 24 83 42 83 44 92 31 84
Somewhat competent 49 15 49 13 45 20 43 23 43 16 48 11 60 7 47 7 44 25 45 14 51 10 53 12 47 18 48 14 50 15 46 17 44 6 41 9
Not very competent 22 1 22 1 19 1 22 1 26 2 22 0 16 0 23 0 26 1 25 1 17 0 20 1 30 1 20 1 24 1 8 0 10 2 22 3
Not at all competent 3 0 2 0 5 0 2 0 5 0 2 1 2 0 3 0 2 1 3 0 2 1 4 0 4 1 3 0 3 0 3 0 2 0 6 3
Not sure 0 0 0 0 0 0 0 0 0 0 0 0 0 0 0 1 0 0 0 0 0 0 0 0 0 0 0 0 0 0 0 0 0 0 0 0
Classroom discipline
Very competent 25 78 25 80 30 70 30 70 25 73 25 79 23 85 24 89 26 71 25 76 30 81 23 83 18 74 27 78 22 77 49 85 44 86 28 75
Somewhat competent 48 21 48 18 44 28 44 28 42 25 49 20 53 14 48 11 44 27 47 22 46 19 50 15 50 24 46 20 49 22 34 15 41 14 47 19
Not very competent 24 1 24 1 21 1 23 2 28 2 24 0 20 1 23 0 26 2 24 2 21 0 23 1 27 1 23 1 25 1 12 0 13 0 19 3
Not at all competent 4 0 3 0 5 0 3 0 5 1 3 1 4 0 3 0 3 1 4 0 3 1 4 0 5 1 4 0 4 0 5 0 2 0 6 3
Not sure 0 0 0 0 0 0 0 0 0 0 0 0 0 0 1 1 0 0 0 0 0 0 0 0 0 0 0 0 0 0 0 0 0 0 0 0
Organizing instruction
Very competent 35 85 35 87 35 78 38 81 30 81 34 91 32 88 35 91 33 81 38 88 34 84 33 88 23 78 37 86 33 86 44 78 44 87 38 66
Somewhat competent 49 15 50 13 45 21 46 19 54 19 50 9 52 12 48 8 51 19 45 12 50 16 51 12 53 21 48 14 51 13 37 22 40 11 41 34
Not very competent 14 0 14 0 16 1 14 0 14 1 15 0 14 0 16 0 15 0 14 0 15 1 16 0 22 1 14 0 14 0 19 0 15 2 19 0
Not at all competent 2 0 1 0 3 0 2 0 2 0 1 0 1 0 1 0 1 0 2 0 2 0 1 0 2 0 1 0 1 0 0 0 2 0 3 0
Not sure 0 0 0 0 0 0 0 0 0 0 0 0 0 0 0 1 0 0 0 0 0 0 0 0 0 0 0 0 0 0 0 0 0 0 0 0
Dealing with fellow
teachers
Very competent 44 84 43 84 56 84 54 85 42 79 49 86 36 86 42 84 53 85 49 83 43 86 40 83 35 78 48 85 44 84 49 85 61 84 47 97
Somewhat competent 44 15 45 15 36 15 39 14 45 20 41 14 48 12 47 14 42 13 39 16 45 13 45 15 50 19 42 14 45 15 37 12 27 16 41 3
Not very competent 10 1 9 1 7 2 7 1 11 1 10 0 12 1 8 1 5 2 11 0 10 1 12 1 14 3 8 1 9 1 10 3 11 0 12 0
Not at all competent 2 0 2 0 1 0 0 0 3 0 0 0 3 0 2 0 1 0 1 0 2 0 2 0 1 0 2 0 1 0 3 0 0 0 0 0
Not sure 0 0 0 0 0 0 0 0 0 0 1 0 0 0 1 1 0 0 0 0 0 0 1 1 0 0 0 0 0 0 0 0 0 0 0 0
Dealing with administrative
hierarchy
Very competent 32 73 30 73 44 73 46 75 25 69 29 73 26 73 30 71 36 72 36 75 30 70 30 73 21 64 36 74 31 72 44 71 53 79 31 84
Somewhat competent 45 24 46 24 39 24 38 23 47 27 49 22 49 24 44 26 40 25 45 22 48 26 43 25 45 31 44 22 46 25 41 25 32 19 47 13
Not very competent 18 2 19 2 15 2 15 2 23 2 16 1 19 2 21 2 22 2 14 2 17 1 20 2 28 1 16 2 19 2 12 2 13 2 19 0
Not at all competent 5 1 4 1 2 1 1 0 5 1 5 3 6 1 4 0 2 1 4 1 5 3 5 0 5 3 4 1 4 1 3 2 2 0 3 3
Not sure 1 0 1 1 0 0 0 0 1 1 2 1 0 0 1 1 0 0 1 0 0 0 1 1 1 1 1 0 0 0 0 0 0 0 0 0
AllYears of Experience Age Gender
40s 50+ Male FemaleTraditional Alternative
Preparation Route
1-5 6-9 10-14 15-24 25+ 20s 30s
Race
White Black Hispanic Other

National Center for Education Information Profile of Teachers in the U.S. 2011 | 69
A7. Valua ble Criteria i n Devel opi ng Com petence to T each by Pre paration Rout e, Year s of Experie nce, Ag e, Ge nder a nd Race
A7. Valuable Criteria in Developing Competence to Teach by Preparation Route, Years of Experience, Age, Gender and Race
Traditional Alternative 1-5 6-9 10-14 15-24 25+ 20s 30s 40s 50+ Male Female White Black Hispanic Other
Education methods courses % % % % % % % % % % % % % % % % % %
Very valuable 35 39 31 36 34 36 34 44 30 38 41 37 23 39 34 58 54 25
Somewhat valuable 50 49 50 53 50 47 52 39 55 52 45 47 57 48 51 37 44 56
Not very valuable 12 10 15 9 12 16 10 12 13 8 11 12 16 10 12 2 0 16
Not at all valuable 2 2 1 0 3 1 3 3 1 1 3 4 3 2 2 3 0 3
Not sure 1 0 3 2 1 1 0 1 2 1 0 0 1 1 1 0 2 0
Clinical/field-based
experiences
Very valuable 83 87 72 82 82 87 86 83 84 85 86 77 71 85 85 75 70 75
Somewhat valuable 15 11 24 16 16 12 13 14 14 14 13 19 27 13 13 19 27 25
Not very valuable 1 1 1 1 1 1 1 1 1 0 1 2 1 1 1 2 3 0
Not at all valuable 0 0 0 0 0 0 0 1 0 0 0 0 0 0 0 0 0 0
Not sure 1 1 2 1 1 0 0 2 1 0 1 1 2 1 1 5 0 0
Courses in subjects to be
taught
Very valuable 64 64 64 64 66 71 62 61 65 64 67 63 59 65 63 76 68 75
Somewhat valuable 32 32 32 33 29 27 34 36 31 32 32 32 33 32 33 24 30 19
Not very valuable 4 3 4 3 5 2 3 3 5 3 1 4 7 3 4 0 2 6
Not at all valuable 0 0 0 0 0 0 0 1 0 0 0 0 0 0 0 0 0 0
Not sure 0 0 0 0 0 0 0 0 0 0 1 0 0 0 0 0 0 0
Professional development
activities
Very valuable 45 46 48 47 45 43 43 50 44 47 43 46 32 50 45 64 59 41
Somewhat valuable 45 44 41 45 45 47 45 41 45 45 47 42 48 43 45 27 40 44
Not very valuable 9 8 10 8 9 9 10 6 10 7 9 10 16 7 9 8 2 13
Not at all valuable 1 1 1 1 1 0 1 3 1 1 1 2 3 1 1 0 0 3
Not sure 0 1 0 0 0 1 0 1 0 0 1 1 0 1 1 0 0 0
AllYears of Experience Age Gender RacePreparation Route

70 | Profile of Teachers in the U.S 2011 National Center for Education Information
A7. Valuable Criteria in Developing Competence to Teach by Preparation Route, Years of Experience, Age, Gender and Race (cont.)
Traditional Alternative 1-5 6-9 10-14 15-24 25+ 20s 30s 40s 50+ Male Female White Black Hispanic Other
Other teachers/colleagues % % % % % % % % % % % % % % % % % %
Very valuable 76 77 73 79 74 74 74 77 75 80 74 73 68 77 77 68 76 78
Somewhat valuable 22 21 26 19 23 24 22 21 23 18 22 25 27 21 21 29 21 19
Not very valuable 2 2 2 1 3 1 3 1 2 2 3 2 4 2 2 3 3 0
Not at all valuable 0 0 0 0 0 0 0 0 0 0 0 0 0 0 0 0 0 0
Not sure 0 0 0 0 0 1 0 0 0 0 1 0 1 0 0 0 0 3
Studying on one's own
Very valuable 32 31 38 32 33 36 26 41 27 31 35 36 34 32 30 47 44 34
Somewhat valuable 47 46 44 48 43 41 52 39 49 46 47 43 46 46 48 34 41 41
Not very valuable 18 19 16 17 21 21 20 15 20 19 18 16 17 19 19 17 13 22
Not at all valuable 2 2 1 2 2 3 1 2 4 2 0 3 3 2 2 0 0 0
Not sure 1 1 1 1 2 0 1 3 1 1 1 2 1 1 1 2 2 3
One's own teaching
experiences
Very valuable 83 85 80 83 85 80 82 88 84 83 85 82 78 84 85 76 79 88
Somewhat valuable 16 14 19 16 14 18 16 10 14 17 14 16 21 14 14 24 19 9
Not very valuable 1 1 1 1 1 1 1 1 1 0 1 1 0 1 1 0 2 0
Not at all valuable 0 0 0 0 0 0 0 1 0 0 0 0 1 0 0 0 0 0
Not sure 0 0 0 0 0 0 0 1 1 0 0 1 0 0 0 0 0 3
The college of education
faculty
Very valuable 22 25 19 24 20 22 22 28 19 26 23 22 16 24 20 42 37 16
Somewhat valuable 53 53 44 52 51 54 52 48 54 54 48 49 44 52 54 36 41 48
Not very valuable 18 17 20 15 18 18 20 18 17 13 22 21 28 16 19 10 16 23
Not at all valuable 3 2 4 1 4 1 4 3 3 1 3 4 5 2 2 5 0 6
Not sure 4 3 13 7 7 4 4 2 7 6 4 4 7 5 5 7 6 6
The faculty in one's subject
area major
Very valuable 38 38 39 36 35 40 39 45 34 33 40 44 35 39 36 59 45 38
Somewhat valuable 46 47 39 44 45 48 48 42 44 49 47 44 45 46 47 29 40 47
Not very valuable 11 10 12 12 11 9 9 10 13 11 8 10 10 11 11 9 11 3
Not at all valuable 2 1 2 1 4 1 1 0 3 1 1 0 3 1 1 2 0 6
Not sure 4 3 7 7 5 3 2 2 5 5 4 3 7 4 4 2 3 6
Preparation Route Years of Experience Age Gender RaceAll

National Center for Education Information Profile of Teachers in the U.S. 2011 | 71
A8. Helpfulness of Support in Developing Competence to Teach by Preparation Route, Years of Experience, Age, Gender and Race
A8. Helpfulness of Support in Developing Competence to Teach by Preparation Route, Years of Experience, Age, Gender and Race
Traditional Alternative 1-5 6-9 10-14 15-29 20-24 20s 30s 40s 50+ Male Female White Black Hispanic Other
Mentor teacher % % % % % % % % % % % % % % % % % %
Very helpful 55 57 53 57 54 62 56 49 56 61 56 48 56 56 54 56 69 59
Somewhat helpful 20 20 22 25 21 18 18 12 28 23 19 14 18 21 21 24 19 9
Not very helpful 8 7 13 9 12 6 8 6 9 8 9 8 11 8 9 7 5 16
Not at all helpful 3 3 6 4 7 5 2 1 4 5 4 3 3 4 4 3 3 6
No support provided 14 13 6 4 6 8 16 31 3 4 11 26 12 11 12 10 3 9
School principal
Very helpful 26 26 20 29 20 25 23 26 23 26 29 21 22 25 24 31 29 13
Somewhat helpful 41 41 39 36 42 40 44 39 40 43 42 40 44 40 42 34 45 31
Not very helpful 22 22 24 24 21 23 26 17 25 21 22 21 21 23 23 19 15 28
Not at all helpful 7 7 8 6 12 8 3 10 9 7 4 9 8 7 7 8 8 22
No support provided 4 4 9 4 6 5 3 7 3 3 3 8 4 5 5 8 3 6
Other school personnel
Very helpful 47 47 44 54 40 46 48 41 51 51 51 39 45 47 47 36 47 53
Somewhat helpful 42 42 46 38 46 41 45 45 41 39 39 48 46 41 42 58 40 34
Not very helpful 7 7 4 5 6 8 6 8 6 8 5 7 5 7 7 3 10 6
Not at all helpful 1 1 3 1 3 1 0 2 1 1 1 2 1 1 1 0 2 3
No support provided 3 3 4 1 5 4 2 5 2 1 4 4 2 4 3 3 2 3
College/university
personnel
Very helpful 17 19 16 22 17 16 14 18 21 19 16 13 16 18 16 28 31 6
Somewhat helpful 47 48 32 42 44 58 45 39 43 50 45 41 40 45 45 40 42 50
Not very helpful 24 22 23 17 22 17 28 29 20 16 27 30 27 22 24 21 18 19
Not at all helpful 4 4 3 3 6 3 4 3 4 4 3 4 5 4 4 0 3 9
No support provided 9 6 25 16 11 6 8 10 12 10 9 12 13 11 11 12 6 16
AllPreparation Route Years of Experience Age Gender Race

72 | Profile of Teachers in the U.S 2011 National Center for Education Information
A8. Helpfulness of Support in Developing Competence to Teach by Preparation Route, Years of Experience, Age, Gender and Race (cont.)
Traditional Alternative 1-5 6-9 10-14 15-29 20-24 20s 30s 40s 50+ Male Female White Black Hispanic Other
State agency personnel % % % % % % % % % % % % % % % % % %
Very helpful 2 1 4 3 1 3 1 0 1 3 3 1 3 2 2 5 6 0
Somewhat helpful 13 13 13 15 12 19 10 11 10 16 12 14 12 13 12 22 23 19
Not very helpful 26 26 24 27 18 20 29 29 25 23 30 26 29 25 26 29 27 22
Not at all helpful 15 16 11 12 16 17 19 11 19 12 15 14 16 15 16 10 15 9
No support provided 44 43 48 44 52 41 41 49 44 46 40 45 39 45 45 33 29 50
Public/Private agency
personnel, e.g. Teach for
America, Troops to Teachers
Very helpful 3 1 11 7 2 2 1 1 7 2 3 2 7 3 3 5 8 13
Somewhat helpful 7 6 13 11 5 7 6 4 8 10 7 5 8 8 7 16 16 6
Not very helpful 12 13 10 14 7 11 13 14 14 11 11 12 13 12 12 10 19 3
Not at all helpful 6 7 2 5 3 6 10 4 7 4 7 6 5 6 6 0 10 6
No support provided 73 73 64 63 83 74 71 76 65 73 73 75 67 71 73 69 47 72
Preparation Route Years of Experience Age Gender RaceAll

National Center for Education Information Profile of Teachers in the U.S. 2011 | 73
A9. Measurement s to Determi ne Qualificati on by Preparation Route, Years of Experience, Age, Gender and Race
A9. Measurements to Determine Qualification of Teachers by Preparation Route, Years of Experience, Age, Gender and Race
Traditional Alternative 1-5 6-9 10-14 15-24 25+ 20s 30s 40s 50+ Male Female White Black Hispanic Other
Academic progress of students
measured by standardized test scores% % % % % % % % % % % % % % % % % %
Strongly agree 6 5 9 7 5 5 3 7 7 6 6 4 7 6 5 10 15 9
Somewhat agree 42 42 49 50 41 36 47 39 41 46 42 43 47 43 43 43 53 41
Somewhat disagree 27 27 26 26 27 33 26 23 30 24 25 27 25 28 27 24 19 25
Strongly disagree 25 24 16 17 27 23 24 30 22 23 27 25 22 23 24 22 13 25
Not sure 1 1 0 0 0 2 1 1 0 1 1 1 0 1 1 0 0 0
Being fully certified by the state to
teach
Strongly agree 50 52 44 52 53 51 44 52 52 55 46 46 40 51 49 59 62 44
Somewhat agree 37 37 37 35 29 38 44 37 32 32 39 42 40 36 37 33 26 38
Somewhat disagree 10 8 14 10 12 8 8 10 12 10 10 9 14 9 11 7 7 13
Strongly disagree 3 3 6 3 5 3 4 1 4 3 4 3 6 3 3 2 5 6
Not sure 0 0 0 0 1 0 0 0 0 0 1 0 0 0 0 0 0 0
Evaluation by administrator that
includes direct classroom observation
Strongly agree 49 50 47 57 49 51 44 41 61 55 49 38 43 51 52 43 48 34
Somewhat agree 42 42 43 38 39 39 48 48 33 39 40 51 47 41 40 48 45 53
Somewhat disagree 6 5 7 4 8 7 5 8 5 4 9 6 6 6 6 7 2 6
Strongly disagree 2 2 3 1 3 2 2 3 1 1 2 4 4 2 2 2 5 6
Not sure 0 0 0 0 1 0 0 0 0 0 1 0 0 0 0 0 0 0
Evaluation by peers that includes
direct classroom observation
Strongly agree 39 37 48 43 34 41 36 35 35 44 39 37 45 39 40 36 42 44
Somewhat agree 42 43 39 44 41 38 45 43 45 42 40 40 41 42 42 45 42 34
Somewhat disagree 12 12 11 10 19 16 10 7 15 11 12 10 8 12 11 14 10 9
Strongly disagree 6 6 2 2 6 4 6 12 4 3 6 10 5 5 5 5 3 9
Not sure 1 2 0 1 0 1 2 3 1 0 3 2 1 2 1 0 3 3
Gender RacePreparation RouteAll
Years of Experience Age

74 | Profile of Teachers in the U.S 2011 National Center for Education Information
A9. Measurements to Determine Qualification of Teachers by Preparation Route, Years of Experience, Age, Gender and Race (cont)
Traditional Alternative 1-5 6-9 10-14 15-24 25+ 20s 30s 40s 50+ Male Female White Black Hispanic Other
Experience—length of time teaching K-
12% % % % % % % % % % % % % % % % % %
Strongly agree 33 35 23 23 29 35 39 45 20 33 34 42 25 34 32 34 39 31
Somewhat agree 42 40 40 42 34 44 43 35 40 40 46 38 41 40 40 41 39 44
Somewhat disagree 18 18 25 24 29 14 12 16 26 18 16 15 24 18 20 19 16 9
Strongly disagree 8 7 12 11 8 7 5 4 13 9 4 5 10 7 8 5 6 13
Not sure 0 0 0 0 1 0 0 0 0 0 1 0 0 0 0 0 0 3
Level of education
Strongly agree 27 27 24 28 25 25 28 22 26 25 30 25 23 26 23 33 48 34
Somewhat agree 55 54 58 57 54 54 50 61 55 55 52 59 54 56 58 54 39 50
Somewhat disagree 15 15 15 13 17 17 18 13 17 15 16 13 18 14 16 9 11 6
Strongly disagree 3 4 2 1 4 3 4 4 2 4 2 4 5 3 3 2 0 9
Not sure 0 0 1 0 0 1 0 0 0 1 1 0 0 1 0 2 2 0
National Board for Professional
Teaching Standards certification
Strongly agree 18 18 21 24 19 15 17 13 20 19 21 15 18 19 16 19 42 22
Somewhat agree 39 38 38 44 37 39 38 33 40 40 38 33 33 39 39 36 34 34
Somewhat disagree 22 23 20 15 18 26 23 30 19 19 21 27 24 22 24 21 11 19
Strongly disagree 12 11 10 6 13 12 14 15 6 13 10 16 14 10 11 14 6 13
Not sure 10 9 12 12 13 8 8 9 14 9 9 9 12 10 10 10 6 13
Passing a test of proficiency in
teaching skills
Strongly agree 20 21 27 29 19 20 18 14 24 22 22 16 19 23 20 40 31 16
Somewhat agree 49 48 49 52 44 46 53 46 54 49 48 46 44 49 49 43 50 47
Somewhat disagree 22 23 15 13 23 25 22 31 14 21 23 28 27 21 23 9 13 22
Strongly disagree 7 6 8 5 12 7 5 7 7 7 6 7 10 6 7 7 3 6
Not sure 2 2 0 1 2 1 2 3 2 1 2 3 0 2 1 2 3 9
Passing a test of subject matter
proficiency
Strongly agree 29 27 41 35 27 27 28 26 32 27 32 28 37 29 27 52 39 31
Somewhat agree 49 49 44 52 46 48 52 42 53 49 45 47 41 50 50 33 48 44
Somewhat disagree 15 16 11 10 17 16 12 24 10 17 15 18 16 15 16 7 11 16
Strongly disagree 6 6 4 2 9 7 5 6 4 6 7 5 6 5 6 7 0 3
Not sure 1 1 0 1 1 2 1 2 1 1 1 2 0 1 1 2 2 6
RaceAll
Preparation Route Years of Experience Age Gender

National Center for Education Information Profile of Teachers in the U.S. 2011 | 75
A9. Measurements to Determine Qualification of Teachers by Preparation Route, Years of Experience, Age, Gender and Race (cont.)
Traditional Alternative 1-5 6-9 10-14 15-24 25+ 20s 30s 40s 50+ Male Female White Black Hispanic Other
Completion of a teacher preparation
program% % % % % % % % % % % % % % % % % %
Strongly agree 52 57 39 57 47 45 52 63 58 50 52 53 38 56 53 60 53 50
Somewhat agree 39 36 46 34 43 48 42 27 32 41 41 38 45 37 38 34 40 38
Somewhat disagree 7 5 11 5 9 5 6 7 7 7 6 7 16 5 7 3 3 9
Strongly disagree 1 1 3 2 1 1 0 3 3 1 0 2 2 1 1 2 2 3
Not sure 1 1 0 1 0 1 0 1 1 0 1 1 0 1 1 0 2 0
Portfolio of exemplary practices
Strongly agree 19 18 24 19 18 20 18 17 19 21 20 14 15 20 19 14 27 16
Somewhat agree 44 45 38 48 41 39 44 43 43 44 41 44 36 44 44 43 44 31
Somewhat disagree 26 26 27 26 32 27 24 24 31 29 24 26 36 24 27 26 26 31
Strongly disagree 8 8 7 4 6 10 11 10 5 5 10 11 10 7 8 14 0 6
Not sure 4 4 4 3 3 4 4 6 1 3 5 5 3 4 3 3 3 16
Video of teacher’s classroom
performance
Strongly agree 17 16 22 15 17 19 16 15 13 21 15 16 18 17 16 19 23 22
Somewhat agree 44 44 40 48 39 37 46 39 46 41 44 39 46 42 44 33 39 31
Somewhat disagree 26 27 25 26 32 27 24 31 27 29 26 27 25 27 27 29 25 22
Strongly disagree 10 9 10 8 9 11 12 11 11 7 10 13 8 10 9 12 10 9
Not sure 4 4 4 4 3 6 2 4 3 2 5 5 3 4 3 7 3 16
AllPreparation Route Years of Experience Age Gender Race

76 | Profile of Teachers in the U.S 2011 National Center for Education Information
A10. Ways to Strengthen the Teaching Profession by Preparation Route, Years of Experience, Age, Gender and Race
A10. Ways to Strengthen the Teaching Profession by Preparation Route, Years of Experience, Age, Gender and Race
Traditional Alternative 1-5 6-9 10-14 15-24 25+ 20s 30s 40s 50+ Male Female White Black Hispanic Other
Pay teachers based on job
performance% % % % % % % % % % % % % % % % % %
Strongly agree 16 15 28 20 17 15 16 11 21 17 15 12 17 18 17 19 17 19
Somewhat agree 43 43 43 49 39 37 46 40 45 43 40 45 40 44 45 29 32 53
Somewhat disagree 19 18 16 16 21 24 16 16 17 19 22 16 19 17 17 20 27 13
Strongly disagree 21 21 12 14 20 22 18 29 15 19 21 24 20 18 19 27 19 16
Not sure 2 3 1 2 3 2 4 4 1 3 3 3 3 3 2 5 5 0
Pay teachers based on
seniority
Strongly agree 19 21 9 12 10 22 23 31 10 17 22 24 18 17 18 20 19 13
Somewhat agree 46 46 39 42 41 47 49 48 42 46 48 47 42 46 46 42 33 47
Somewhat disagree 20 19 33 25 25 19 17 12 26 19 17 19 24 22 22 14 24 22
Strongly disagree 13 13 17 20 20 11 8 7 21 16 11 9 15 13 13 19 22 19
Not sure 2 2 2 1 3 1 3 1 1 2 2 2 1 2 1 5 2 0
Pay teachers based on level of
education
Strongly agree 32 33 25 27 32 32 33 37 27 33 31 32 32 32 30 52 32 28
Somewhat agree 49 48 51 49 47 50 51 43 49 47 51 50 47 49 50 33 43 53
Somewhat disagree 12 12 18 15 15 14 10 14 14 13 11 14 17 13 13 10 17 16
Strongly disagree 5 5 5 8 5 3 6 6 8 6 5 3 4 6 5 0 8 3
Not sure 1 1 1 2 2 1 1 1 2 1 2 0 1 1 1 5 0 0
Pay people more to teach in
high-needs schools
Strongly agree 14 13 22 18 15 13 15 9 12 16 17 14 21 14 13 15 32 38
Somewhat agree 36 36 45 41 41 38 34 32 43 37 32 39 43 37 38 44 32 34
Somewhat disagree 24 24 17 20 18 26 24 28 23 22 25 22 20 23 24 19 16 22
Strongly disagree 22 23 13 17 23 18 24 27 19 21 24 20 16 22 22 20 17 6
Not sure 3 4 3 4 3 4 4 3 3 3 3 4 1 4 3 2 3 0
Gender RacePreparation RouteAll
Years of Experience Age

National Center for Education Information Profile of Teachers in the U.S. 2011 | 77
A10. Ways to Strengthen the Teaching Profession by Preparation Route, Years of Experience, Age, Gender and Race (cont.)
Traditional Alternative 1-5 6-9 10-14 15-24 25+ 20s 30s 40s 50+ Male Female White Black Hispanic Other
Pay people more to teach high
demand subjects
Strongly agree 12 11 27 23 17 9 8 7 16 18 12 11 30 12 13 16 29 31
Somewhat agree 28 27 37 34 32 27 29 22 31 27 26 31 32 28 27 40 33 31
Somewhat disagree 30 30 22 25 20 35 29 35 32 26 29 30 18 30 31 21 19 25
Strongly disagree 28 30 13 16 30 28 34 33 19 28 33 26 18 28 28 24 19 13
Not sure 2 2 1 3 1 1 0 3 2 1 1 2 1 2 2 0 0 0
Have career ladders to afford
upward mobility
Strongly agree 28 27 40 32 34 24 27 26 25 32 27 30 38 29 28 40 44 31
Somewhat agree 49 48 48 47 53 55 46 42 53 49 48 43 47 48 50 45 37 38
Somewhat disagree 8 10 5 11 3 10 8 11 12 5 8 12 5 9 9 5 6 13
Strongly disagree 6 7 1 4 1 5 8 11 3 4 8 8 3 6 6 5 3 3
Not sure 9 9 6 7 8 7 10 10 7 9 10 8 8 8 8 5 10 16
Introduce a national
proficiency exam for entry into
teaching
Strongly agree 16 15 21 17 19 15 13 14 15 17 19 14 18 16 16 14 18 31
Somewhat agree 39 38 40 41 39 35 41 35 42 37 32 41 47 37 39 29 39 28
Somewhat disagree 20 21 18 21 17 29 20 19 22 20 24 18 12 21 20 22 23 13
Strongly disagree 19 20 16 15 19 17 18 26 15 19 15 24 18 19 18 28 16 25
Not sure 7 7 5 7 6 4 8 6 7 6 10 4 5 7 6 7 5 3
Give individuals more
autonomy in determining what
and how they teach
Strongly agree 34 34 36 32 36 34 32 36 32 36 30 34 42 33 33 41 32 50
Somewhat agree 44 44 44 47 43 48 38 44 48 43 42 47 38 45 45 38 44 38
Somewhat disagree 16 16 16 14 17 15 20 16 14 18 19 14 14 17 17 16 13 13
Strongly disagree 3 3 3 4 1 1 5 4 2 2 3 4 4 3 3 2 6 0
Not sure 3 3 1 3 3 2 5 1 3 2 6 1 2 3 3 3 5 0
Give teachers greater
participation in decision-
making at district level
Strongly agree 65 65 64 62 62 75 63 69 58 69 64 65 62 65 63 66 70 69
Somewhat agree 32 33 32 36 34 23 34 30 39 29 34 32 31 33 33 32 29 31
Somewhat disagree 2 1 3 1 3 2 2 1 2 2 1 2 3 1 2 2 0 0
Strongly disagree 0 0 0 0 0 0 1 1 0 0 1 0 1 0 0 0 0 0
Not sure 1 1 1 1 2 0 1 0 1 1 0 0 3 1 1 0 2 0
Gender RaceAll
Preparation Route Years of Experience Age

78 | Profile of Teachers in the U.S 2011 National Center for Education Information
A10. Ways to Strengthen the Teaching Profession by Preparation Route, Years of Experience, Age, Gender and Race (cont.)
Traditional Alternative 1-5 6-9 10-14 15-24 25+ 20s 30s 40s 50+ Male Female White Black Hispanic Other
Give teachers greater
participation in decision-
making at school-building level
Strongly agree 72 72 69 69 68 79 71 77 67 74 71 74 67 72 72 76 70 72
Somewhat agree 26 25 29 28 29 17 28 22 31 24 27 25 27 26 26 19 30 22
Somewhat disagree 1 1 1 1 1 3 1 0 2 1 2 1 3 1 1 3 0 3
Strongly disagree 0 0 0 0 0 0 1 1 0 0 1 0 1 0 0 0 0 0
Not sure 1 1 0 1 1 1 0 0 1 2 0 0 2 1 1 2 0 3
Get rid of tenure for teachers
Strongly agree 12 12 23 17 15 14 12 9 16 15 9 11 16 14 14 4 19 13
Somewhat agree 21 20 28 30 18 12 19 17 31 18 22 18 18 23 22 14 29 22
Somewhat disagree 25 24 25 23 25 26 24 26 21 25 27 26 28 24 25 21 21 25
Strongly disagree 38 39 18 21 33 43 43 46 25 34 39 42 36 34 34 58 26 38
Not sure 5 5 6 9 8 5 2 3 7 8 3 3 3 6 5 4 5 3
Get rid of the teachers’ unions
Strongly agree 8 9 13 11 6 9 9 10 10 6 9 9 13 10 10 2 10 6
Somewhat agree 11 10 14 11 13 8 11 9 12 10 15 9 10 11 11 0 13 22
Somewhat disagree 21 20 27 26 19 26 21 15 23 23 22 19 18 23 22 22 29 19
Strongly disagree 51 52 32 37 53 52 53 59 38 51 46 58 53 46 47 69 45 47
Not sure 9 8 14 15 8 5 7 7 17 9 8 5 5 10 10 7 3 6
AllPreparation Route Years of Experience Age Gender Race

National Center for Education Information Profile of Teachers in the U.S. 2011 | 79
A11. Proposals to Improve America’s Educational System by Preparation Route, Years of Experience, Age, Gender and Race
A11. Proposals to Improve America's Educational System by Preparation Route, Years of Experience, Age, Gender and Race
Traditional Alternative 1-5 6-9 10-14 15-24 25+ 20s 30s 40s 50+ Male Female White Black Hispanic Other
% % % % % % % % % % % % % % % % % %
Require public school
students to pass
standardized exams for
grade promotion
47 43 59 50 44 42 49 41 48 43 47 50 58 45 45 50 65 65
Stricter requirements for
high school graduation65 64 67 71 59 66 62 59 72 68 57 61 69 64 64 61 75 69
Private, for-profit
corporations contracted to
operate schools
11 12 25 18 12 15 15 6 16 14 15 8 21 13 13 12 24 25
Expand the use of Charter
Schools for children in low-
performing public schools
43 41 64 55 52 40 36 33 61 47 42 32 52 45 43 62 60 41
Recruit individuals from
other careers into teaching50 44 78 54 50 55 50 44 37 54 54 53 74 48 49 68 60 53
Recruit individuals from
other careers into school
administration
26 21 48 31 29 23 21 23 20 26 28 31 42 25 24 34 50 34
Remove incompetent
teachers regardless of
seniority
89 89 92 93 90 92 88 83 97 89 90 83 92 90 91 76 79 97
Get rid of tenure for
teachers32 31 52 47 33 25 31 26 44 34 32 30 36 36 37 16 37 41
Recruit teachers from the
top third of all students50 49 55 51 42 50 53 57 50 46 50 53 58 49 52 31 47 55
Evaluate a teacher’s
effectiveness primarily on
student achievement
10 10 17 16 8 9 10 8 14 10 13 9 13 11 10 7 27 13
In favor of the proposal
AllYears of Experience Age Gender RacePreparation Route

80 | Profile of Teachers in the U.S 2011 National Center for Education Information
A12. Career Aspect Satisfaction by Preparation Route, Years of Experience, Age, Gender and Race
A12. Career Aspect Satisfaction by Preparation Route, Years of Experience, Age, Gender and Race
Traditional Alternative 1-5 6-9 10-14 15-24 25+ 20s 30s 40s 50+ Male Female White Black Hispanic Other
General working conditions % % % % % % % % % % % % % % % % % %
Very satisfied 45 47 46 50 40 41 49 49 43 47 46 45 41 47 46 46 48 44
Somewhat satisfied 41 41 39 40 40 41 41 36 48 36 40 40 45 40 41 36 42 31
Somewhat dissatisfied 12 10 11 9 14 14 8 11 8 13 10 12 10 11 11 12 3 19
Very dissatisfied 3 2 4 1 6 3 1 4 1 4 4 2 3 3 2 7 6 6
Not sure 0 0 0 1 0 0 0 0 0 0 0 0 1 0 0 0 0 0
Overall job satisfaction
Very satisfied 49 49 50 51 42 48 49 56 41 50 51 51 46 50 49 46 56 56
Somewhat satisfied 40 41 37 38 40 45 43 35 45 37 40 40 46 39 41 39 35 28
Somewhat dissatisfied 9 8 11 9 15 5 6 6 11 10 7 8 6 9 8 14 6 9
Very dissatisfied 2 2 2 2 3 2 1 2 3 3 2 1 1 2 2 2 2 6
Not sure 0 0 0 0 0 0 0 0 0 0 0 0 0 0 0 0 0 0
Present curriculum
Very satisfied 33 33 33 30 27 32 37 37 30 29 36 36 25 34 32 37 39 19
Somewhat satisfied 48 49 47 54 45 49 48 48 43 51 54 46 52 48 49 37 44 63
Somewhat dissatisfied 16 15 16 13 23 16 13 12 23 16 8 14 16 15 15 22 10 13
Very dissatisfied 3 3 3 3 6 3 2 3 4 3 3 3 6 3 3 3 6 6
Not sure 0 0 1 1 0 1 0 0 1 1 0 0 1 1 1 0 2 0
Present textbooks
Very satisfied 24 24 24 17 24 22 29 31 18 21 25 31 15 25 23 34 30 13
Somewhat satisfied 46 47 38 46 43 47 47 47 42 46 49 44 44 46 45 44 44 63
Somewhat dissatisfied 20 19 23 23 19 20 16 18 25 20 19 16 22 20 21 14 20 13
Very dissatisfied 9 8 11 12 13 10 4 4 12 12 5 6 17 7 9 8 7 13
Not sure 2 1 3 1 2 1 3 1 2 2 1 2 2 2 2 0 0 0
Relationships with other
teachers
Very satisfied 68 69 59 67 59 66 75 72 65 65 71 69 64 67 68 58 66 72
Somewhat satisfied 28 28 33 28 33 31 22 26 29 29 25 29 30 28 28 32 27 25
Somewhat dissatisfied 3 3 4 3 6 3 1 1 5 4 3 1 3 3 3 3 5 3
Very dissatisfied 1 1 2 1 2 0 1 1 1 1 2 1 1 1 1 7 0 0
Not sure 0 0 2 1 0 0 0 0 1 0 0 0 1 0 1 0 2 0
Gender RacePreparation RouteAll
Years of Experience Age
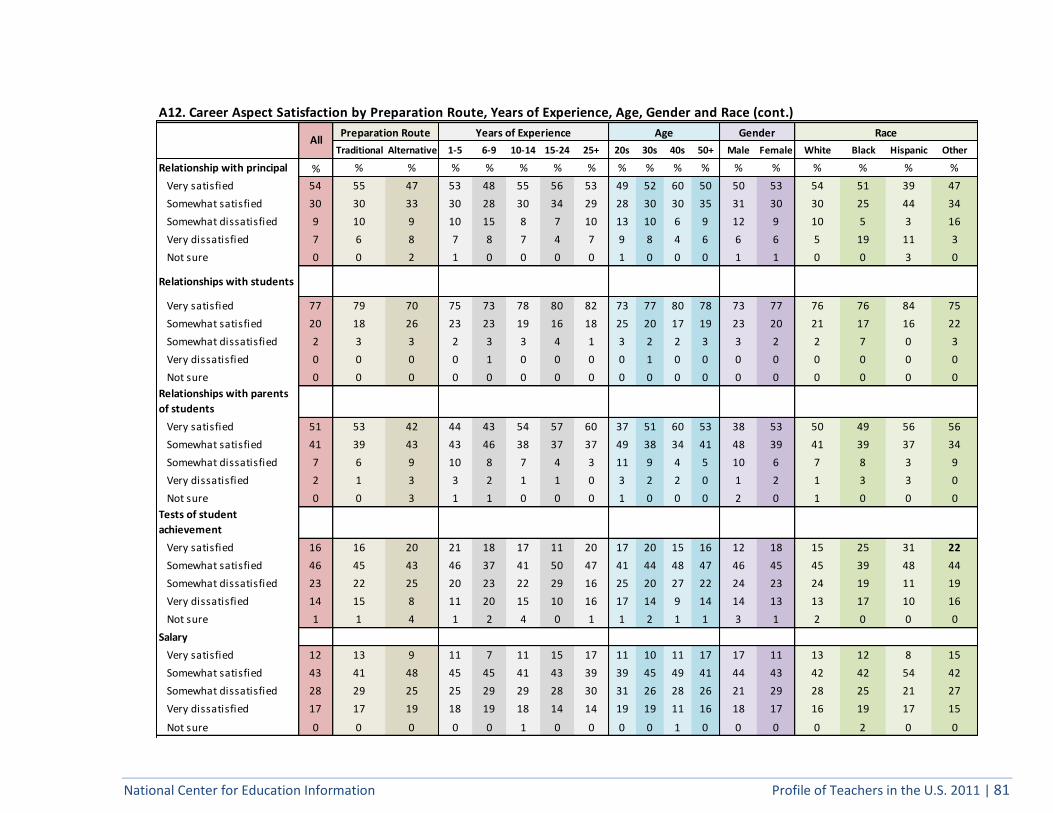
National Center for Education Information Profile of Teachers in the U.S. 2011 | 81
A12. Career Aspect Satisfaction by Preparation Route, Years of Experience, Age, Gender and Race (cont.)
Traditional Alternative 1-5 6-9 10-14 15-24 25+ 20s 30s 40s 50+ Male Female White Black Hispanic Other
Relationship with principal % % % % % % % % % % % % % % % % % %
Very satisfied 54 55 47 53 48 55 56 53 49 52 60 50 50 53 54 51 39 47
Somewhat satisfied 30 30 33 30 28 30 34 29 28 30 30 35 31 30 30 25 44 34
Somewhat dissatisfied 9 10 9 10 15 8 7 10 13 10 6 9 12 9 10 5 3 16
Very dissatisfied 7 6 8 7 8 7 4 7 9 8 4 6 6 6 5 19 11 3
Not sure 0 0 2 1 0 0 0 0 1 0 0 0 1 1 0 0 3 0
Relationships with students
Very satisfied 77 79 70 75 73 78 80 82 73 77 80 78 73 77 76 76 84 75
Somewhat satisfied 20 18 26 23 23 19 16 18 25 20 17 19 23 20 21 17 16 22
Somewhat dissatisfied 2 3 3 2 3 3 4 1 3 2 2 3 3 2 2 7 0 3
Very dissatisfied 0 0 0 0 1 0 0 0 0 1 0 0 0 0 0 0 0 0
Not sure 0 0 0 0 0 0 0 0 0 0 0 0 0 0 0 0 0 0
Relationships with parents
of students
Very satisfied 51 53 42 44 43 54 57 60 37 51 60 53 38 53 50 49 56 56
Somewhat satisfied 41 39 43 43 46 38 37 37 49 38 34 41 48 39 41 39 37 34
Somewhat dissatisfied 7 6 9 10 8 7 4 3 11 9 4 5 10 6 7 8 3 9
Very dissatisfied 2 1 3 3 2 1 1 0 3 2 2 0 1 2 1 3 3 0
Not sure 0 0 3 1 1 0 0 0 1 0 0 0 2 0 1 0 0 0
Tests of student
achievement
Very satisfied 16 16 20 21 18 17 11 20 17 20 15 16 12 18 15 25 31 22
Somewhat satisfied 46 45 43 46 37 41 50 47 41 44 48 47 46 45 45 39 48 44
Somewhat dissatisfied 23 22 25 20 23 22 29 16 25 20 27 22 24 23 24 19 11 19
Very dissatisfied 14 15 8 11 20 15 10 16 17 14 9 14 14 13 13 17 10 16
Not sure 1 1 4 1 2 4 0 1 1 2 1 1 3 1 2 0 0 0
Salary
Very satisfied 12 13 9 11 7 11 15 17 11 10 11 17 17 11 13 12 8 15
Somewhat satisfied 43 41 48 45 45 41 43 39 39 45 49 41 44 43 42 42 54 42
Somewhat dissatisfied 28 29 25 25 29 29 28 30 31 26 28 26 21 29 28 25 21 27
Very dissatisfied 17 17 19 18 19 18 14 14 19 19 11 16 18 17 16 19 17 15
Not sure 0 0 0 0 0 1 0 0 0 0 1 0 0 0 0 2 0 0
Gender RaceAll
Preparation Route Years of Experience Age

82 | Profile of Teachers in the U.S 2011 National Center for Education Information
A12. Career Aspect Satisfaction by Preparation Route, Years of Experience, Age, Gender and Race (cont.)
Traditional Alternative 1-5 6-9 10-14 15-24 25+ 20s 30s 40s 50+ Male Female White Black Hispanic Other
Status of teachers in this
community %% % % % % % % % % % % % % % % % %
Very satisfied 17 18 19 21 17 14 15 19 17 17 16 19 14 18 18 10 22 12
Somewhat satisfied 43 41 45 45 39 39 42 41 45 40 47 43 40 43 43 47 49 39
Somewhat dissatisfied 25 27 22 23 28 25 29 24 27 25 23 25 27 25 26 28 16 21
Very dissatisfied 13 13 12 9 15 20 13 14 10 17 12 12 18 12 13 12 11 27
Not sure 1 1 2 1 1 1 1 2 1 1 2 2 1 2 1 3 2 0
Professional development
opportunities
Very satisfied 26 26 26 29 25 18 24 31 29 20 25 31 20 27 26 22 30 24
Somewhat satisfied 46 45 50 43 43 50 51 46 42 49 49 45 47 46 45 54 54 52
Somewhat dissatisfied 21 21 15 21 21 23 20 16 23 22 20 17 24 19 22 14 10 12
Very dissatisfied 7 6 7 6 11 8 6 6 6 8 6 6 8 7 6 8 6 12
Not sure 0 1 2 1 0 1 0 1 1 0 0 1 1 1 1 2 0 0
Quality of professional
development received
Very satisfied 22 22 26 25 19 18 22 29 23 20 20 27 16 24 22 21 32 18
Somewhat satisfied 47 48 45 45 42 51 52 46 45 44 52 48 40 48 47 50 44 45
Somewhat dissatisfied 22 21 19 20 23 26 20 16 24 25 22 16 30 19 22 21 16 24
Very dissatisfied 8 8 8 7 14 5 6 9 7 11 5 9 12 7 8 7 6 12
Not sure 1 1 3 2 1 0 1 1 2 0 0 1 1 1 1 2 2 0
AllPreparation Route Years of Experience Age Gender Race

National Center for Education Information Profile of Teachers in the U.S. 2011 | 83
A13. Communities Teachers Teach/Are Willing to Teach in by Preparation Route, Years of Experience, Age, Gender and Race
A13. Communities Teachers Teach/Are Willing to Teach in by Preparation Route, Years of Experience, Age, Gender and Race
Traditional Alternative 1-5 6-9 10-14 15-24 25+ 20s 30s 40s 50+ Male Female White Black Hispanic Other
Community Taught in % % % % % % % % % % % % % % % % % %
Rural 23 23 17 16 15 19 29 28 19 20 23 27 20 22 24 17 10 15
Town 19 20 20 19 17 20 17 26 14 18 16 22 13 21 20 3 19 15
City 31 31 39 40 36 29 27 26 41 31 33 29 35 32 28 59 56 45
Suburb 26 27 24 25 32 32 26 20 25 31 28 21 31 25 28 20 16 24Community Willing to Teach
in
Rural 75 76 69 73 68 78 77 78 74 71 73 81 73 74 79 62 44 64
Town 83 85 78 86 81 84 82 83 86 83 78 86 86 82 86 73 62 79
City 62 63 70 75 66 63 57 53 77 65 56 57 66 63 62 85 70 67
Suburb 78 80 77 83 85 79 75 74 80 83 77 73 86 77 80 73 64 82
AllPreparation Route Years of Experience Age Gender Race

84 | Profile of Teachers in the U.S 2011 National Center for Education Information
A14. Likelihood to Move to Meet the Demand for Teachers by Preparation Route, Years of Experience, Age, Gender and Race
A14. Likelihood to Move to Meet the Demand for Teachers by Preparation Route, Years of Experience, Age, Gender and Race
Traditional Alternative 1-5 6-9 10-14 15-24 25+ 20s 30s 40s 50+ Male Female White Black Hispanic Other
Rural area within the
state% % % % % % % % % % % % % % % % % %
Very likely 17 16 17 18 14 14 14 15 17 14 16 17 18 16 17 17 17 12
Somewhat likely 25 28 24 32 25 34 21 19 34 31 22 21 26 27 26 31 22 36
Somewhat unlikely 17 16 21 20 19 16 15 11 23 17 15 15 21 17 16 24 21 18
Very unlikely 37 35 34 24 36 30 45 52 21 32 41 44 32 35 36 24 32 33
Not sure 5 5 5 7 5 6 6 3 5 6 5 4 3 6 5 5 8 0
Large metropolitan city
within the state
Very likely 11 11 18 18 11 10 7 8 16 14 12 7 16 12 10 34 21 21
Somewhat likely 23 22 26 33 26 26 15 12 35 31 20 14 25 24 23 25 24 39
Somewhat unlikely 16 17 17 16 20 15 18 17 18 15 15 16 17 17 16 20 17 12
Very unlikely 45 45 33 27 39 42 56 60 25 36 49 58 37 43 46 19 29 27
Not sure 5 5 6 7 3 6 5 3 5 4 5 4 5 5 5 2 10 0
Rural area out of state
Very likely 7 7 8 8 4 6 7 9 6 6 5 9 10 7 7 12 11 12
Somewhat likely 16 17 15 18 18 19 16 12 20 16 16 16 19 17 17 19 10 9
Somewhat unlikely 15 13 19 18 13 12 13 13 19 12 18 12 26 13 13 29 22 18
Very unlikely 57 56 53 50 61 53 58 63 49 59 54 58 42 57 57 32 49 61
Not sure 6 6 4 7 4 9 6 3 5 7 6 4 3 6 5 8 8 0
Large metropolitan city
out of state
Very likely 6 6 12 12 5 5 3 8 12 7 5 6 11 7 6 24 15 9
Somewhat likely 14 13 17 17 19 14 12 5 18 16 14 9 14 14 13 19 13 30
Somewhat unlikely 15 14 19 18 16 13 12 14 22 13 14 12 20 15 14 25 24 15
Very unlikely 60 60 47 45 56 61 68 70 43 57 62 68 51 58 62 25 39 45
Not sure 6 6 5 8 5 7 6 3 5 6 5 5 5 6 5 7 10 0
RaceAll
Preparation Route Years of Experience Age Gender

National Center for Education Information Profile of Teachers in the U.S. 2011 | 85
A15. Dista nce from Place of Birth by Preparation Route, Years of Experience, Age, Gender and Race
A15. Distance from Place of Birth by Preparation Route, Years of Experience, Age, Gender and Race
Traditional Alternative 1-5 6-9 10-14 15-24 25+ 20s 30s 40s 50+ Male Female White Black Hispanic Other
Completed undergraduate
college education within
150 miles of place of birth% % % % % % % % % % % % % % % % % %
Yes 59 57 37 54 51 49 61 53 66 54 56 52 45 55 55 51 53 52
No 41 43 63 46 49 51 39 47 34 46 44 48 55 45 45 49 47 48
Now teaching within 150
miles of place of birth
Yes 66 68 66 76 66 79 71 36 67 76 80 47 64 68 70 45 53 64
No 34 32 34 24 34 21 29 64 33 24 20 53 36 32 30 55 47 36
RaceAll
Preparation Route Years of Experience Age Gender

86 | Profile of Teachers in the U.S 2011 National Center for Education Information
A16. What Teachers Ex pect to Be D oing i n Five Years by Pre paration Route , Years of Experience, Age , Gender and Race
A16. What Teachers Expect to Be Doing in Five Years by Preparation Route, Years of Experience, Age, Gender and Race
Traditional Alternative 1-5 6-9 10-14 15-24 25+ 20s 30s 40s 50+ Male Female White Black Hispanic Other
% % % % % % % % % % % % % % % % % %
Teaching K-12 66 68 66 76 66 79 71 36 67 76 80 47 64 68 70 45 53 64
Teaching postsecondary 6 5 12 6 11 5 5 3 5 8 9 4 8 6 5 20 8 9
Employed in an occupation
in education, other than
teaching
14 13 24 21 21 17 9 5 26 18 13 6 21 15 14 25 25 12
Employed in an occupation
outside of education5 4 8 5 7 3 5 3 7 5 5 4 3 5 4 10 14 6
In military service 0 0 0 0 0 0 0 0 0 0 0 0 0 0 0 0 0 0
Homemaking and/or child
rearing full-time3 3 3 4 8 0 1 0 8 3 1 0 0 3 3 2 0 3
Attending a college or
university full-time1 1 1 2 1 1 0 1 1 2 1 0 1 1 1 2 5 0
Unemployed and seeking
work0 0 1 0 1 0 0 0 0 0 0 0 1 0 0 0 0 0
Retired from job other than
teaching0 0 0 0 0 0 0 1 0 0 0 0 0 0 0 0 0 0
Retired from teaching 15 16 2 1 1 3 18 58 1 0 4 44 13 13 14 12 9 15
Gender RacePreparation RouteAll
Years of Experience Age