profile of veterans: 2009 - united states department of ...the largest cohort of male veterans...
TRANSCRIPT

Profile of Veterans: 2014 Data from the American Community Survey
Prepared by the National Center for Veterans Analysis and Statistics
March 2016
NCVAS National Center for Veterans Analysis and Statistics

Data Source and Methods • Data for this analysis come from the 2014 American Community Survey (ACS) Public Use
Microdata Sample • The ACS is an ongoing survey that provides annual data on the social and economic characteristics of
the U.S. population. • The ACS uses a series of monthly samples to produce annually updated data for the same small areas
(census tracts and block groups)formerly surveyed via the decennial census long-form sample.
• The universe for this analysis is the civilian population 17 years and older living in the United States and Puerto Rico • This universe includes a weighted estimate of 19.4 million Veterans, of which 1.6 million were women. • The universe includes a weighted estimate of 251.4 million civilian population, of which 232 million
were non-Veterans.
• All comparative statements have undergone statistical testing and are significant at the
90-percent confidence level. • A “statistically significant difference” simply means there is statistical evidence that there is a
difference; it does not mean the difference is necessarily large, important or significant in the usual sense of the word.’
• A “no statistically significant difference” means that there is statistical evidence that there is no difference in the comparative percentages/rates.
• For more information about the ACS, see: http://www.census.gov/acs/www/
2 Prepared by the National Center of Veterans Analysis and Statistics

Veteran and Non-Veteran Comparisons
Veterans = 19,386,589
Non-Veterans = 231,986,987
3

Male Veterans Male Non-Veterans
Source: U.S. Census Bureau, American Community Survey PUMS, 2014 Prepared by the National Center for Veterans Analysis and Statistics
Age Distribution of Men (in percent)
Male Veterans on average are older than non-Veteran men. In 2014, the median age of male Veterans was 64 and the median age of male non-Veterans was 41.
4
1.3
6.4 8.4
13.7
18.7
27.0
16.6
7.8
17.3
19.7 18.1 18.3
15.5
7.4
2.9
0.6
Female Veterans Female Non-Veterans
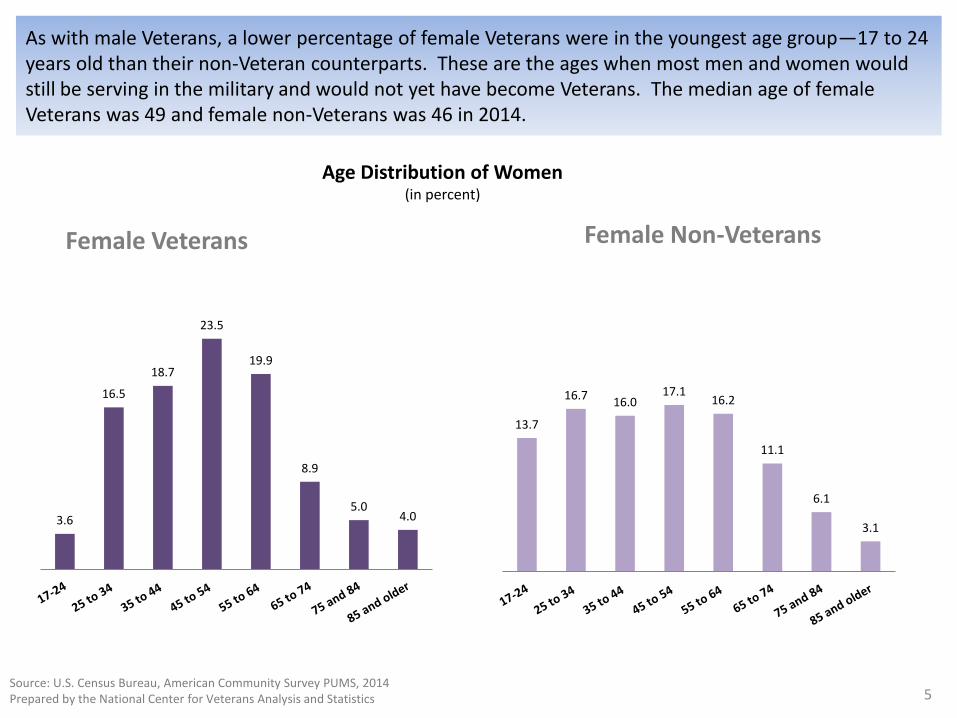
As with male Veterans, a lower percentage of female Veterans were in the youngest age group—17 to 24 years old than their non-Veteran counterparts. These are the ages when most men and women would still be serving in the military and would not yet have become Veterans. The median age of female Veterans was 49 and female non-Veterans was 46 in 2014.
Age Distribution of Women (in percent)
Source: U.S. Census Bureau, American Community Survey PUMS, 2014 Prepared by the National Center for Veterans Analysis and Statistics 5
3.6
16.5
18.7
23.5
19.9
8.9
5.0 4.0
13.7
16.7 16.0
17.1 16.2
11.1
6.1
3.1

Male Veterans are more likely to be White not Hispanic than male non-Veterans. Female Veterans are more likely to be Nonwhite not Hispanic than non-Veteran women. Both male and female Veterans are less likely to be Hispanic than their non-Veteran counterparts.
Men Women
Source: U.S. Census Bureau, American Community Survey PUMS, 2014 Prepared by the National Center for Veterans Analysis and Statistics
Race Distribution (in percent)
Note: “Nonwhite” includes Black, American Indian/Alaska Native, Native Hawaiian and Other Pacific Islander, some other race, and two or more races.
Veteran Non-Veteran Veteran Non-Veteran
6
79.4
14.2
6.4
61.7
19.8 18.5
White Non-Hispanic Nonwhite Non-Hispanic Hispanic
67.3
24.5
8.2
63.8
20.3
15.9
White Non-Hispanic Nonwhite Non-Hispanic Hispanic

Men Women
Source: U.S. Census Bureau, American Community Survey PUMS, 2014 Prepared by the National Center for Veterans Analysis and Statistics
Veteran Non-Veteran Veteran Non-Veteran
Marital Status Distribution (in percent)
Male Veterans were more likely to be married and less likely to have never married compared with non-Veteran men. Female Veterans were more likely to be widowed than
non-Veteran women.
7
65.4
9.9
14.9
9.8
48.6
3.6
9.2
38.6
Married Divorced orSeparated
Widowed Never married
49.9
11.0
22.6
16.5
47.4
11.8 12.6
28.2
Married Divorced orSeparated
Widowed Never married

Occupation of Employed Men (in percent)
Class of Worker of Employed Men (in percent)
Veteran Non-Veteran Veteran Non-Veteran
A higher percentage of male Veterans were in management and professional occupations compared with male non-Veterans in 2014. These include occupations such as engineers, educators, doctors, and various types of managers. The percentage of male Veterans working for local, state, or Federal government was about twice that of male non-Veterans.
Source: U.S. Census Bureau, American Community Survey PUMS, 2014 Prepared by the National Center for Veterans Analysis and Statistics
Note: (1) “All Other” includes Farming, fishing, and forestry; construction, extraction, maintenance, and repair. (2) No significant difference between Veteran and male non-Veteran by self-employed.
8
34.9
19.2 16.4 15.1 14.4
33.3
18.1 17.2 16.3 15.2
Management,professional
Production,transportation
Sales, office All other Service
65.6
22.9
11.6
78.0
10.5 11.5
Private Government Self-employed
Occupation of Employed Women (in percent)
Class of Worker of Employed Women (in percent)
Veteran Non-Veteran Veteran Non-Veteran
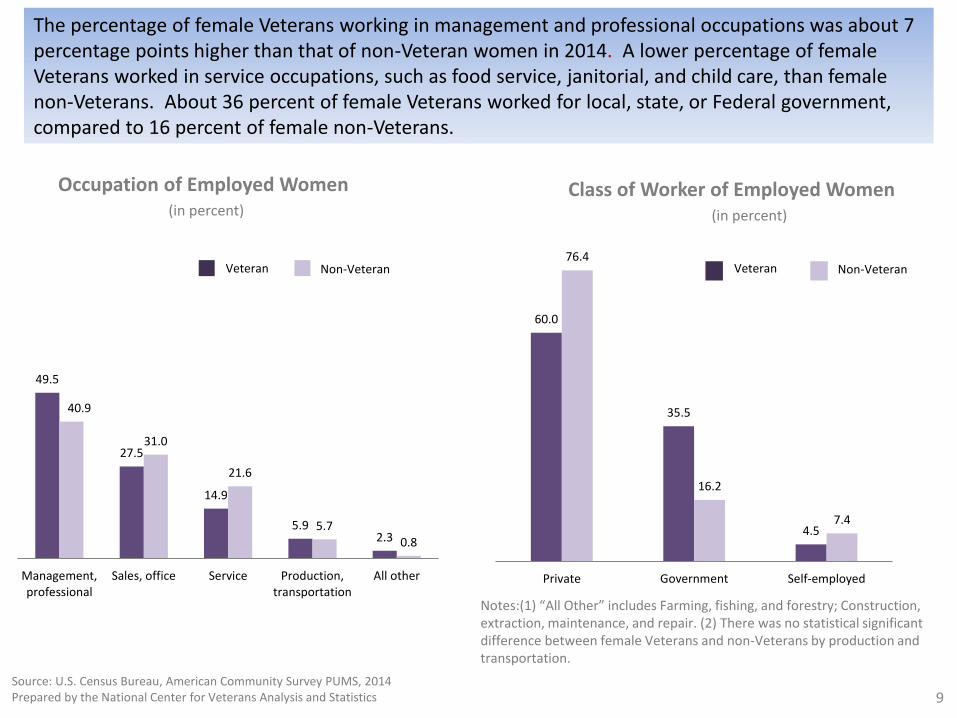
The percentage of female Veterans working in management and professional occupations was about 7 percentage points higher than that of non-Veteran women in 2014. A lower percentage of female Veterans worked in service occupations, such as food service, janitorial, and child care, than female non-Veterans. About 36 percent of female Veterans worked for local, state, or Federal government, compared to 16 percent of female non-Veterans.
Source: U.S. Census Bureau, American Community Survey PUMS, 2014 Prepared by the National Center for Veterans Analysis and Statistics
Notes:(1) “All Other” includes Farming, fishing, and forestry; Construction, extraction, maintenance, and repair. (2) There was no statistical significant difference between female Veterans and non-Veterans by production and transportation.
9
49.5
27.5
14.9
5.9 2.3
40.9
31.0
21.6
5.7 0.8
Management,professional
Sales, office Service Production,transportation
All other
60.0
35.5
4.5
76.4
16.2
7.4
Private Government Self-employed

Men Women Veteran Non-Veteran Veteran Non-Veteran
Both male and female Veterans were more likely to have a combination of public and private health insurance coverage compared with their non-Veteran counterparts. The high percentage of male Veterans in this category was likely due to Medicare, use of VA health care and second career after retirement than non-Veterans. Male and female Veterans had lower uninsured rates than non-Veterans in 2014.
Source: U.S. Census Bureau, American Community Survey PUMS, 2014 Prepared by the National Center for Veterans Analysis and Statistics
Health Insurance Coverage Distribution (in percent)
10
28.3
24.6
43.1
4.0
59.0
15.5
7.7
17.7
Private only Public only Public and private No coverage
48.6
18.5
28.4
4.4
54.2
20.5
13.6 11.8
Private only Public only Public andprivate
No coverage

Men Women Veteran Non-Veteran Veteran Non-Veteran
In 2014, a lower percentage of both male and female Veterans lived below 100 percent of poverty compared with their non-Veteran counterparts.
Poverty Level Distributions (in percent)
Source: U.S. Census Bureau, American Community Survey PUMS, 2014 Prepared by the National Center for Veterans Analysis and Statistics 11
There is no statistical difference in percentages between women Veterans and women non-Veterans in the 200 to 299 percent poverty level.
6.7 6.8 8.2
17.5 15.7
45.1
12.9
8.4 8.7
16.6
13.6
39.8
0 to 99percent
100 to 149percent
150 to 199percent
200 to 299percent
300 to 399percent
400 percentor higher
9.4 7.5 8.2
17.0 15.3
42.6
15.6
9.5 9.3
16.5
13.2
36.0
0 to 99percent
100 to 149percent
150 to 199percent
200 to 299percent
300 to 399percent
400 percentor higher
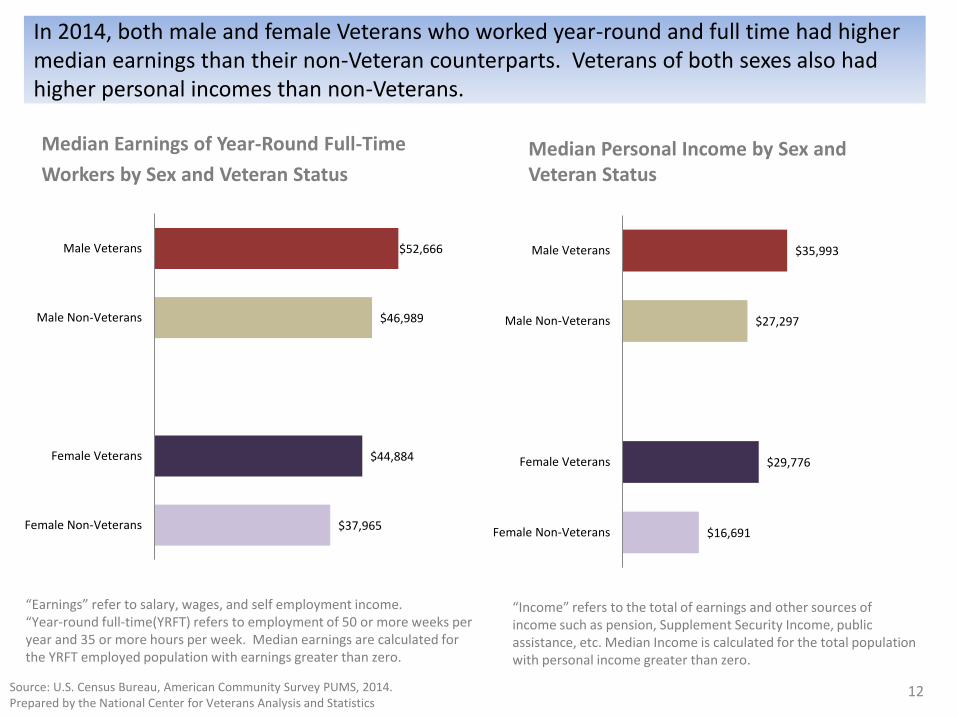
In 2014, both male and female Veterans who worked year-round and full time had higher median earnings than their non-Veteran counterparts. Veterans of both sexes also had higher personal incomes than non-Veterans.
Median Earnings of Year-Round Full-Time
Workers by Sex and Veteran Status Median Personal Income by Sex and Veteran Status
Source: U.S. Census Bureau, American Community Survey PUMS, 2014. Prepared by the National Center for Veterans Analysis and Statistics
“Earnings” refer to salary, wages, and self employment income. “Year-round full-time(YRFT) refers to employment of 50 or more weeks per year and 35 or more hours per week. Median earnings are calculated for the YRFT employed population with earnings greater than zero.
“Income” refers to the total of earnings and other sources of income such as pension, Supplement Security Income, public assistance, etc. Median Income is calculated for the total population with personal income greater than zero.
12
$52,666
$46,989
$44,884
$37,965
Male Veterans
Male Non-Veterans
Female Veterans
Female Non-Veterans
$35,993
$27,297
$29,776
$16,691
Male Veterans
Male Non-Veterans
Female Veterans
Female Non-Veterans
Veteran Comparisons
Male Veterans = 17,790,975
Female Veterans= 1,595,614
13

The largest cohort of male Veterans served during the Vietnam Era while the largest cohort of female Veterans served during Gulf War II.
Male Veterans Female Veterans
Note: Periods of service shown here are coded with multiple dispersed into categories with most recent
period of service. Source: U.S. Census Bureau, American Community Survey PUMS, 2014 Prepared by the National Center for Veterans Analysis and Statistics
Period of Military Service of Veterans (in percent)
14
Period of Service Dates: Post 9/11: Sept. 2001 to present; Pre 9/11: Aug. 1990 to Aug. 2001; Vietnam Era: Aug.1964 to April 1975; Korean War: July 1950 to Jan. 1955; World War II: Dec. 1941 to Dec, 1946; Peacetimes: Jan. 1947 to June 1950; Feb. 1955 to July 1964 and May 1975 to July 1990.
32.3
25.2
22.8
13.5
3.1 3.0
14.0
22.7
12.2
36.1
5.3
9.7

In 2014, a higher percentage of female Veterans had completed some college, a Bachelor’s degree or an advanced degree, compared with male Veterans. A higher percentage of
female Veterans than male Veterans in all age groups were enrolled in college.
“Enrolled in College” includes enrollment in graduate years (freshman to senior) or enrollment in graduate or professional school (beyond a Bachelor’s degree).
Source: U.S. Census Bureau, American Community Survey PUMS, 2014 Prepared by the National Center for Veterans Analysis and Statistics
“Educational Attainment” refers to the highest level of education an individual has completed. “Advanced Degree” refers to Master’s, PhD, JD, MD, or other professional degree.
15
Distribution of Education Attainment Enrolled in College by Age
37.4 36.4
15.7
10.6
20.6
45.3
20.1
14.0
High schoolgraduate or less
Some college Bachelor'sdegree
Advanced degree
Male Female
28.1
24.4
6.9
0.8
35.1 32.0
13.8
2.5
17 to 24 years 25 to 34 years 35 to 54 years 55 years or older
Male Female

Source: U.S. Census Bureau, American Community Survey PUMS, 2014 Prepared by the National Center for Veterans Analysis and Statistics
A higher percentage of female Veterans than male Veterans had a service-connected disability rating in 2014. A higher percentage of male Veterans used VA health care but a higher percentage of female Veterans used VA health care only.
Female Male
Selected Characteristics of Veterans (in percent)
16
19.4
32.3
8.8
4.0 2.8
6.7
22.1
28.9
11.5
4.4
7.1
9.4
Has a service connecteddisability
Uses VA Health Care Uses VA Health Careonly
No health Insurancecoverage
No income In poverty
There is no statistical difference in percentage of “No health insurance coverage” between men and women Veterans.

Male Veterans Female Veterans
A higher percentage of female Veterans than male Veterans worked in management and professional and sales and office occupations in 2014. Nineteen percent of male Veterans worked in production and transportation occupations. These occupations include machinists, drivers, and aircraft pilots, jobs similar to what male Veterans may have done while in the military.
Notes: (1) “All other” includes farming, fishing, and forestry; construction, extraction, maintenance, and repair. (2) There was no statistical significant difference between male and female Veterans by service. Source: U.S. Census Bureau, American Community Survey PUMS, 2014
Prepared by the National Center for Veterans Analysis and Statistics
Occupations of Employed Veterans (in percent)
17
34.9
16.4 14.4
19.2
15.1
Management,professional
Sales, office Service Production,transportation
All other
49.5
27.5
14.9
5.9
2.3
Management,professional
Sales, office Service Production,transportation
All other
Summary of Veteran and Non-Veteran Comparisons
According to data from the 2014 American Community Survey, male Veterans were older, more likely
to be White non-Hispanic, more likely to be married, less likely to be uninsured, less likely to live
below poverty, and had higher personal incomes than male non-Veterans. Employed male Veterans
were more likely to work in management and professional occupations, and more likely to work for
local, state, or Federal governments than their non-Veteran counterparts. Male Veterans who worked
year-round and full-time earned about $6,000 more than similar non-Veterans. Some differences
between male Veterans and non-Veterans may be attributable to age. The median age of male
Veterans in 2014 was 64 years while the median age of male non-Veterans was 41 years.
A lower percentage of female Veterans were in the youngest age group—17 to 24 years old than
female non-Veterans. These are the ages when most men and women would still be serving in the
military and would not yet have become Veterans. The median age of female Veterans was 49 and
female non-Veterans was 46 in 2014. Female Veterans were more likely to be Nonwhite non-Hispanic,
more likely to be widowed, less likely to be uninsured, less likely to live below poverty, and had
higher personal incomes than female non-Veterans. Employed female Veterans were more likely to
be in management and professional occupations, less likely to be in sales or service occupations, and
more likely to work in local, state, or Federal government than female non-Veterans. Female Veterans
who worked year-round and full-time earned about $7,000 more than similar non-Veterans.
18

The largest living cohort of male Veterans served during the Vietnam Era (August 1964 to April
1975) while the largest living cohort of female Veterans served during Post 9/11 (September
2001 or later).
Compared with male Veterans, female Veterans were more likely to have completed some
college, a Bachelor’s degree, or an advanced degree, be enrolled in college, more likely to have
a service-connected disability rating, less likely to use VA health care at all but more likely to use
only VA health care, have no earnings or income, and live in poverty.
Employed female Veterans were more likely to work in management and professional
occupations than employed male Veterans.
Some differences between male and female Veterans may be attributable to age as male
Veterans are significantly older than female Veterans. The median age of male Veterans was 64
years in 2014, compared with 49 years for female Veterans.
Summary of Veteran Comparisons
19

Contact Information
Department of Veterans Affairs
Office of Policy and Planning
National Center for Veterans Analysis and Statistics
For general inquiries, please email us at [email protected].
20