profiling android applications
TRANSCRIPT
Profiling
Hubert Hesse
Software Profiling Seminar 2013
1
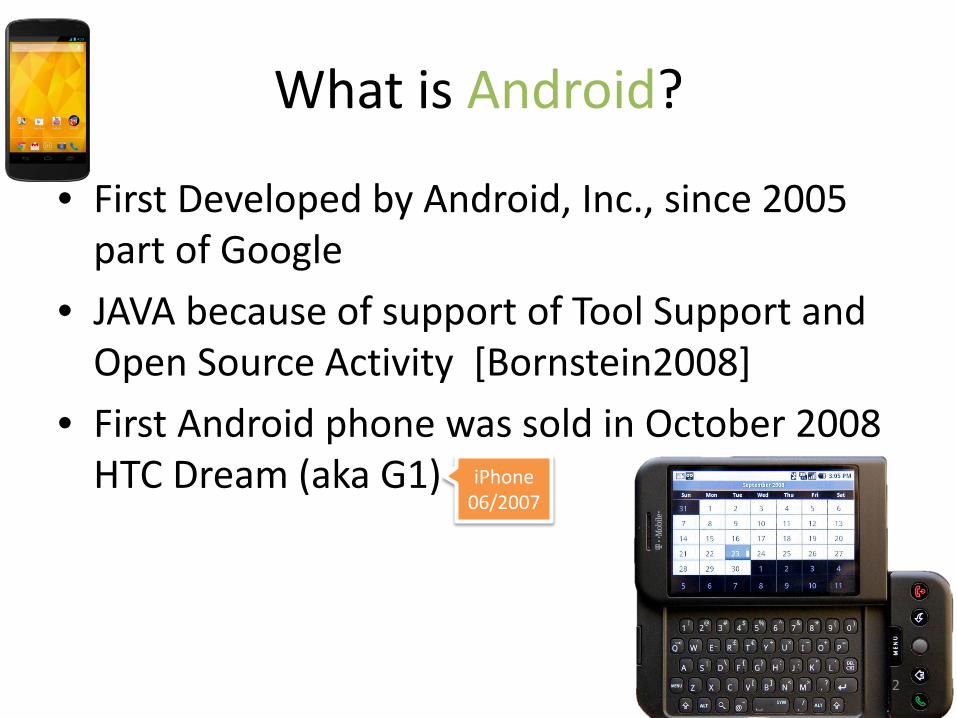
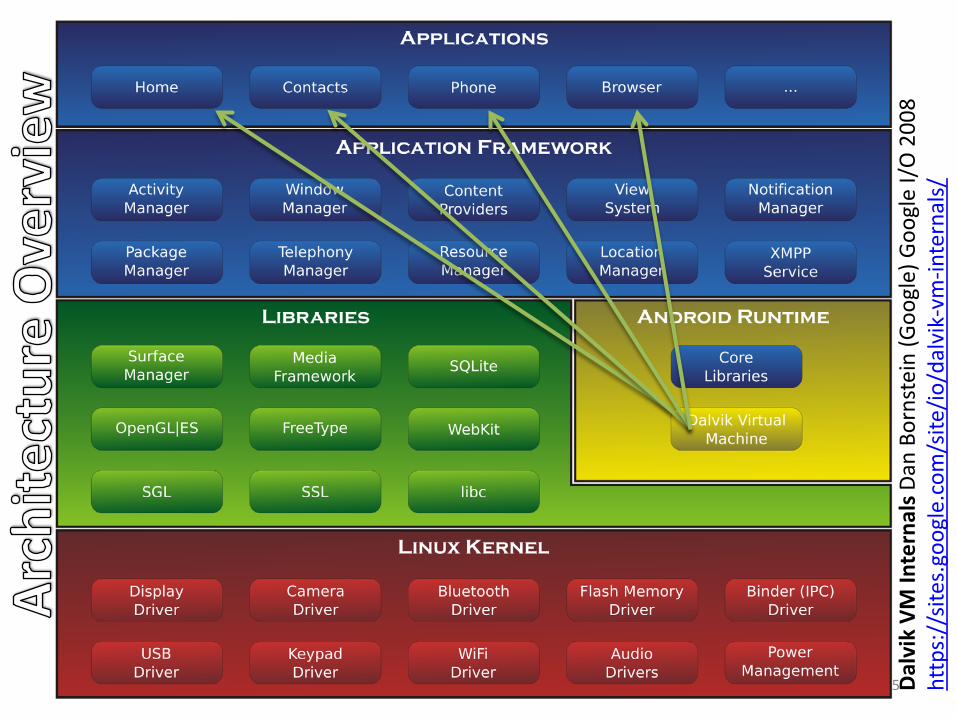
What is Android?
• First Developed by Android, Inc., since 2005 part of Google
• JAVA because of support of Tool Support and Open Source Activity [Bornstein2008]
• First Android phone was sold in October 2008 HTC Dream (aka G1)
iPhone 06/2007
2
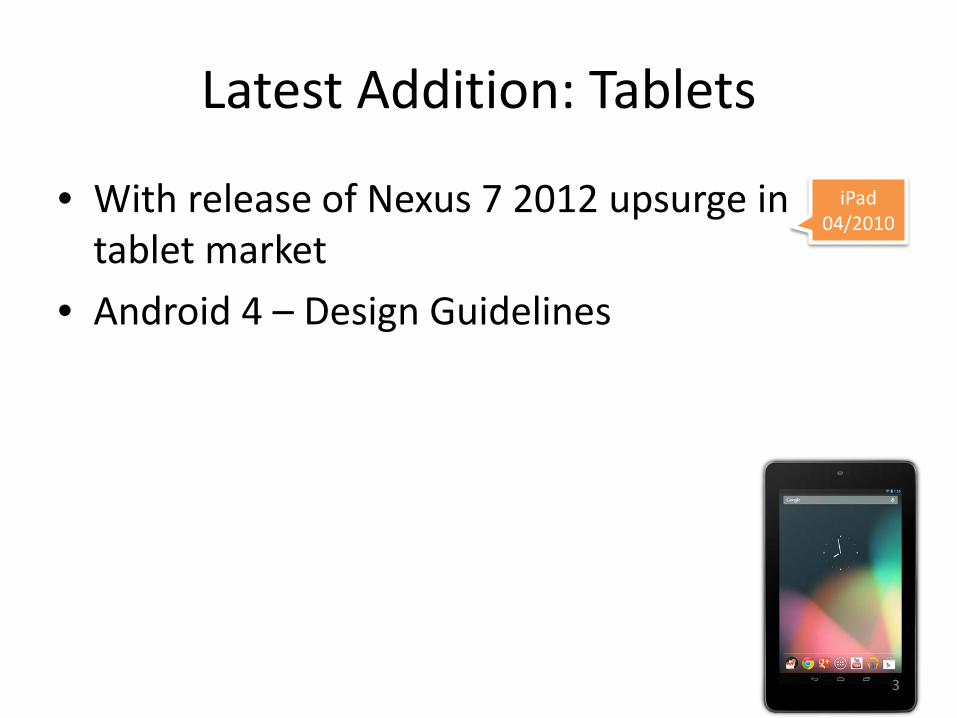
Latest Addition: Tablets
• With release of Nexus 7 2012 upsurge in tablet market
• Android 4 – Design Guidelines
iPad 04/2010
3
Dalvik Executable
• Convert java .class files into .dex format • dx: Java Bytecode -> an alternative instruction
set compatible with Dalvik VM.
Write an Android Applications in any language that compile to .class
4
Dal
vik
VM In
tern
als D
an B
orns
tein
(Goo
gle)
Goo
gle
I/O
200
8 ht
tps:
//sit
es.g
oogl
e.co
m/s
ite/io
/dal
vik-
vm-in
tern
als/
5
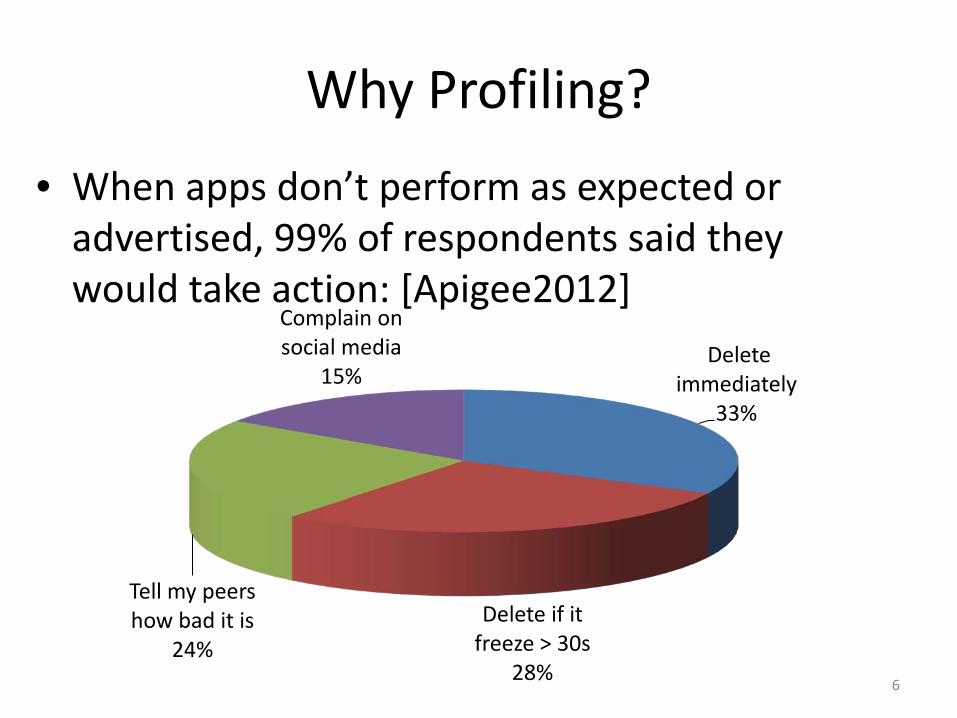
Why Profiling? • When apps don’t perform as expected or
advertised, 99% of respondents said they would take action: [Apigee2012]
Delete immediately
33%
Delete if it freeze > 30s
28%
Tell my peers how bad it is
24%
Complain on social media
15%
6
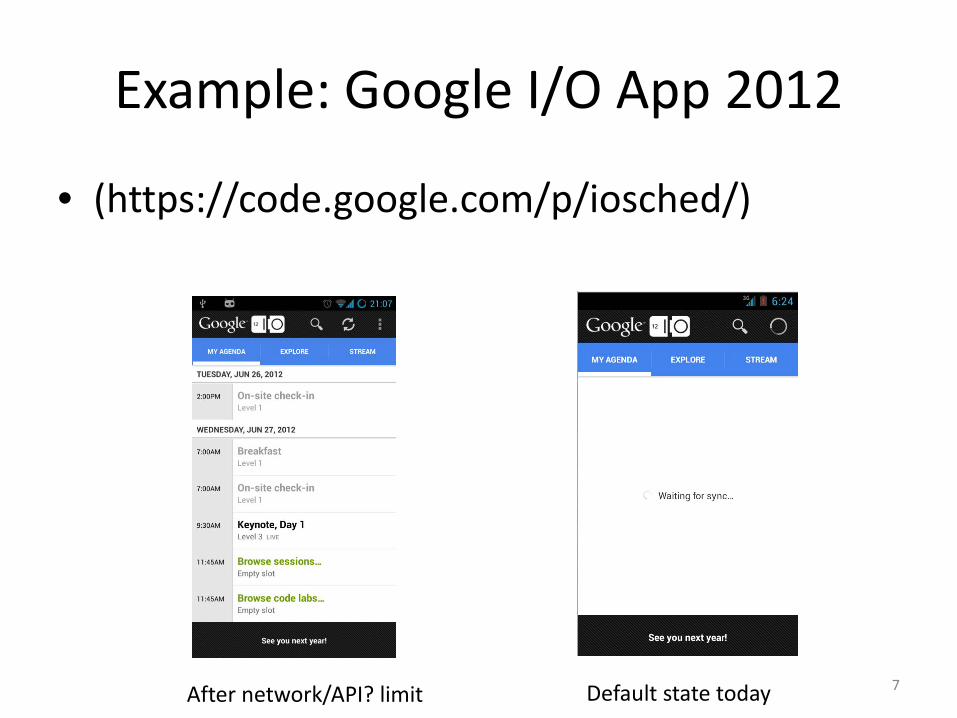
Example: Google I/O App 2012
• (https://code.google.com/p/iosched/)
Default state today After network/API? limit 7
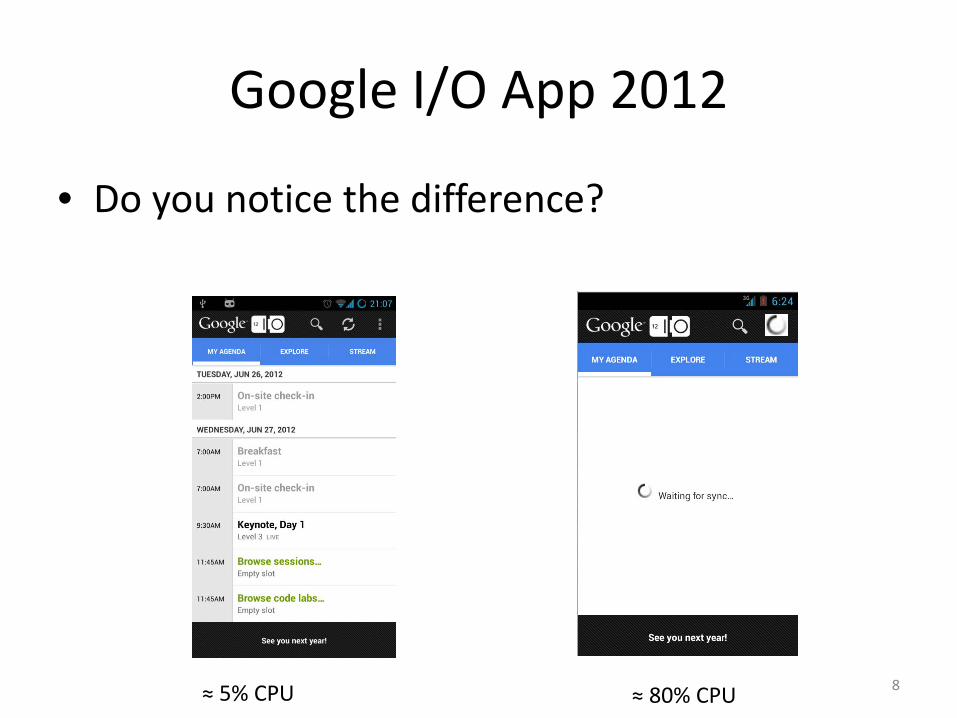
Google I/O App 2012
• Do you notice the difference?
≈ 5% CPU ≈ 80% CPU 8
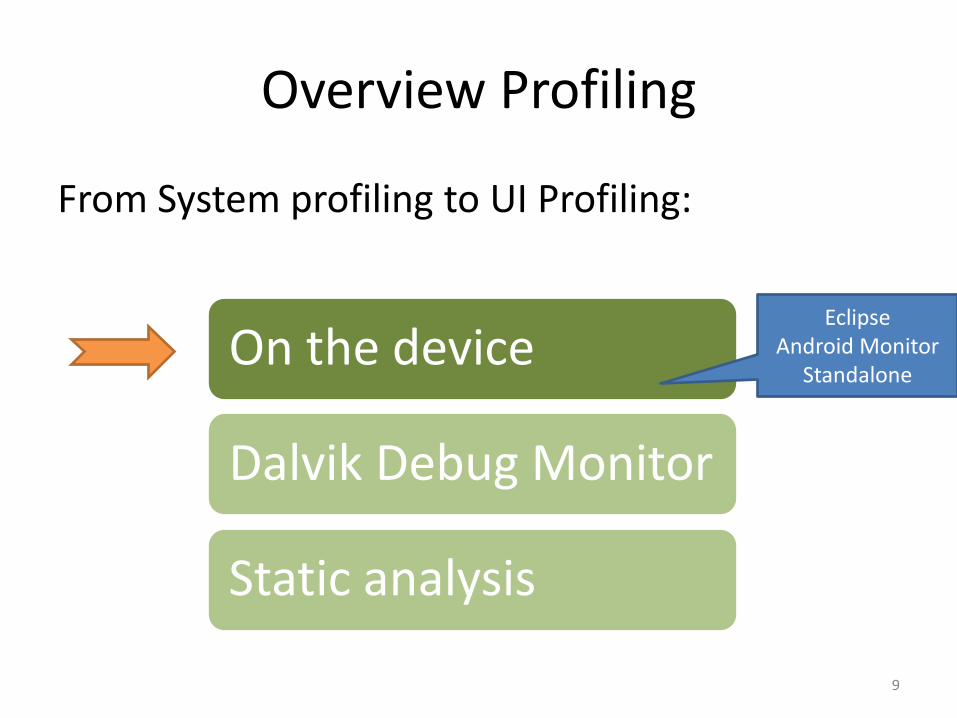
Overview Profiling
From System profiling to UI Profiling: On the device
Dalvik Debug Monitor
Static analysis
9
Eclipse Android Monitor
Standalone
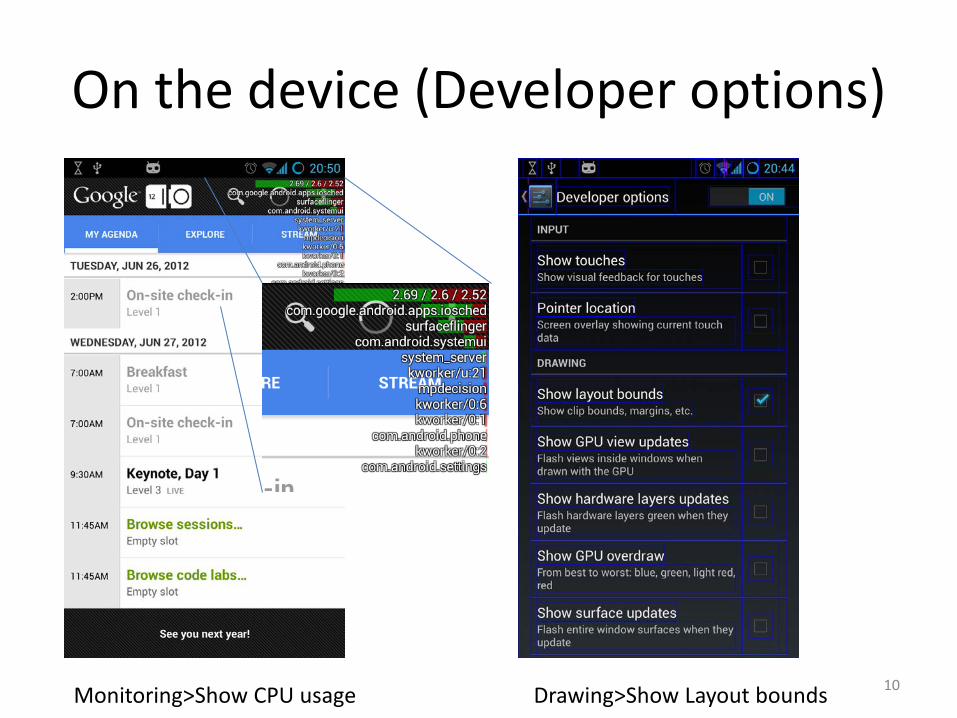
On the device (Developer options)
Monitoring>Show CPU usage Drawing>Show Layout bounds 10
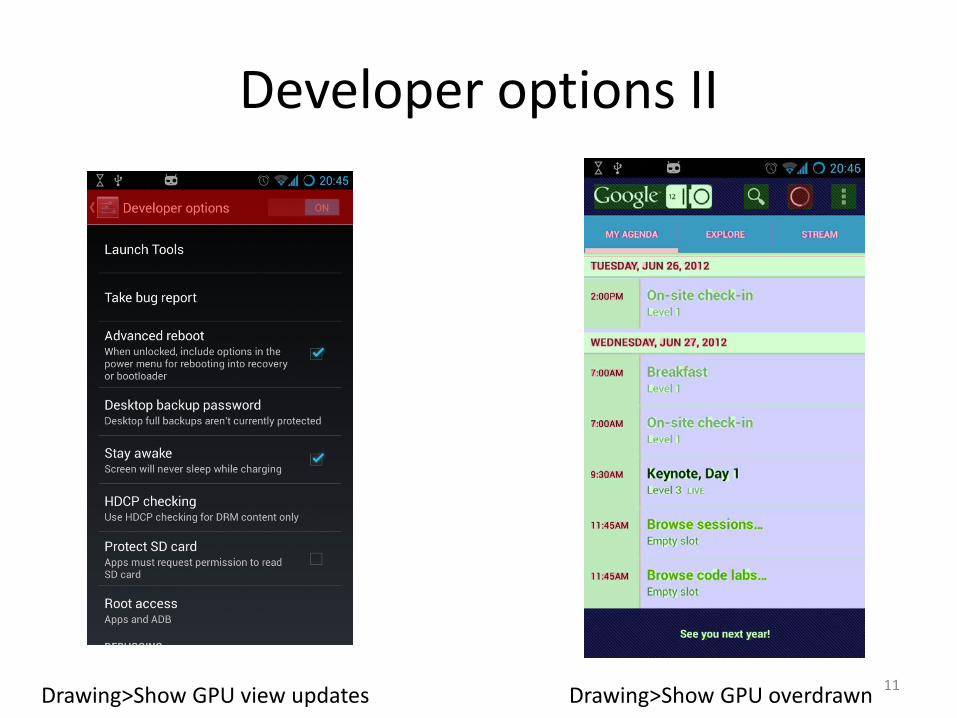
Developer options II
Drawing>Show GPU view updates Drawing>Show GPU overdrawn 11
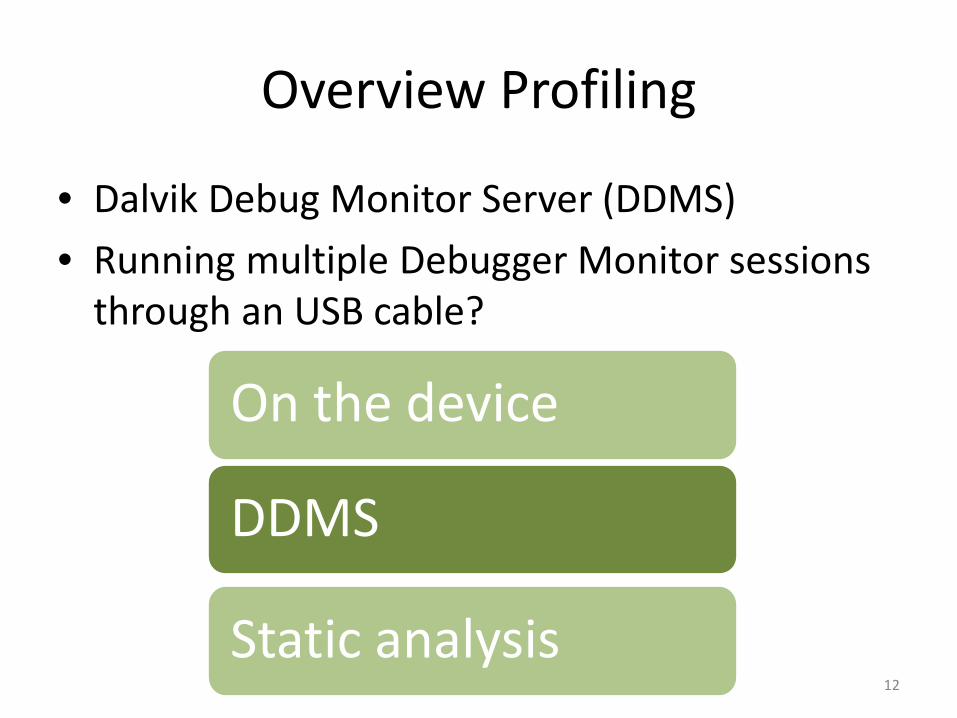
Overview Profiling
• Dalvik Debug Monitor Server (DDMS) • Running multiple Debugger Monitor sessions
through an USB cable?
DDMS
On the device
Static analysis 12
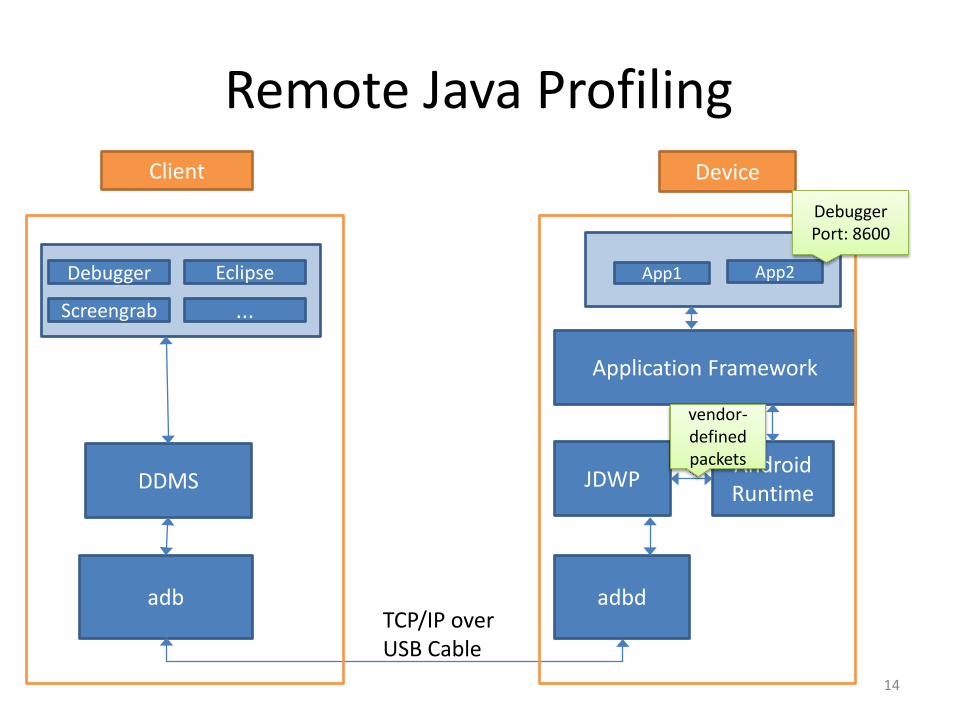
Remote Java Profiling Client Device
adb adbd TCP/IP over USB Cable
DDMS JDWP Android Runtime
Application Framework
App1 App2 Debugger Eclipse
Screengrab ...
vendor-defined packets
14
Debugger Port: 8600

15
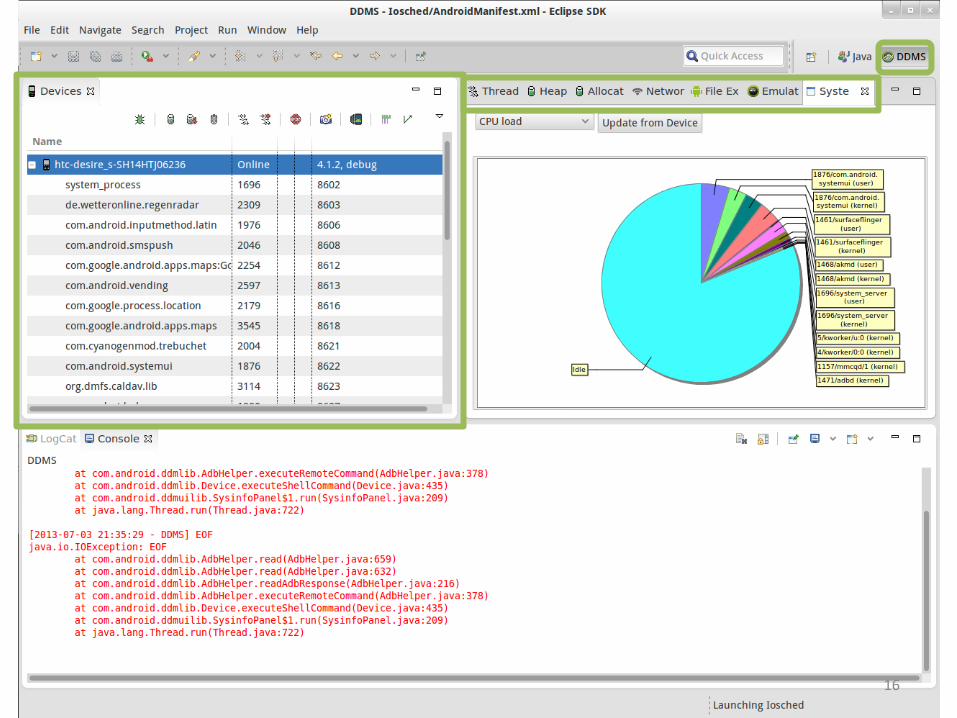
16
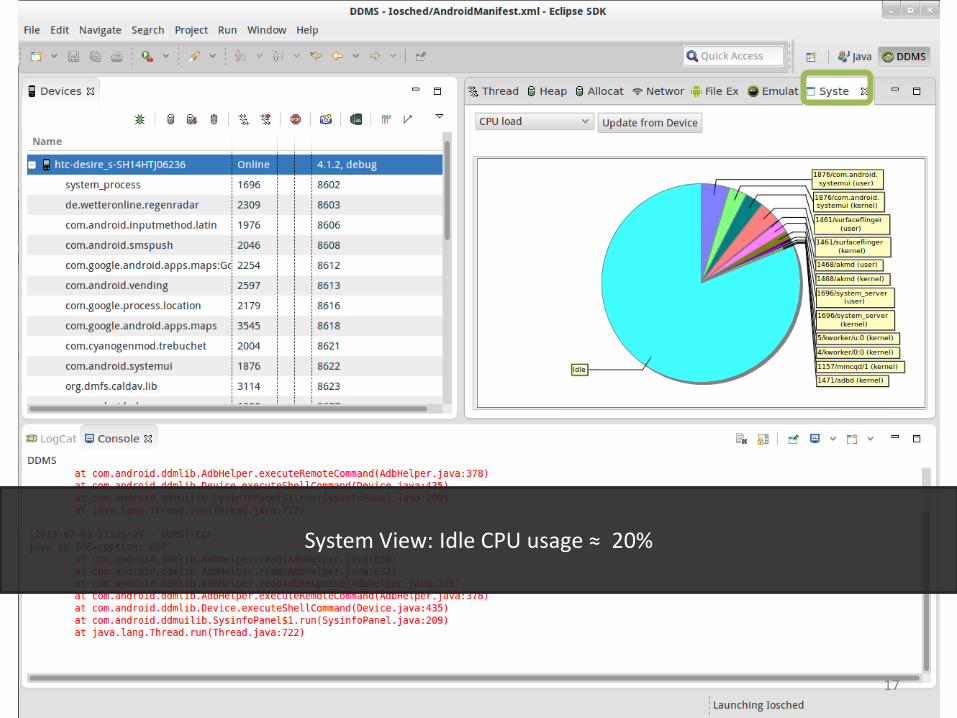
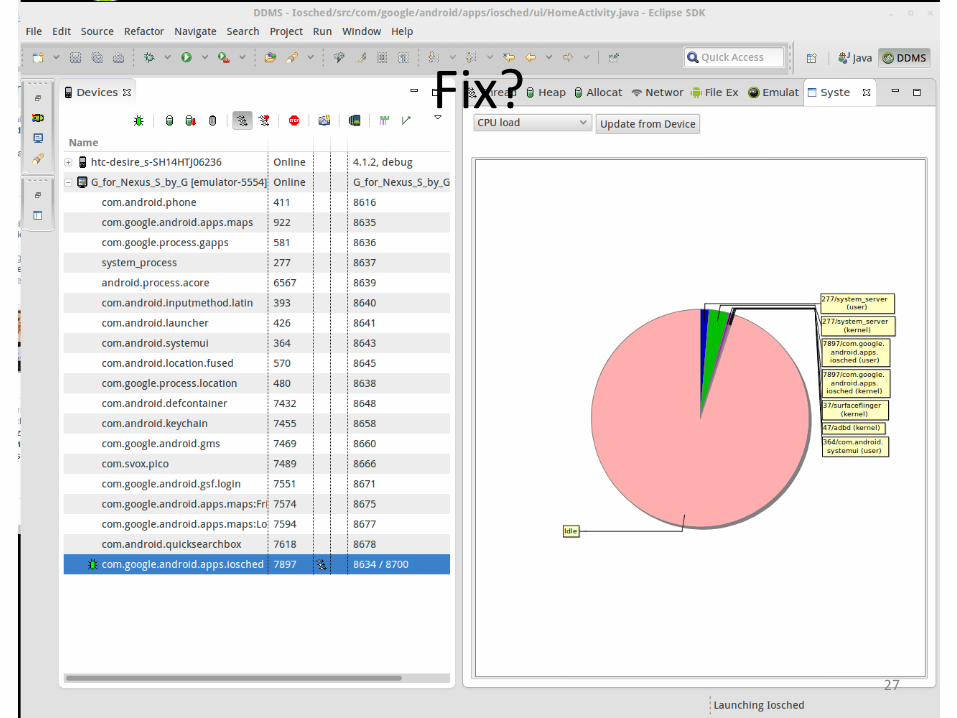
System View: Idle CPU usage ≈ 20%
17
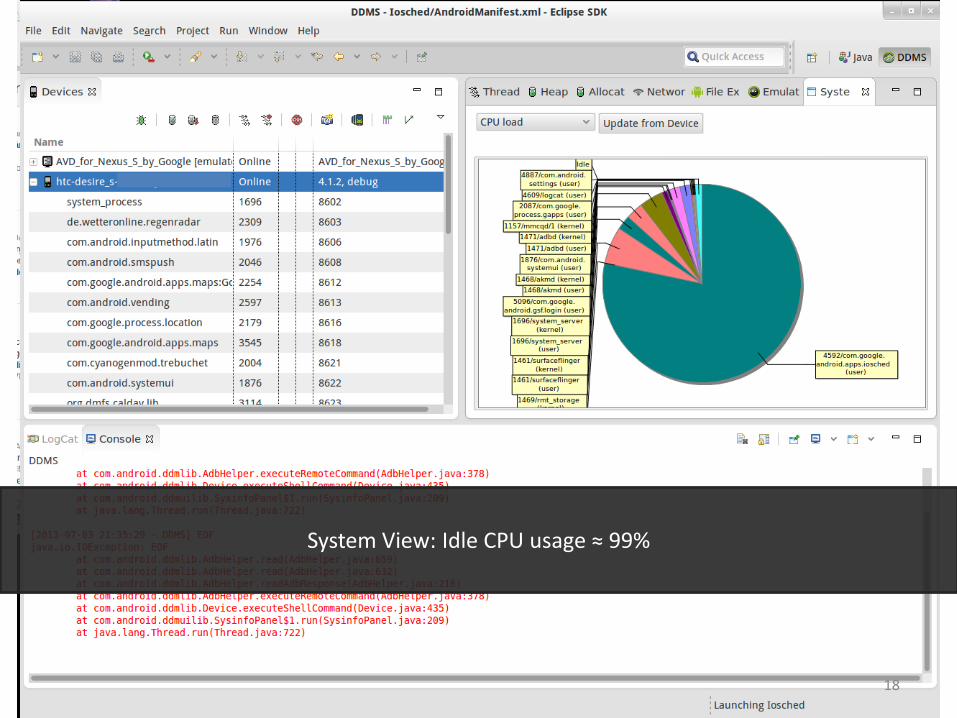
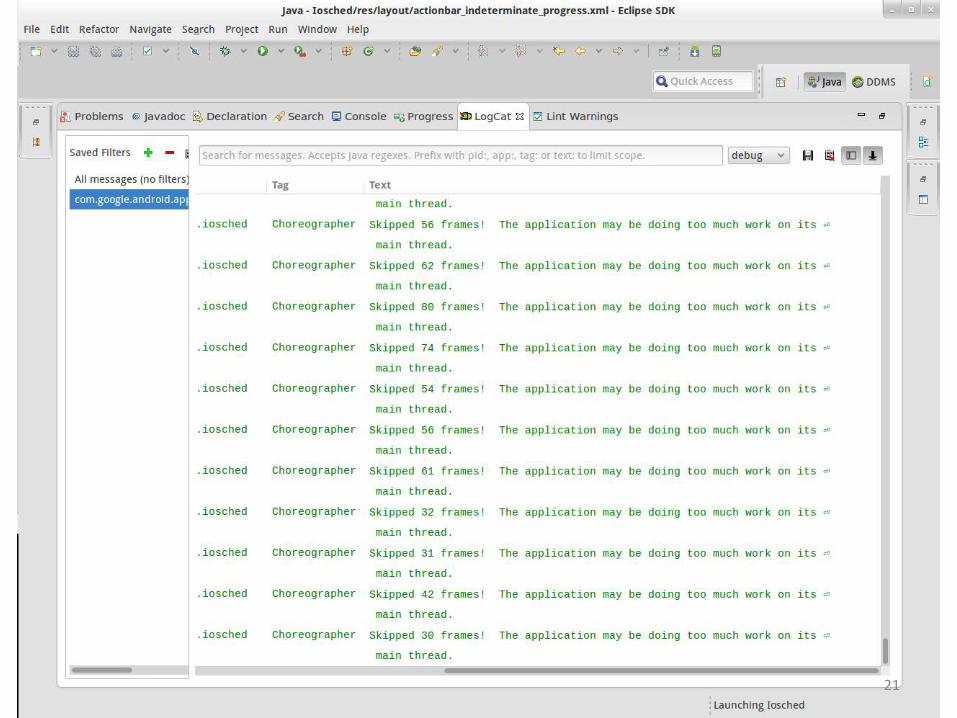
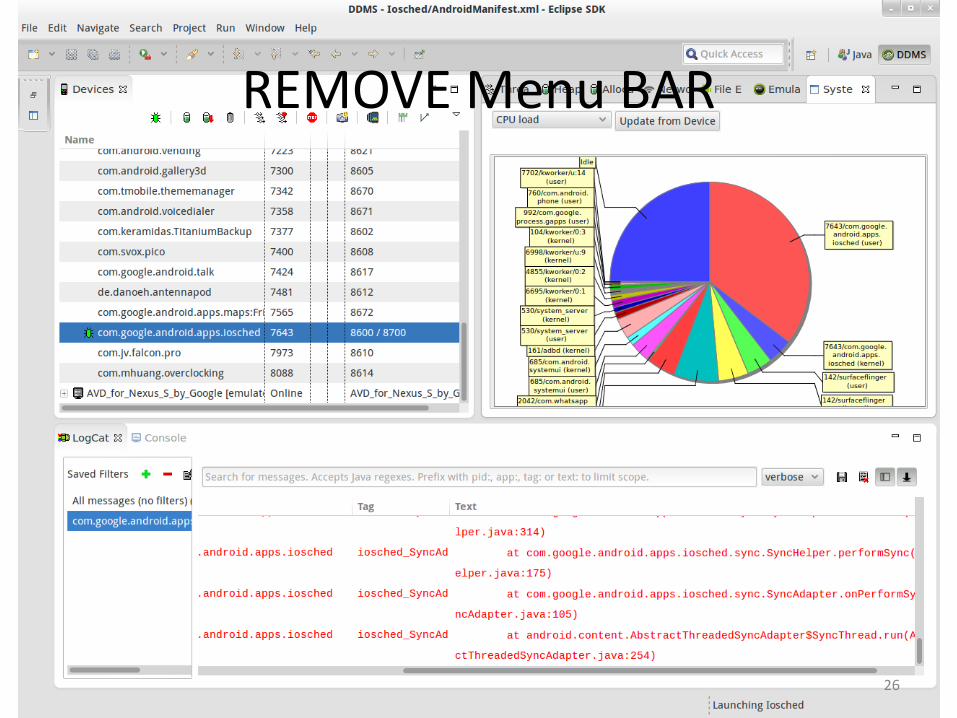
System View: Idle CPU usage ≈ 99%
18
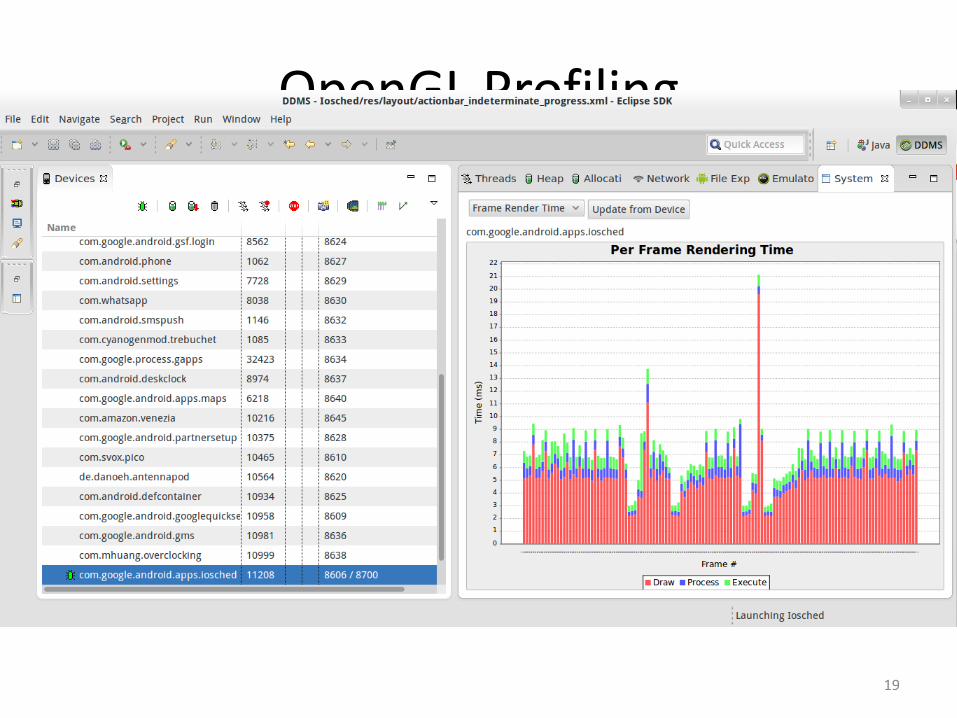
OpenGL Profiling
19

Thread View: utime: user time stime: system time
20
21
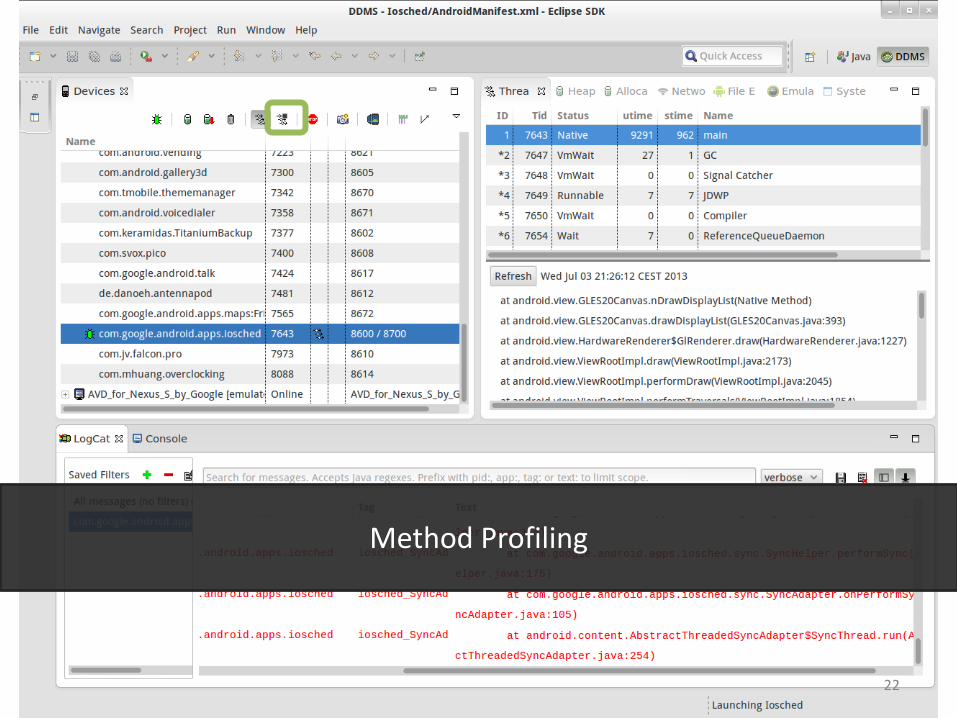
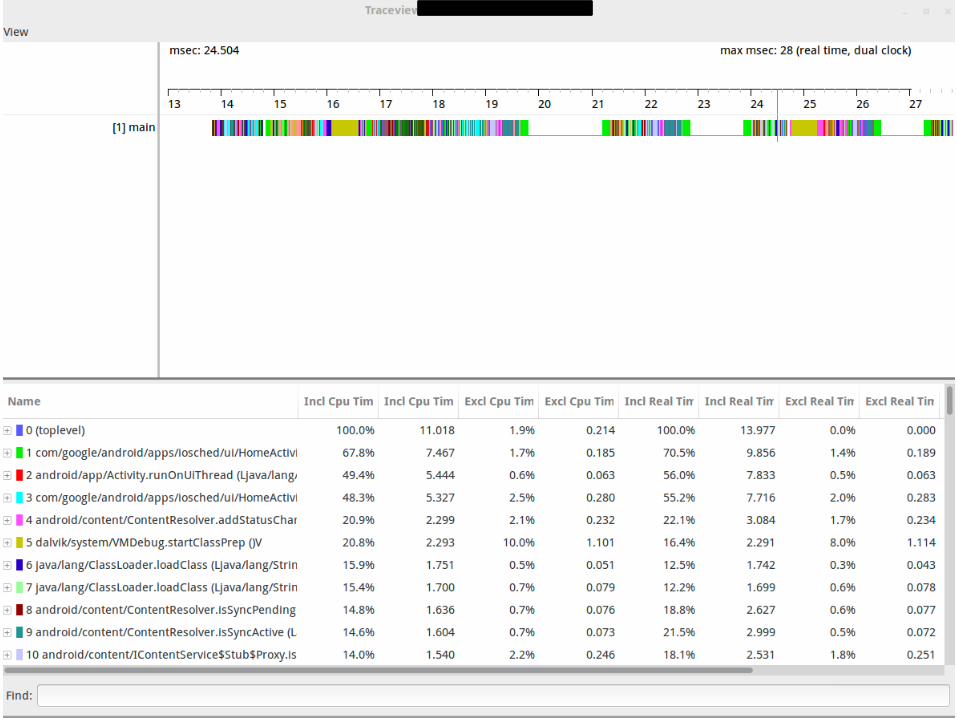
Method Profiling
22
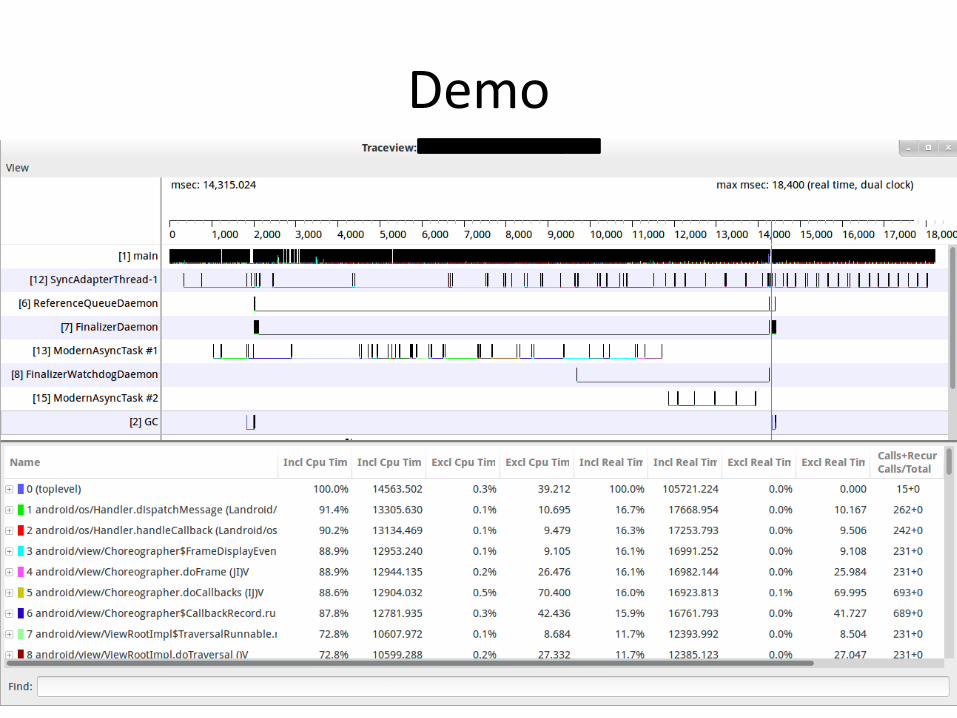
Demo
23
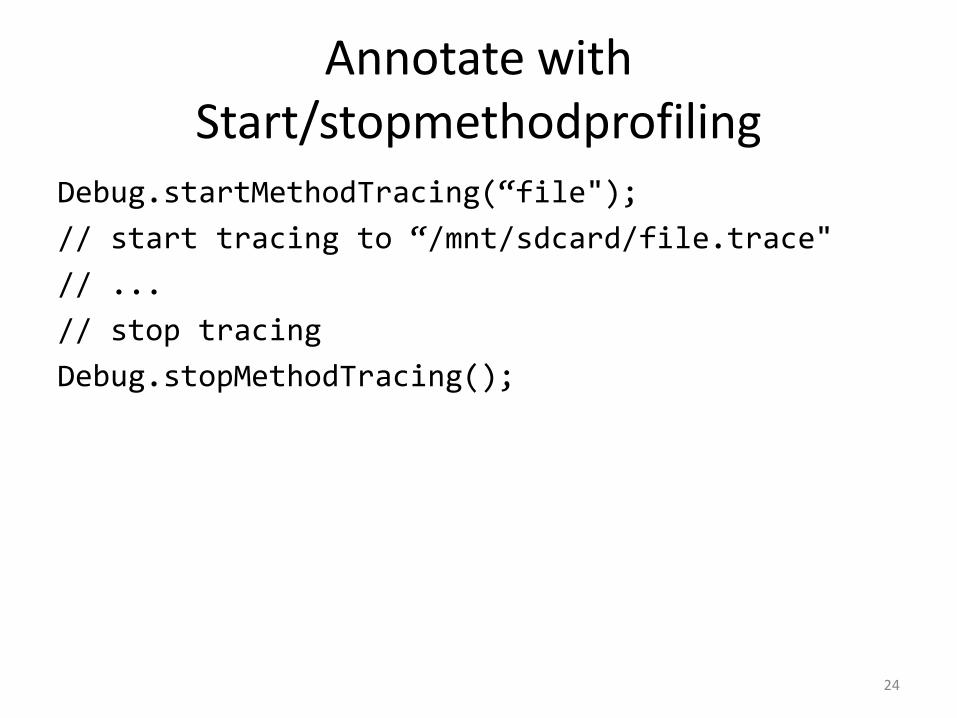
Annotate with Start/stopmethodprofiling
Debug.startMethodTracing(“file"); // start tracing to “/mnt/sdcard/file.trace" // ... // stop tracing Debug.stopMethodTracing();
24
25
REMOVE Menu BAR
26
Fix?
27

Snapshot (forces GC) Tracking over Time (start, stop, force GC) Convert to heap to Eclipse MAT compatible format (with hprof-conv)
28
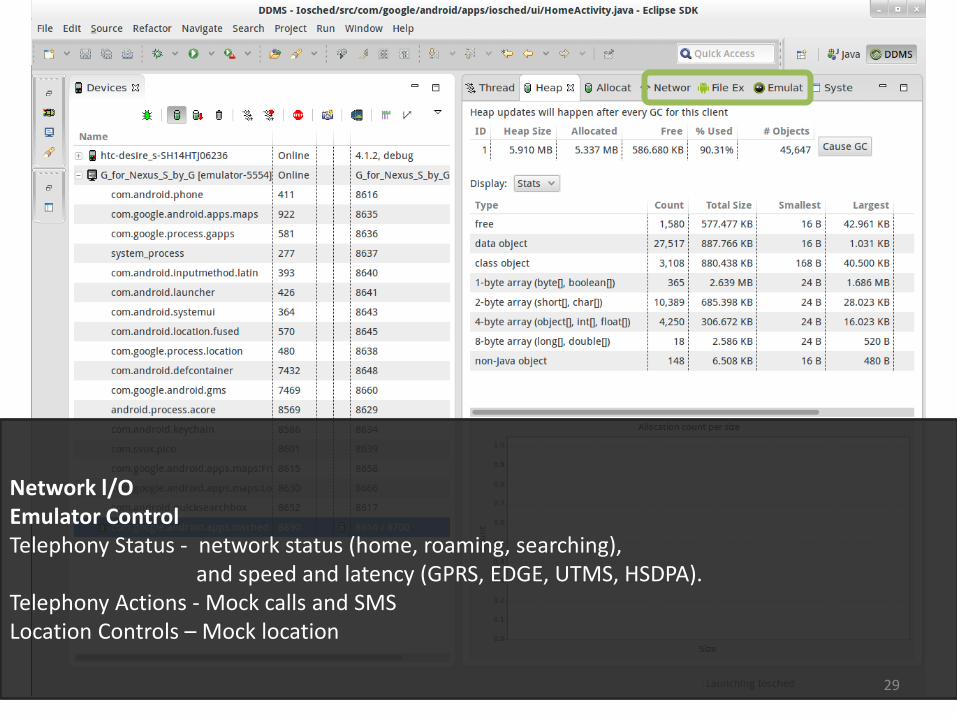
Network l/O Emulator Control Telephony Status - network status (home, roaming, searching), and speed and latency (GPRS, EDGE, UTMS, HSDPA). Telephony Actions - Mock calls and SMS Location Controls – Mock location
29
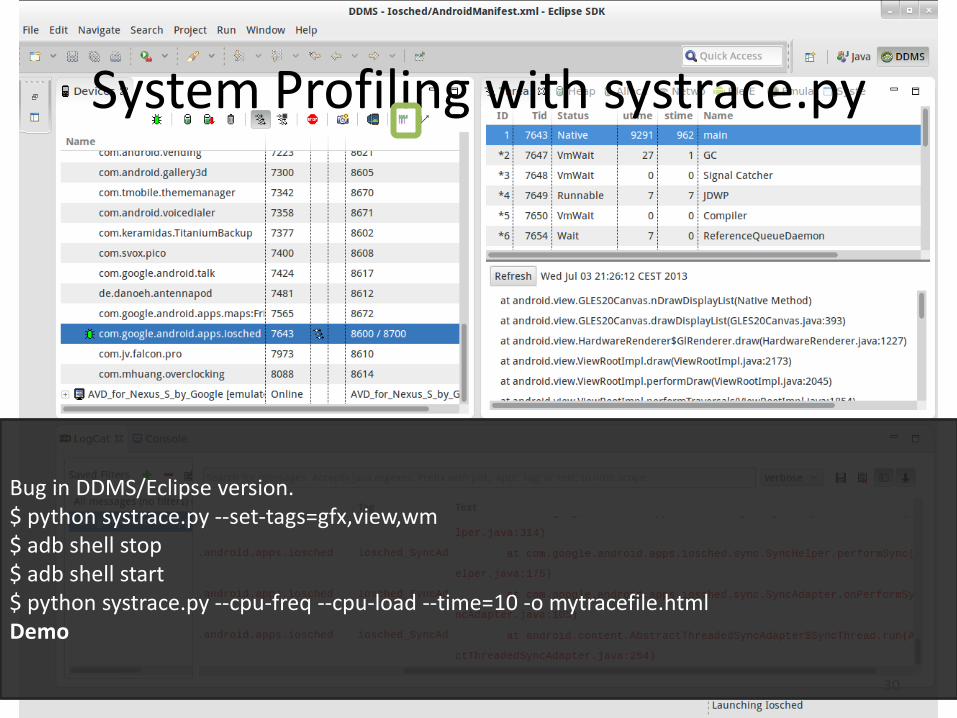
System Profiling with systrace.py
30
Bug in DDMS/Eclipse version. $ python systrace.py --set-tags=gfx,view,wm $ adb shell stop $ adb shell start $ python systrace.py --cpu-freq --cpu-load --time=10 -o mytracefile.html Demo
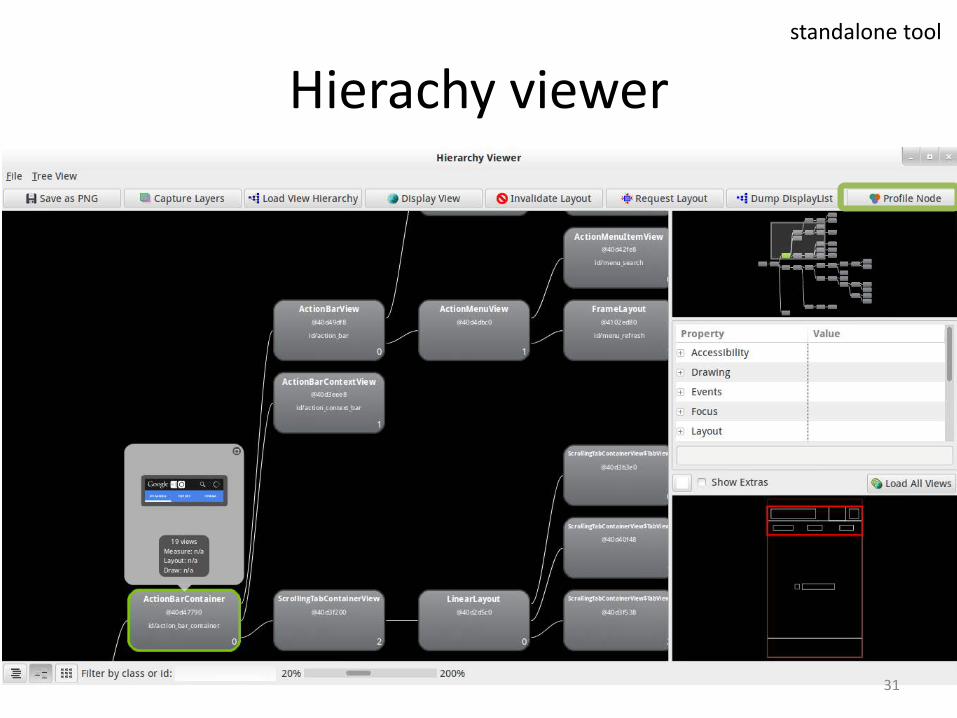
Hierachy viewer standalone tool
31
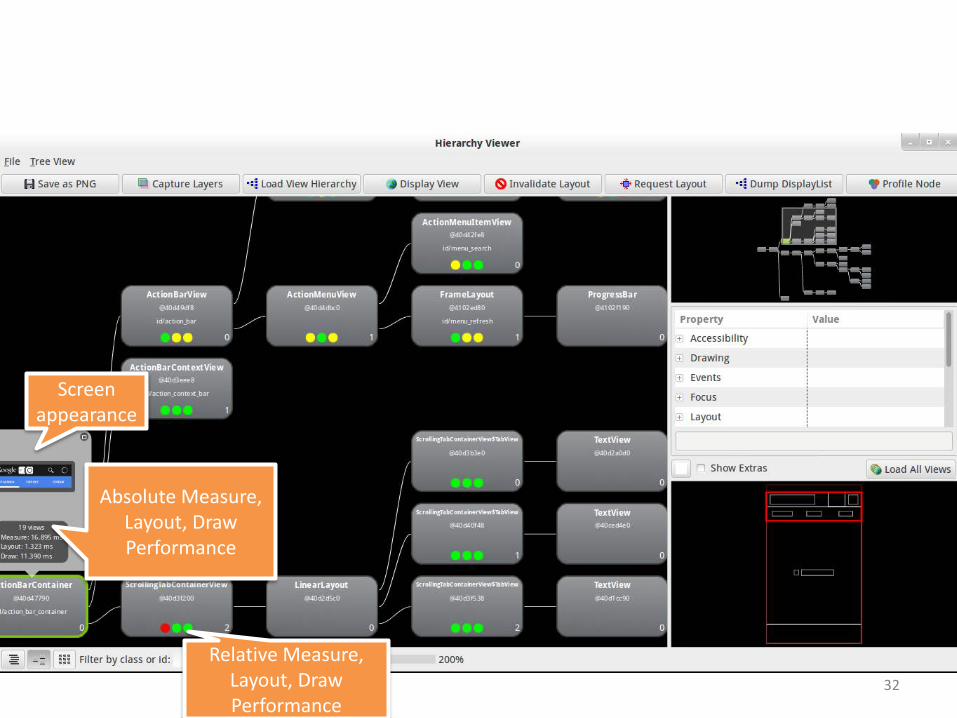
Relative Measure, Layout, Draw Performance
Screen appearance
Absolute Measure, Layout, Draw Performance
32
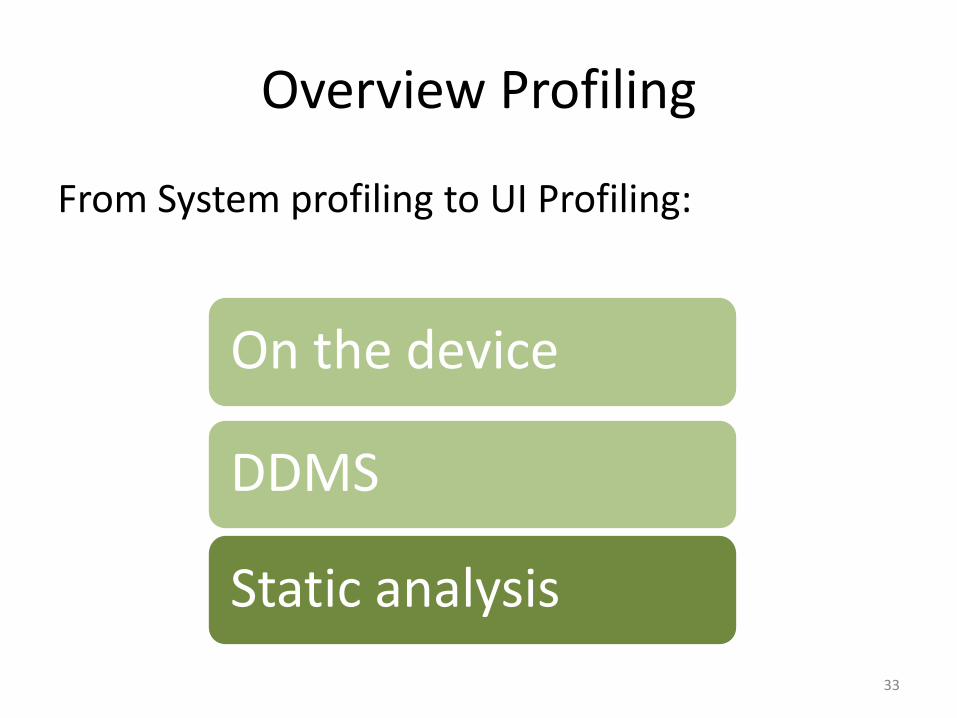
Overview Profiling
From System profiling to UI Profiling:
Static analysis
On the device
DDMS
33
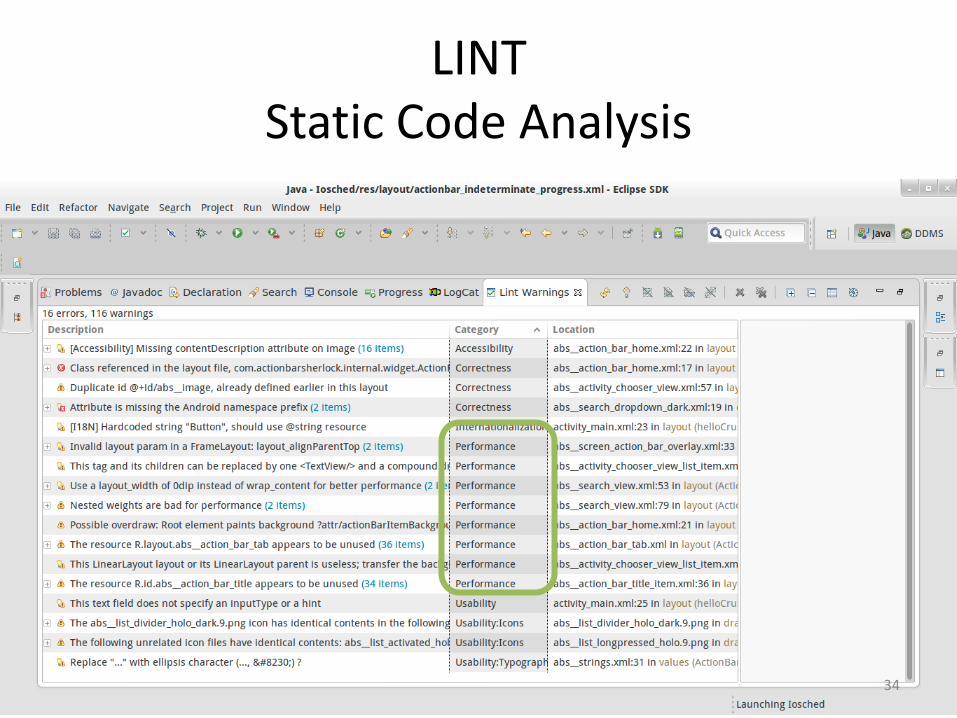
LINT Static Code Analysis
34

Thank you.
Questions?
35

REFERENCES
• [Apigee2012], http://apigee.com/about/pressrelease/apigee-survey-users-reveal-top-frustrations-lead-bad-mobile-app-reviews
36