profiling & tuning applications - people · • cuda 7.0 nvcc profiling_lecture.cu -o2...
TRANSCRIPT

Profiling&TuningApplications
CUDACourseIstván Reguly

Introduction
• Whyismyapplicationrunningslow?• Workitoutonpaper• Instrumentcode• Profileit• NVIDIAVisualProfiler
• WorkswithCUDA,needssometweakstoworkwithOpenCL• nvprof – commandlinetool,canbeusedwithMPIapplications

IdentifyingPerformanceLimiters
• CPU:Setup,datamovement• GPU:Bandwidth,computeorlatencylimited• Numberofinstructionsforeverybytemoved• Algorithmicanalysisgivesagoodestimate• Actualcodeislikelydifferent
• Instructionsforloopcontrol,pointermath,etc.• Memoryaccesspatterns• Howtofindout?
• Use theprofiler (quick,butapproximate)• Usesourcecodemodification (takesmorework)
AnalysiswithSourceCodeModification
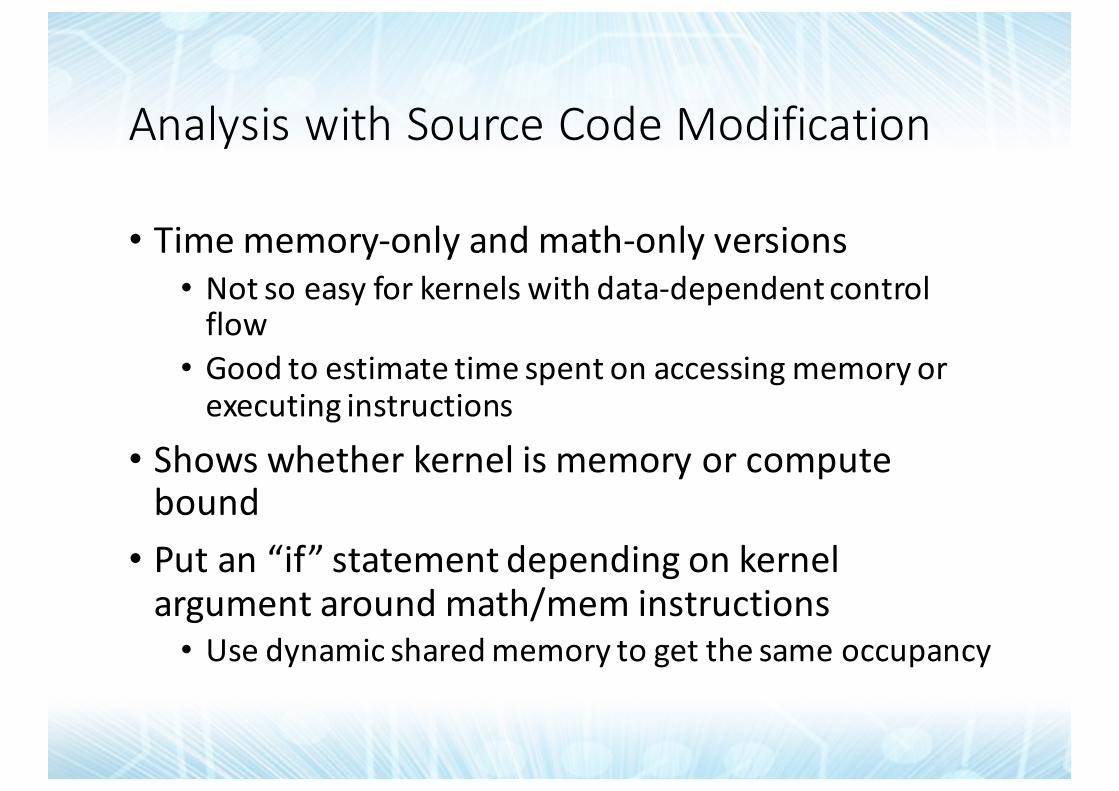
• Timememory-onlyandmath-onlyversions• Notsoeasyforkernelswithdata-dependentcontrolflow• Goodtoestimatetimespentonaccessingmemoryorexecutinginstructions
• Showswhetherkernelismemoryorcomputebound• Putan“if”statementdependingonkernelargumentaroundmath/mem instructions• Usedynamicsharedmemorytogetthesameoccupancy
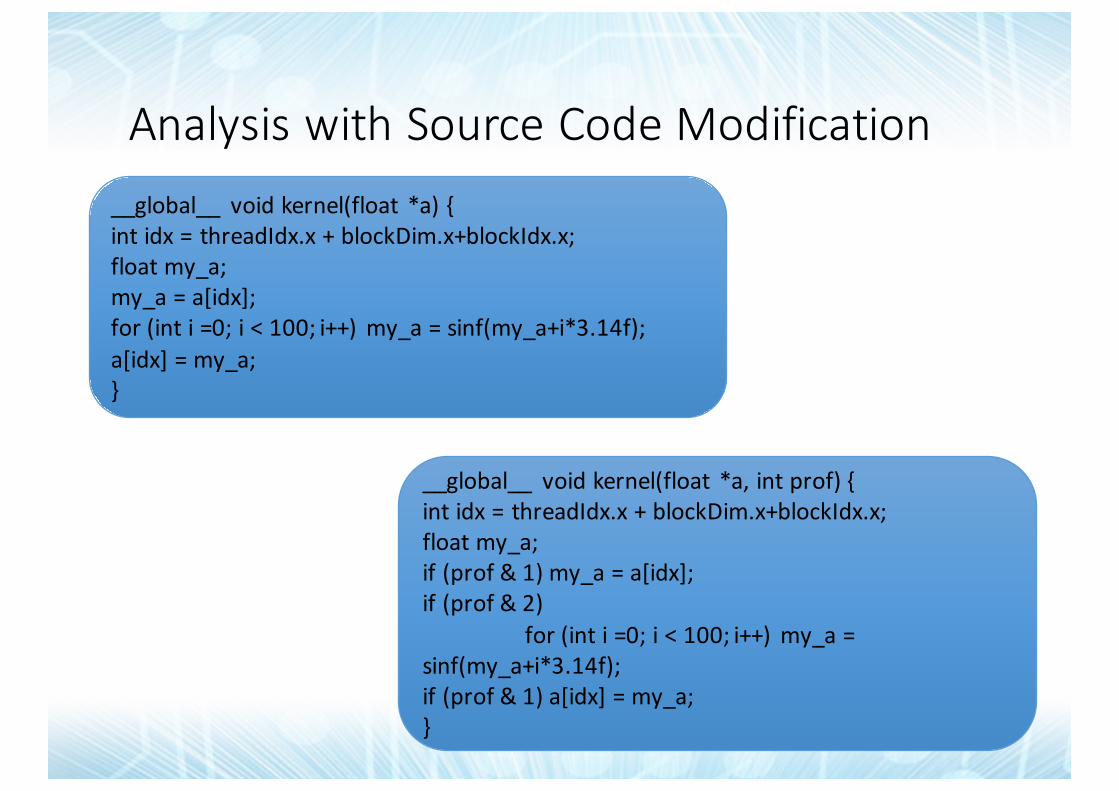
AnalysiswithSourceCodeModification__global__ voidkernel(float *a){int idx =threadIdx.x +blockDim.x+blockIdx.x;floatmy_a;my_a =a[idx];for(int i =0;i <100;i++)my_a =sinf(my_a+i*3.14f);a[idx]=my_a;}
__global__ voidkernel(float *a,int prof){int idx =threadIdx.x +blockDim.x+blockIdx.x;floatmy_a;if(prof&1)my_a =a[idx];if(prof&2)
for(int i =0;i <100;i++)my_a =sinf(my_a+i*3.14f);if(prof&1)a[idx]=my_a;}

Examplescenariostim
e
mem mathfull
Memory-bound
Goodoverlapbetweenmem-math.Latency isnotaproblem
mem mathfull
Math-bound
Goodoverlapbetweenmem-math.
mem mathfull
Wellbalanced
Goodoverlapbetweenmem-math.
mem mathfull
Mem andlatencybound
Pooroverlap,latency isaproblem

NVIDIAVisualProfiler
• Collectsmetricsandeventsduringexecution• CallstotheCUDAAPI• Overallapplication:
• Memorytransfers• Kernel launches
• Kernels• Occupancy• Computationefficiency• Memorybandwidthefficiency
• Source-levelprofiling• Requiresdeterministicexecution!

Meetthetestsetup
• 2Dgaussian blurwitha5x5stencil• 4096^2grid
__global__ void stencil_v0(float *input, float *output,int sizex, int sizey) {
const int x = blockIdx.x*blockDim.x + threadIdx.x + 2;const int y = blockIdx.y*blockDim.y + threadIdx.y + 2;if ((x >= sizex-2) || (y >= sizey-2)) return;float accum = 0.0f;for (int i = -2; i < 2; i++) {
for (int j = -2; j < 2; j++) {accum += filter[i+2][j+2]*input[sizey*(y+j) +
(x+i)]; }
}output[sizey*y+x] = accum/273.0f;}

Meetthetestsetup
• NVIDIAK40• GK110B• SM3.5• ECCon• Graphicsclocksat745MHz,Memoryclocksat3004MHz
• CUDA7.0nvcc profiling_lecture.cu -O2 -arch=sm_35 -I. –lineinfo –DIT=0

Interactivedemooftuningprocess

Launchaprofilingsession

Timeline Summary
Analysis results
Firstlook
Guide

TheTimeline
HostsideAPIcalls
MemCpy Compute

AnalysisGuided Unguided

ExamineIndividualKernels
Listsallkernelssortedbytotalexecution time: thehighertherankthehighertheimpactofoptimisation onoverallperformance
Initialunoptimised (v0) 8.122ms

Utilisation – WarpIssueEfficiency&PipeUtilisation
Bothbelow60%->Latency!
Let’sinvestigateMostofitismemoryops

Latencyanalysis
Memorythrottle ->performBWanalysis

MemoryBandwidthanalysis
L1cachenotused…

Globalmemoryloadefficiency53.3%L2hitrate96.7%
Investigatefurther…Unguided
6-8transactions peraccess– somethingiswrongwithhowweaccessmemory

Memoryunit isutilized,butGlobalLoadefficiencybecameevenworse:20.5%
Iteration1– turnonL1
Initialunoptimised (v0) 8.122ms
EnableL1 6.57ms
Quick&easystep:TurnonL1cachebyusing-Xptxas -dlcm=ca

Cachelineutilization
8
8
…..
32bytes(8floats)L1cachedisabled:->32Btransactions
Min4,Max8transactionsUnitoftransaction

Cachelineutilization
8
8
…..
128bytes(32floats) L1cacheenabled:->128Btransactions->4*32BtoL2Min16,Max32transactions
Eachtimeatransactionrequiresmorethan1128Bcacheline:re-issue
Unitoftransaction

Cachelineutilization
2
32
…..
128bytes(32floats) L1cacheenabled:->128Btransactions->4*32BtoL2Min4,Max8transactions
Unitoftransaction

Iteration2– 32x2blocks
Initialunoptimised (v0) 8.122ms
EnableL1 6.57ms
Blocksize 3.4ms
Memoryutilization decreased 10%PerformancealmostdoublesGlobalLoadEfficiency50.8%

Keytakeaway
• Latency/Bandwidthbound• Inefficientuseofmemorysystemandbandwidth• Symptoms:
• Lotsoftransactionsperrequest(lowloadefficiency)• Goal:
• Usethewholecacheline• Improvememoryaccesspatterns(coalescing)
• Whattodo:• Aligndata,changeblocksize,changedatalayout• Usesharedmemory/shufflestoloadefficiently

Latencyanalysis

Latencyanalysis

Latencyanalysis
Increasetheblocksizesomorewarpscanbeactiveatthesametime.
Kepler:Max16blocksperSMMax2048threadsperSM

Occupancy– usingall“slots”
Increaseblocksizeto32x4
Issueinstruction
Nextinstruction
Latencyofinstruction
Warp1
Warp2
Warp3
Warp4
Scheduler
Illustrative only,realityisabitmorecomplex…

Iteration3– 32x4blocks
Initialunoptimised (v0) 8.122ms
EnableL1 6.57ms
Blocksize 3.4ms
Blocksize 2 2.36ms
Up10%Fulloccupancy

Keytakeaway
• Latencybound– lowoccupancy• Unusedcycles,exposedlatency• Symptoms:
• Highexecution/memorydependency,lowoccupancy
• Goal:• Betterutilise cyclesby:havingmorewarps
• Whattodo:• Determineoccupancylimiter(registers,blocksize,sharedmemory)andvaryit

Improvingmemorybandwidth
• L1isfast,butabitwasteful(128Bloads)• 8transactionsonaverage(minimumwouldbe4)
• Load/Storepipestressed• Anywaytoreducetheload?
• Texturecache• Dedicatedpipeline• 32byteloads• const __restrict__*• __ldg()

Iteration4– texturecache
Initialunoptimised (v0) 8.122ms
Blocksize 2 2.36ms
Texturecache 1.53ms

Keytakeaway
• Bandwidthbound– Load/StoreUnit• LSUoverutilised• Symptoms:
• LSUpipeutilisation high,otherslow• Goal:
• Betterspreadtheloadbetweenotherpipes:useTEX• Whattodo:
• Readread-onlydatathroughthetexturecache• const __restrict__or__ldg()

Computeutilization couldbehigher(~78%)LotsofInteger&memoryinstructions, fewerFPIntegeropshavelowerthroughputthanFPTrytoamortizethecost:increase computeperbyte
Load/store
ComputeanalysisInstructionmix

InstructionLevelParallelism
• Remember,GPUisin-order:
• Secondinstructioncannotbeissuedbeforefirst• Butitcanbeissuedbeforethefirstfinishes– ifthereisnodependency
• Appliestomemoryinstructionstoo– latencymuchhigher(countstowardsstallreasons)
Issueinstruction
Nextinstruction
Latencyofinstruction
Warp1
a=b+c
d=a+e
a=b+c
d=e+f

InstructionLevelParallelism
for (j=0;j<2;j++)acc+=filter[j]*input[x+j];
tmp=input[x+0]
acc += filter[0]*tmp
tmp=input[x+1]
acc += filter[1]*tmp
for (j=0;j<2;j++) {acc0+=filter[j]*input[x+j];acc1+=filter[j]*input[x+j+1];}
tmp=input[x+0]
acc0 += filter[0]*tmp
tmp=input[x+1]
acc0 += filter[1]*tmp
tmp=input[x+0+1]
acc1 += filter[0]*tmp
tmp=input[x+1+1]
acc1 += filter[1]*tmp
#pragmaunrollcanhelp ILPCreatetwoaccumulatorsOr…
Process2pointsperthreadBonusdatare-use(registercaching)

Iteration5– 2pointsperthread
Initialunoptimised (v0) 8.122ms
Texturecache 1.53ms
2points 1.07ms
Load/store

Keytakeaway
• Latencybound– lowinstructionlevelparallelism• Unusedcycles,exposedlatency• Symptoms:
• Highexecutiondependency,one“pipe”saturated• Goal:
• Betterutilise cyclesby:increasingparallelworkperthread
• Whattodo:• IncreaseILPbyhavingmoreindependentwork,e.g.morethan1outputvalueperthread• #pragmaunroll

168GB/sdeviceBW
Iteration6– 4pointsperthread
Load/store
Initialunoptimised (v0) 8.122ms
2points 1.07ms
4points 0.95ms

Checklist
• cudaDeviceSynchronize()• MostAPIcalls(e.g.kernellaunch)areasynchronous• Overheadwhenlaunchingkernels• GetridofcudaDeviceSynchronize()tohidethislatency• Timing:eventsorcallbacksCUDA5.0+
• Cacheconfig 16/48or48/16kBL1/shared(defaultis48kshared!)onKepler• cudaSetDeviceCacheConfig• cudaFuncSetCacheConfig• Checkifsharedmemoryusageisalimitingfactor

Checklist• Occupancy• Max1536threadsor8blocksperSMonFermi(2048/16forKepler,2048/32forMaxwell)• Limitedamountofregistersandsharedmemory
• Max255registers/thread, restisspilledtoglobalmemory• Youcanexplicitlylimitit(-maxregcount=xx)• 48kB/16kBshared/L1:don’tforgettosetit
• VisualProfilertellsyouwhatisthelimitingfactor• Insomecasesthough,itisfasterifyoudon’tmaximise it(seeVolkov paper)->Autotuning!

Verbosecompile
• Add–Xptxas=-v
• Checkprofilerfiguresforbestoccupancy
ptxas info:Compilingentryfunction'_Z10fem_kernelPiS_' for'sm_20'ptxas info:Functionproperties for_Z10fem_kernelPiS_856bytesstackframe,980bytesspillstores,1040bytesspillloads
ptxas info:Used63registers, 96bytescmem[0]

Checklist
• Precisionmix(e.g.1.0vs 1.0f)– cuobjdump• F2F.F64.F32(6*thecostofamultiply)• IEEEstandard:alwaysconverttohigherprecision• Integermultiplicationsarenowexpensive(6*)
• cudaMemcpy• Introducesexplicitsynchronisation,highlatency• Isitnecessary?
• Maybecheaper tolaunchakernelwhichimmediatelyexits• Coulditbeasynchronous?(Pinthememory!)

Auto-tuning
• Severalparametersthataffectperformance• Blocksize• Amountofworkperblock• Applicationspecific
• Whichcombinationperformsthebest?• Auto-tuningwithFlamingo
• #define/readthesizes,recompile/reruncombinations

Auto-tuningCaseStudy
• Threadcooperationonsparsematrix-vectorproduct• Multiplethreadsdoingpartialdotproductontherow• Reductioninsharedmemory
• Auto-tunefordifferentmatrices• Difficulttopredictcachingbehavior• Developaheuristicforcooperationvs.averagerowlength

Autotuning CaseStudy
1 2 4 8 16 32
10−4
10−3
10−2
Number of cooperating threads
Run t
ime
(sec
onds)
atmosmodd (2.63)
crankseg_2 (14.89)
shallow_water1 (2.00)
webbase−1M (1.76)
cant (8.01)

Conclusions• Iterativeapproachtoimprovingacode’sperformance• Identifyhotspot• Findperformancelimiter,understandwhyit’sanissue• Improveyourcode• Repeat
• Managedtoachievea8.5xspeedup• ShownhowNVVPguidesusandhelpsunderstandwhatthecodedoes• Thereismoreitcanshow…
References: C.Angerer,J.Demouth,“CUDAOptimizationwithNVIDIANsight Eclipse Edition”,GTC2015

RapidcodedevelopmentwithThrust

Thrust
• OpenHigh-LevelParallelAlgorithmsLibrary• ParallelAnalogoftheC++StandardTemplateLibrary(STL)• Vectorcontainers• Algorithms
• Comeswiththetoolkit• ProductivewaytouseCUDA

Example

Productivity
• Containers• host_vector• device_vector
• Memorymanagement• Allocation,deallocation• Transfers
• Algorithmselection• Locationisimplicit

Productivity
• Largesetofalgorithms• ~100functions• CPU,GPU
• Flexible• C++templates• User-definedtypes• User-definedoperators
Algorithm Description
reduce Sumofasequence
find Firstpositionofavalueinasequence
mismatch Firstpositionwhere twosequencesdiffer
count Numberofinstancesofavalue
inner_product Dotproductoftwosequences
merge Mergetwosortedsequences

Portability• Implementations• CUDAC/C++• ThreadingBuildingBlocks• OpenMP• InteroperablewithanythingCUDAbased
• Recompile
• Mixbackendsnvcc -DTHRUST_DEVICE_SYSTEM=THRUST_HOST_SYSTEM_OMP

Interoperability
• Thrustcontainersandrawpointers• UsecontainerinCUDAkernel
• Useadevicepointerinthrustalgorithms(notavectorthough,nobegin(),end(),resize()etc.)
thrust::device_vector<int> d_vec(...);cuda_kernel<<<N, 128>>>(some_argument_d,
thrust::raw_pointer_cast(&d_vec[0]));
int *dev_ptr;cudaMalloc((void**)&dev_ptr, 100*sizeof(int));
thrust::device_ptr<int> dev_ptr_thrust(dev_ptr);thrust::fill(dev_ptr_thrust, dev_ptr_thrust+100, 0);

Thrust
• Constantlyevolving• Reliable– comeswiththetoolkit,testedeverydaywithunittests• Performance– specialised implementationsfordifferenthardware• Extensible– allocators,back-ends,etc.

Thrustdocumentationhttp://thrust.github.io/doc/modules.html