profiling with performance schema - mysql · an introduction to performance schema § a new default...
TRANSCRIPT

Copyright © 2012, Oracle and/or its affiliates. All rights reserved. Insert Information Protection Policy Classification from Slide 121
Profiling with Performance Schema
Mark LeithSoftware Development Senior Manager

Copyright © 2012, Oracle and/or its affiliates. All rights reserved.2
Program Agenda
§ An Introduction to Performance Schema§ Performance Schema Configuration§ Profiling General Instance Activity§ Profiling Statement Activity
THE FOLLOWING IS INTENDED TO OUTLINE OUR GENERAL PRODUCT DIRECTION. IT IS INTENDED FOR INFORMATION PURPOSES ONLY, AND MAY NOT BE INCORPORATED INTO ANY CONTRACT. IT IS NOT A COMMITMENT TO DELIVER ANY MATERIAL, CODE, OR FUNCTIONALITY, AND SHOULD NOT BE RELIED UPON IN MAKING PURCHASING DECISION. THE DEVELOPMENT, RELEASE, AND TIMING OF ANY FEATURES OR FUNCTIONALITY DESCRIBED FOR ORACLE'S PRODUCTS REMAINS AT THE SOLE DISCRETION OF ORACLE.

Copyright © 2012, Oracle and/or its affiliates. All rights reserved. Insert Information Protection Policy Classification from Slide 123
An Introduction to Performance Schema

Copyright © 2012, Oracle and/or its affiliates. All rights reserved.4
An Introduction to Performance Schema
§ A new default performance_schema schema within MySQL§ Tables use new PERFORMANCE_SCHEMA storage engine
– Real engine, unlike INFORMATION_SCHEMA
§ Records various run time statistics via in-built instrumentation points§ All recorded statistics are stored in fixed size ring buffers in memory§ Most instrumentation configuration can be done dynamically
§ Performance Schema Overview

Copyright © 2012, Oracle and/or its affiliates. All rights reserved.5
An Introduction to Performance Schema
§ At it’s core, Performance Schema tracks latency for various events§ Latency is exposed to picosecond precision (a trillionth of a second)§ In 5.5:
– File I/O, Mutexes, Read/Write Locks, Conditions
§ In 5.6:
– Network I/O, Table I/O, Table Locks, Stages, Statements, Idle
§ Also tracks other data as appropriate, like bytes, source position, etc.
§ Instrumentation Points

Copyright © 2012, Oracle and/or its affiliates. All rights reserved.6
An Introduction to Performance Schema
§ Table Locks wait/lock/table/% (5.6)§ Network IO wait/io/socket/% (5.6)§ Table IO wait/io/table/% (5.6)
§ File IO wait/io/file/% (5.5)§ Mutexes wait/synch/mutex/% (5.5)§ Read/Write Locks wait/synch/rwlock/% (5.5)§ Conditions wait/synch/cond/% (5.5)
§ Wait Events
Copyright © 2012, Oracle and/or its affiliates. All rights reserved.7
An Introduction to Performance Schema
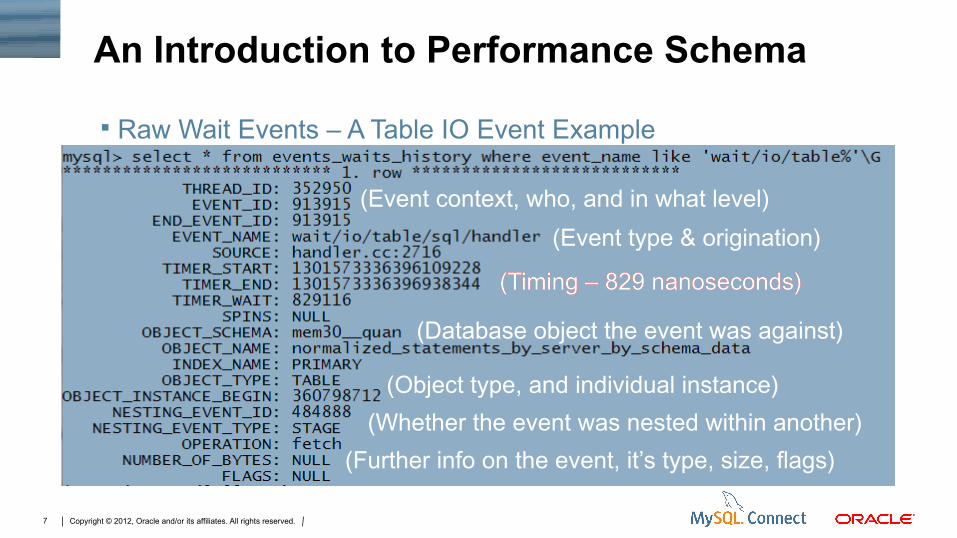
§ Raw Wait Events – A Table IO Event Example
(Event type & origination)
(Timing – 829 nanoseconds)
(Event context, who, and in what level)
(Database object the event was against)
(Whether the event was nested within another)
(Timing – 829 nanoseconds)
(Further info on the event, it’s type, size, flags)
(Object type, and individual instance)

Copyright © 2012, Oracle and/or its affiliates. All rights reserved.8
An Introduction to Performance Schema
§ Statements have two types of event
– SQL Statements statement/sql/%
– COM Commands statement/com/%
§ Stages are the thread states (like SHOW PROFILE, but available across connections)
– One form so far stage/sql/%
– Apart from... stage/mysys/Waiting for table level lock
§ Statement and Stage Events (5.6+)

Copyright © 2012, Oracle and/or its affiliates. All rights reserved.9
An Introduction to Performance Schema
§ Raw Stage Events

Copyright © 2012, Oracle and/or its affiliates. All rights reserved.10
An Introduction to Performance Schema
§ Raw Statement Events

Copyright © 2012, Oracle and/or its affiliates. All rights reserved.11
§ Used to define certain configuration dynamically
§ Can perform DML against these tables
An Introduction to Performance Schema
§ Setup Tables

Copyright © 2012, Oracle and/or its affiliates. All rights reserved.12
§ Expose events, objects, or instances of instruments in a raw manner
§ Allow seeing a (brief) history of raw event metrics as well
An Introduction to Performance Schema
§ Raw Data Tables

Copyright © 2012, Oracle and/or its affiliates. All rights reserved.13
§ Summarize event information over various dimensions
§ Useful for longer term monitoring of activity
An Introduction to Performance Schema
§ Summary Tables

Copyright © 2012, Oracle and/or its affiliates. All rights reserved. Insert Information Protection Policy Classification from Slide 1214
Performance SchemaConfiguration

Copyright © 2012, Oracle and/or its affiliates. All rights reserved.15
Performance Schema Configuration
§ There are three distinct types of configuration§ A way to configure how much memory to allocate for instruments
– Set with various system variables in options files, not dynamic
§ A way to enable/disable instrumentation at startup
– Again set within options files, only available as of 5.6
§ A way to enable/disable instrumentation dynamically– Set by updating various “setup” tables dynamically
§ Configuration Options

Copyright © 2012, Oracle and/or its affiliates. All rights reserved.16
Performance Schema Configuration
§ Memory usage falls in to two distinct categories§ How many “classes” and ”instances” of event types to track
– Affects all data available in performance schema
§ How much summary and history data you want to track
– Affects how long you can see data for
§ Memory Configuration

Copyright © 2012, Oracle and/or its affiliates. All rights reserved.17
§ Classes count instrument implementations - “wait/io/file/sql/binlog”
§ Instances are the different runtime instances of them - “/data/mysql/binlog.000001”
Performance Schema Configuration
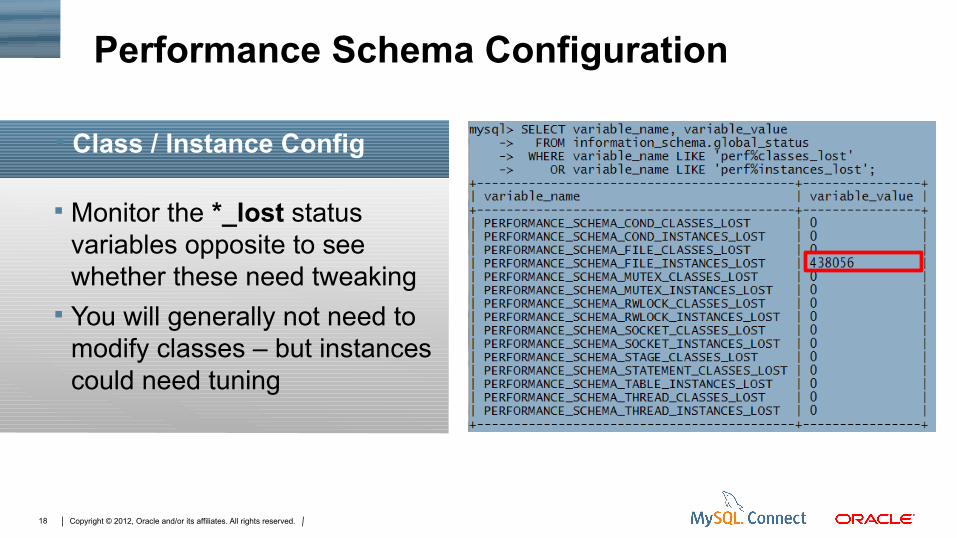
§ Class / Instance Config
Copyright © 2012, Oracle and/or its affiliates. All rights reserved.18
§ Monitor the *_lost status variables opposite to see whether these need tweaking
§ You will generally not need to modify classes – but instances could need tuning
Performance Schema Configuration
§ Class / Instance Config

Copyright © 2012, Oracle and/or its affiliates. All rights reserved.19
§ Define total rows per type§ The *history_size variables are
per-thread§ The *history_long_size is total
rows§ Only settable in my.cnf/ini
Performance Schema Configuration
§ History / Summary Sizes

Copyright © 2012, Oracle and/or its affiliates. All rights reserved.20
§ Define the granularity of timing§ Set different timers for different
types of instrumentation
Performance Schema Configuration
§ setup_timers

Copyright © 2012, Oracle and/or its affiliates. All rights reserved.21
§ Show which timers are available
§ Show the performance characteristics of the timer on the platform MySQL installed on
Performance Schema Configuration
§ performance_timers
(Not Available)
(Just... Don’t.)
(High Overhead)
(Good Choice)
(Good Choice)

Copyright © 2012, Oracle and/or its affiliates. All rights reserved.22
§ Show which timers are available
§ Show the performance characteristics of the timer on the platform MySQL installed on
Performance Schema Configuration
§ performance_timers
(Not Available)
(Just... Don’t.)
(High Overhead)
(Good Choice)
(Good Choice)

Copyright © 2012, Oracle and/or its affiliates. All rights reserved.23
§ Turn on/off individual instruments, and timing, dynamically
§ Use UPDATE to modify
Performance Schema Configuration
§ setup_instruments

Copyright © 2012, Oracle and/or its affiliates. All rights reserved.24
§ Define how much to record in history (again, UPDATE to modify)
§ Statement Digests also enabled
Performance Schema Configuration
§ setup_consumers

Copyright © 2012, Oracle and/or its affiliates. All rights reserved.25
§ Define exactly which connections to monitor
§ By default monitors all connections (% is a wildcard)
§ Modifications only apply to new connections
Performance Schema Configuration
§ setup_actors (New in 5.6)

Copyright © 2012, Oracle and/or its affiliates. All rights reserved.26
§ Define exactly which database objects to monitor
§ Filters standard databases by default
§ Allows explicit enable/disable, matches on most specific
Performance Schema Configuration
§ setup_objects (New in 5.6)
Copyright © 2012, Oracle and/or its affiliates. All rights reserved.27
Performance Schema Configuration
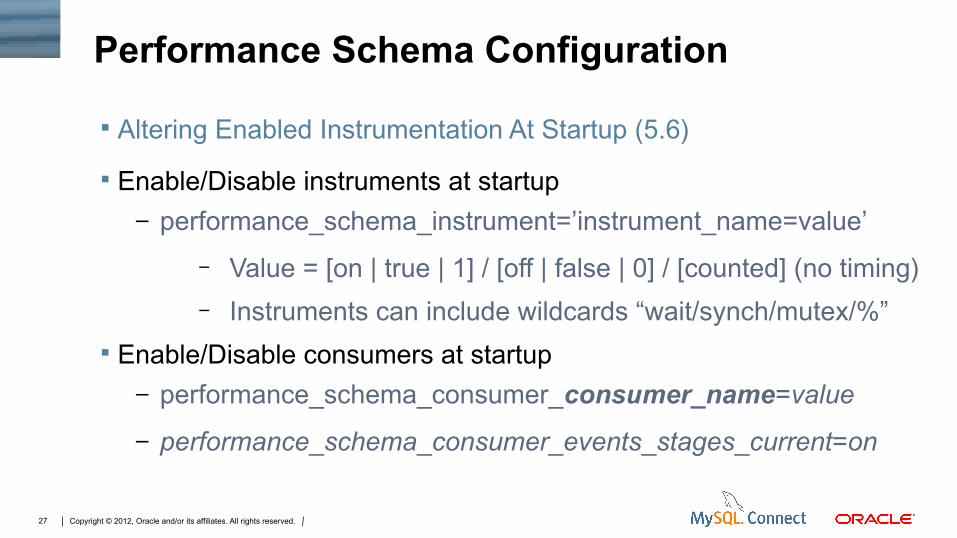
§ Altering Enabled Instrumentation At Startup (5.6)
§ Enable/Disable instruments at startup
– performance_schema_instrument=’instrument_name=value’
– Value = [on | true | 1] / [off | false | 0] / [counted] (no timing)
– Instruments can include wildcards “wait/synch/mutex/%”
§ Enable/Disable consumers at startup
– performance_schema_consumer_consumer_name=value
– performance_schema_consumer_events_stages_current=on

Copyright © 2012, Oracle and/or its affiliates. All rights reserved.28
Performance Schema Configuration
§ A collection of functions / views / procedures to help with P_S§ I will be using the functions in the examples following for formatting§ Versions available for both 5.5 and 5.6
§ http://www.markleith.co.uk/ps_helper/
§ Finally, grab ps_helper!

Copyright © 2012, Oracle and/or its affiliates. All rights reserved. Insert Information Protection Policy Classification from Slide 1229
Profiling General Instance Activity

Copyright © 2012, Oracle and/or its affiliates. All rights reserved.30
Profiling General Instance Activity
§ It’s easy to just enable everything, but there are overhead concerns
– On busy systems mutexes can be locked millions of times a second
§ For busy systems, it’s best to just pick higher latency event types– Statements, Stages, Table IO, File IO, maybe Network IO
– It's good to enable all *current consumers, and statement/stage history
§ For concurrency issues toggle other instruments on as needed basis
§ Defining what you want/need to monitor

Copyright © 2012, Oracle and/or its affiliates. All rights reserved.31
Profiling General Instance Activity
§ Once you’ve narrowed down what you are interested in, there are two ways to start monitoring
§ View raw data in the summary views
– This gives you an overall picture of usage on the instance
§ Snapshot data, and compute deltas over time
– This gives you an idea of the rates of changes for events
§ Let’s start with viewing raw summary data..
§ Different Ways of Monitoring

Copyright © 2012, Oracle and/or its affiliates. All rights reserved.32
Profiling General Instance Activity
§ Top Waits by Latency – events_waits_summary_global_by_event_name
Only using InnoDB, thismust be from temp tables
Copyright © 2012, Oracle and/or its affiliates. All rights reserved.33
Profiling General Instance Activity
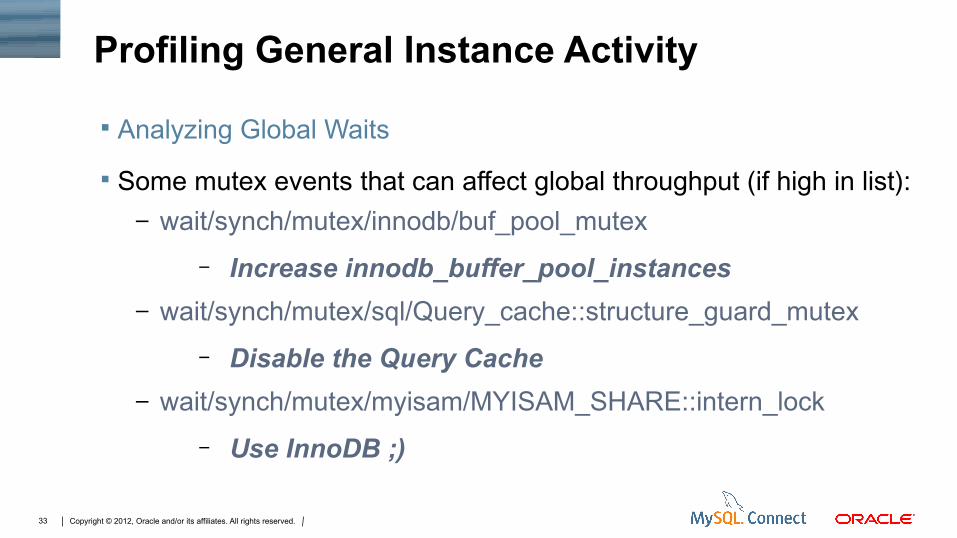
§ Some mutex events that can affect global throughput (if high in list):
– wait/synch/mutex/innodb/buf_pool_mutex
– Increase innodb_buffer_pool_instances
– wait/synch/mutex/sql/Query_cache::structure_guard_mutex
– Disable the Query Cache
– wait/synch/mutex/myisam/MYISAM_SHARE::intern_lock
– Use InnoDB ;)
§ Analyzing Global Waits

Copyright © 2012, Oracle and/or its affiliates. All rights reserved.34
Profiling General Instance Activity
§ Some File IO events to watch for:
– wait/io/file/sql/FRM
– Tune table_open_cache / table_definition_cache
– wait/io/file/sql/file_parser (View definition parsing)
– If high on 5.5, upgrade to 5.6 (which caches these)
– wait/io/file/sql/query_log / wait/io/file/sql/slow_log
– Disable General / Slow query logs
§ Analyzing Global Waits
Copyright © 2012, Oracle and/or its affiliates. All rights reserved.35
Profiling General Instance Activity
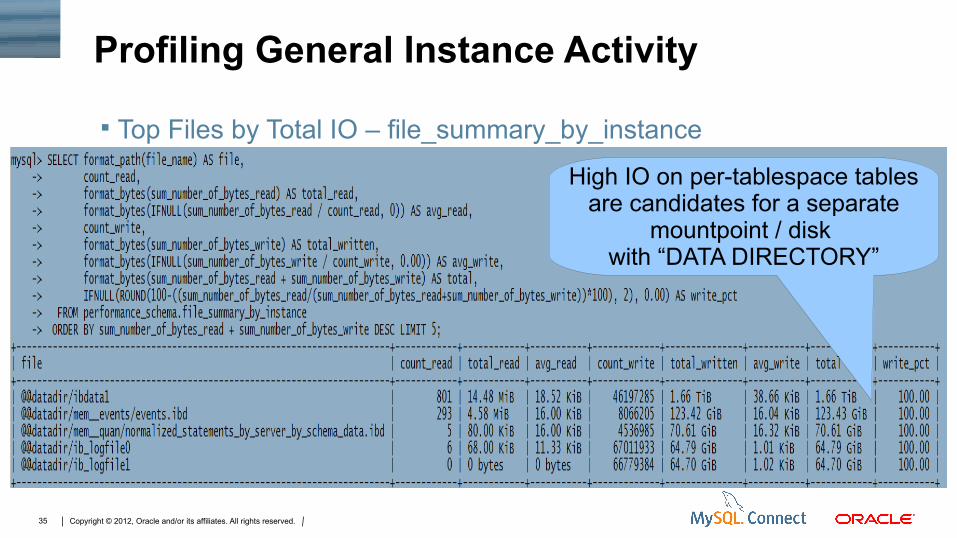
§ Top Files by Total IO – file_summary_by_instance
High IO on per-tablespace tablesare candidates for a separate
mountpoint / disk with “DATA DIRECTORY”

Copyright © 2012, Oracle and/or its affiliates. All rights reserved.36
Profiling General Instance Activity
§ All event_* summaries are give a number of dimensions to view data§ To analyze connection activity you can do this in 3 ways
– By User
– By Host
– By Account (user@host)
§ The following examples are by user, but could be replaced with the host, or account, summary views
§ Analyzing User Activity
Copyright © 2012, Oracle and/or its affiliates. All rights reserved.37
Profiling General Instance Activity
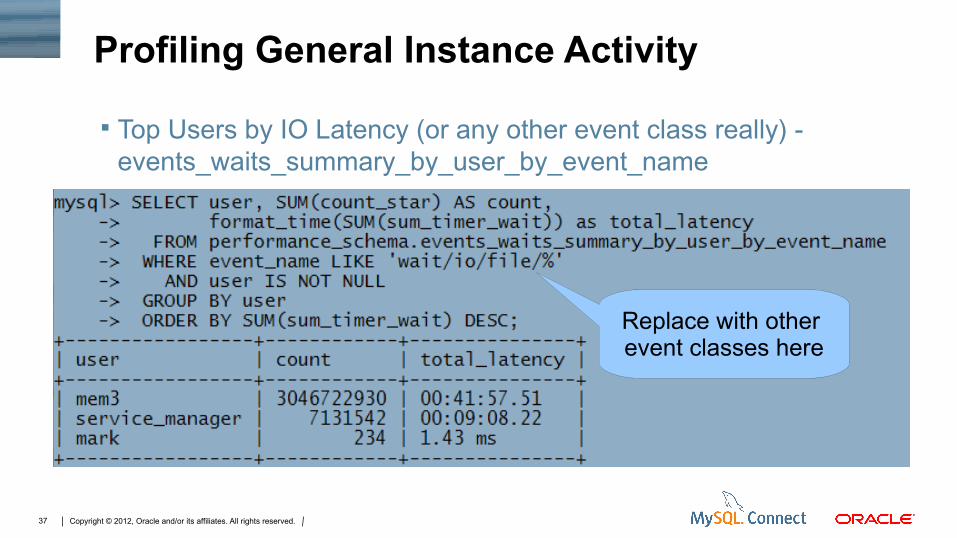
§ Top Users by IO Latency (or any other event class really) - events_waits_summary_by_user_by_event_name
Replace with other event classes here

Copyright © 2012, Oracle and/or its affiliates. All rights reserved.38
Profiling General Instance Activity
§ Top Users by Statement Latency - events_statements_summary_by_user_by_event_name

Copyright © 2012, Oracle and/or its affiliates. All rights reserved.39
Profiling General Instance Activity
§ Top Users by Connections – users, hosts, accounts tables

Copyright © 2012, Oracle and/or its affiliates. All rights reserved.40
Profiling General Instance Activity
§ 3 summary views have been added in 5.6, to compliment Table IO§ objects_summary_global_by_type
– A high level aggregate view of database object latency
§ table_io_waits_summary_by_table
– A detailed aggregate by table, breaking down reads, writes, etc.
§ table_io_waits_summary_by_index_usage
– Further breaking down usage per index
§ Analyzing Table Activity

Copyright © 2012, Oracle and/or its affiliates. All rights reserved.41
Profiling General Instance Activity
§ Top Tables by Latency - objects_summary_global_by_type
Less events, yet higher latencyis a sign that there could be
concurrency issues

Copyright © 2012, Oracle and/or its affiliates. All rights reserved.42
Profiling General Instance Activity
§ Table Breakdown by Usage - table_io_waits_summary_by_table

Copyright © 2012, Oracle and/or its affiliates. All rights reserved.43
§ Search in the “table_io_waits_summary_by_index_usage” table where index_name is null
§ This is a catch all row for rows read without indexes
Profiling General Instance Activity
§ Tables with Full Scans

Copyright © 2012, Oracle and/or its affiliates. All rights reserved.44
§ Search for indexes in the “table_io_waits_summary_by_index_usage” where count_star = 0
§ Should ensure that you have a representative time frame before using this!
Profiling General Instance Activity
§ Tables with Unused Indexes

Copyright © 2012, Oracle and/or its affiliates. All rights reserved.45
§ Exposes hosts cached for DNS§ Counts errors, per error type§ Shows when errors started
happening§ Compare sum_connect_errors
to max_connect_errors
Profiling General Instance Activity
§ host_cache (New in 5.6)

Copyright © 2012, Oracle and/or its affiliates. All rights reserved.46
Profiling General Instance Activity
§ Looking at the summary data gives a great idea of overall loads§ Looking at the rates of change for certain events can give you a
better idea of utilization in certain cases§ For example, the
wait/synch/cond/sql/MYSQL_RELAY_LOG::update_cond event tracks the time spent waiting in the replication SQL thread for new events to be written to the relay log – inversely, this is the SQL thread idle time
§ Computing Rates of Change

Copyright © 2012, Oracle and/or its affiliates. All rights reserved.47
§ An example of monitoring this over time
§ Given the history, we can also compute moving averages
Profiling General Instance Activity
§ Slave Load Average
http://www.markleith.co.uk/2012/07/24/a-mysql-replication-load-average-with-performance-schema/

Copyright © 2012, Oracle and/or its affiliates. All rights reserved.48
Profiling Statement Activity

Copyright © 2012, Oracle and/or its affiliates. All rights reserved.49
Profiling General Instance Activity
§ To look at how things change over time, record the events you are interested in within a persistent history table
§ Get current stats from performance schema for a specific thread, the last row of history, compute the time delta and event count delta
§ If interested in calculating percentages et al, copy the approach shown in my replication load average – you have to take in to account waiting 100% on other events, or just this event, etc.
§ Computing Rates of Change

Copyright © 2012, Oracle and/or its affiliates. All rights reserved.50
Profiling General Instance Activity
§ Note, this method can not be used generally, you have to be able to correlate it to specific thread(s)
§ As latency is per thread, and you have to compare to a known time delta, summary views do not give this to you (you don’t get thread counts per interval)
§ However, when tied to a specific threads such as the SQL thread, you can compute other events in the same way – file IO latency for example
§ Computing Rates of Change Caveats

Copyright © 2012, Oracle and/or its affiliates. All rights reserved. Insert Information Protection Policy Classification from Slide 1251
Profiling Statement Activity

Copyright © 2012, Oracle and/or its affiliates. All rights reserved.52
Profiling Statement Activity
§ The new instrumentation in 5.6 gives many options§ See statements running currently with events_statements_current§ Summary views by user, host, account
§ Statement history with events_statements_history*● And link to stages, and waits, with “nested events”
§ A normalized view with events_statements_summary_by_digest
§ Statement Profiling Options

Copyright © 2012, Oracle and/or its affiliates. All rights reserved.53
§ Exposes the currently executing, or last executed (if no current) statement per thread – executing = “timer_end IS NULL”
§ Stats are incremented “live” for running statements
Profiling Statement Activity
§ events_statements_current

Copyright © 2012, Oracle and/or its affiliates. All rights reserved.54
Profiling Statement Activity
§ Generating a Detailed Processlist by JOINing to threads
Writing temp tableto disk

Copyright © 2012, Oracle and/or its affiliates. All rights reserved.55
Profiling Statement Activity
§ History of completed statements (last 10 per session by default!)

Copyright © 2012, Oracle and/or its affiliates. All rights reserved.56
Profiling Statement Activity
§ Statement Summaries Per User
Summarizedby statement type,
I.e:statement/sql/selectstatement/sql/update

Copyright © 2012, Oracle and/or its affiliates. All rights reserved.57
Profiling Statement Activity
§ Stage Summaries Per User

Copyright © 2012, Oracle and/or its affiliates. All rights reserved.58
Profiling Statement Activity
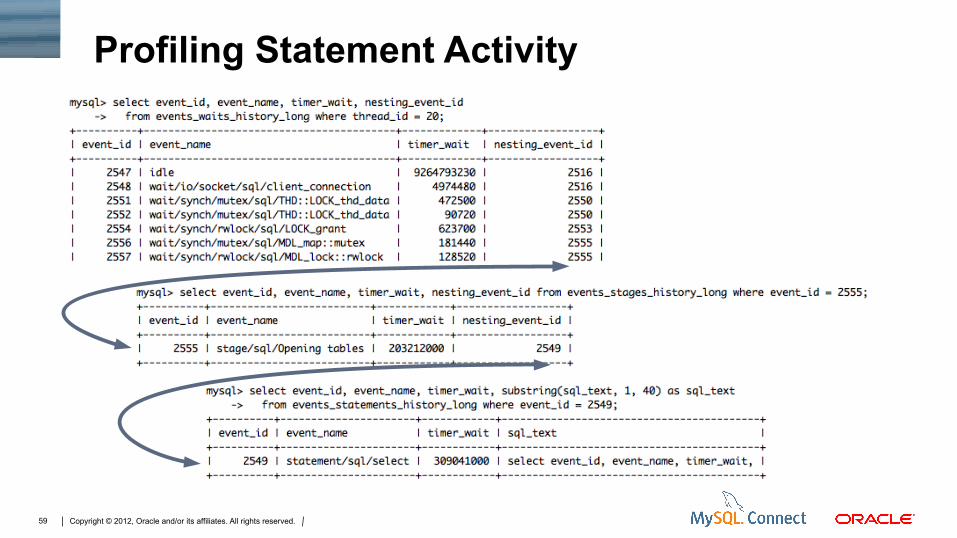
§ By taking all available data in the “*_history_long” tables, we can build a complete picture of what sessions and statements are doing
§ We can link the histories of Statements, Stages and Waits using the “event_id” and “nesting_event_id” columns, which define hierarchy
§ This is only really effective on development/test systems, production systems with concurrency age history very very quickly, and turning the *_history_long tables on with all instrumentation on is probably not recommend
§ Tracing Statements
Copyright © 2012, Oracle and/or its affiliates. All rights reserved.59
Profiling Statement Activity

Copyright © 2012, Oracle and/or its affiliates. All rights reserved. Insert Information Protection Policy Classification from Slide 1260
http://www.markleith.co.uk/ps_helper/ps_helper-dump_thread_stack/
This means we can graph their relationships!

Copyright © 2012, Oracle and/or its affiliates. All rights reserved.61
Profiling Statement Activity
Copyright © 2012, Oracle and/or its affiliates. All rights reserved.62
Profiling Statement Activity
§ A new summary view that presents aggregated statistics for normalized statements
§ Can be used to drill in to your problem statements instead of using the Slow Query Log, online (and it has more info)
§ Each statement gets an MD5 “DIGEST”, that is also available to link in to events_statements_current / events_statements_history etc. for raw per query statistics, if wanted
§ Statement Digests

Copyright © 2012, Oracle and/or its affiliates. All rights reserved.63
Profiling Statement Activity

Copyright © 2012, Oracle and/or its affiliates. All rights reserved.64
Profiling Statement Activity
§ Normalization folds certain constructs of statements
– Strip whitespace / comments
– Replace literals with ?, such as “WHERE foo = 1” becomes “WHERE foo = ?”
– Folds lists of things, such as “IN (1,2,3)” becomes “IN (…)”
– Folds multi-row inserts, such as “VALUES (1), (2)” becomes “VALUES (?) /*, … */”
§ Statement Normalization

Copyright © 2012, Oracle and/or its affiliates. All rights reserved.65
Profiling Statement Activity
More rows scannedThan returned
Has errors/warnings
Lots of temp tables
Doing full table scans

Copyright © 2012, Oracle and/or its affiliates. All rights reserved.66
Profiling Statement Activity
§ Statements with Temporary Tables

Copyright © 2012, Oracle and/or its affiliates. All rights reserved.67
Profiling Statement Activity
§ Statements with Full Table Scans

Copyright © 2012, Oracle and/or its affiliates. All rights reserved.68
Wrapping Up
§ This is really just scratching the surface, there are 533 instrument types within 5.6, and many more columns that can be used to filter for different views
§ There are many other ways to look at the data that I haven’t presented here
§ I hope this gives you a helping start in how to start looking at the data though!
§ All of these views, and more, are available within ps_helper on my site!