profit-led growth and the stock market - peri
TRANSCRIPT

PO
LIT
ICA
L E
CO
NO
MY
R
ESEA
RC
H IN
ST
ITU
TE
Profit-Led Growth and the Stock Market
Thomas R. Michl
May 2016
WORKINGPAPER SERIES
Number 419

Profit-led Growth and the Stock Market
Thomas R. MichlDepartment of Economics
Colgate University13 Oak Drive
Hamilton, NY [email protected] 1
August 26, 2015
1The author thanks Javier Lopez Bernardo for challenging him to tackle the prob-lem of corporate capitalism and for guiding him through the relevant literature on fi-nancial markets. He thanks Engelbert Stockhammer for hosting him in the EconomicPolicies in the Age of Globalization (EPOG) Masters Course program at KingstonUniversity, which made these conversations possible in the first place, and Laura Car-valho for helpful comments on an earlier draft. Finally, he thanks Duncan Foley forsuggesting some key formalizations that facilitated constructing the model and helpfulcomments on an early draft. All views and errors in the paper are the sole responsi-bility of the author, of course.
Abstract
Profit-led Growth and the Stock Marketby Thomas R. MichlJEL E12, E21, E44
Keywords: Pasinetti Paradox, Cambridge equation, q-ratio, heterodox growthmodel, stock-flow consistency
This paper presents a simple stock-flow consistent model of corporate capitalismwith a financial market for firm equities issued by managers as part of theirinvestment plan with the investment rate in turn sensitive to the q-ratio, workerswho save for life-cycle motives, and capitalist rentier households who save froma bequest motive. The model assumes full capacity utilization; saving andinvestment decisions are co-ordinated through changes in the valuation of thecapital stock or q-ratio. Changes in valuation can induce enough investmentand capitalist consumption to fill the demand gap left by a reduction in thewage share. But unless there is a strong sensitivity of investment to the q-ratio, the increased profitability will be dissipated in a profit-led stock marketboom. The model helps resolve the neoliberal paradox of rising profitability withlittle growth. It also clarifies the relationship between classical and Keynesiangrowth models which can be seen as special cases arising from limiting valuesof the investment sensitivity to the q-ratio.

When I was in graduate school at the New School for Social Research, thevenerated Keynesian economist Ed Nell asked us the following question on thequalifying exam for macroeconomics: “What is the significance of the fact thatwages are both the largest component of costs and the major source of de-mand for consumption goods?” It would not be an exaggeration to say that Ihave been searching for a good answer–joined by a major part of the hetero-dox community–for several decades! This paper puts forward one answer bywriting out a simple model of corporate capitalism with a financial market forfirm equities issued by managers as part of their investment plan, workers whosave for life-cycle motives, and capitalist rentier households who save from abequest motive. The model finesses the hoary debate over capacity utilizationby only studying fully adjusted steady state positions with utilization at its nor-mal level in order to focus on an alternative mechanism besides utilization forco-ordinating investment and saving decisions–changes in the valuation of thecapital stock.1 This setup stacks the deck against wage-led growth by showinghow changes in valuation can induce enough investment and capitalist consump-tion to fill the demand gap left by a reduction in the wage share–probably notthe answer Ed was looking for. But it turns out that profit-led growth is not aforegone conclusion.
Previous writings (Michl, 2009, 2008) ventured the opinion that capitalisteconomies are Keynesian (demand-constrained) in the short run, but becomeclassical (profit-constrained) in the long run as they return to normal levels ofcapacity utilization following in the tradition of Dumenil and Levy (1999). Thehomeostatic mechanism proposed for achieving this adjustment is a heterodoxversion of the 3-equation model. The key assumptions are that a Phillips curve-like relationship governs the inflation process, that it stabilizes around normalutilization, and that the monetary authority follows an explicit or implicit policyof inflation-targeting using the interest rates under its control to manage aggre-gate demand through the investment function. In this kind of model, dependingon the shape of the investment function, demand can be wage-led or profit-ledin the short run for all the reasons explored by Bhaduri and Marglin (1990).2
But once the system returns to normal utilization, the positive feedback fromwage-led consumption demand to utilization and back to investment loses itspurchase and the model reverts to profit-led behavior. Using the notation ofthe present paper, if capitalists consume a constant fraction, β, of their wealth,at full utilization the growth rate, g, and the profit rate, r, will satisfy a versionof the Cambridge Equation or g = r − β.3
1There is an extensive literature on corporate capitalism, including the Moore (1975) pa-per that we use below. Other important examples include Moss (1978), Lavoie (1998) andSkott and Ryoo (2008). For a survey of work on finance-constrained models of neoliberalism,including papers in the Bhaduri-Marglin tradition in which capacity utilization is treated asa long-run endogenous variable, see Hein and van Treeck (2010).
2Indeed, in Michl (2009) the investment function includes only capacity utilization and thereal interest rate so that wage-led growth is the only possibility in the short run.
3To anticipate some possible confusion, this equation is the continuous time form of thediscrete time Cambridge Equation that appears in Foley and Michl (1999), with a change ofnotation. Here β is a propensity to consume from wealth, while we used it in the discrete
1

This approach underwrites a clear division of labor in a macroeconomicresearch program insofar as it supports specialized models of growth in theclassical tradition as in Foley and Michl (1999) that abstract from aggregatedemand issues. But it suffers from several shortcomings. In particular, it priv-ileges saving decisions over investment decisions in the long run. Even if themanagers making investment decisions are relatively autonomous over the shortrun (so that the paradox of thrift can occur), the homeostatic property of thesystem prevents them from having any influence over the long run growth ratedetermined by the Cambridge Equation. This approach, in other words, sweepsthe potential for a conflict between the capitalist as rentier and the capitalistas manager under the rug. Moreover, it does not provide a very satisfying res-olution to a paradox of neoliberal capitalism that should be a priority concernto any economist who believes that on some level growth is profit-led. With allthe profits, where is the growth?
This paper in a sense bends the stick back toward the post-Keynesian viewthat the relative autonomy of capitalist managers is central to understandingmacroeconomics. We will maintain the assumption that the demand side of thesystem is fully adjusted (perhaps through the mechanisms described above) sothat we study steady states with full utilization. But we will include a marketfor corporate equity and a valuation ratio similar to Tobin’s Q that in effectresolves the contradiction between managers and rentiers. This model can shedlight on the theoretical status of classical growth models (which emerges asless secure than described above), on the role of the stock market in corporatecapitalism, and on the paradox of neoliberal capitalism.
1 Accounting
Worker households hold a proportion φ of stock shares issued by firms, andcapitalist households hold the rest. The balance sheets of the households andthe firms are given by three equations, written in the standard order with assetson the left-hand side and financial liabilities plus net worth on the right. Thisfollows from the definition of net worth or wealth as assets minus liabilities. Thebalance sheets are
φPEE = JW
(1− φ)PEE = JC
K = PEE + JF .
Here E (for equities) is the number of stock shares and PE is the price ofa share. Capitalist net worth is JC , worker net worth is JW , and firms are
time equation to refer to the propensity to save out of wealth. The change reduces clutter inthe equations below.
2

Table 1: A SAM for the corporate capitalist economy
Output Expenditures Changes incosts w c f claims Sum
Output uses Cw Cc I YIncomes
w W φ(1− sF )rK Y w
c (1− φ)(1− sF )rK Y c
f rK Y f
Flow of funds
w Sw −φPEE 0
c Sc −(1− φ)PEE 0
f Sf −I PEE 0Sum Y Y w Y c Y f 0 0
Here w, c, and f refer to worker households, capitalist households, and firms,and Y i (i =w,c,f) is each sector’s income. Si is sector saving on a nationalaccounting basis.
assumed to have net worth, JF . The valuation ratio, q (since it is similar toTobin’s q), is the ratio of wealth to capital or q = J/K, making JF = (1− q)K.
Corporate managers decide on the growth of capital (investment) and makefinancial decisions about external financing which is restricted to stock issuancesince we abstract from loans, bonds, and banks. For simplicity, assume thatcapital does not depreciate, making the net and gross rates of profit identicaland equal to the product of the profit share and the output-capital ratio (akacapital productivity) or r = πρ. Managers retain a fraction of profits, sF , anddistribute (1 − sF ) as dividends to the households. Working with continuoustime, and using the dot notation to indicate a time derivative, their financialplan is to combine retained earnings and stock issuance to finance investment:
I = sF (rK) + PEE.
A social accounting matrix, abbreviated SAM, is a useful tool for showingthe relationship among firms and households, both worker and capitalist. Table1 presents the SAM for a corporate capitalist economy following Foley andTaylor (2006) with some minor changes. The conventions are straightforward.Corresponding rows and columns have equal sums, rows show the sources, andthe columns show the uses of funds. The first row shows the demand breakdownof domestic product into worker and capitalist consumption and investment.The first column gives the decomposition of domestic product into wages andprofits. The next set of columns, w through f, shows how income is allocated overconsumption and saving. The next column (unlabeled) is where firm investmentspending is placed. Investment is a pivot to the next column that shows the
3

stock sales used to finance investment.The second block of rows, w through f, shows the “flow of funds” for each
sector. The convention is that sources of funds are assigned a positive sign, anduses of funds receive a negative sign. Worker saving (Sw) and capitalist saving(Sc) are used to purchase the stocks issued by firms to fund investment. Capi-talist firms use retained earnings (Sf ) and stock issuance to finance investment.
We need to be careful and note that capitalist and firm saving are definedhere using the national income accounting definition which is value-added minusconsumption. In the U.S., the national income and product accounts are oftenabbreviated NIPA, so let us call this “NIPA saving.”
The alternative definition of saving includes capital gains as part of income.Since this is a more inclusive definition of income, it is sometimes called compre-hensive saving. Comprehensive saving is the change in net worth of each sectoror the sum of its NIPA saving from the SAM and capital gains from risingstock prices. With this adjustment the flow of funds from the SAM cumulatessmoothly into changes in balance sheets.
This cumulation operates through the revaluation accounts, which can bewritten as three equations that result from differentiating the balance sheetsand solving for the change in net worth (i.e., comprehensive saving) using thefact that with no depreciation I = K:
˙JW = φ(PEE + PEE) = Sw + φPEE˙JC = (1− φ)(PEE + PEE) = Sc + (1− φ)PEE
JF = I − PEE − PEE = Sf − PEE.
Notice that capital gains and stock transactions are offset between firms andtheir owners so that the familiar national accounting identity between savingand investment holds for both definitions of saving, or
˙JW + ˙JC + JF = Sw + Sc + Sf = I.
Capital gains are a potential source of confusion. For the individual capi-talist, the fact that others are willing to purchase her stocks for a higher pricecreates the opportunity to realize a capital gain in order to finance consump-tion and constitutes an increase in private wealth. But at a social level, capitalgains represent purely fictitious income or wealth since they cannot increase theaggregate wealth of the capitalist households and the firms they own which inour model is the actual capital stock, K = JW + JC + JF . This equation is theconsolidated national balance sheet.
2 The financial market
With this accounting framework and the financial plan of the firms, we canfollow Moore (1975) to derive several key relationships that must prevail in a
4

steady state in the capital market. The rate of growth of the number of sharesdepends on the rate of retained earnings.4 The rate of growth is g = I/K. Thenwe can see that the growth of stocks is
E/E =g − sF r
q.
From the balance sheet identity of the firms, we can derive an expressionfor the steady state growth of stock prices. In a steady state, valuation willstabilize and q = 0. Stock prices obey
PE/PE =g(q − 1) + sF r
q.
(This will also be the growth rate of dividends in a steady state.) We can seehow corporate financial policy determines the growth of stock prices in a steadystate with stable valuation ratio and constant growth.
While the firms earn the profit rate, r, on capital, households earn a rateof return on their stock holdings, rE , that we will call the equity yield.5 In asteady state that lasts indefinitely, the equity yield is often thought of as thediscount rate that capitalizes the future dividends and capital gains at existingstock prices, and it is frequently referred to as the required rate of return or thecost of (equity) capital.6 It can be defined as the sum of the dividend yield andthe rate of appreciation of stock prices, or capital gains:
rE =(1− sF )rK
PEE+PE
PE.
These definitions and balance sheet identities are sufficient to define therelationship between the rate of profit and the equity yield. The managerialdecision about the mix of external and internal financing drops out, and we areleft with:
rE =1
q[r + g(q − 1)].
When firms’ capital is valued one-to-one in the financial markets and q = 1,these rates will be equal.7 We will see how this situation validates the abstrac-tion of a classical economy with pure capitalists making saving and investmentdecisions that are identical by construction.
4It is sometimes convenient to represent the share of investment financed by stock issuance,ι = PEE/I. Replacing PEE with ιI, and rearranging we find that ι = 1 − sF (r/g).
5The term return on equity is sometimes used instead of equity yield but that has analternative usage referring to leveraged financial institutions, in particular banks, which is apotential source of confusion. I am indebted to Javier Lopez Bernardo for pointing this out.
6This latter term is deeply misleading from a classical point of view because it commits acategory error. There is no “cost” to a firm to selling stocks that is analogous to the cost ofbuying labor-power or intermediate goods. The usage is an atavism that reflects the belief inneoclassical economic theory that capital is a resource rather than a social relationship.
7An alternative way of writing this equation is to solve for the valuation ratio, in whichcase we have the Kahn formula q = (r − g)/(rE − g) which shows how the valuation ratiorepresents the relative profitability of capital.
5

But when the valuation ratio is not unity, the returns that households ex-perience on their accumulated wealth will not be the same as the returns themanagers experience on real accumulation. When q is greater than unity, thereturn on stock holdings will fall short of the rate of profit, and vice versa.
It is significant that the corporate saving rate drops out of the derivation.Once the equity yield is determined, the managers’ decisions about financingestablish how those returns will be split between dividend yield and capitalgains, but they have no deeper significance.
3 Distribution
We will adopt the classic closure for this growth model by treating the profitshare as a structural feature of capitalism, an economic surplus (over)determinedby factors such as bargaining power in the labor market, the pricing powerof firms in the product market, corporate policies, and state regulatory, fiscaland monetary policies. In this case, labor supplies are available in the longrun, perhaps because there is a sizable global reserve army of labor, leaving thegrowth rate free to be determined endogenously.8 Together with the assumptionof normal utilization, which makes the output-capital ratio exactly ρ, this closuredetermines the rate of profit.
Since a global increase in the profit share has been a pervasive characteristicof neoliberal capitalism at the end of the twentieth and dawn of the twenty-firstcentury, we will endeavor to interpret this structural change through the model.
4 Households
We will adopt models of worker saving and capitalist saving from Foley andTaylor (2006), a resource for heterodox economists that also provides us with amodel of investment in the next section.
4.1 Workers
Workers save for life-cycle reasons and maintain a target wealth-wage incomeratio, λ. Out of a steady state, they make partial adjustments in saving inorder to converge over time on their target wealth-wage ratio but we will focuson steady states in which they are continuously achieving their target so thatJW = λW = λ(1 − π)ρK = λ(ρ − r)K. Differentiating this expression givestheir comprehensive saving equation for a steady state in which K = I = gK
˙JW = λ(ρ− r)gK.
Combined with the workers’ revaluation account, this equation plays animportant role in the model’s construction. Another important equation relates
8Foley and Michl (1999) call this closure the classical conventional wage share model.
6

the workers’ share of wealth to the q-ratio in a steady state. Since JW = φqK,we can see that when workers achieve their desired wealth stock their wealthshare will be
φ =λ(ρ− r)
q.
Worker saving and consumption are sensitive to the level of stock prices andthe q-ratio. A stock market boom, for example, makes it easier to achieve atarget level of wealth and in this way encourages consumption and discouragesworker saving. Workers’ steady state wealth share will decline as a result ofa stock boom. This insight will prove useful in interpreting the comparativeequilibrium analysis of the model’s steady states.
4.2 Capitalists
Capitalists save for bequest purposes and consume a constant fraction, β, oftheir beginning-of-period wealth. Thus, their consumption is simply Cc = β(1−φ)qK. Subtracting Cc from income (comprehensive or NIPA) gives capitalistsaving. For example,
˙JC = (1− φ)(1− sF )rK + (1− φ)PEE − β(1− φ)qK
gives the comprehensive saving of the capitalist households.For purposes of comparison with the version of the Cambridge Equation
used in Foley and Michl (1999), the capitalists save out of their dividends andcapital gains so that the growth rate of their wealth is given by9
˙JCJC
= rE − β.
Notice that capitalist wealth also depends on the q-ratio. There is a strongwealth effect from a stock market boom because it makes the individual cap-italist households feel wealthier, want to consume more relative to the capitalstock, and save correspondingly less. Alternatively, we could say that a highvaluation ratio implies a low equity yield and this reduces the desired growth ofcapitalist wealth according to the modified Cambridge Equation.
5 Firms
There certainly is much to be said about managerial capitalists but the modelfocusses on their power over the investment decision to the exclusion of othereconomic roles.10
9As a reminder, to reduce clutter we are using β as a propensity to consume rather thanas a propensity to save.
10Crotty (1990) makes a persuasive case that this role has been underappreciated in theq-theories of investment of Keynes, Tobin, and even Minsky.
7

We will generally assume that managers respond to the valuation ratio(which can also be interpreted as a measure of the relative profitability of capi-tal). Their investment equation might take some simple affine form such as
g = g + η(q − 1)
where η ≥ 0 is the q-sensitivity of investment. In this form, g gives the plannedrate of investment (normalized by the capital stock) when q = 1 and capturesthe animal spirits of the managers. This form implements the q-theory ofinvestment proposed by Keynes (1936). This equation will be labelled as theGG curve in Figure 1 below.
While in real economies, the sensitivity of investment to the q-ratio, if it evenexists, probably lies in an intermediate region, the two extreme cases bear closeattention because they capture important economic principles. If η = 0, wehave a kind of pure managerial capitalism in which managers have considerableautonomy and the separation of ownership and control is pushed to the limit.At the other extreme, as η →∞, we can replace the investment equation withthe condition that q = 1. In this case, we have a kind of stockholder or rentiercapitalism in which the managers give the wishes and desires of the owners theirutmost attention.11
In what follows, for expositional purposes we will begin by assuming theinvestment decision has been decided so that we can understand the changes inthe valuation ratio that are needed to maintain investment-saving equilibrium.
6 Investment-saving equilibrium
With a given investment rate, I = gK, we are in a position to describe investment-saving equilibrium in a steady state. We will call this the QQ curve. It differsfrom the traditional IS curve since we have set the investment equation asidefor expositional purposes.
Substituting into the investment-saving equation for NIPA saving, we findthat firm saving drops out on simplifying and we have
W − Cw + rK − Cc = I.
Capitalist consumption can be replaced by the capitalist consumption equa-tion. The term W − Cw can be replaced using the comprehensive saving ofworker households, their revaluation account, and the income identities fromthe SAM. Dividing through by the capital stock normalizes everything by K,and, since K = PEE/q, this leaves the growth rate of stock prices to eliminateusing the equation derived in the section on the capital market.12
The QQ curve shows the locus of q-ratios consistent with investment-savingequilibrium for chosen rates of investment. Solving for the q-ratio, we find that
11To be clear, note that this term is sometimes used to describe the increased role of financecapital, which is not what is meant in this paper.
12It is also necessary to use λ(ρ− r)g/φ = gq, which follows from the definitions of λ and q.
8

all the parameters related to worker households and the distribution of wealthcancel out and we are left with our QQ curve:
q =r − gβ
.
This would appear to be a variation of the Cambridge Theorem or PasinettiParadox. Here, interpreting the q-ratio as a measure of the profitability ofcapital relative to the yield on equity, we see that changes in worker saving haveno effect on the equity yield, given the rate of profit, capitalist propensity toconsume out of wealth, and the investment rate.
Solving the QQ equation for the rate of accumulation perhaps makes theconnection even clearer:
g = r − qβ.
We might call this the corporate capitalist form of the Cambridge Equationfor it shows that the relationship between growth and profitability is mediatedby capitalist consumption, including the effect of valuation, independently ofworker saving.
We can now solve for the general equilibrium in which the investment equa-tion is also satisfied. Substituting for g in the QQ curve, we find that theequilibrium valuation ratio q∗ is
q∗ =r − g + η
β + η.
The equilibrium growth rate, g∗, is then given by the investment equation,g∗ = g + η(q∗ − 1). The left-hand panel of Figure 1 illustrates a steady stateequilibrium with q∗ = 1, which conveniently locates the important landmarksthat position the QQ and GG curves, where the GG curve is the investmentequation. Let us call this diagram the QQ-GG model. Readers should have nodifficulty using it to interpret the next two paragraphs.
It is significant that q∗ = 1 implies that g∗ = g = r − β because this is theCambridge Equation that anchors the classic growth models in Foley and Michl(1999) and Michl (2009). In a sense, in this case managers have selected thegrowth rate that the rentiers would have chosen if they had control of the firm.
On the other hand, if, for example, g < (r−β), we can see from the QQ curvethat q∗ > 1, implying that rE < r. We learn from this model that the q-ratiois a measure of the lack of coordination between managers and owners. In thiscase, managers consulting their animal spirits plan less accumulation than thecapitalist owners would have chosen. The rise in the q-ratio above unity makesthe rentier households feel wealthier and incents them to consume more andsave correspondingly less (normalized by the capital stock). The q-ratio adjustsin order to make rentier saving plans consistent with the investment decisionsof the managers. The opposite inequalities, of course, can be interpreted asthe resolution of the conflict between rentiers who want more real growth thanmanagers. The QQ-GG model for a corporate capitalist economy is a transpar-ent tool for interpreting the role of the stock market in the structure of capitalaccumulation.
9

7 Wealth distribution
To complete the model, we turn to the distribution of wealth in a steady stateby exploiting the fact that the growth rates of capitalist and worker wealth mustmaintain equality in balanced growth or
˙JCJC
=˙JWJW
.
By substituting from the expressions for comprehensive capitalist and workersaving (without inadvertently making investment equal national saving, whichleads back to the QQ curve above), we arrive at the equation governing wealthdistribution in a steady state:
φ =λ(ρ− r)g
r − βq + (q − 1)g.
This equation shows combinations of φ, q, and g that are consistent withequality in the growth of capitalist and worker wealth. As we have seen, themodel solves recursively and we can substitute from the QQ-GG system abovein order to arrive at the equilibrium value φ∗:
φ∗ =λ(ρ− r)
q∗.
This equation (solved for q) appears in the right-hand panel of Figure 1 andis labelled the ΦΦ curve. Choosing an equilibrium at q∗ = 1 makes it easy tolocate the key landmarks. Notice that since workers cannot own more than thewhole wealth stock, there is a lower limit on the q-ratio at λ(ρ− r).
We have already seen the same equation as a direct implication of the work-ers’ target wealth-wage ratio. This makes it possible to characterize the wealthdynamics in an informal way. For example, a point to the right of the ΦΦ curveimplies that workers hold more wealth relative to their wage income than theydesire. Consequently, they will be reducing the growth of their wealth througha stock-adjustment process such as the one that Foley and Taylor (2006) use intheir dynamic model.
The whole QQ-GG-ΦΦ model in Figure 1 can be easily manipulated as anaid to understanding the effects of parameter changes on the corporate capitalisteconomy.
8 Steady states
The three endogenous variables in this model are q, g, and φ and they invitea comparative equilibrium analysis across steady states in which one of thecore parameters has changed. Absent an explicit model of stock price behavioraway from steady state equilibrium, we will proceed directly to the comparativeanalysis which will show presently that there are no awkward sign ambiguities
10

q
g
r/β
r
GG
1.0
g = r − β
q
φ
1.0
λ(ρ− r) 1.0
ΦΦ
Figure 1: The QQ-GG-ΦΦ diagrams with steady state at q = 1 for expositional clarity. Themodel determines the q-ratio, q∗, the rate of growth, g∗, and the workers’ share of wealth, φ∗.Left panel The QQ curve has the x-coordinate r − β at q = 1. The GG curve (investment)has the x-coordinate g at q = 1. Right panel The ΦΦ curve has the x-coordinate λ(ρ− r) atq = 1 and the y-coordinate (not shown) λ(ρ− r) at φ = 1.
that would call for an explicit dynamic formal structure in order to apply thecorrespondence principle. Given the well-known propensity of equity markets tolose contact with economic fundamentals, we should be cautious about assumingthat actual economies operate close to their steady states. We should alsoremind ourselves that the model’s assumption of full utilization suppresses anypossible demand problems that might arise over shorter time horizons.
8.1 General case
Table 2 shows all the important possibilities for the general case with a genericinvestment equation without any extreme parameter values; we discuss the lim-iting cases separately. The table shows the effect of parameter changes on steadystate equilibrium values of the endogenous variables. All of these thought ex-periments can be worked out with the aid of Figure 1.
Because of its central importance in the recent history of neoliberal capital-ism, the table starts in the first column with a structural change in the profitshare. An increase in the profit share will increase the profit rate, shifting theQQ curve to the right and the ΦΦ curve to the left in Figure 1. An increasedprofit share unambiguously reduces worker’s share of wealth. It also increasesthe growth rate–this is a profit-led model–but some of this effect will be dis-sipated by an increase in the q-ratio that makes the capitalist households feelwealthier and induces them to consume more. We will gain a deeper appreci-ation of the economic logic reflected in this sign configuration below when weturn to the two extremes of rentier and managerial capitalism.
The second column shows the effect of a change in the worker households’desired wealth ratio, presumably driven by a desire to provide more or less
11

Table 2: Comparative equilibrium results
dπ dλ dβ dg dηq < 1 q > 1
dq + 0 − − + −dg + 0 − + − +dφ − + + + + −
The table shows the signs of dr/dc where r is the row entry and c is the columnentry. It assumes that η, the q-sensitivity of investment, does not take extremevalues; for these, see text. As a reminder, π is the profit share, λ is the workers’desired wealth-wage ratio, β is the capitalist propensity to consume out of wealth,and g is the animal spirits parameter of managers.
generously for retirement. Owing to the recursive structure of the QQ-GGcomponent of the model, this change has no effect on growth or valuation inthe long run. An increase in λ shifts the ΦΦ curve to the right in Figure 1. Anincrease in worker saving would have a temporary effect on growth, but in thelong run it will have only a level effect on the capital stock, giving workers alarger share of a larger capital stock that is growing at the same rate as beforethe change in worker saving.
The remaining columns show the effect of changes in capitalist or managerbehavior. An increase in the capitalist households’ propensity to consume outof wealth rotates the QQ curve inward in Figure 1 and reduces both the q-ratioand the equilibrium growth rate. The reduction in the q-ratio will raise theworkers’ share of wealth.
An increase in managers’ animal spirits will shift the GG function to theright in Figure 1, reducing the q-ratio while increasing growth. The reductionin the q-ratio implies that the workers’ share of wealth will increase, which isnot particularly intuitive and we will return to the economic logic below.
Finally, an increase in the q-sensitivity of investment rotates the GG curvearound the landmark at q = 1, where there is a climacteric because dq/dη is zeroat that point, as are the other two derivatives. For values of the q-ratio below(above) unity, this rotation will raise (lower) the q-ratio. Another way to thinkabout this is to realize that as managers become more sensitive to valuation,the q-ratio will tend toward unity from whichever side of unity it starts. In thelimiting case of rentier capitalism, their behavior will maintain q = 1.
8.2 Rentier capitalism
In the case of rentier capitalism, the investment equation collapses to q = 1and the rate of growth follows the Cambridge Equation g∗ = r − β. It isimmediately clear that an increase in the profit share translates into highergrowth. Indeed, this case represents the highest degree of profit-led growthpossible in the QQ-GG-ΦΦ model. Workers have lower wages and will reduce
12

their consumption accordingly. Capitalists have a larger share of wealth andtheir consumption increases. (In terms of the QQ-GG-ΦΦ diagram, the GGcurve becomes horizontal at q = 1.)
In terms of the table of results, obviously the whole row for dq, the columnfor dg, and both columns for dη need to be zeroed out. The remaining signsin the table continue to apply with one interesting exception. Now an increasein the capitalist households’ propensity to consume will have no effect on thedistribution of wealth since it does not affect the ΦΦ curve or (as it would inthe more general case) the q-ratio so that dφ/dβ = 0. In a sense, this propertyof rentier capitalism inverts the Pasinetti Paradox since it insulates the workers’share of wealth from capitalist saving behavior.13 It will reduce growth of course.
8.3 Managerial capitalism
At the other extreme, when the investment equation reduces to g = g, anincrease in the profit share can get no purchase on growth. (In terms of theQQ-GG-ΦΦ diagram, the GG curve becomes vertical at this growth rate.)
Profit-led growth depends critically on the existence of some sensitivity toprofitability in the investment equation. Without that sensitivity we have aprofit-led stock market that drives up the valuation ratio which enriches thecapitalist agents and boosts their consumption. The increased profit share dis-sipates itself entirely in a rising q-ratio and capitalist consumption. Workersalso feel wealthier from the stock boom but they are constrained to save less(the wage share of income has fallen) and this erodes their share of nationalwealth.
In terms of the table of results, the entries in the row for dg (except dg/dg)and the two columns for dη need to be zeroed out by assumption. The remainingsigns in the table continue to apply without exception.
This extreme case brings out the logic behind the positive effect animalspirits have on the share of worker wealth. We know from the QQ-GG com-ponent of the model that an increase in growth requires that household savingadapt through a decline in the valuation of capital that makes capitalists feelsufficiently “impoverished” that they reduce consumption, adjusting their sav-ing plans to be consistent with the investment goals of the managers. Workerhouseholds also experience a negative wealth effect but evidently they increasetheir cumulated savings by more relative to the capitalists. This makes somesense because workers are saving for life-cycle reasons and will need to buildtheir retirement portfolio more aggressively to make up for the loss of theirstock market wealth.
13This is not true of the classical growth model in Michl (2009) which incorporates over-lapping generations of workers who save for life-cycle purposes with capitalists who save forbequest purposes. In that model, a reduction in the capitalist saving propensity will increasethe workers’ share of wealth. The invariance in φ in the current model appears to be anartifact of the formalization of worker saving.
13

9 Interpretation
A few words on the significance of this model of corporate capitalism for hetero-dox political economy are in order. The extreme cases effectively represent theworld of classical growth models (rentier capitalism) and post-Keynesian growthmodels (managerial capitalism). This means that classical growth models in thetradition of Foley and Michl (1999) need to be regarded as idealizations of aworld that is close enough (at least as a good first approximation) to rentier cap-italism to justify abstracting from the conflict between owners and managers.Obviously, the benefits of abstraction should not be overlooked: stripping outthe complexities of a financial system can spotlight some of the important re-lationships between capitalists and workers that might be lost or obscured inmore elaborate settings at a lower level of abstraction. That is the payoff tospecialization.
It is interesting that the proximity of really existing capitalism to the clas-sical idealization boils down to one parameter in the QQ-GG model, which isthe q-sensitivity of investment spending. Unfortunately, empirical research, al-most all of it motivated by the neoclassical version of q-theory, does not providemuch grounds for optimism that the q-sensitivity is particularly large or promi-nent.14 Yet the more Keynesian interpretation of the q-theory descending fromthe General Theory does appeal to common sense and intuition. The Keyne-sian intellectual tradition also points in the direction of a reconciliation withthe disappointing empirical results that would emphasize the degree to whichorganized capital markets are not primarily concerned with valuing prospec-tive yields so much as evaluating future stock prices themselves–in other words,stock markets are dominated by the spirit of speculation rather than of enter-prise. It is hard to believe that the post-Keynesian idealization, referred to hereas managerial capitalism, is on a noticeably firmer foundation, especially sincethe positive effects of profitability or cash flow on investment spending are wellestablished.
That the intermediate case which really existing capitalist economies ar-guably inhabit combines elements of both the classical and Keynesian visionrecommends the current model as a contribution to what theologians call “iren-ics,” the process of reconciling conflicting doctrines. What, after all, can bemore Marxian than the insight that the q-ratio is the financial form that re-solves the contradiction between owners and managers who personify differentaspects of the capital relation?15 Or what can be more Keynesian than theinsight that the q-ratio expresses the relative autonomy managers exercise overthe investment decision?
In this intermediate case, it is of some significance that aggregate demand
14See Chirinko (1993), still regarded as an authoritative survey of empirical work on invest-ment spending.
15We could take this a step further and observe that the use-value aspect of the commodityinscribes itself upon managers, concerned with real production and reproduction, while theexchange-value aspect of the commodity inscribes itself upon owners, concerned with purewealth and its disposition, so that the contradiction between these capitalist personalities hasroots in the very first chapters of Capital.
14

shocks in the form of changes in the animal spirits of managers have long-rungrowth effects. This does not happen in the simpler models of effective demandexplored in Michl (2009) where it is argued that some kinds of demand shockhave level effects rather than growth effects.
It is also of worth remarking that the q-ratio is as significant in understand-ing consumption behavior in this model as it is in understanding investmentbehavior. It would not be inaccurate to characterize the model as a synthesisof a q-theory of investment and a q-theory of consumption.
10 Unpacking the neoliberal paradox
The QQ-GG-ΦΦ model can also can be a tool through which to interpret thehistorical and statistical record of modern capitalism. One’s first instinct mightbe to view the neoliberal paradox of rising profit share without any apparentincrease in accumulation as the outcome of a natural experiment that mimicsour theoretical comparative equilibrium exercises, perhaps specialized to thecase of managerial capitalism. But we need to be mindful of the distinction JoanRobinson makes between historical and logical time. Comparative equilibrium,indeed equilibrium itself, belongs to the realm of logical time where we havefrozen everything else in order to study the effects of one mere parameter change.Real capitalist economies inhabit the space of historical time where everythingchanges at once and we are left to sort through the wreckage to understand theevents.
Table 3 displays some relevant data, dividing up the last half century intotwo periods that represent the pre-neoliberal era and the neoliberal era. Becausethe main data source, the BEA’s Integrated Macroeconomic Accounts (IMA),begins in 1960 I chose 1985 as the boundary in order to have a balanced sample oftwenty-five years for each era. It is immediately clear that the neoliberal era hasfeatured an increase in the profit share although compared to other data sourcesor methodologies, the increase of about one and a quarter percentage pointsappears to be on the low side. Averaging over twenty-five year periods probablyunderstates the extent of redistribution during the neoliberal era because theprofit share has risen over this era and because the profit share was unusuallyhigh during the 1960s. It should also be noticed that executive salaries andbonuses are treated as employee compensation in the national accounts, eventhough these are really quasi-profit type income, and reassigning at least someof this income to profits would certainly produce a more dramatic increase inthe profit share.16 With this in mind the table also displays the top one percentshare of total income and labels it π to signify that it is an alternative indicatorof the profit share. It exhibits a much sharper increase between eras.
The last line shows the bottom 99 percentile share of wealth, which might
16Indeed, as a referee for this journal pointed out, OECD (2012, Ch. 3) removes the laborincome of the top one percent from the U.S. wage share and reports that the profit share roseby 4.5 percentage points from 1990 to 2008, compared to only 2.3 percentage points withoutthis adjustment.
15
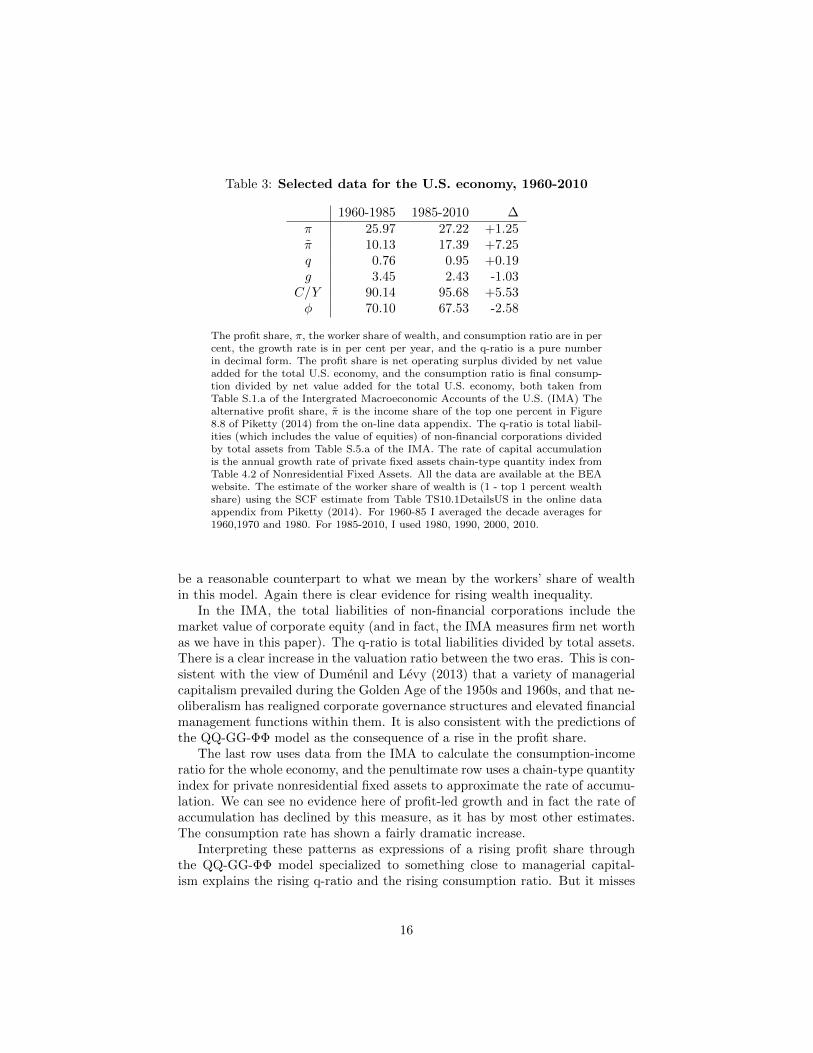
Table 3: Selected data for the U.S. economy, 1960-2010
1960-1985 1985-2010 ∆π 25.97 27.22 +1.25π 10.13 17.39 +7.25q 0.76 0.95 +0.19g 3.45 2.43 -1.03
C/Y 90.14 95.68 +5.53φ 70.10 67.53 -2.58
The profit share, π, the worker share of wealth, and consumption ratio are in percent, the growth rate is in per cent per year, and the q-ratio is a pure numberin decimal form. The profit share is net operating surplus divided by net valueadded for the total U.S. economy, and the consumption ratio is final consump-tion divided by net value added for the total U.S. economy, both taken fromTable S.1.a of the Intergrated Macroeconomic Accounts of the U.S. (IMA) Thealternative profit share, π is the income share of the top one percent in Figure8.8 of Piketty (2014) from the on-line data appendix. The q-ratio is total liabil-ities (which includes the value of equities) of non-financial corporations dividedby total assets from Table S.5.a of the IMA. The rate of capital accumulationis the annual growth rate of private fixed assets chain-type quantity index fromTable 4.2 of Nonresidential Fixed Assets. All the data are available at the BEAwebsite. The estimate of the worker share of wealth is (1 - top 1 percent wealthshare) using the SCF estimate from Table TS10.1DetailsUS in the online dataappendix from Piketty (2014). For 1960-85 I averaged the decade averages for1960,1970 and 1980. For 1985-2010, I used 1980, 1990, 2000, 2010.
be a reasonable counterpart to what we mean by the workers’ share of wealthin this model. Again there is clear evidence for rising wealth inequality.
In the IMA, the total liabilities of non-financial corporations include themarket value of corporate equity (and in fact, the IMA measures firm net worthas we have in this paper). The q-ratio is total liabilities divided by total assets.There is a clear increase in the valuation ratio between the two eras. This is con-sistent with the view of Dumenil and Levy (2013) that a variety of managerialcapitalism prevailed during the Golden Age of the 1950s and 1960s, and that ne-oliberalism has realigned corporate governance structures and elevated financialmanagement functions within them. It is also consistent with the predictions ofthe QQ-GG-ΦΦ model as the consequence of a rise in the profit share.
The last row uses data from the IMA to calculate the consumption-incomeratio for the whole economy, and the penultimate row uses a chain-type quantityindex for private nonresidential fixed assets to approximate the rate of accumu-lation. We can see no evidence here of profit-led growth and in fact the rate ofaccumulation has declined by this measure, as it has by most other estimates.The consumption rate has shown a fairly dramatic increase.
Interpreting these patterns as expressions of a rising profit share throughthe QQ-GG-ΦΦ model specialized to something close to managerial capital-ism explains the rising q-ratio and the rising consumption ratio. But it misses
16

the decline in accumulation. A more promising interpretation would empha-size that the same historical and institutional changes, broadly financializationand globalization, that have driven the search for profit-share by the corporateenterprises have simultaneously disincentivized investment through a variety ofmechanisms. As Hein and van Treeck (2010) explain, financialization has si-multaneously re-oriented managerial preferences toward profit share (i.e., awayfrom investment) and tightened the financial constraints imposed on them byshareholders and creditors. The former mechanism would show up here as ashift in animal spirits in the investment equation while the latter mechanismwould require adding in more structure (and, alas, complexity) to the model togive the financial policies of the managers an enhanced role.
Moreover, the prominent rise in the consumption ratio has been the subjectof an emergent and persuasive literature (Cynamon and Fazzari, 2014) em-phasizing the role of the housing bubble in the first decade of the twenty-firstcentury, the increasing importance of consumer debt, and Veblenesque con-sumption cascades that have reduced worker household saving. The life-cycletheory in the model, in other words, needs to be emended by the insights of therelative income hypothesis to get a complete picture. To this research effort theQQ-GG-ΦΦ model suggests adding the complementary role of a rising q-ratiostimulating an increase in capitalist household consumption, an hypothesis thatreceives some empirical support (Maki and Palumbo, 2001). Finally, we shouldnot rule out the possibility that financialization and neoliberalism in general mayhave shifted the saving behavior of rentier households, increasing their propen-sity to consume out of wealth. The number and magnitude of forces driving thepolarization of wealth raise the question whether the capitalist wealth share hasincreased enough or whether a decline in the capitalist saving propensity hasnot in fact attenuated its rise. This point is reinforced by a comparison betweenthe sharp rise in the top one percent income share and the less dramatic rise inthe top wealth share.
11 Comments
One main message of the QQ-GG-ΦΦ model of corporate capitalism presentedhere is that even under conditions that make wage-led growth impossible, profit-led growth is not the only theoretical possibility. A regressive distribution to-ward the profit share can express itself as profit-led growth in stock prices thatpromotes the consumption of the wealthy rentier households. The condition forthis outcome is a weak response by managers to the rise in the q-ratio. Thisresult goes a long way toward resolving the paradox that neoliberal capitalismis characterized by rising profits but stagnant or falling accumulation, but itprobably needs to be supplemented with other mechanisms such as the ten-dency of financialization to disincentivize investment. Another message of theQQ-GG-ΦΦ model is that there really is room for a syncretic (and not in thepejorative sense) resolution to some of the discord in the marriage of classicaland Keynesian economics that defines modern heterodox macroeconomics.
17

References
Bhaduri, Amit, and Stephen Marglin (1990) ‘Unemployment and the real wage:The economic basis for contesting political ideologies.’ Cambridge Journal ofEconomics 14(4), 375–393
Chirinko, Robert S. (1993) ‘Business fixed investment spending: Modelingstrategies, empirical results, and policy implications.’ Journal of EconomicLiterature 31(4), 1875–1911
Crotty, James R. (1990) ‘Owner-manager conflict and financial theories of in-vestment instability: A critical assessment of Keynes, Tobin, and Minsky.’Journal of Post Keynesian Economics 12(4), 519–542
Cynamon, Barry Z., and Steven M. Fazzari (2014) Inequality, The Great Reces-sion, and Slow Recovery Washington University (St. Louis). Xerox
Dumenil, Gerard, and Dominique Levy (1999) ‘Being Keynesian in the shortterm and classical in the long term: The traverse to classical long-term equi-librium.’ The Manchester School 67(6), 648–716
(2013) The Crisis of Neoliberalism (Cambridge MA: Harvard UniversityPress)
Foley, Duncan K., and Lance Taylor (2006) ‘A heterodox growth and distri-bution model.’ In Economic Growth and Distribution: On the Nature andCauses of the Wealth of Nations, ed. Neri Salvadori (Cheltenham: EdwardElgar) pp. 75–99
Foley, Duncan K., and Thomas R. Michl (1999) Growth and Distribution (Cam-bridge MA: Harvard University Press)
Hein, Eckhard, and Till van Treeck (2010) “‘Financialisation” in post-Keynesianmodels of distribution and growth: A systematic review.’ In Handbook ofAlternative Theories of Economic Growth, ed. Mark Setterfield (CheltenhamUK: Edward Elgar) pp. 277–292
Keynes, John Maynard (1936) The General Theory of Employment, Interest,and Money (New York: Harcourt, Brace)
Lavoie, Marc (1998) ‘The neo-Pasinetti theorem in Cambridge and Kaleckianmodels of growth and distribution.’ Eastern Economic Journal 24(4), 417–434
Maki, Dean M., and Michael G. Palumbo (2001) Disentangling the Wealth Ef-fect: A Cohort Analysis of Household Saving in the 1990s Federal ReserveBoard (Washington DC). Finance and Economics Discussion Series
Michl, Thomas R. (2008) ‘Tinbergen rules the Taylor rule.’ Eastern EconomicJournal 34(3), 239–309
18

(2009) Capitalists, Workers, and Fiscal Policy: A Classical Model of Growthand Distribution (Cambridge MA: Harvard University Press)
Moore, Basil J. (1975) ‘Equities, capital gains, and the role of finance in accu-mulation.’ American Economic Review 65(5), 872–886
Moss, Scott J. (1978) ‘The post-Keynesian theory of income distribution in thecorporate economy.’ Australian Economic Papers 17(31), 303–322
OECD (2012) OECD Employment Outlook 2012 OECD Publishing (Paris)
Piketty, Thomas (2014) Capital in the Twenty-First Century (Cambridge MA:Harvard University Press)
Skott, Peter, and Soon Ryoo (2008) ‘Macroeconomic implications of financial-ization.’ Cambridge Journal of Economics 32(6), 827–862
19