prognostics and systems health management -...
TRANSCRIPT

Prognostics and
Systems Health Management
Michael PechtDirector and Chair Professor
CALCE Electronic Products and Systems CenterUniversity of Maryland

University of Maryland: 2012
• Started in 1856• About 48,000 students• Ranked 13th in the world in engineering programs,
by The Institute of Higher Education and Center for World-Class Universities
• Ranked 8th in engineering in the USA: Wall Street Journal

3 Copyright @ 2012PrognosticsTM
CALCE Overview
• The Center for Advanced Life Cycle Engineering (CALCE) formally started in 1984, as a NSF Center of Excellence in systems reliability.
• One of the world’s most advanced and comprehensive testing and failure analysis laboratories
• Supported by over 120 faculty, visiting scientists and research assistants
• Received NSF innovation award in 2009

4 Copyright @ 2012PrognosticsTM
CALCE Research Funding (over $6M): 2011• Alcatel-Lucent• Aero Contol Systes• Agilent Technologies• American Competitiveness Inst.• Amkor• Arbitron• Arcelik• ASC Capacitors• ASE• Astronautics• Atlantic Inertial Systems• AVI-Inc• Axsys Engineering• BAE Systems• Benchmark Electronics• Boeing• Branson Ultrasonics• Brooks Instruments• Buehler• Capricorn Pharma• Cascade Engineering • Celestical International• Channel One International• Cisco Systems, Inc.• Crane Aerospace & Electronics• Curtiss-Wright Corp• CDI• De Brauw Blackstone Westbroek• Dell Computer Corp.• DMEA• Dow Solar• DRS EW Network Systems, Inc.• EIT, Inc.• Embedded Computing & Power• EMCORE Corporation• EMC
• EADS - France• Emerson Advanced Design Ctr• Emerson Appliance Controls• Emerson Appliance Solutions• Emerson Network Power• Emerson Process Management• Engent, Inc.• Ericsson AB• Essex Corporation• Ethicon Endo-Surgery, Inc.• Exponent, Inc.• Fairchild Controls Corp.• Filtronic Comtek• GE Healthcare• General Dynamics, AIS & Land Sys.• General Motors• Guideline• Hamlin Electronics Europe• Hamilton Sundstrand• Harris Corp• Henkel Technologies• Honda• Honeywell• Howrey, LLP• Intel• Instituto Nokia de Technologia• Juniper Networks• Johnson and Johnson• Johns Hopkins University• Kimball Electronics• L-3 Communication Systems• LaBarge, Inc• Lansmont Corporation • Laird Technologies • LG, Korea• Liebert Power and Cooling• Lockheed Martin Aerospace• Lutron Electronics• Maxion Technologies, Inc.• Microsoft
• Motorola• Mobile Digital Systems, Inc.• NASA• National Oilwell Varco• NAVAIR• NetApp• nCode International• Nokia Siemens• Nortel Networks• Nordostschweizerische Kraftwerke
AG (NOK)• Northrop Grumman• NTSB• NXP Semiconductors• Ortho-Clinical Diagnostics• Park Advanced Product Dev. • Penn State University• PEO Integrated Warfare• Petra Solar • Philips• Philips Lighting• Pole Zero Corporation• Pressure Biosciences• Qualmark• Quanterion Solutions Inc• Quinby & Rundle Law• Raytheon Company• Rendell Sales Company• Research in Motion• Resin Designs LLC• RNT, Inc.• Roadtrack• Rolls Royce• Rockwell Automation• Rockwell Collins• Saab Avitronics• Samsung Mechtronics• Samsung Memory• S.C. Johnson Wax• Sandia National Labs
• SanDisk• Schlumberger• Schweitzer Engineering Labs • Selex-SAS• Sensors for Medicine and Science• SiliconExpert• Silicon Power• Space Systems Loral• SolarEdge Technologies• Starkey Laboratories, Inc• Sun Microsystems• Symbol Technologies, Inc• SymCom• Team Corp• Tech Film• Tekelec• Teradyne• The Bergquist Company• The M&T Company• The University of Michigan• Tin Technology Inc.• TÜBİTAK Space Technologies• U.K. Ministry of Defence• U.S. Air Force Research Lab• U.S. AMSAA• U.S. ARL• U.S. Naval Surface Warfare Center• U.S. Army Picatinney/UTRS• U.S. Army RDECOM/ARDEC• Vectron International, LLC• Vestas Wind System AS• Virginia Tech• Weil, Gotshal & Manges LLP• WesternGeco AS• Whirlpool Corporation• WiSpry, Inc.• Woodward Governor

5 Copyright @ 2012PrognosticsTM
CALCECenter for Advanced
Life Cycle Engineeringfor
Electronic Products and Systems
Research Contracts
• Large scale programs • Medium to long-term durations• Contractual agreements• Examples:
Software development,testing, training programs
Electronic Products
and SystemsConsortium
•Risk assessment, management, and mitigation for electronics
Prognostics and Health
ManagementConsortium
• Techniques based on data trending, physics-of-failure, and fusion
Education
• MS and PhD programs• International visitors• Web seminars • Short courses for
industry
LabServices
• Small to medium scale• Rapid response• Examples:
Failure analysis, measurement,design review, supplier assessment
Standards• Putting CALCE
research to work for industry
• Examples:IEEE GEIA IPCJEDECIEC

6 Copyright @ 2012PrognosticsTM
CALCE Test Services and Failure Analysis Laboratory
• Conducted over 130 failure analysis studies for over 100 companies already in 2012
• Review of Electrical and Mechanical Design• Review of failure mode, mechanisms and effect analysis
(FMMEA)• Identification of critical-to-quality parameters• Materials and parts characteristics RoHS compliance evaluation • Virtual qualification and reliability assessment• Co-operation with government-industry data exchange program • Provides alerts for two fortune 500 electronic companies.

7 Copyright @ 2012PrognosticsTM
Non-Destructive EvaluationPhoenix Nanomex 3D X-ray Imaging SystemScanning Acoustic Microscope (SAM)Fourier Transform Infrared Spectroscopy (FTIR)Scanning Electron Microscope (SEM)Energy Dispersive Spectroscopy (EDS)Atomic Force Microscope (AFM)Automated Contact Resistance Probe (ACRP)Infrared Microscopy
Microelectronic Devices AnalysisAutomated Test Equipment
• IC Functional Parametric Testing• Temperature Range -80oC to 225oC
Impedance Analyzer (1.86Gz)Microcircuit ProbeTransistor and IC Curve TracerHigh Power Curve TracerDynamic Signal AnalyzerEvent DetectorsElectrometerLCZ Meter
Thermal Assessment and Management Hughes Infrared ProbeyeLiquid Crystal ThermographyLow Speed Wind Tunnel Hot Wire AnemometerFlow Visualization SystemHigh Speed Video CameraLaser Flash Thermal Properties MeasurementMaterials Thermal Emissivity Measurement Flow/Velocity Measurement FacilitiesPressure Measurement FacilitiesData Acquisition System
Materials Characterization Differential Scanning Calorimeters (DSC)Micro-Mechanical Materials Tester Thermo-Mechanical Analyzer (TMA)Dynamic Mechanical Analyzer (DMA)Creep Testing EquipmentThin Film Analyzer (TFA)Moisture Absorption SystemMaterials Test Systems (5 grams to 200 kg)
• High-strain rate characterization (100/sec)• Tests can be conducted in vacuum, inert or
reactive atmospheres (-125oC to 300oC)*Micro-Hardness Tester*Micro-Fatigue Tester*Adhesion Tester
Opto-Mechanics ExperimentationGeometric MoireMoire InterferometryMicroscopic Moire InterferometryShadow MoireInfrared Fizeau InterferometryTwyman/Green Interferometry
Sample Preparation Diamond SawDiamond BladePolishing and Grinding StationPlasma Etching
Failure AnalysisStereoscope (10x-63x)Optical Microscope (25x-2,500,000x)Image AnalysisFocused Ion Beam (FIB) Scanning Probe Microscope (SPM)
• Wavelength Dispersive SpectroscopyFEI Environmental Scanning Electron Microscope (ESEM)
• (25x-600000x) • Energy Dispersive Spectroscopy (EDS)• In-situ Heating/Mechanical Testing• Oxford Energy Dispersive Xray system (EDX)
TA Instruments DMATransmission Electron Microscope (TEM)Wire Pull, Bond Shear, and Die Strength Tester Package DecapsulatorIon ChromatographSIR TestingHollow Fiber AssessmentReal-time Solder Reflow SimulationComponent Popcorning Assessment
Virtual Qualification LabcalcePWACADMP-IIcalceFASTDefects
WebbookPEMs Webbook
Accelerated Test WebbookPWA Assembly WebbookIntegral Passives WebbookPWA Failure Mechanism
WebbookSensor Technology Webbook
Environmental/Accelerated TestingTemperature-Humidity ChambersHALT Temperature-Vibration ChambersThermal Shock ChambersHAST Temperature-Humidity ChambersHigh Altitude Simulation Chamber
• Pressure, Humidity, and Temp. CyclingHigh Temperature Aging ChambersMixed Flowing Gas (MFG) ChamberElectrodynamic Vibration ChamberImpact and Drop Test Apparatus
CALCE Facilities and Capabilities
EMI/EMC Characterization Precision Spherical DipoleLow- and High Impedance Probes for EMI/EMC DiagnosticsShielding Effectiveness
Measurements
*EMC Analyzer*Wave GeneratorSemi-anechoic ChamberVector Network AnalyzerSusceptibility Testing

8 Copyright @ 2012PrognosticsTM
CALCE Reliability Capability Audit Program
• CALCE EPSC has developed a process for reliability capability evaluation.
• This service is available to:– companies assessing potential suppliers or contract
manufacturers – organizations seeking a competitive edge through
self-improvement and independent evaluation• Many audits (e.g., Nortel, Nokia, Emerson, Huawei, Astec)
have already been completed.

9 Copyright @ 2012PrognosticsTM
CALCE Product Development Benchmarking
• CALCE benchmarking services involves– determining the current state-of-practice of the company– assessing the strengths and weaknesses of the company – comparing company to best-in-class– providing process improvement suggestions
• CALCE has developed methods for benchmarking of electronic industry supply chain members including system integrators, contract manufacturers, electronic packaging assembler, and electronic test laboratories
• Example benchmarks– AlliedSignal– Lucas Aerospace (TRW)– Microsoft– Nortel Networks– Bay Systems– Huawei - China– Honeywell– Nokia– Emerson
10 Copyright @ 2012PrognosticsTM
CALCE Design Reviews
• CALCE EPSC performs design reviews on electronicproduct designs and prototypes, drawing on the facultyexpertise, characterization facilities, and virtual qualificationcapabilities at the Center.
• Design reviews provide an understanding of reliability risksin a product before their release to the field.
• To date, CALCE has performed over 300 design reviews forleading electronics manufacturers.
• If you are interested, email [email protected] [email protected].

11 Copyright @ 2012PrognosticsTM
CALCE Publications

12 Copyright @ 2012PrognosticsTM
CALCE EPSC Short Courses for IndustryCourses offered:• Physics of Failure and Reliability • Plastic Encapsulated Microelectronics • Pb-free: Guide to Reliable Product Development• High Temperature Electronics • Optical Methods as a Tool for Microelectronics Product Development • Electronic Product and System Cost Analysis • Excellence in Supply Chain Management • Parts Selection and Management • The Next Generation of Electronic Parts: Processes, Tests, Applications, and Risks • Electronic Parts Outside the Manufacturer-specified Temperature Range • Electronic Part Obsolescence Forecasting, Mitigation and Management • Design for Reliability: Performing and Initial Assessment • Accelerated Product Qualification • Thermal Design and Assessment of Electronic Systems • Methodology and Tools to Solve EMI/EMC Problems • Failure (Root-Cause) Analysis of Electronic Products

13 Copyright @ 2012PrognosticsTM
CALCE: Monthly Continuing Educational Unit Webinars
•Power Electronics for Sustainable Energy Systems•Interconnect Durability of Package on Package Assemblies•Throwaway Electronics•Early Detection of Solder Joint Degradation,•Material Characterization Techniques for Part Authentication•Light Emitting Diode Failure Mechanisms•Impact of Isothermal Aging on Interconnect Reliability of Select Lead-Free Solders•Electrolytic Capacitor Quality and Reliability•Mitigation Strategies for Tin Whiskers

14 Copyright @ 2012PrognosticsTM
CALCE MissionProvide a knowledge and resource base to support the development and
sustainment of competitive electronic products
Strategies for Risk Assessment, Mitigation
and Management
Life Cycle Risk, Cost Analysis and Management
Accelerated Testing, Screening
and Quality Assurance
Supply Chain Assessment and Management
Physics of Failure, Failure Mechanisms
and Material BehaviorDesign for Reliability and
Virtual Qualification
Prognostics and Health
Management

15 Copyright @ 2012PrognosticsTM
Since 2002, Field Failures of These Devices Amounted to over $10B in Losses
Manufacturer IC function Package type Final product
Motorola Frequency Synthesizer, etc
Unspecified Automotive anti lock brake system (ABS)
Philips Unspecified 80 pin QFP Quantum, Hard disk drive
Cirrus Logic HDD controller 208 pin QFP Fujitsu, Hard disk drive
Infineon SIPMOS Small‐Signal‐Transistor
4 pin SOT 223 Unspecified
FairchildSemiconductor
Low Voltage Buffer Liner Driver
48 pin TSSOP Seagate
N‐channel MOSFET Various TSSOPs HP
Maxim Unspecified 48 pin TQFP Sony
Intersil Corp LSI’s for WLAN 20 pin QFN Unspecified
Conexant Unspecified ETQFP Unspecified
LSA Unspecified 128 pin TQFP Unspecified

16 Copyright @ 2012PrognosticsTM
Intel’s Flawed Chip2011
• Intel stopped shipping a new chipset after discovering a design flaw that causes computer connection ports to fail in three to five years, blocking access to stored data
• The standard tests of the chipset by Intel uncovered no problems.
• The interruption in production reduced Intel’s first-quarter 2011 revenue by $300 million.
• $700 million more was spent on fixing the chipsets and replacing those already built into computers.
17 Copyright @ 2012PrognosticsTM
Example: Nvidia Chipset Problem
• Around 2006, customers of various computers started to complain of intermittent failures in graphic processing units and communication processors
• Computer companies could not identify the problem since field returns generally exhibited no-fault found (NFF) behavior
• In 2008, Nvidia “confirmed” that certain computers were failing at higher than normal rates
• HP issued an extended warranty (and changed the BIOS) on many of its computers. Other companies followed. Loses were over $1B

18 Copyright @ 2012PrognosticsTM
Computer Failures : 2009 StudyA 2009 analysis of 30,000 new laptops found that in the first three years of ownership, nearly a third of laptops will fail.

19 Copyright @ 2012PrognosticsTM
September 2010Over 40,000 Toshiba Computers Recalled
- Took more than a year to track down, highly intermittent -

20 Copyright @ 2012PrognosticsTM
Failure of GovernmentFlight Routing Computer
November 18, 2009
• A computer failure in the FAA’s system for routing flights caused hundreds of flights to be delayed in cities across the USA
• This was the third failure of this system in two years

21 Copyright @ 2012PrognosticsTM
Millennium Bridge Shutdown due to Electronic Circuit Board Failure
World’s first bridge built to tilt to let ships pass under it, was shutdown due to a failure of the control computer. The bridge construction was valued to be $42 million.

22 Copyright @ 2012PrognosticsTM
Washington DC Rail Crash: 2010
23 Copyright @ 2012PrognosticsTM
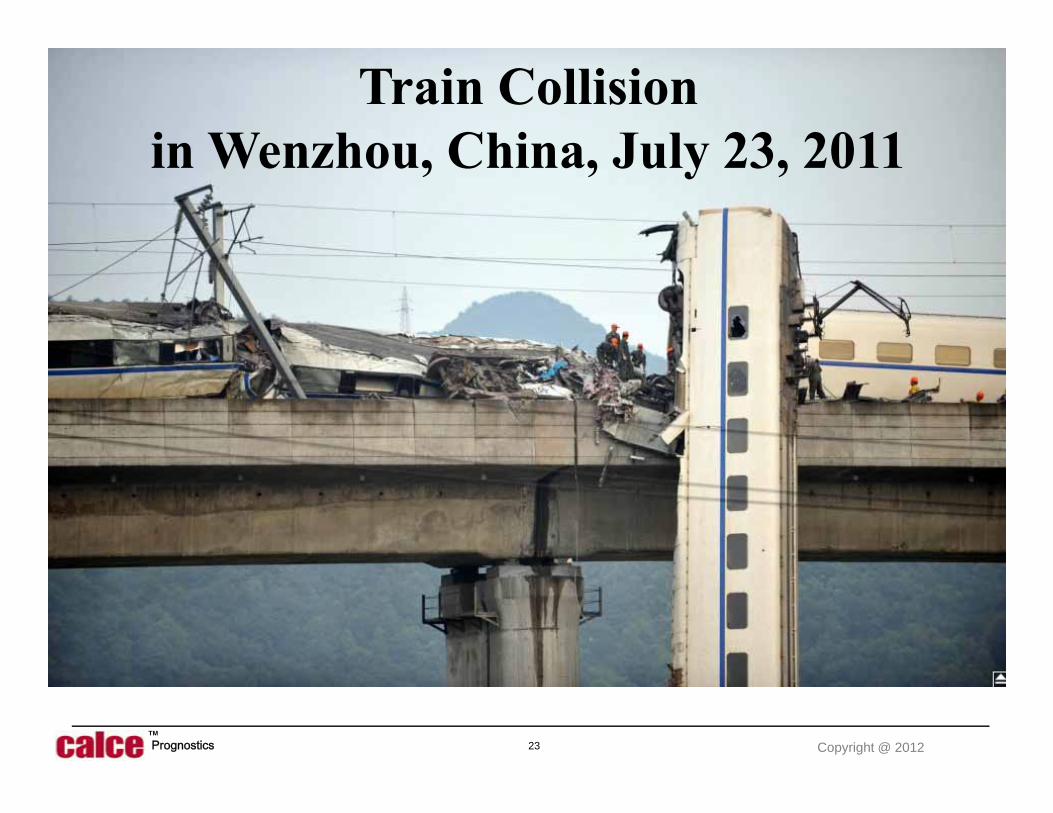
Train Collision in Wenzhou, China, July 23, 2011

24 Copyright @ 2012PrognosticsTM
Airline Cancels 152 FlightsMarch 26, 2011
• Alaska Airlines and its Horizon Air affiliate canceled 18 percent of the airlines combined schedule.
• The reason was failure of the computer used for flight planning

25 Copyright @ 2012PrognosticsTM
Oct 2010: Nissan 2.1 Million Car RecallFaulty Ignition Computer

26 Copyright @ 2012PrognosticsTM
Honda Recalls
• In August 2011, Honda recalled 2.3 million also due to a computer system reliability problem
• In September 2011, Honda recalled another 1 million cars over computer glitches
27 Copyright @ 2012PrognosticsTM
NASA Rocket Launch Failure: March 2011
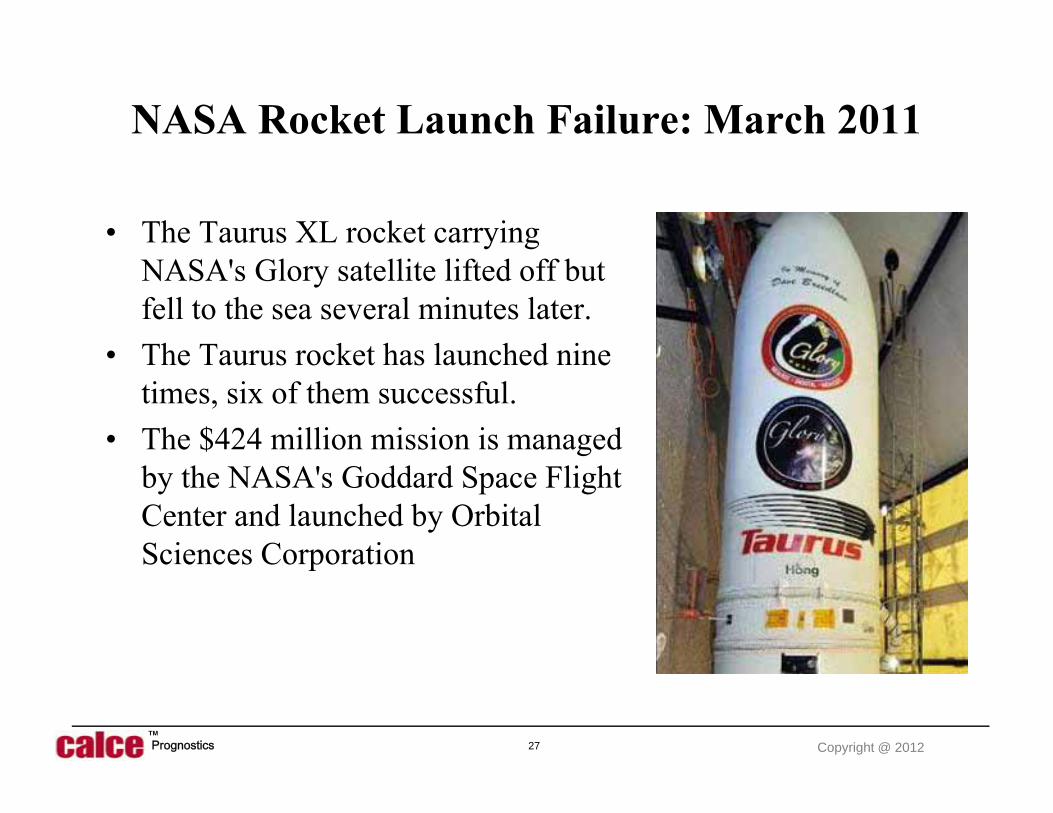
• The Taurus XL rocket carrying NASA's Glory satellite lifted off but fell to the sea several minutes later.
• The Taurus rocket has launched nine times, six of them successful.
• The $424 million mission is managed by the NASA's Goddard Space Flight Center and launched by Orbital Sciences Corporation

28 Copyright @ 2012PrognosticsTM
Failure Categories in 2004Other Sites 7%
Connectors 3%Interconnects/Solder Joints 13%
PEM 21%
Printed Board 26%
Capacitors 30%
Failure sites identified by root-cause analysis of 170 field returns of various electronic products from over 70 different companies (CALCE internal document)
Active Parts 21%
CALCE Failure Analysis Categories
Whyare mature part types failing ?

29 Copyright @ 2012PrognosticsTM
Reliability Challenges
• Why didn’t the qualification tests uncover the problems in advance ?
• Is it possible that components can pass the qualification tests but not be ‘healthy” ?
• Do we miss detecting failures that are occurring, but in an intermittent manner ?
30 Copyright @ 2012PrognosticsTM
The Electronics Marketplace
• Electronic materials, devices, assemblies, and products are changing very rapidly
• Supply-chains have become extremely complex and tremendous price pressures exist
• Severe competition from China

31 Copyright @ 2012PrognosticsTM
For Military SystemsSustainment costs - which are related directly to
reliability - dominate total system costsRDT&E Procurement Ops & Sustainment
Fixed Wing Fighters 9% 30% 62% Rotary Wing 6% 29% 64% Ground Systems 4% 24% 73% Surface Ships 1% 31% 68%
• Sustainment costs have five to ten times more impact on total life cycle costs than do RDT&E costs.
• US Gov’t studies indicate at least a seven-fold payback for up-front investment in better reliability.

32 Copyright @ 2012PrognosticsTM
• 1965: US military developed Mil-Hdbk-217: a handbook for reliability prediction of electronics
• 1980s: The telecommunications industry adopted the 217 approach with various modifications
History Reliability Prediction of Electronics

33 Copyright @ 2012PrognosticsTM
Mil-Hdbk-217 Methodology
= Q (C1 T V E) L

34 Copyright @ 2012PrognosticsTM
Electronics Reliability Prediction History of US Military
Mil-Hdbk-217A Dec 1965Preparing Activity: Navy
Single point constant failure rate of 0.4 failures/million hours for all monolithic ICs
Mil-Hdbk-217B July 1973Preparing Activity: Air Force Rome Labs
RCA/Boeing models simplified by Air Force to follow statistical exponential distribution
Mil-Hdbk-217C April 1979Preparing Activity: Air Force Rome Labs
Band-aid for memory. For example when 4k RAM model was extrapolated to 64K, predicted MTBF = 13 sec
Mil-Hdbk-217D Jan 1982Preparing Activity: Air Force Rome Labs
Band-aid. No technical change in format
Mil-Hdbk-217E Oct 1987Preparing Activity: Air Force Rome Labs
Band-aid. No technical change in format
Mil-Hdbk-217F Dec 1990Preparing Activity: Air Force Rome Labs
CALCE, University of Maryland – Change in direction recommended.

35 Copyright @ 2012PrognosticsTM
• 1988: CALCE was awarded a 3 year $2M US government contract to assess Mil-Hdbk-217 and provide guidance for the future
• Conclusion: Mil-Hdbk-217 and progeny (Telecordia, Prism and other similar handbook methods ) have fundamental flaws built into them.
History Reliability Prediction of Electronics
36 Copyright @ 2012PrognosticsTM
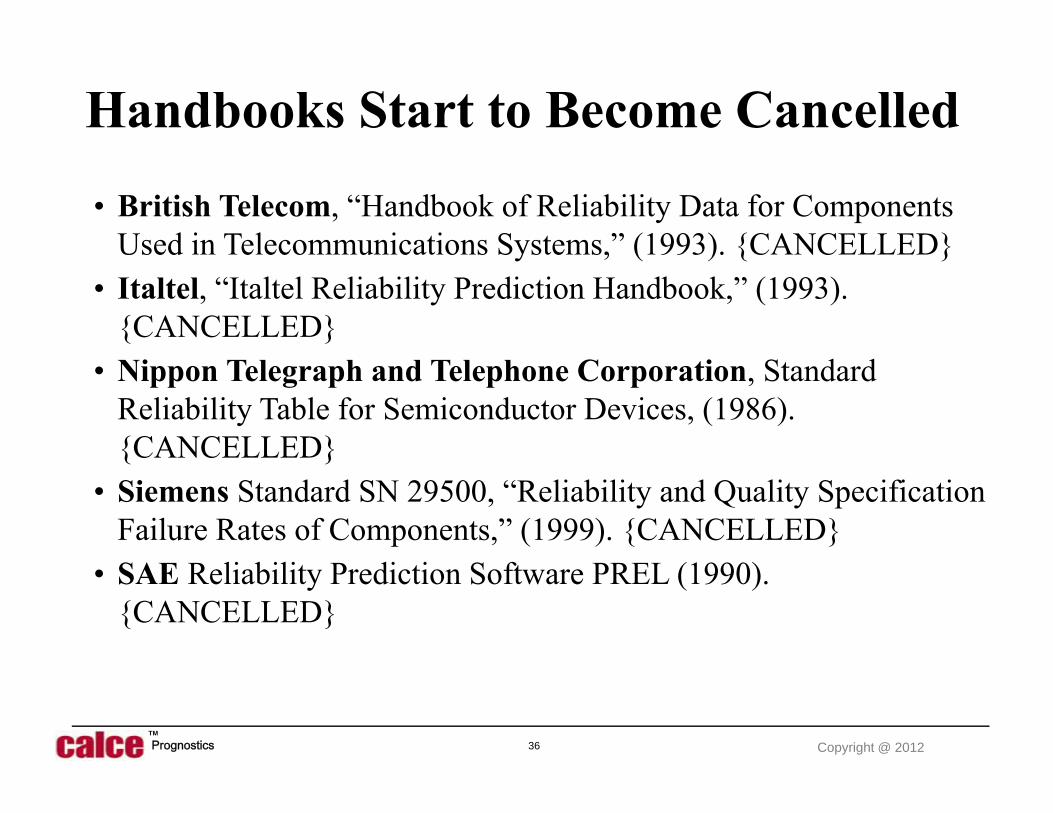
Handbooks Start to Become Cancelled
• British Telecom, “Handbook of Reliability Data for Components Used in Telecommunications Systems,” (1993). {CANCELLED}
• Italtel, “Italtel Reliability Prediction Handbook,” (1993). {CANCELLED}
• Nippon Telegraph and Telephone Corporation, Standard Reliability Table for Semiconductor Devices, (1986). {CANCELLED}
• Siemens Standard SN 29500, “Reliability and Quality Specification Failure Rates of Components,” (1999). {CANCELLED}
• SAE Reliability Prediction Software PREL (1990). {CANCELLED}
37 Copyright @ 2012PrognosticsTM
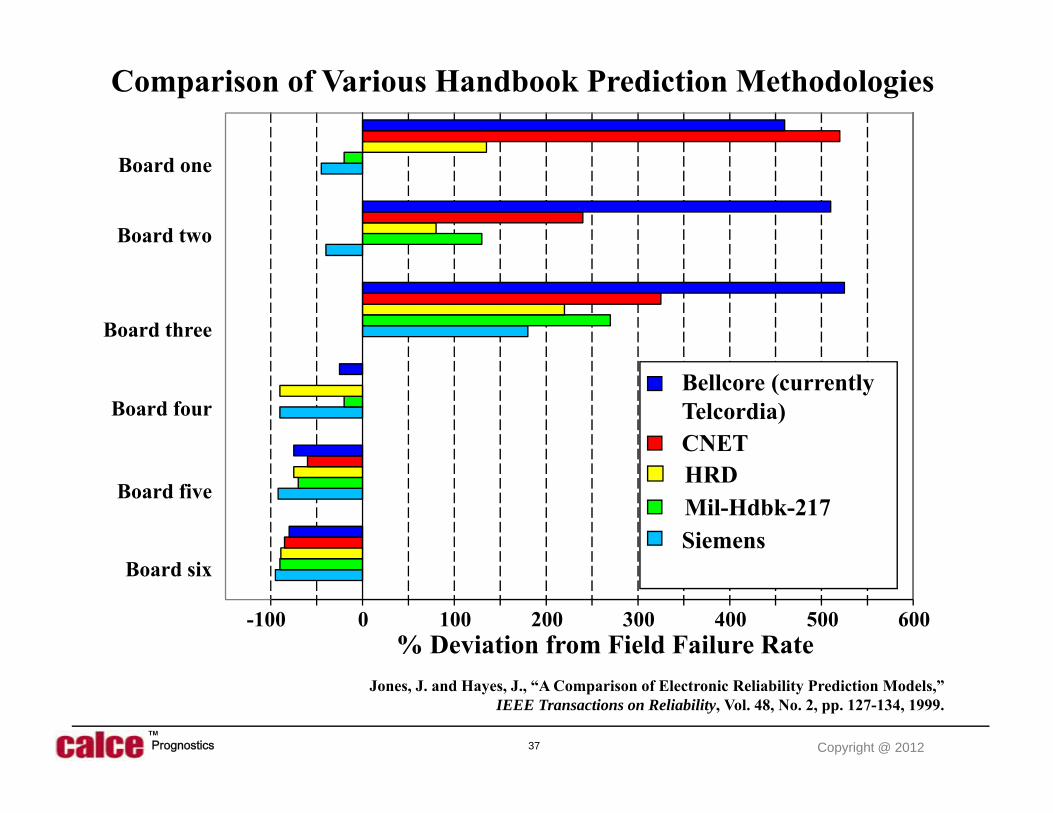
600-100 0 100 200 300 400 500
Bellcore (currentlyTelcordia)CNETHRDMil-Hdbk-217Siemens
Board one
Board two
Board three
Board four
Board five
Board six
% Deviation from Field Failure Rate
Comparison of Various Handbook Prediction Methodologies
Jones, J. and Hayes, J., “A Comparison of Electronic Reliability Prediction Models,” IEEE Transactions on Reliability, Vol. 48, No. 2, pp. 127-134, 1999.
38 Copyright @ 2012PrognosticsTM
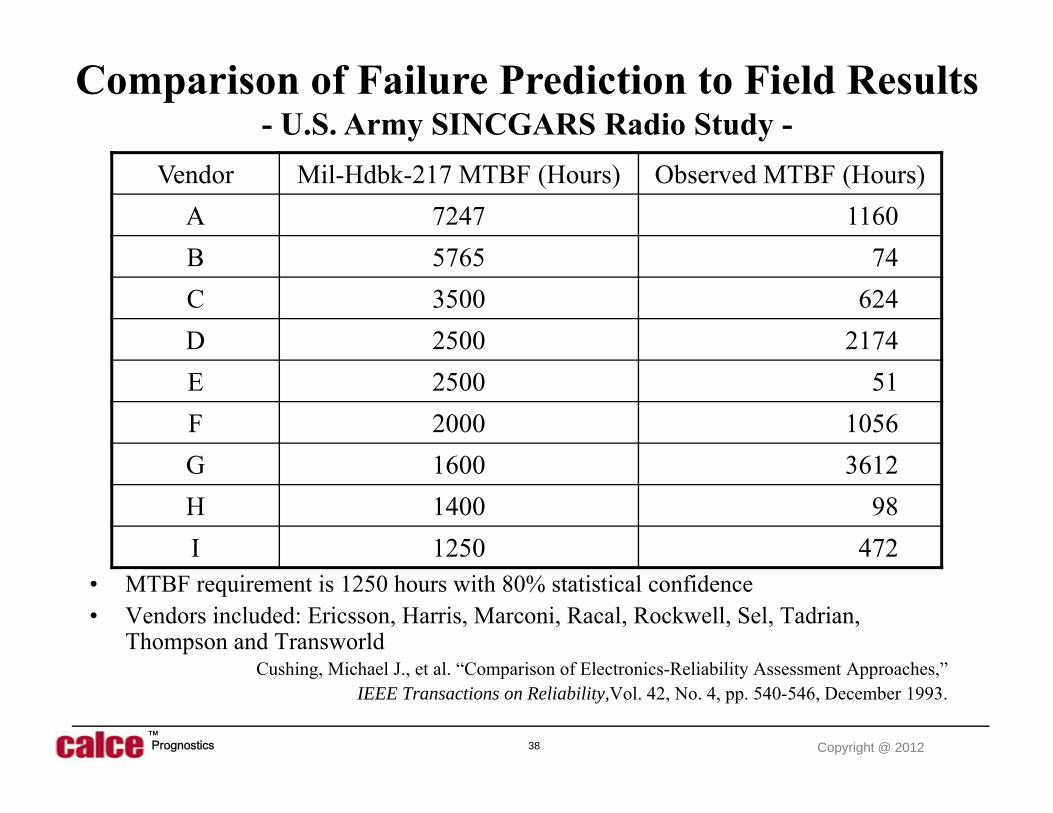
Comparison of Failure Prediction to Field Results - U.S. Army SINCGARS Radio Study -
• MTBF requirement is 1250 hours with 80% statistical confidence• Vendors included: Ericsson, Harris, Marconi, Racal, Rockwell, Sel, Tadrian,
Thompson and TransworldCushing, Michael J., et al. “Comparison of Electronics-Reliability Assessment Approaches,”
IEEE Transactions on Reliability,Vol. 42, No. 4, pp. 540-546, December 1993.
Vendor Mil-Hdbk-217 MTBF (Hours) Observed MTBF (Hours)A 7247 1160B 5765 74C 3500 624D 2500 2174E 2500 51F 2000 1056G 1600 3612H 1400 98I 1250 472
39 Copyright @ 2012PrognosticsTM
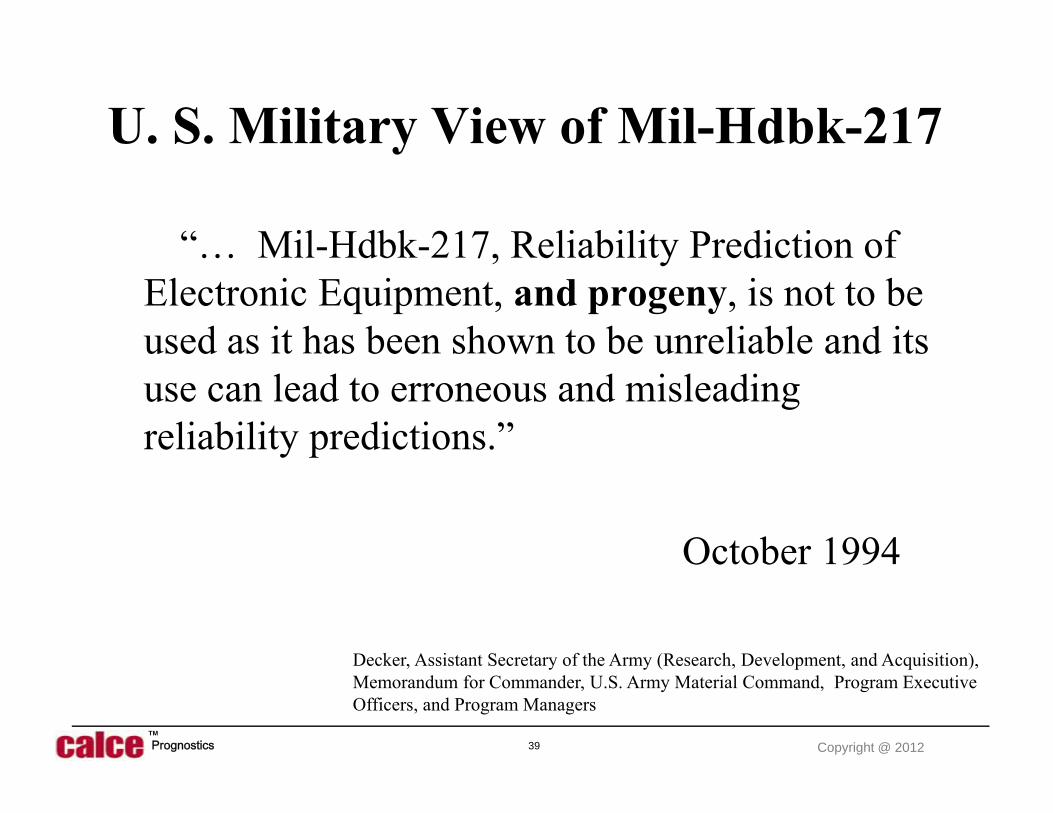
U. S. Military View of Mil-Hdbk-217
“… Mil-Hdbk-217, Reliability Prediction of Electronic Equipment, and progeny, is not to be used as it has been shown to be unreliable and its use can lead to erroneous and misleading reliability predictions.”
October 1994
Decker, Assistant Secretary of the Army (Research, Development, and Acquisition), Memorandum for Commander, U.S. Army Material Command, Program Executive Officers, and Program Managers

40 Copyright @ 2012PrognosticsTM
“... GM concurs and will comply with the findings and policy revisions of Feb. 15, 1996 by the Assistant Secretary of the U.S. Army for Research, Development and Acquisition. … Therefore: Mil-Hdbk 217, or a similar component reliability assessment method such as SAE PREL, SHALL NOT BE USED.”
General Motors Reliability Policy
GM North American Operation,Technical Specification Number: 10288874, June 4, 1996.

41 Copyright @ 2012PrognosticsTM
• 1999: CALCE awarded 5 year $12M US contact to develop physics of failure models (software) for electronics industry to replace 217-based methods
• US Army – AMSAA established a physics-of-failure laboratory
History Reliability Prediction of Electronics
42 Copyright @ 2012PrognosticsTM
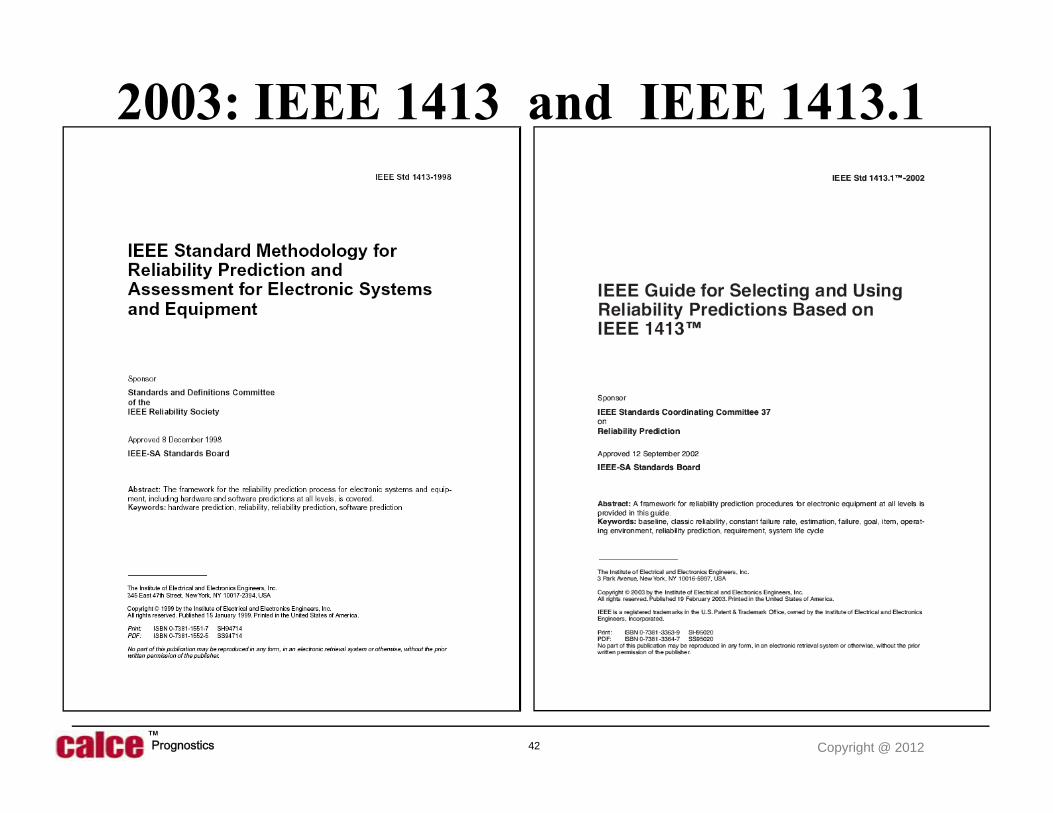
2003: IEEE 1413 and IEEE 1413.1

43 Copyright @ 2012PrognosticsTM
• Shows that there is no value in the use of Mil-Hdbk-217, 217-Plus, Telecordia, FIDES, and progeny prediction methods
• Physics-of-failure methods are necessary for good reliability assessment and prediction
IEEE 1413 and 1413.1

44 Copyright @ 2012PrognosticsTM
CALCE Electronics PoF SoftwareSystem-Level Analysis
Composite Two-Wheeled Trailer VibrationTable 514.5C-VII, Fig. 514.5C-2
0.0001
0.0010
0.0100
0.1000
1.0000
1 10 100 1000
Frequency (Hz)
PSD
(g2 /H
z)
Board-Level AnalysisMechanical Loads Thermal Loads
Board Displacement Thermal Overstress Analysis
Component Life Estimates
45 Copyright @ 2012PrognosticsTM
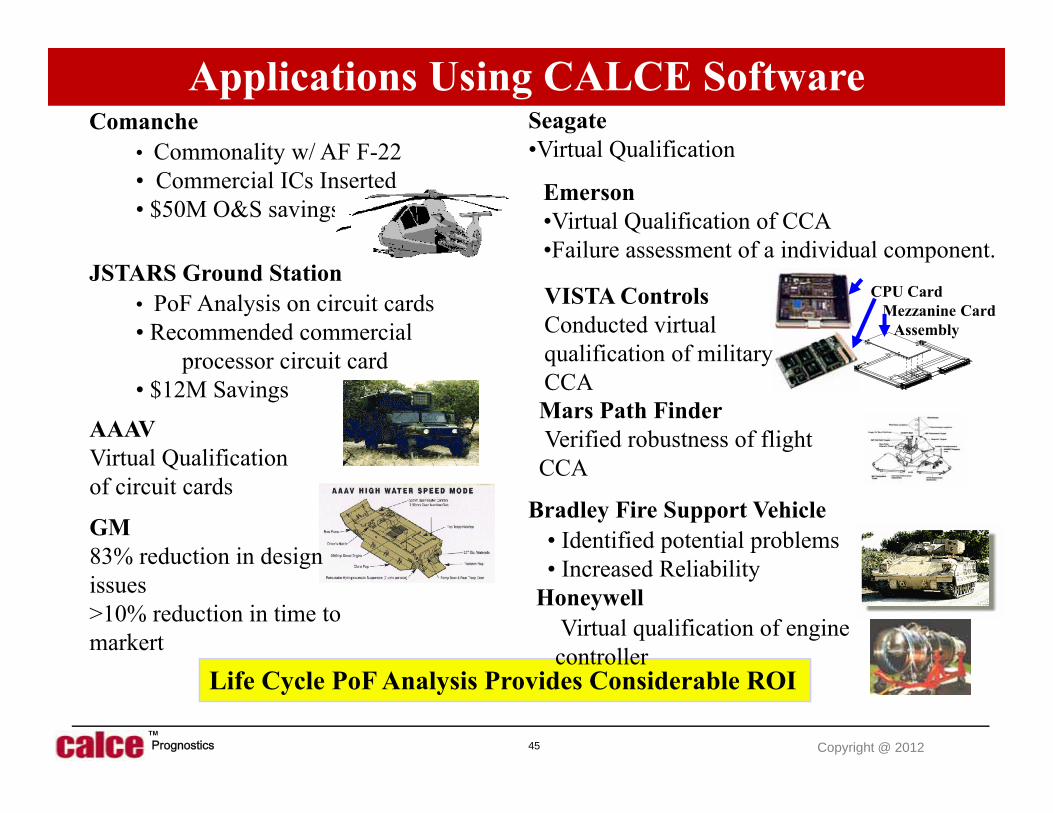
Comanche• Commonality w/ AF F-22• Commercial ICs Inserted• $50M O&S savings
Bradley Fire Support Vehicle• Identified potential problems• Increased Reliability
Life Cycle PoF Analysis Provides Considerable ROI
Applications Using CALCE SoftwareSeagate •Virtual Qualification
Emerson•Virtual Qualification of CCA•Failure assessment of a individual component.
Mars Path FinderVerified robustness of flight CCA
AAAVVirtual Qualificationof circuit cards
VISTA ControlsConducted virtualqualification of militaryCCA
CPU CardMezzanine Card
Assembly
JSTARS Ground Station• PoF Analysis on circuit cards• Recommended commercial
processor circuit card• $12M Savings
GM83% reduction in design issues>10% reduction in time to markert
HoneywellVirtual qualification of enginecontroller
46 Copyright @ 2012PrognosticsTM
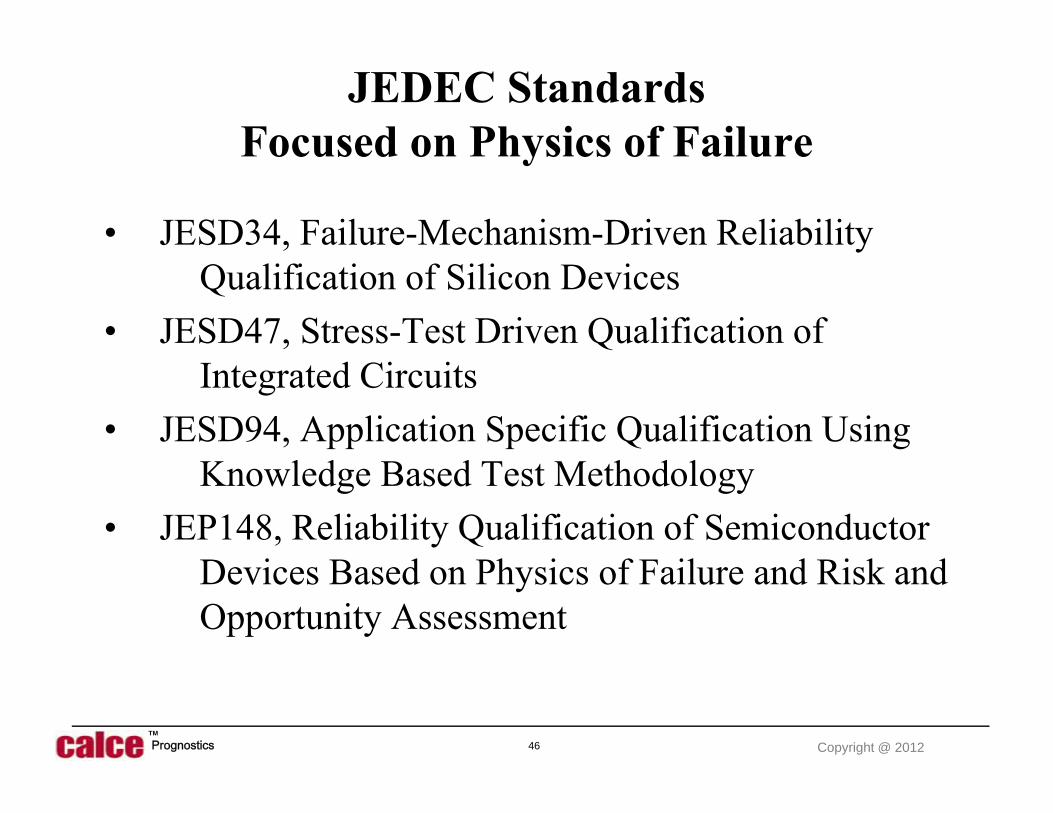
JEDEC Standards Focused on Physics of Failure
• JESD34, Failure-Mechanism-Driven Reliability Qualification of Silicon Devices
• JESD47, Stress-Test Driven Qualification of Integrated Circuits
• JESD94, Application Specific Qualification Using Knowledge Based Test Methodology
• JEP148, Reliability Qualification of Semiconductor Devices Based on Physics of Failure and Risk and Opportunity Assessment

47 Copyright @ 2012PrognosticsTM
• Shows that there is no value in the use of Mil-Hdbk-217, 217-Plus, Telecordia, FIDES, and progeny prediction methods
• Physics-of-failure methods are necessary for good reliability assessment and prediction, but one also needs a good assessment of the “conditions of use”
IEEE 1413 and 1413.1
48 Copyright @ 2012PrognosticsTM
What are the Use Conditions of Products

49 Copyright @ 2012PrognosticsTM

50 Copyright @ 2012PrognosticsTM
Example: Apple Computer Study - A Transportation Load Monitoring Study -
• A computer monitor was shipped from College Park, Maryland to San Pedro, California and back via Federal Express, and a sensor suite was attached to the monitor to record shock (in all three axes), temperature and humidity.
• The sensor suite was programmed to:– record shock data only if the magnitude of the applied shock was greater
than 2.0 g or less than –2.0 g,– record shock data at a frequency of 1500 samples per second, and– record temperature and humidity data every 10 minutes.
• The unit was packaged and shipped via Federal Express to California on October 11, 2000 at 6:59 PM (EST).

51 Copyright @ 2012PrognosticsTM
Vibration and Shock Loads
1.0
2.0
3.0
4.0
Peak
G lo
ad (m
/s2 )
19.412.55
32.43
2.22.3
17.5316.93
3.15
17.11
10.91
38.44
9.5
Received in California12:45 PM, October 12
Sent from California6:24 PM, October 14
Received in Maryland12:44 PM, October 16
Sent from Maryland6:59 PM, October 11
g RM
S(m
/s2 )
0.0
Trip time (days)
1.0
2.0
3.0
4.0
Peak
G lo
ad (m
/s2 )
19.412.55
32.43
2.22.3
17.5316.93
3.15
17.11
10.91
38.44
9.5
Received in California12:45 PM, October 12
Sent from California6:24 PM, October 14
Received in Maryland12:44 PM, October 16
Sent from Maryland6:59 PM, October 11
g RM
S(m
/s2 )
0.0
Trip time (days)

52 Copyright @ 2012PrognosticsTM

53 Copyright @ 2012PrognosticsTM
54 Copyright @ 2012PrognosticsTM

55 Copyright @ 2012PrognosticsTM

56 Copyright @ 2012PrognosticsTM
57 Copyright @ 2012PrognosticsTM
58 Copyright @ 2012PrognosticsTM

59 Copyright @ 2012PrognosticsTM

60 Copyright @ 2012PrognosticsTM

61 Copyright @ 2012PrognosticsTM
62 Copyright @ 2012PrognosticsTM
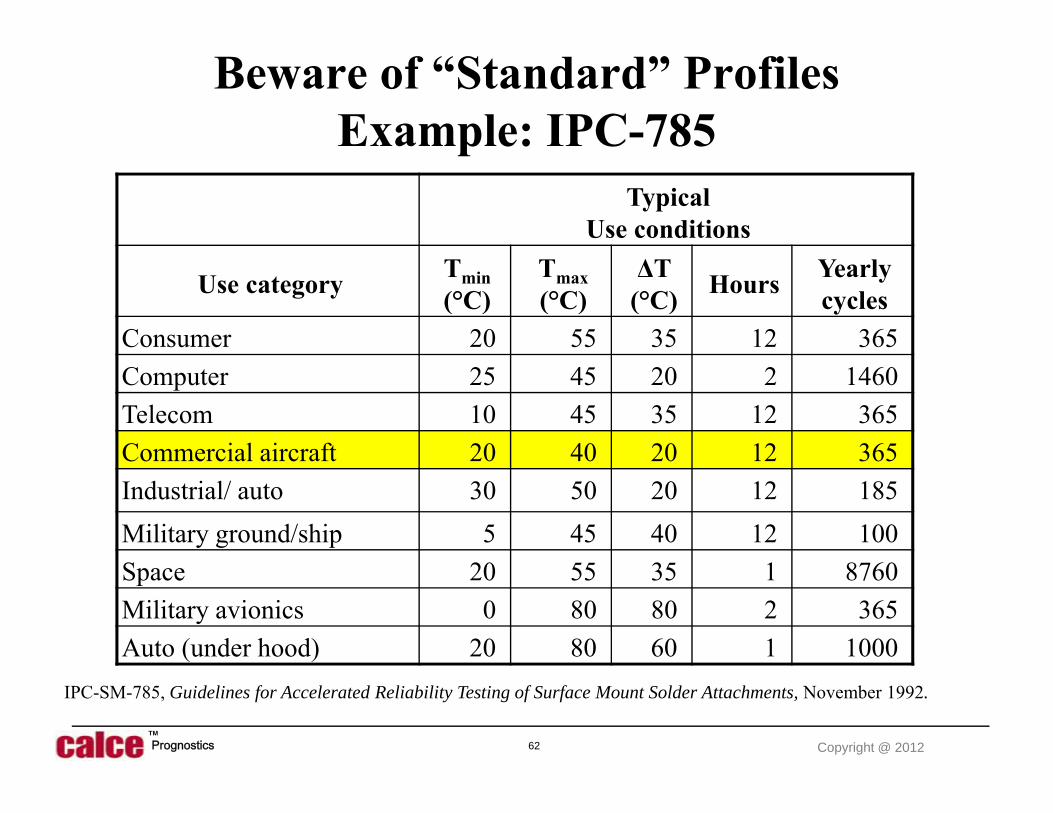
TypicalUse conditions
Use category Tmin(°C)
Tmax(°C)
ΔT (°C) Hours Yearly
cyclesConsumer 20 55 35 12 365Computer 25 45 20 2 1460Telecom 10 45 35 12 365Commercial aircraft 20 40 20 12 365Industrial/ auto 30 50 20 12 185Military ground/ship 5 45 40 12 100Space 20 55 35 1 8760Military avionics 0 80 80 2 365Auto (under hood) 20 80 60 1 1000
IPC-SM-785, Guidelines for Accelerated Reliability Testing of Surface Mount Solder Attachments, November 1992.
Beware of “Standard” Profiles Example: IPC-785

63 Copyright @ 2012PrognosticsTM
Instrument Panel
EE Bay Air
EE Bay (AEM)*Console (AEM)*
Dallas San Diego
Ren
oPhoenix
Vega
sR
eno
Vega
s
SMF
Phx Milwaukee Phx
60
50
40
30
20
10
0
-10
0.00
3.59
5.58
7.57
9.56
11.5
513
.54
2.00
15.5
3
19.5
121
.50
23.4
91.
483.
475.
46
17.5
2
7.45
11.4
313
.42
15.4
117
.40
19.3
921
.38
9.44
Time (hh.mm)
Tem
pera
ture
(°C
)AvionicsFan
Jet Engines
Example: Aircraft Temperature Profile
Cluff, K., Barker, D., Robbins, D., and Edwards, T., “Characterizing the Commercial Avionics Thermal Environment for Field Reliability Assessment,” Journal of the IES, Vol. 40, No. 4, pp. 22-28, 1997.
* Measured by an Aircraft Equipment Monitor (AEM) fitted in a commercial aircraft.

64 Copyright @ 2012PrognosticsTM
Monitoring Notebook Usage Profile

65 Copyright @ 2012PrognosticsTM
Recent Study by CALCE with Major Computer
Manufacturer
- Impact on Qualification -
66 Copyright @ 2012PrognosticsTM
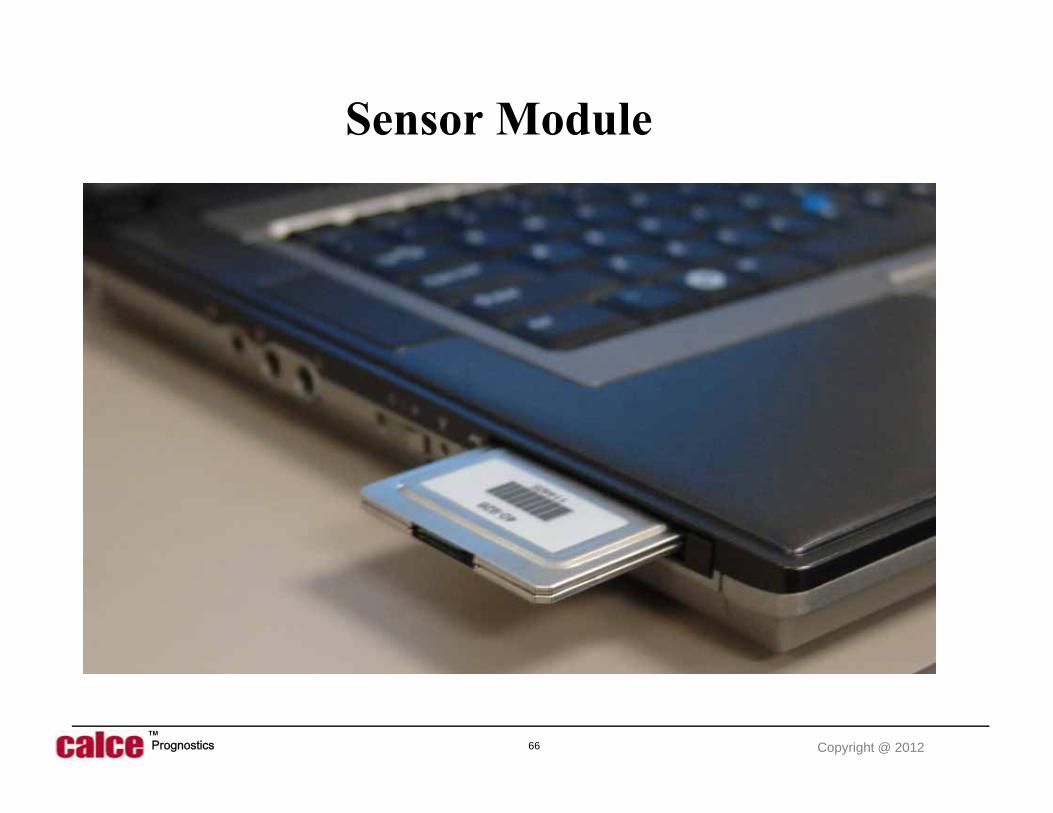
Sensor Module
67 Copyright @ 2012PrognosticsTM
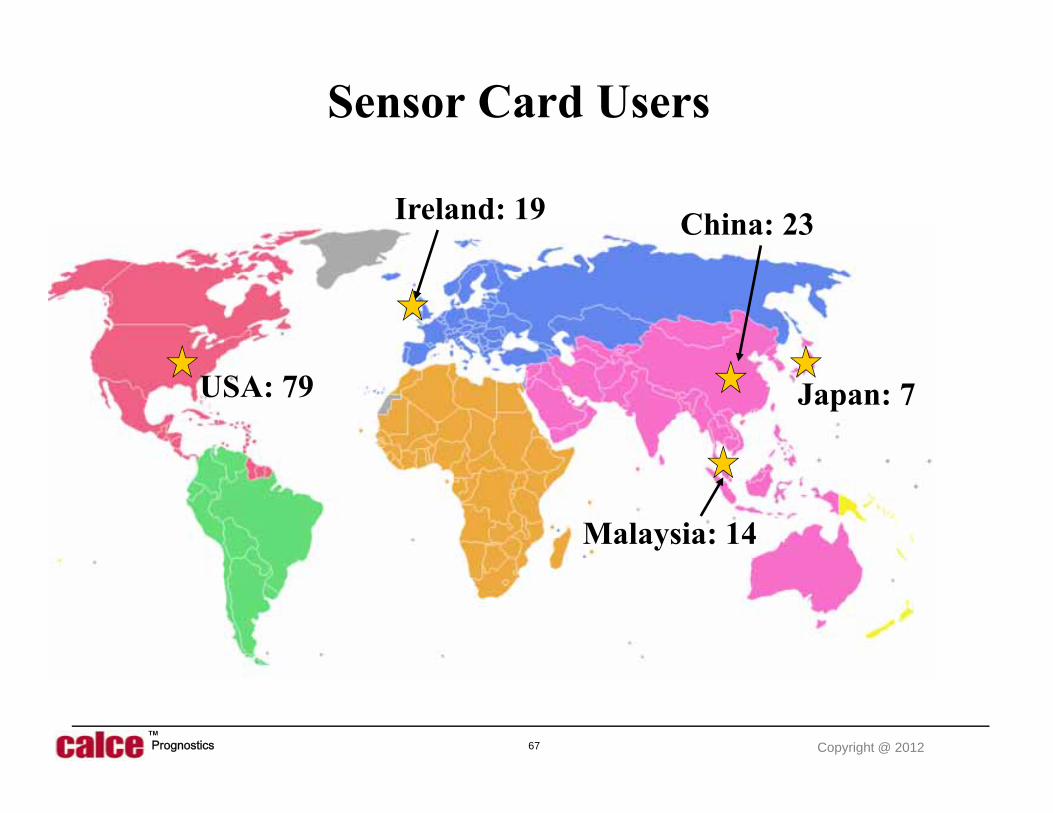
Sensor Card Users
Ireland: 19
USA: 79
Malaysia: 14
Japan: 7
China: 23

68 Copyright @ 2012PrognosticsTM
• Data Storage• Summary• Reports
Database
Data Process Flow
Server withDaily uploads
Data Analysis• Data Processing• Statistics• Analysis
Sensor Module
69 Copyright @ 2012PrognosticsTM
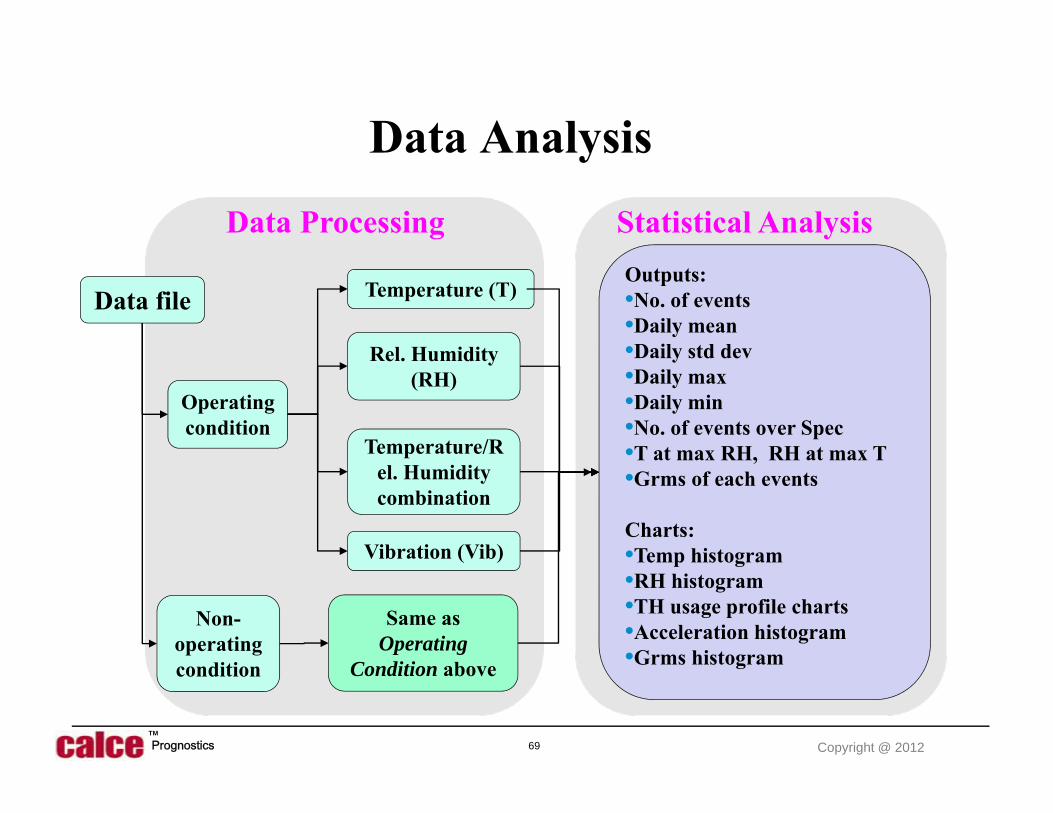
Data Analysis
Data file
Operating condition
Non-operating condition
Temperature (T)
Rel. Humidity (RH)
Temperature/Rel. Humidity combination
Outputs: •No. of events•Daily mean•Daily std dev•Daily max•Daily min•No. of events over Spec •T at max RH, RH at max T•Grms of each events
Charts: •Temp histogram•RH histogram•TH usage profile charts•Acceleration histogram•Grms histogram
Same as Operating
Condition above
Statistical AnalysisData Processing
Vibration (Vib)

70 Copyright @ 2012PrognosticsTM
Example Temperature Data
0
10
20
30
40
50
60
70
80 1
0/16
/03
10/
20/0
3
10/
21/0
3
10/
22/0
3
10/
22/0
3
11/
01/0
3
11/
01/0
3
11/
02/0
3
11/
03/0
3
11/
04/0
3
11/
04/0
3
11/
04/0
3
11/
04/0
3
11/
04/0
3
11/
05/0
3
11/
05/0
3
11/
05/0
3
11/8
/03
11/
11/0
3
11/
11/0
3
11/
11/0
3
11/2
3/03
11/2
3/03
11/2
3/03
11/2
3/03
11/2
3/03
11/2
4/03
11/2
4/03
11/2
4/03
11/2
5/03
11/2
5/03
12/2
/03
12/2
/03
12/2
2/03
12/2
2/03
12/2
3/03
12/2
3/03
12/2
3/03
12/2
3/03
Tem
pera
ture
(C)
HeatsinkHDD
Atmospheric Ambient
Date
71 Copyright @ 2012PrognosticsTM
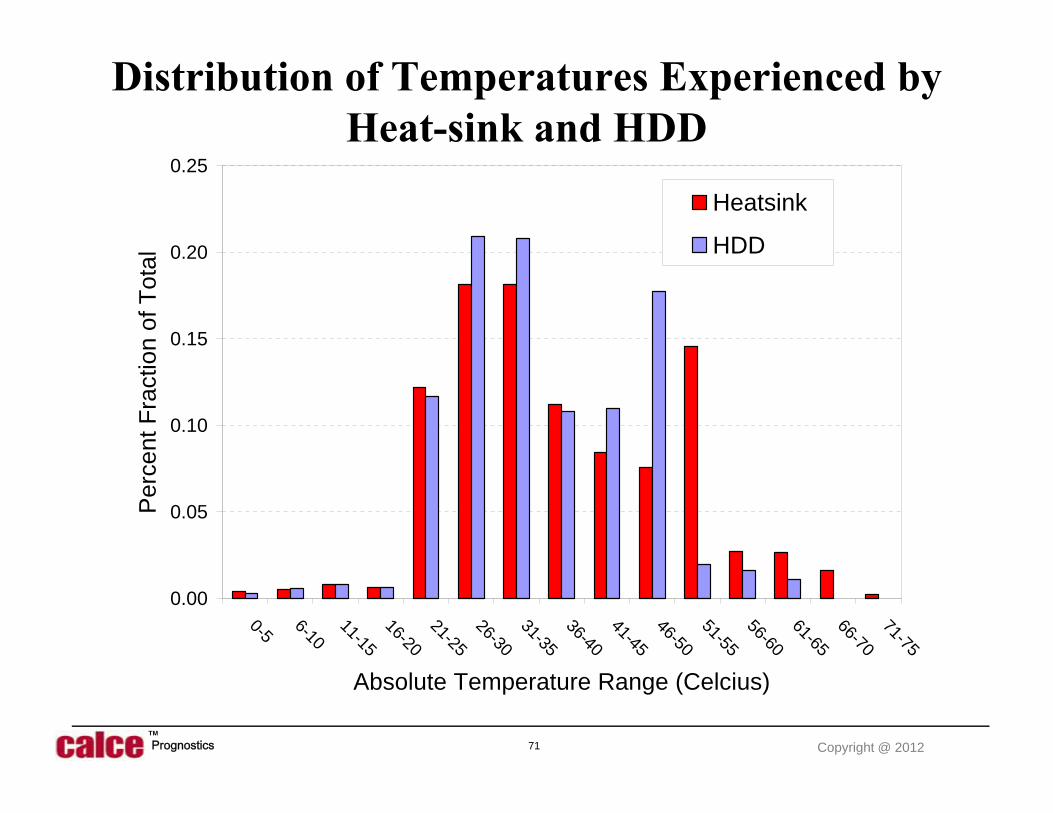
Distribution of Temperatures Experienced by Heat-sink and HDD
0.00
0.05
0.10
0.15
0.20
0.25
0-5 6-1011-1516-2021-2526-3031-3536-4041-4546-5051-5556-6061-6566-7071-75
Absolute Temperature Range (Celcius)
Per
cent
Fra
ctio
n of
Tot
al
Heatsink
HDD

72 Copyright @ 2012PrognosticsTM
Analysis of Thermal Range Time- temperature history is converted into equivalent cycles
0
5
10
15
20
25
30
35
40
45
50
Delta T (Celcius)
Num
ber o
f Occ
uren
ces
Heatsink
HDD
937 739

73 Copyright @ 2012PrognosticsTM
Results
Parameters Current Spec. Observed extreme Values
No. of observations over Spec. per day per user (mean/95%)
Operating Vibration 0.6 GRMS 3.16 GRMS 2.8/7.8
Non-operating/Storage
Vibration 1.3 GRMS 5.65 GRMS 0.2/1.0
Temperature Range –40 to 65 C 10.5 to 69.8 C0.2/0.0
R.H. Range 5% to 95% 0.53% to 98.9%
Temp at Max. Humidity 39C @ 95% RH 28.4C @ 98.9%0.6/0.0
Humidity at Max. Temp 20% RH @ 65C 2.5%RH @ 69.8C

74 Copyright @ 2012PrognosticsTM
Qualification Tests
Time
50
100
1000 2000 3000 4000
*
•
Test Condition
Application Conditions - of - Use
Profile
75 Copyright @ 2012PrognosticsTM
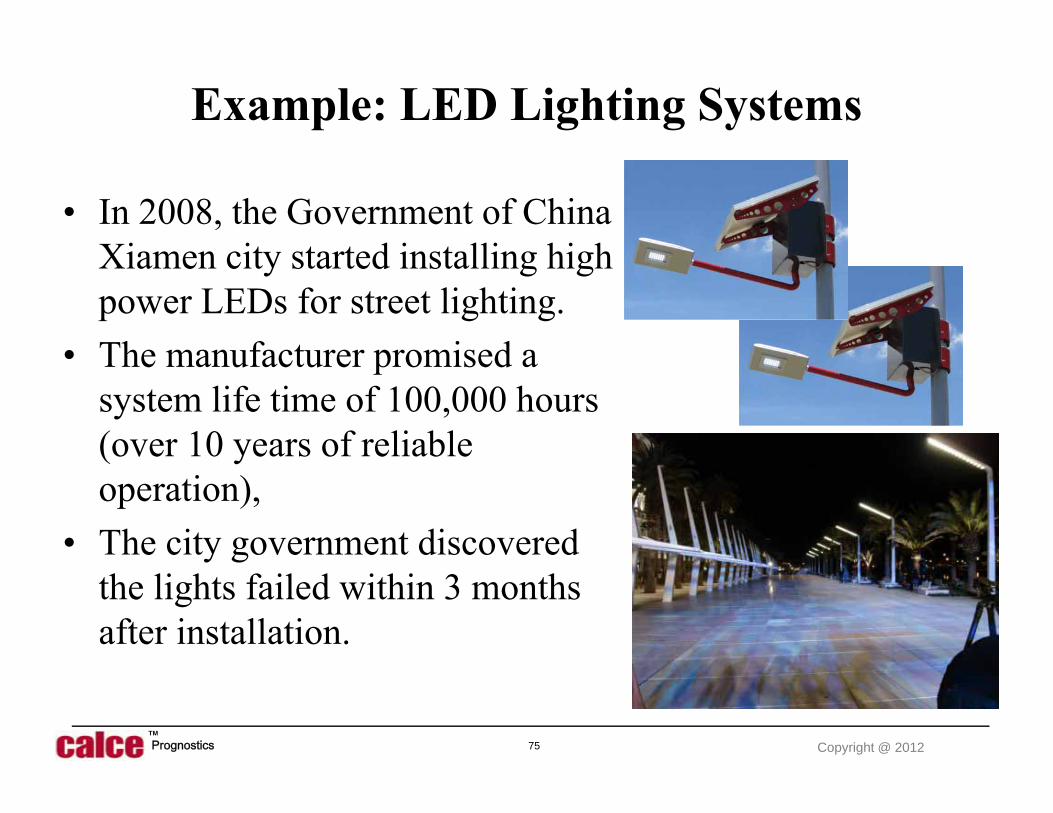
Example: LED Lighting Systems
• In 2008, the Government of China Xiamen city started installing high power LEDs for street lighting.
• The manufacturer promised a system life time of 100,000 hours (over 10 years of reliable operation),
• The city government discovered the lights failed within 3 months after installation.

76 Copyright @ 2012PrognosticsTM
Health and Usage Monitoring
77 Copyright @ 2012PrognosticsTM
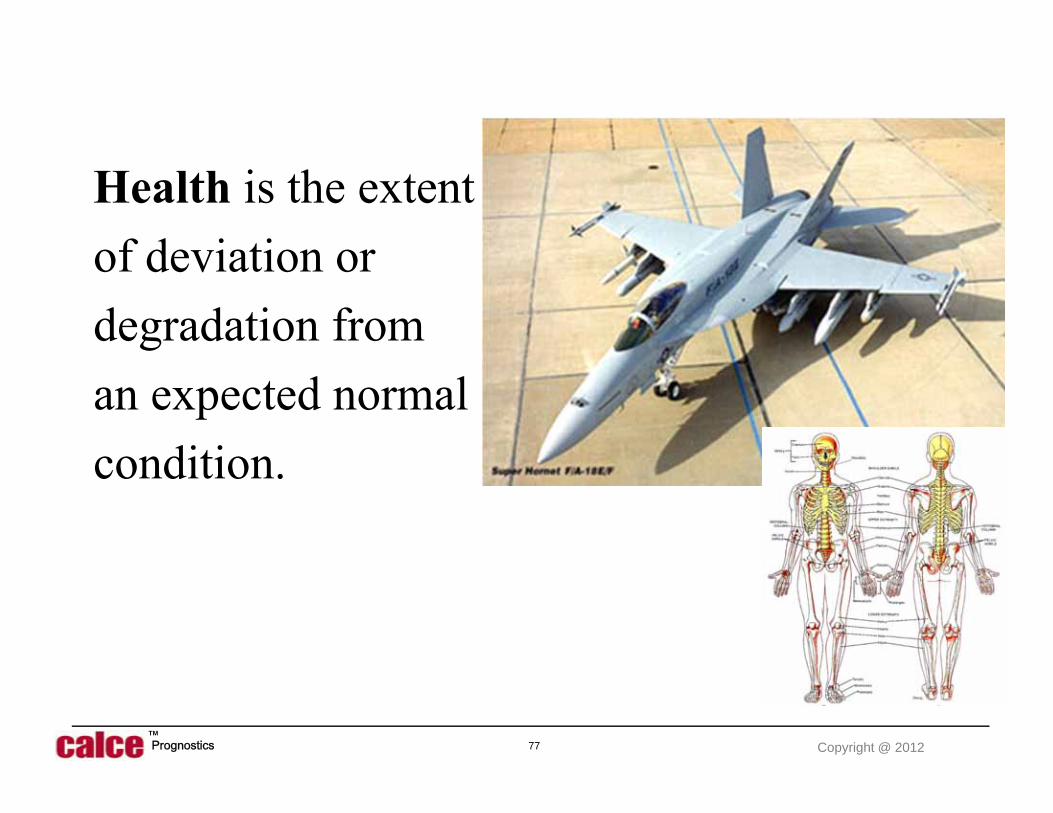
Health is the extent of deviation or degradation from an expected normal condition.
What should we monitorand
how do we monitor?
79 Copyright @ 2012PrognosticsTM
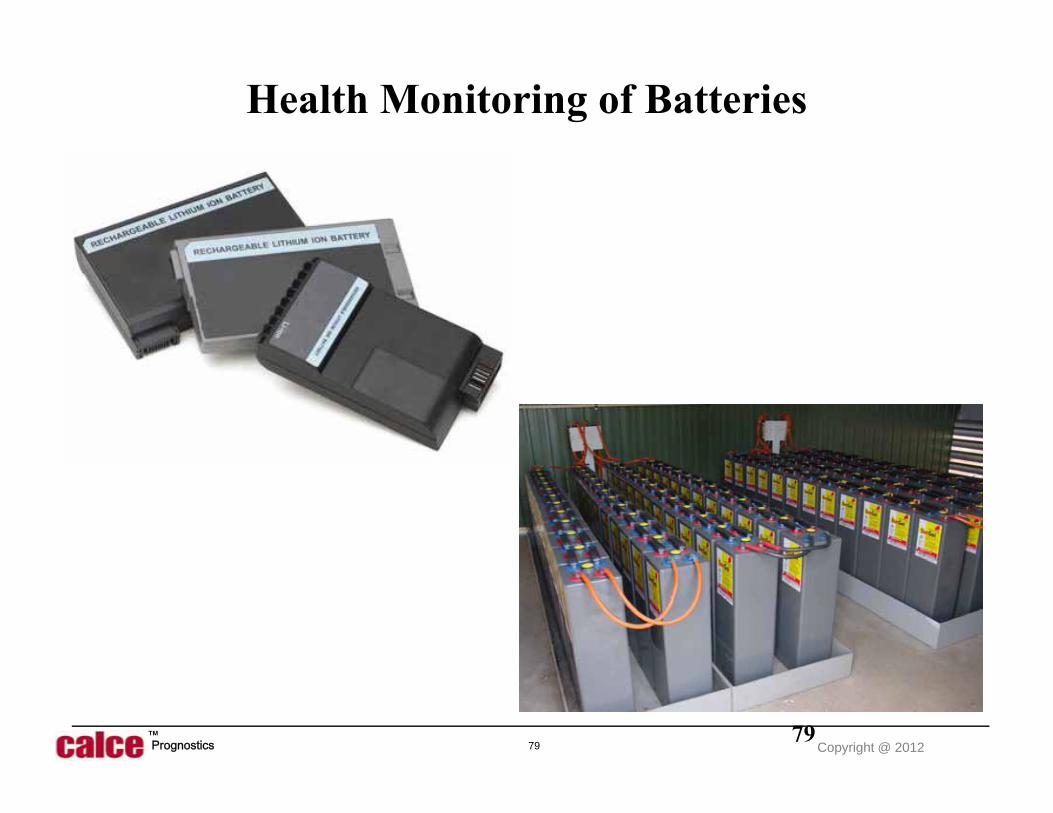
Health Monitoring of Batteries
79

80 Copyright @ 2012PrognosticsTM
Health Monitoring of BatteriesIdentifying weak or failing battery cells in service
Monitored Parameter
Invasive Technical Value Technical Weakness
Temperature differential
No Shows high battery temperature
Need to combine temp. with other data to find fault
Float current No Indicates high resistance battery current path
Requires each parallel string to be monitored individually
Battery conductance
No Passively finds weak cells/batteries
No need for battery discharge to indicate relative state of health
High/low battery temperature
No Can signal thermal stress problem
Location of sensors is critical and ambient temp. variation needs to be considered
High/low string voltage
No May indicate rectifier problem Indicates state of charge cannot predict capacity
81 Copyright @ 2012PrognosticsTM
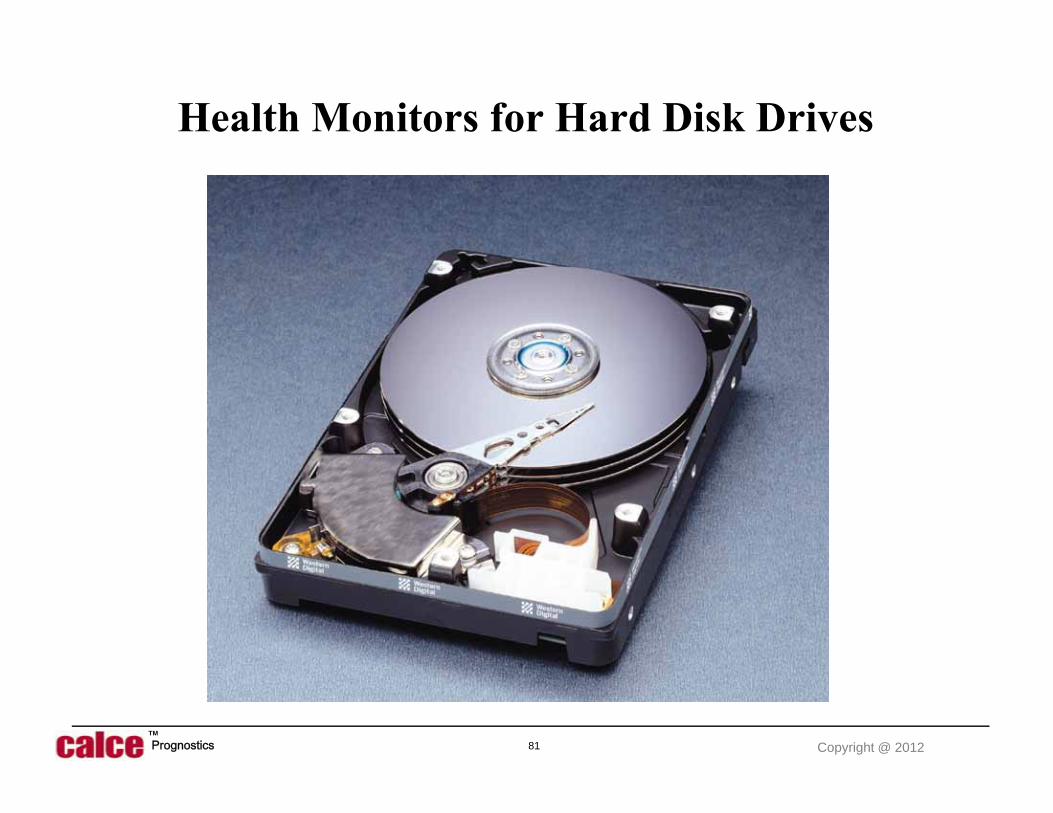
Health Monitors for Hard Disk Drives
82 Copyright @ 2012PrognosticsTM
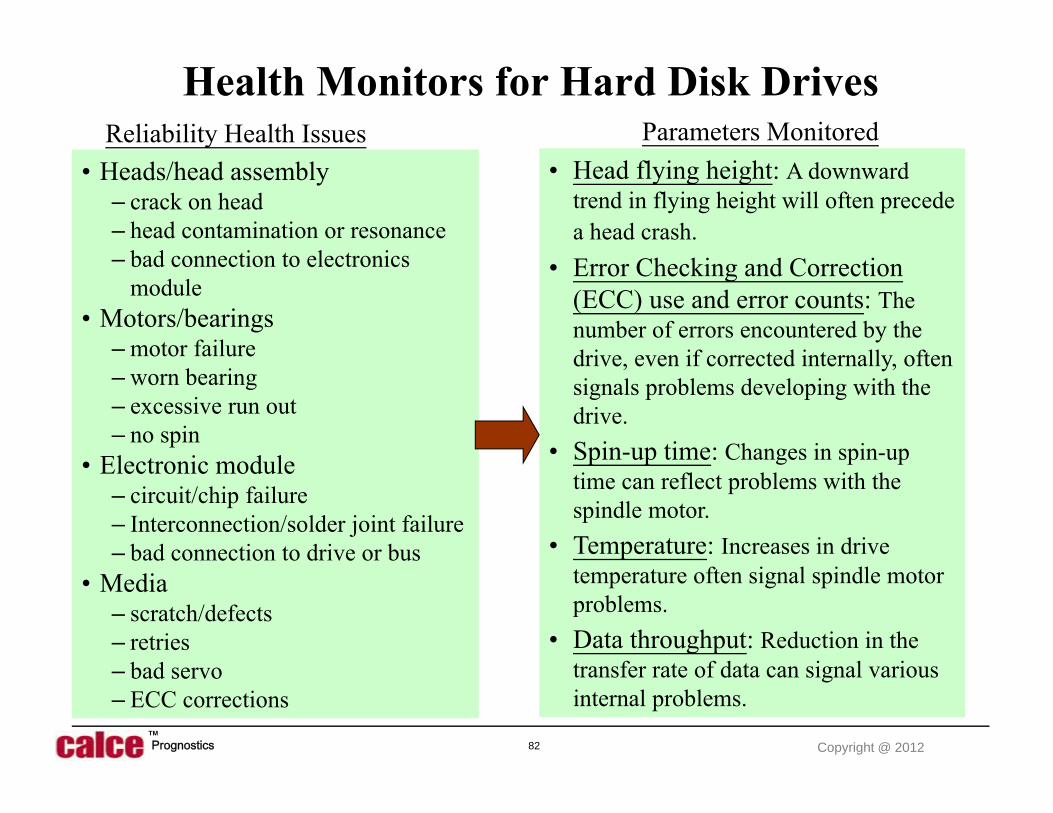
Health Monitors for Hard Disk Drives
• Head flying height: A downward trend in flying height will often precede a head crash.
• Error Checking and Correction (ECC) use and error counts: The number of errors encountered by the drive, even if corrected internally, often signals problems developing with the drive.
• Spin-up time: Changes in spin-up time can reflect problems with the spindle motor.
• Temperature: Increases in drive temperature often signal spindle motor problems.
• Data throughput: Reduction in the transfer rate of data can signal various internal problems.
• Heads/head assembly– crack on head– head contamination or resonance– bad connection to electronics
module• Motors/bearings
– motor failure– worn bearing– excessive run out– no spin
• Electronic module– circuit/chip failure– Interconnection/solder joint failure– bad connection to drive or bus
• Media– scratch/defects – retries– bad servo– ECC corrections
Parameters MonitoredReliability Health Issues


84 Copyright @ 2012PrognosticsTM
Health Monitoring Approach For Anomaly Detection
Acquire new observations (X)
Create “healthy”
profile matrixCalculate
expectations (Lexp)
Calculate actual residuals
RX=Xexp-XobsSelect
parameters to
monitorAssess
variability w.r.t. other healthy
data (L)
Calculate expectations
(Xexp)
Calculate healthy residuals
RL =Lexp-L
Anomaly warning

University of MarylandCopyright © 2012 CALCE
85Center for Advanced Life Cycle Engineering
Mahalanobis Based Anomaly Detection
Training Data (ICE, VCE, T)
Normalize Data
Calculate Correlation Matrix
Calculate Mean and Std Dev.
timeMD
val
ue
Test Data
Test Data Normalization
Test MD Values
timeMD
val
ueDecision
Healthy System Test System
T
iZ1CiZp1MD
111 Copyright @ 2012PrognosticsTM
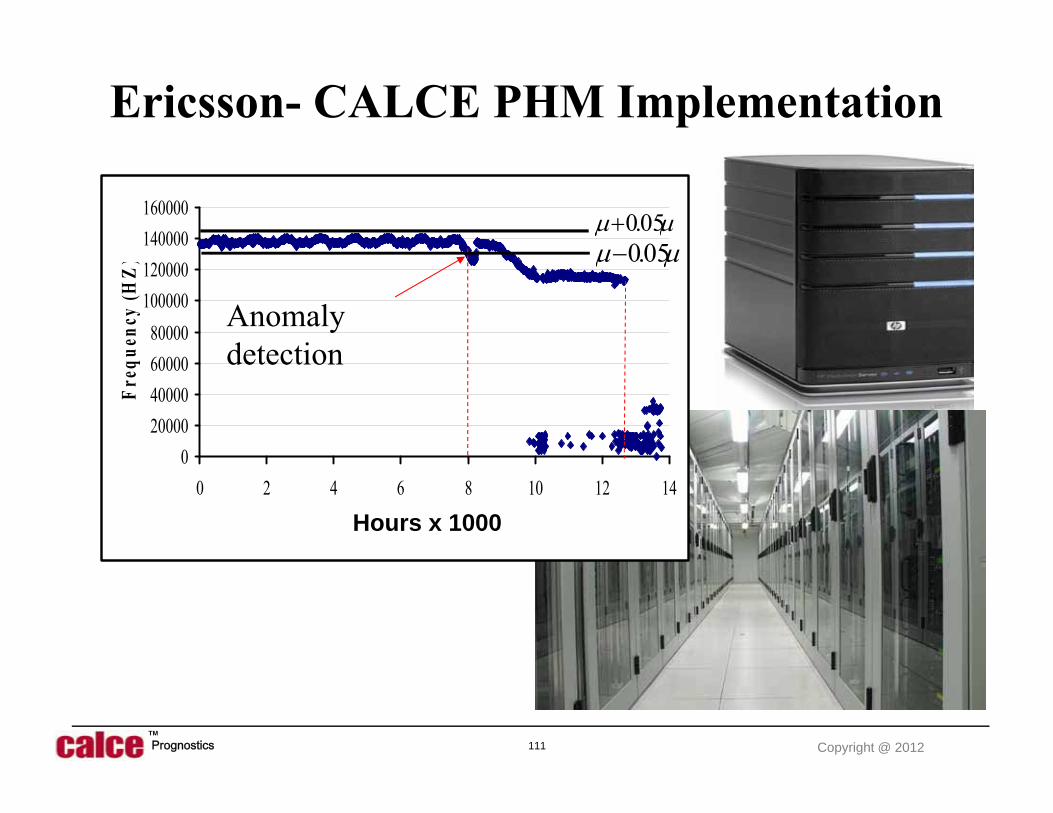
Ericsson- CALCE PHM Implementation
020000400006000080000
100000120000140000160000
0 2 4 6 8 10 12 14
Time (hour)
Freq
uenc
y (H
Z)
Anomaly detection
05.0 05.0
Hours x 1000

86 Copyright @ 2012PrognosticsTM
EADS HUMS and CALCE HUMSMicrocontrollerTemperature & RH sensor Terminals for data
communication
FRAM memoryTerminals for external sensors
Terminals for battery
2-axis accelerometer
RFID
Courtesy of EADS
87 Copyright @ 2012PrognosticsTM
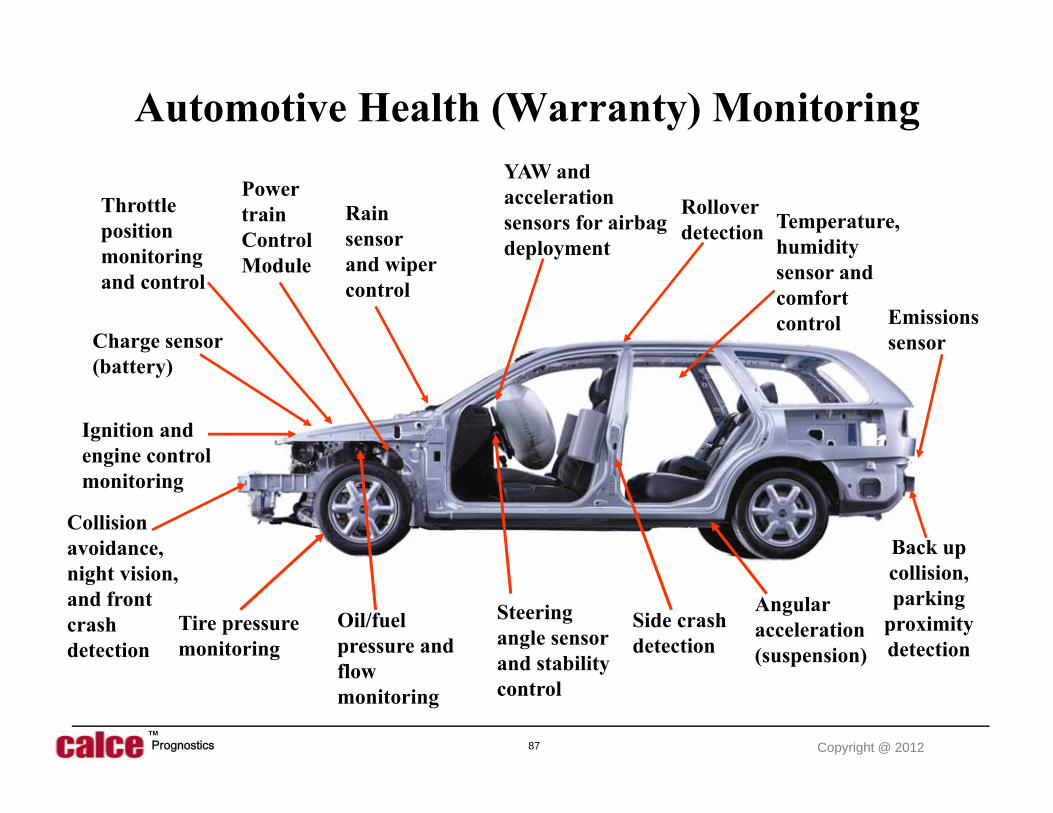
Automotive Health (Warranty) Monitoring
Back up collision, parking
proximity detection
YAW and acceleration sensors for airbag deployment
Tire pressure monitoring
Power train Control Module
Throttle position monitoring and control
Ignition and engine control monitoring
Oil/fuel pressure and flow monitoring
Rollover detection
Collision avoidance, night vision, and front crash detection
Side crash detection
Steering angle sensor and stability control
Temperature, humidity sensor and comfort control
Charge sensor (battery)
Angular acceleration (suspension)
Rain sensor and wiper control
Emissions sensor

88 Copyright @ 2012PrognosticsTM
Prognostics
Techniques utilized to determine the remaining useful life with a defined level of confidence for a specified coverage of anticipated events

89 Copyright @ 2012PrognosticsTM
Remaining Life Assessment
,.....),,,( Dmeant
dtdssfw sDamage,
Time (t)
Load
(s)
Embedded Data Reduction and Load Parameter Extraction
Remaining life = f ( w)
Mean load (Smean) Ramp rate (ds/dt)0
0.25
0.5
Range (s)
Freq
uenc
y
Dwell time (tD)0
0.25
0.5
0
0.25
0.5
0
0.25
0.5
0
10
20
30
40
50
60
70
80
90
100
7/19/0612:00 AM
7/20/0612:00 AM
7/21/0612:00 AM
7/22/0612:00 AM
7/23/0612:00 AM
7/24/0612:00 AM
7/25/0612:00 AM
7/26/0612:00 AM
7/27/0612:00 AM
7/28/0612:00 AM
Deg
rees
C

90 Copyright @ 2012PrognosticsTM
Failure Sites and Mechanisms in Microelectronic Devices
DieMetallization
Die Device
ConstraintCavitation
Corrosion Electro migration
HillockFormation
Slow Trapping
ElectricalOverstress
TDDB ESD
IonicContamination
Second Breakdown
Die Fracture
DieFatigue
Bond PadFatigue
Surface ChargeSpreading

91 Copyright @ 2012PrognosticsTM
Interconnects Case Leads AttachSubstrate
WirebondsFlip-Chip
Solder JointFatigue
PlasticHermetic
Delamination and Cracking
Solder JointFatigue
Intermetallicformation
SubstrateFracture
SubstrateFatigue
AdhesiveFracture
AdhesiveFatigue
Loss ofLid Seal
Failure Sites and Mechanisms in Electronic Components
Wire ShearFatigue
IntermetallicFormation
Wire FlexureFatigue
Loss ofLead Seal
CaseFracture
CaseFracture
92 Copyright @ 2012PrognosticsTM
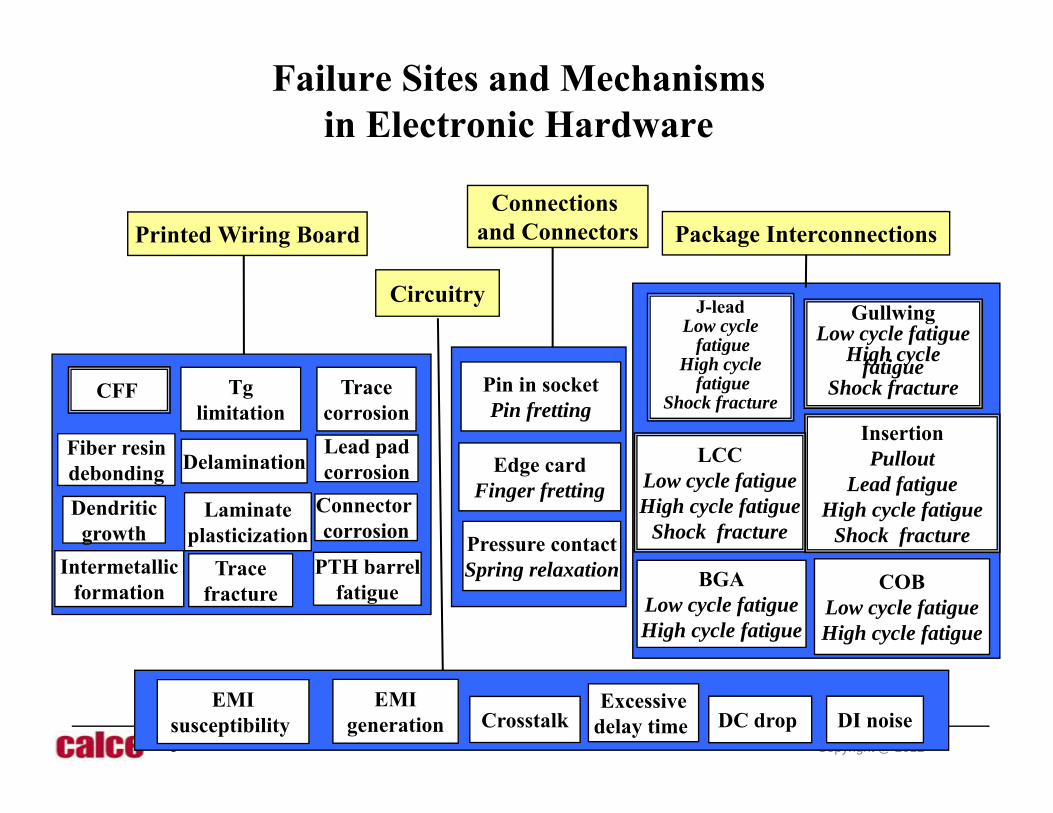
Package Interconnections
EMIsusceptibility
EMIgeneration Crosstalk
Circuitry
Excessivedelay time DC drop
Connections and Connectors
DI noise
Connector corrosion
PTH barrelfatigue
Lead padcorrosion
Tracecorrosion
Tracefracture
Laminateplasticization
Delamination
Tglimitation
Fiber resindebonding
CFF
Dendriticgrowth
Intermetallicformation
GullwingLow cycle fatigue
High cycle fatigueShock fracture
BGALow cycle fatigueHigh cycle fatigue
InsertionPullout
Lead fatigueHigh cycle fatigue
Shock fracture
COBLow cycle fatigueHigh cycle fatigue
LCCLow cycle fatigueHigh cycle fatigue
Shock fracture
J-leadLow cycle
fatigueHigh cycle
fatigueShock fracture
Pressure contactSpring relaxation
Pin in socketPin fretting
Edge cardFinger fretting
Printed Wiring Board
Failure Sites and Mechanisms in Electronic Hardware

93 Copyright @ 2012PrognosticsTM
Physics of Failure DatabaseFailure Mechanism Failure Sites Relevant Stress
Parameters Sample Model
FatigueDie attach,
Wirebond/TAB, Solder leads, Bond
pads,Traces, Vias/PTHs,
Interfaces
Cyclic Deformations (D T, D H, D V)
Nonlinear PowerLaw (Coffin-
Manson)
Corrosion Metallizations M, DV, T, chemical Eyring (Howard)
Electromigration Metallizations T, J Eyring (Black)
Conductive Filament Formation
Between Metallizations M, ΛV Power Law (Rudra)
Stress DrivenDiffusion Voiding
Metal Traces s, T Eyring (Okabayashi)
Time Dependent Dielectric Breakdown
Dielectric layers V, T Fowler-Nordheim
94 Copyright @ 2012PrognosticsTM
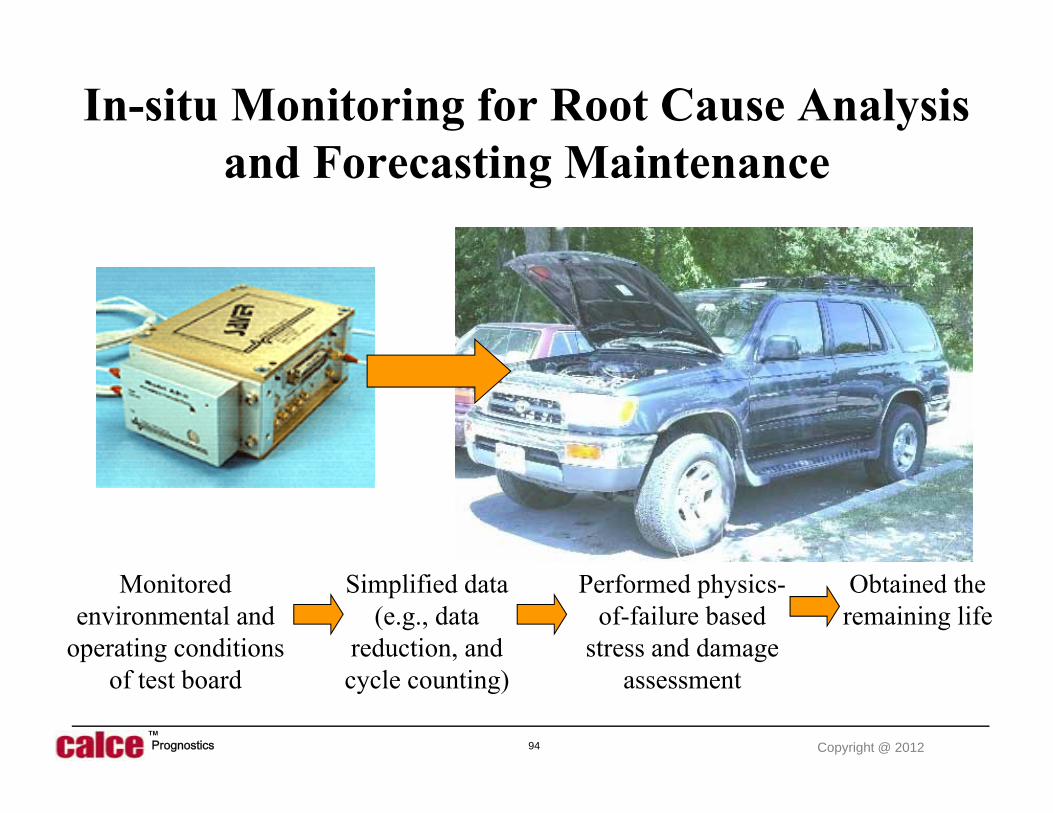
In-situ Monitoring for Root Cause Analysis and Forecasting Maintenance
Monitored environmental and
operating conditions of test board
Simplified data (e.g., data
reduction, and cycle counting)
Performed physics-of-failure based
stress and damage assessment
Obtained the remaining life

95 Copyright @ 2012PrognosticsTM
Health Monitoring Provides Data for Probabilistic Physics of Failure Prognostics
,.....),,,( Dmeant
dtdssfw sDamage,
Time (t)
Loa
d (s
)
Embedded Data Reduction and Load Parameter Extraction
Remaining life = 1 - g(w)
Mean load (Smean) Ramp rate (ds/dt)0
0.25
0.5
Range (s)
Freq
uenc
y
Dwell time (tD)0
0.25
0.5
0
0.25
0.5
0
0.25
0.5
0
10
20
30
40
50
60
70
80
90
100
7/19/0612:00 AM
7/20/0612:00 AM
7/21/0612:00 A M
7/22/0612:00 A M
7/23/0612:00 AM
7/24/0612:00 AM
7/25/0612:00 AM
7/26/0612:00 AM
7/27/0612:00 A M
7/28/0612:00 A M
Deg
rees
C

96 Copyright @ 2012PrognosticsTM
In-Situ Monitoring for Remaining Life Prediction and Forecasting Maintenance
0 5 10 15 20 25 30 35 40 45 50Time in Use (days)
0
10
20
30
40
50
Est
imat
ed R
emai
ning
Life
(day
s)
Actual life from resistance monitoring = 39 days
Day of Car Accident
Estimated life after accident (LCM = 40 days)
Estimated life after 5 days of data collection = 46 days)
97 Copyright @ 2012PrognosticsTM
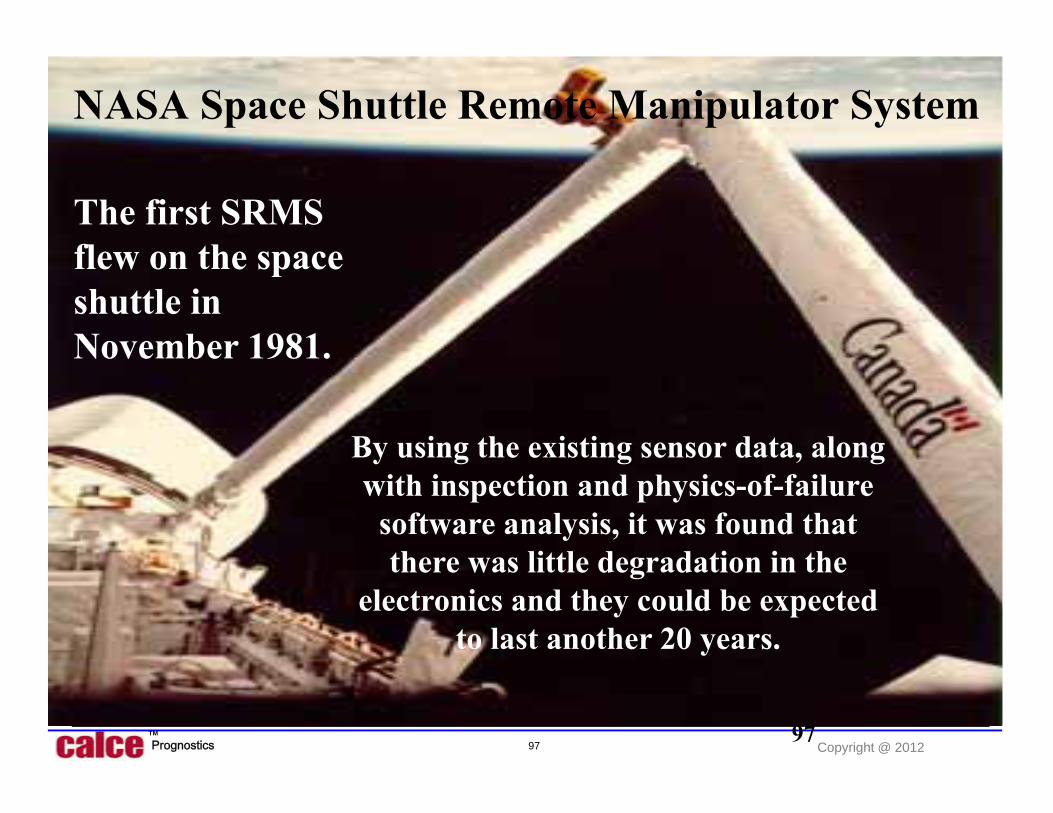
NASA Space Shuttle Remote Manipulator System
97
The first SRMS flew on the space shuttle in November 1981.
By using the existing sensor data, along with inspection and physics-of-failure
software analysis, it was found that there was little degradation in the
electronics and they could be expected to last another 20 years.

98 Copyright @ 2012PrognosticsTM
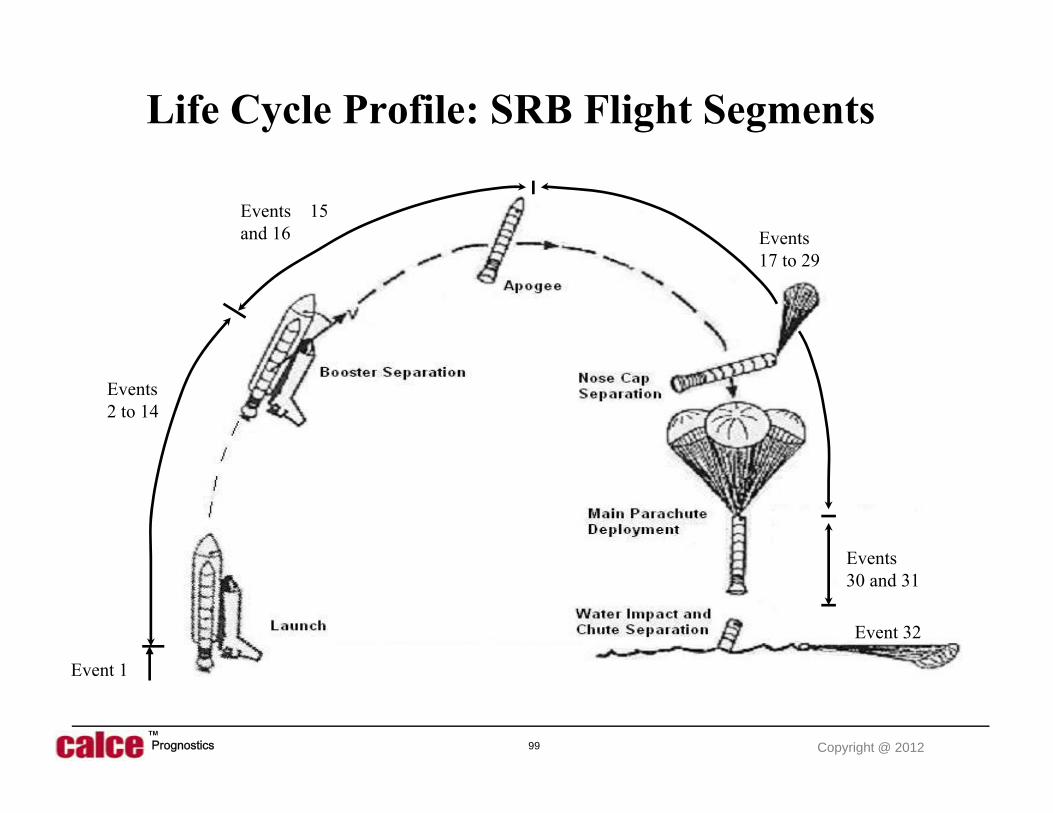
Case Study: NASA Solid Rocket Booster Electronics
• The space shuttle solid rocket booster (SRB) was designed for a 20 year life.
• The objective of the study was to assess the possibility of extending the use of the electronics beyond the designed life.
99 Copyright @ 2012PrognosticsTM
Life Cycle Profile: SRB Flight Segments
Event 1
Events 2 to 14
Events 15 and 16 Events
17 to 29
Events 30 and 31
Event 32
100 Copyright @ 2012PrognosticsTM
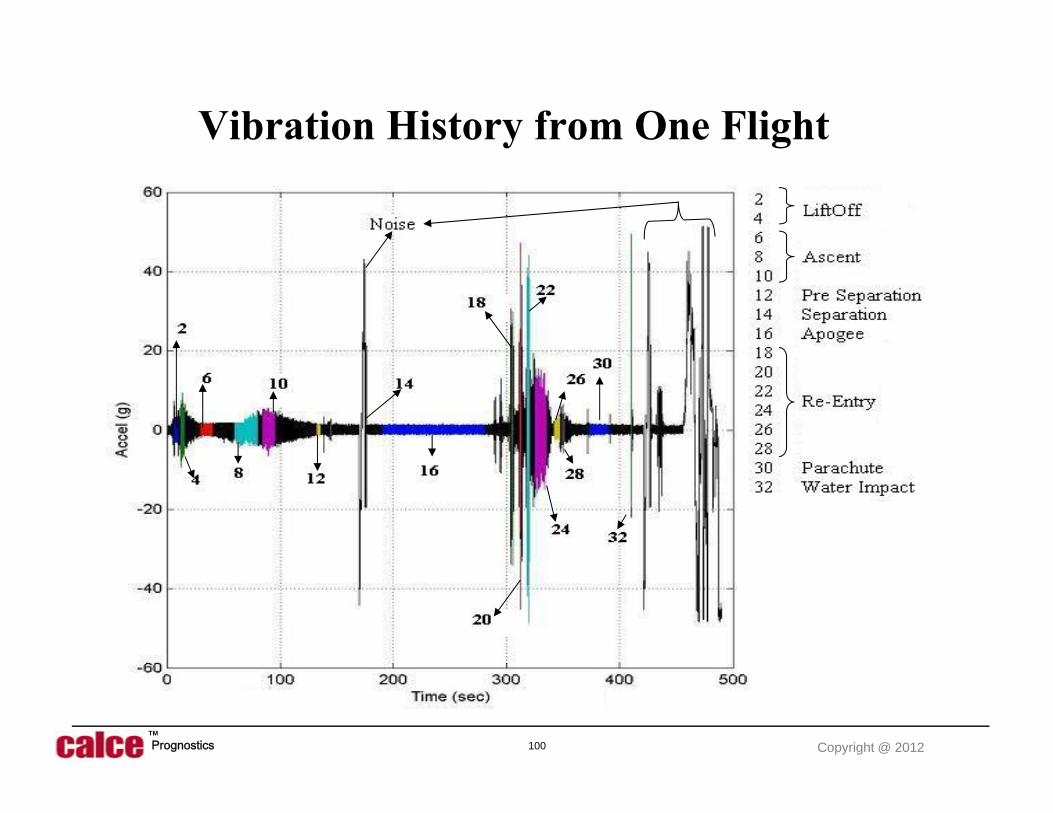
Vibration History from One Flight

101 Copyright @ 2012PrognosticsTM
Remaining Life Assessment of SRB Electronic Hardware
• It was predicted that the electronics would survive another 40 missions.
• HOWEVER, analysis found that the mechanical brackets would not survive additional missions due to damage accumulation from prior missions.
• Awarded best article in IEST 2007: “Virtual Remaining Life Assessment of Electronic Hardware Subjected to Shock and Random Vibration Life Cycle Loads,”

102 Copyright @ 2012PrognosticsTM
2003: US Military Requires
Prognostics to be Included in All New Weapon Systems
103 Copyright @ 2012PrognosticsTM
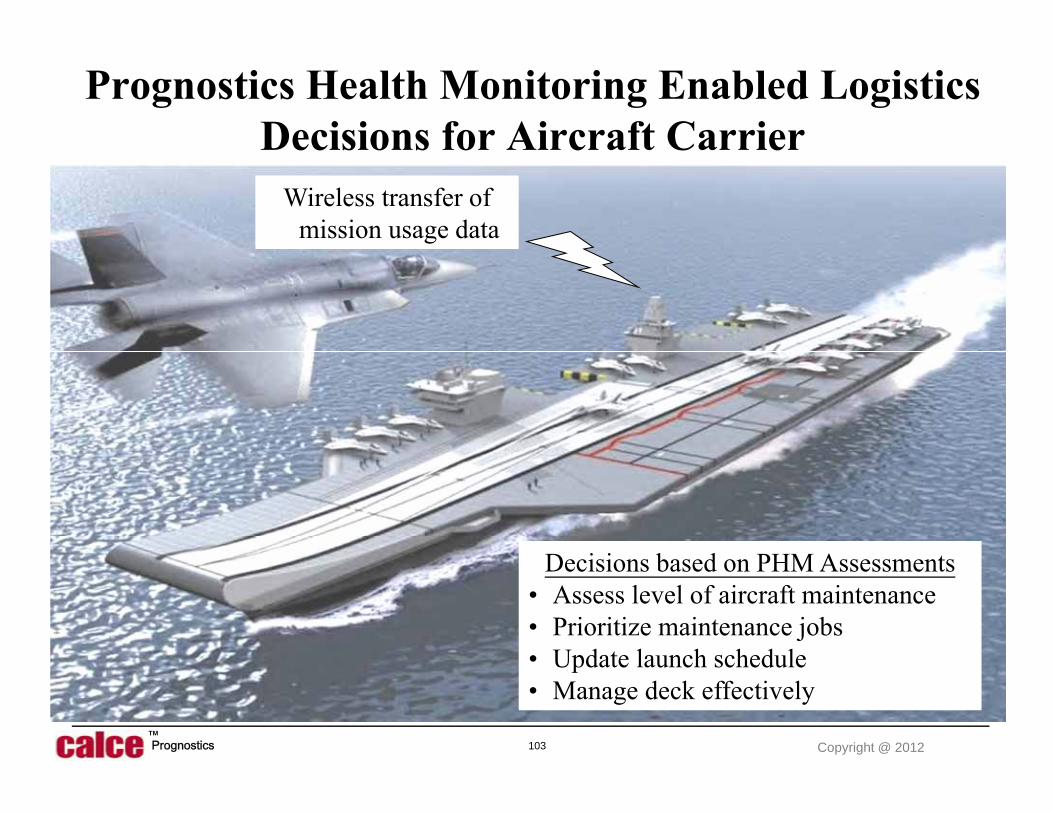
Prognostics Health Monitoring Enabled Logistics Decisions for Aircraft Carrier
Decisions based on PHM Assessments• Assess level of aircraft maintenance• Prioritize maintenance jobs• Update launch schedule• Manage deck effectively
Wireless transfer of mission usage data

University of MarylandCopyright © 2012PHM Group 104
Prognostics and Systems Health Management Approach
Detection
(1) Remote Monitoring(1) Remote Monitoring
Raw Sensor DataRaw Sensor Data
(2) Data Pre-Processing
(2) Data Pre-Processing
Time-stamped FeaturesEvent MessagesParametric Data
Time-stamped FeaturesEvent MessagesParametric Data
(3) Anomaly Detection
(3) Anomaly Detection
Warnings & AlertsChange detection time
(4) Anomaly Identification(4) Anomaly
Identification
Anomaly Source ID:- System- Sensor
- Operator- Control
- Reference- Model
AssetAsset OperatorOperator Health Assessment
(6) Prognostics(6) Prognostics
Remaining Useful Life (RUL)
Prediction
(5) Diagnostics(5) Diagnostics
SubsystemFailure Modes
Subsystem HealthAssessment
(η, Deterior. Index)
ClassificationClassification
(7) Fault Accommodation
(7) Fault Accommodation
(8) Logistics Decisions
(8) Logistics Decisions
Corrective Action Identification
Corrective Action Identification
Part Level Health RUL AssessmentPart Level Health RUL Assessment
On-board Tactical Control
Inventory ControlInventory Control
MaintenanceActions
MaintenanceActions
OperationalActions
OperationalActions
Off-board Management
Source Management
Source Management
Customer/MaintainerCustomer/Maintainer
(9) Planning and Mgmt
(9) Planning and Mgmt
Plan
Mission Objectives & Requirements
Mission Objectives & Requirements
Value Optimization
Value Optimization
Maintenance Culture
Maintenance Culture
Contract Engineering
Contract Engineering
Standards/Best
Practices
Standards/Best
Practices
Value Assessment
Value Assessment
ROI Forecast
ROI Forecast
Operational, Cost and Readiness Impact
Operational, Cost and Readiness Impact
Data LogisticsData Logistics
(c) General Electric Company - 2010
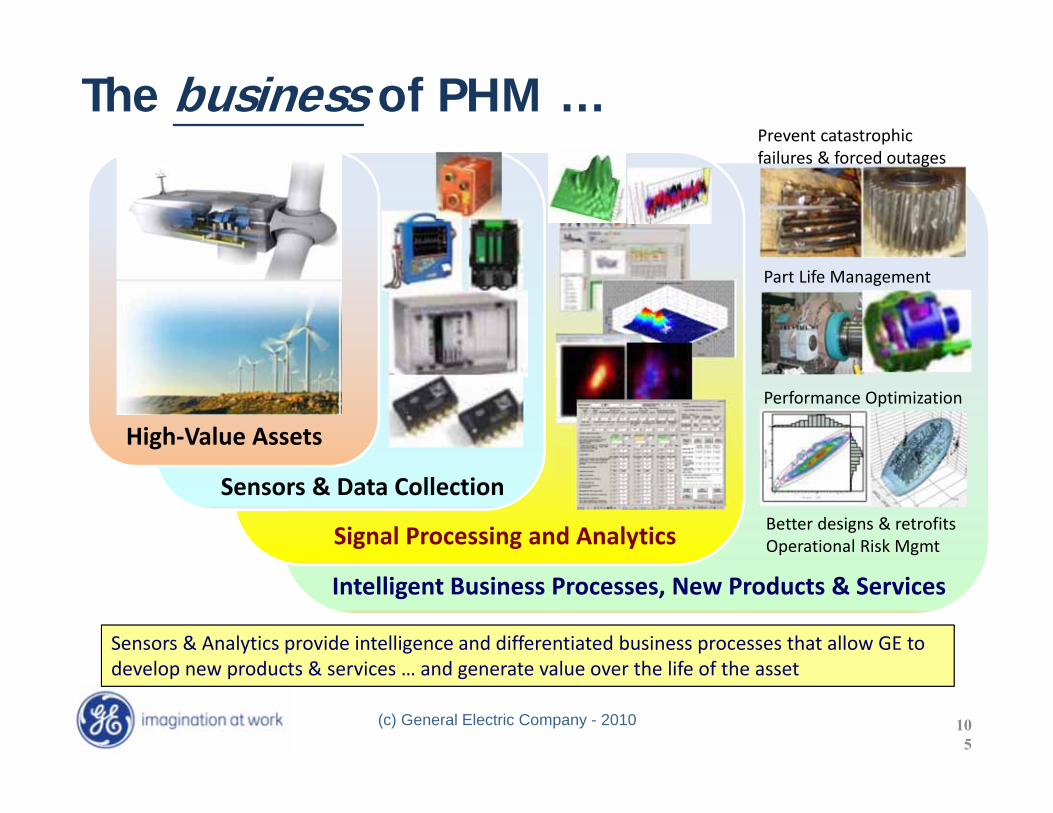
The business of PHM …
Sensors & Analytics provide intelligence and differentiated business processes that allow GE todevelop new products & services … and generate value over the life of the asset
105
High‐Value Assets
Sensors & Data Collection
Signal Processing and Analytics
Prevent catastrophicfailures & forced outages
Part Life Management
Performance Optimization
Better designs & retrofitsOperational Risk Mgmt
Intelligent Business Processes, New Products & Services

(c) General Electric Company - 2010
New Roles for PHM &Asset Management
New Business Models, Products• Extended warranties• Long term service agreements• Operation & Maintenance Agreements• New types of assets .. E.g. Renewable energy
Technology & Reliability, Risk• Costs of collecting, storing and analyzing datacontinues to fall .. moving from terabyte topetabyte level databases
• Reliability & Risk Management needs to operatein a real‐time 24/7 environment
106
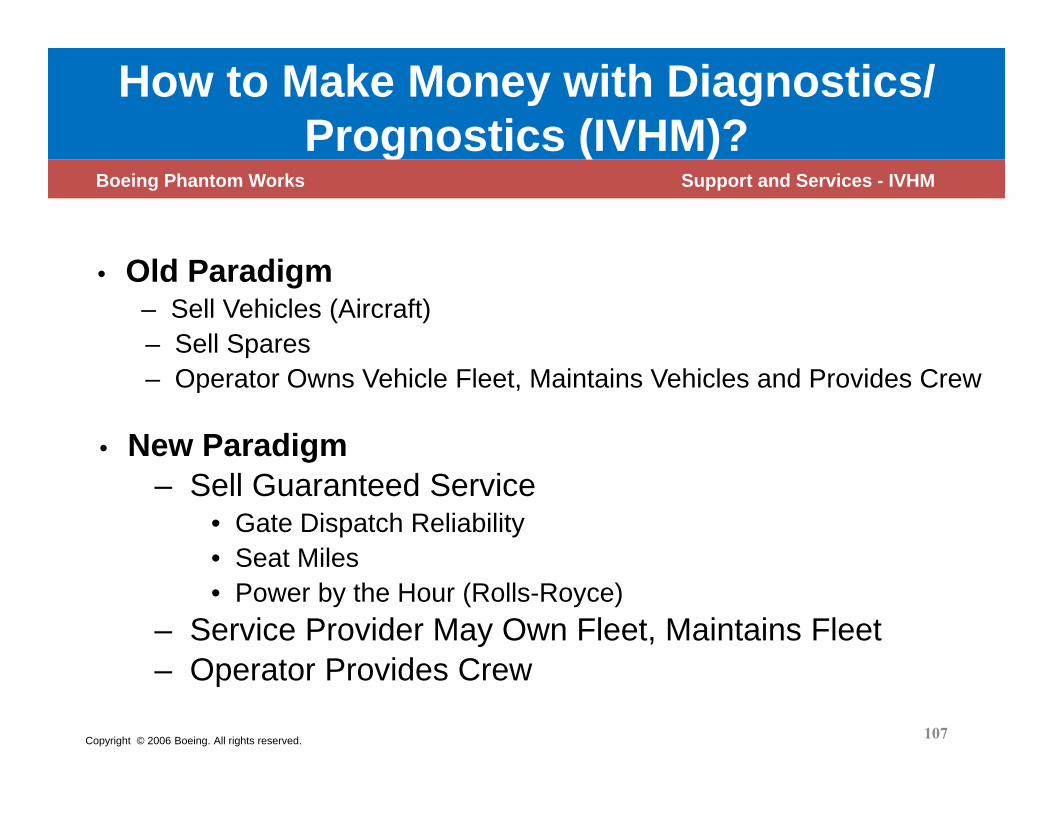
How to Make Money with Diagnostics/ Prognostics (IVHM)?
• Old Paradigm– Sell Vehicles (Aircraft)– Sell Spares– Operator Owns Vehicle Fleet, Maintains Vehicles and Provides Crew
• New Paradigm– Sell Guaranteed Service
• Gate Dispatch Reliability• Seat Miles • Power by the Hour (Rolls-Royce)
– Service Provider May Own Fleet, Maintains Fleet– Operator Provides Crew
Boeing Phantom Works Support and Services - IVHM
Copyright © 2006 Boeing. All rights reserved. 107
University of Maryland
• Provide an early warning of failures• Provide guidance to extend warranties• Optimize qualification tests• Provide efficient fault detection (CND)• Forecast maintenance as needed • Improve designs
PHM Objectives

109 Copyright @ 2012PrognosticsTM
The FutureHealth management and prognostics will be an
integral part of all products and systems

110 Copyright @ 2012PrognosticsTM