program measurement and evaluation guide...introduction the health enhancement research organization...
TRANSCRIPT
Program Measurement and Evaluation Guide:Core Metrics for Employee Health Management
Health Enhancement Research Organization and Population Health Alliance{ }

Contributors to this Guide
Matt Damsker Mercer
Michael Connor, DrPH Alere Health
Edward Marc Framer, PhD HealthFitness
Beth Umland Mercer
David Anderson, PhD StayWell
Geoff Alexander Onlife Health
Michael Brennan, MS, MBA The Boeing Company
Jennifer Flynn, MS Mayo Clinic
Jessica Grossmeier, PhD, MPH StayWell Health
Ben Hamlin NCQA
Iver A. Juster, MD ActiveHealth Management
Gordon D. Kaplan, PhD
Alere Health
Adam Long, PhD Health to You, LLC
Craig F. Nelson, DC, MS American Specialty Health
LaVaughn Palma-Davis, MA University of Michigan
Robert Palmer, PhD, MSN, RN Alere Health
Prashant Srivastava eVive Health
David Veroff, MPP Health Dialog
Jerry Noyce Health Enhancement Research Organization
Karen Moseley Population Health Alliance
2

Initi
ativ
e O
verv
iew
Initiative Overview
3

IntroductionThe Health Enhancement Research Organization (HERO) and Population Health Alliance (PHA) recently published Program Measurement and Evaluation Guide: Core Metrics for Employee Health Management, a core set of metrics for the evaluation of employee health management programs.
After two years and countless hours of research and discussions by more than 60 members of both organizations and many outside experts, HERO and PHA are responding to employers who seek a greater level of clarity regarding the value of their wellness efforts. Thus, we recommend an initial set of measures to assess the impact of the health management programs offered to employees. The results are better informed business decisions and boardroom discussions.
HERO is dedicated to improving the health of the employee population through research and education to create and disseminate evidence-based research that describes “best practices” in employee health management (EHM). PHA is acknowledged for years of work in consensus-driven and evidence-based evaluation measures and methodology and has a broad perspective that encompasses the health of the entire US population, including the employee population. HERO and PHA collaborated with more than 40 other organizations in developing the Program Measurement and Evaluation Guide (hereafter referred to as “the Guide”). Virtually all industry segments were represented, including employers, health plans, program providers, academic research centers, and certification agencies.
The Goal for the GuideThe goal of this collaborative project and the Guide is to provide standard measures for the assessment of employee health management programs (the detailed report will be available on our Websites at: www.populationhealthalliance.org and www.the-hero.org). This project does not seek to be prescriptive about the types of programs offered to an employee population. Rather, the recommended metrics can be applied to any program intended to improve the health of a population. For example, some programs may be focused on low-risk individuals with the goal of keeping risks low, while others may be focused on employees already at risk of future disease with the goal of risk reduction. Still other programs may be designed to help individuals with disease achieve better outcomes. The Guide includes metrics and evaluation strategies that apply to these and other focus areas.
At the project’s outset, the additional goal of developing standard recommendations for the levels of performance that wellness programs should be expected to attain was considered. However, our conclusion, based on a review of the literature, is that codifying expected program outcomes would be premature. Therefore, the scope of the project was limited to providing a common set of standard measures and measurement methods. As data based on these standard measures become available, future plans for the project include developing standards of performance and best practice. While the initiative is focused on supporting employer programs, our hope is that other stakeholders and communities also will benefit from this work.
4

Stakeholder Benefits for Guide UsersThe use of a core set of standard measures is expected to benefit all EHM program stakeholders:
Employers /Benefit Managers For those faced with decisions regarding the selection of health enhancement programs, core metrics can facilitate comparisons and provide a reasonable basis for the development of vendor performance metrics and expectations. In addition, employers can use these data to identify gaps in their own employee health management programs.
Benefit ConsultantsCore metrics can be used across EHM vendors and employer purchasers of EHM services. When EHM program outcomes are based on standard metrics, sharing these findings can be expected to result in industry norms. These, in turn, will provide consultants with reliable comparative data for making vendor recommendations and for negotiating health improvement performance standards.
Health Management Program Managers Core metrics will provide data to fine-tune health enhancement interventions as well as data for reporting success to C-Suite stakeholders.
Accrediting OrganizationsThese groups will be able to use metrics endorsed by relevant stakeholders to evaluate vendor and/or health plan compliance; they can also serve as industry ‘clearinghouses’ for aggregated results.
National Health Management Policy MakersCore metrics will facilitate the development of benchmarks and recommendations for use by federal/state policy makers.
Employee Health Management Services VendorsCore metrics will create a level playing field for competitors and encourage product improvements based on efforts to meet or surpass benchmarks based on the standard measure set. These metrics will also support industry-level research demonstrating the value of EHM programs.
Employee Health Management Participants Participants will benefit from product improvements stemming from competition to meet and surpass benchmarks based on these core metrics.
5

Scope of the GuideMeasures applicable to key health management programs delivered to an employer’s population were considered. These were categorized into the following measurement domains:
• Financial outcomes • Health impact • Participation• Satisfaction
• Organizational support• Productivity and performance• Value on investment
Our Collaborative ProcessHERO and PHA drew on member experts, prior research, and a strong project process for the Guide. The collaboration was guided by a small steering committee comprised of members from both organizations. Seven work groups were assembled, each addressing one of the respective domains listed above. The groups were staffed by HERO and PHA members and other volunteers. The co-leaders of each work group (largely drawn from each organization’s research-related committees) formed a leadership group that met regularly with the steering committee to provide updates, discuss issues, review and offer comments and feedback on the measure-development work in each domain, and to assure consistency across domains. Major steps in the process included:
• Review of the literature to discover what metrics are currently used to measure the performance of employee health management programs;
• Obtain guidance and advice from other subject matter experts in the domain areas;
• Identify and/or develop recommended measures;
• Review the work with key stakeholders to obtain feedback and consensus;
• Release the work through conference presentations, publication, and other channels recommended by stakeholders and others.
EHM Value ChainMeasuring the value of EHM programs is widely desired by employers. Unfortunately, accurately measuring the value of EHM is not straightforward. There is no practical “gold standard” methodology by which to measure savings or other desired outcomes. We could find no cases where different evaluation methodologies have been compared against the same program or over the same time period.
Nonetheless, the science of EHM evaluation has evolved to the point that we can provide useful guidance on what metrics to select—and the methodologies that accompany the use of the metrics. Moreover, the Guide offers information about how various metrics fit specific cases differing in population size, data availability, and resources available for program evaluation.
6
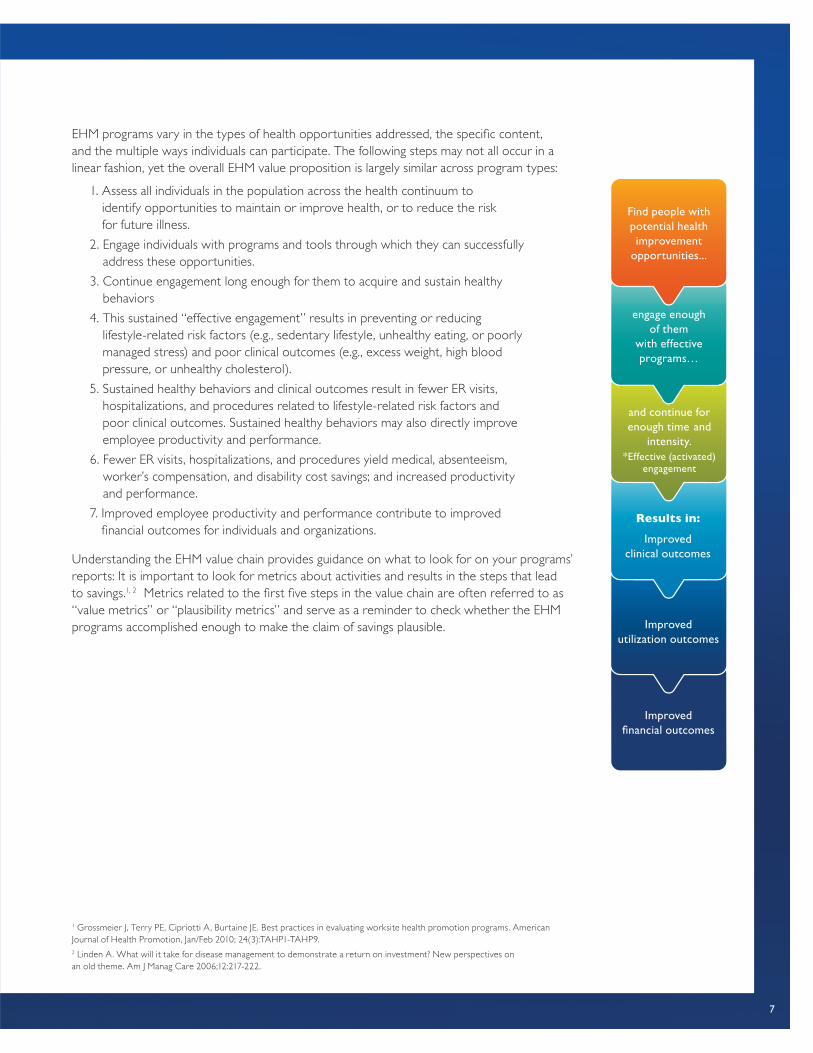
EHM programs vary in the types of health opportunities addressed, the specific content, and the multiple ways individuals can participate. The following steps may not all occur in a linear fashion, yet the overall EHM value proposition is largely similar across program types:
1. Assess all individuals in the population across the health continuum to identify opportunities to maintain or improve health, or to reduce the risk for future illness.
2. Engage individuals with programs and tools through which they can successfully address these opportunities.
3. Continue engagement long enough for them to acquire and sustain healthy behaviors
4. This sustained “effective engagement” results in preventing or reducing lifestyle-related risk factors (e.g., sedentary lifestyle, unhealthy eating, or poorly managed stress) and poor clinical outcomes (e.g., excess weight, high blood pressure, or unhealthy cholesterol).
5. Sustained healthy behaviors and clinical outcomes result in fewer ER visits, hospitalizations, and procedures related to lifestyle-related risk factors and poor clinical outcomes. Sustained healthy behaviors may also directly improve employee productivity and performance.
6. Fewer ER visits, hospitalizations, and procedures yield medical, absenteeism, worker’s compensation, and disability cost savings; and increased productivity and performance.
7. Improved employee productivity and performance contribute to improved financial outcomes for individuals and organizations.
Understanding the EHM value chain provides guidance on what to look for on your programs’ reports: It is important to look for metrics about activities and results in the steps that lead to savings.1, 2 Metrics related to the first five steps in the value chain are often referred to as “value metrics” or “plausibility metrics” and serve as a reminder to check whether the EHM programs accomplished enough to make the claim of savings plausible.
1 Grossmeier J, Terry PE, Cipriotti A, Burtaine JE. Best practices in evaluating worksite health promotion programs. American Journal of Health Promotion, Jan/Feb 2010; 24(3):TAHP1-TAHP9.2 Linden A. What will it take for disease management to demonstrate a return on investment? New perspectives on an old theme. Am J Manag Care 2006;12:217-222.
engage enough of them
with effective programs…
Find people with potential health improvement
opportunities...
and continue for enough time and
intensity.*Effective (activated)
engagement
Results in:
Improved clinical outcomes
Improved utilization outcomes
Improved financial outcomes
7

Measurement DomainsM
easu
rem
ent
Dom
ains
8

FINANCIAL OUTCOMES
Financial outcomes are key performance indicators for most capital, system, or human resource investments. An important feature of the employee health management (EHM) value proposition is the idea that by promoting wellness, improving health, and preventing health risks, these programs produce a positive return on investment, i.e., ROI.
We therefore aim to reduce the confusion expressed by some over EHM financial outcome reports. That various measurement methods have limitations is widely understood by those formally trained in EHM. But to the less initiated, the metrics used can seem unfamiliar and confusing. Similarly, metrics are inconsistent across vendors and consultants, and the methodologies used to calculate savings and ROI are not always transparent. Unfortunately, some EHM programs have also claimed implausible levels of ROI.
A common barrier to understanding EHM financial metrics is that they don’t easily fit with the ROI paradigm familiar to business decision makers, where return is usually thought of as revenue—money earned for investment made. In contrast, the financial value of EHM is counted as savings—money not spent due to prevented events (such as hospitalizations or ER visits). While ROI from the more-familiar paradigm often does include some savings (e.g. fewer accidents from improving safety), it is important to reorient purchaser perspectives in order to fairly compare EHM assertions of ROI with those of competing (potential or actual) investments. We will explore this issue further in the section of the report entitled “Value on Investment”.
FINANCIAL METRICS AND GUIDANCE SUMMARYGiven the importance of financial outcomes to employers who invest in EHM programs, the Guide emphasizes specific financial metrics and savings methodologies, as follows:
1. Directly monetized claims savings are scrutinized, using one of five savings methodologies.
2. The monetized impact on rates of hospitalizations (and ER visits and procedures) that are potentially preventable by EHM is addressed.
3. Financial impact based on a model that links to what occurred during the program (such as participation, changes in lifestyle-related health risks, and clinical outcomes) and characteristics of program participants is explored, using published evidence and/or rigorous claims-based studies of prior years of the program or a vendor’s book of business.
The five savings methodologies applied to directly monetized claims are:
1. Cost trend compared with industry peers
2. Adjusted-expected compared to actual cost trend
3. Chronic vs. non-chronic trend comparison
4. Participant vs. non-participant trend comparison
5. Comparison with matched controls in a non-exposed population
Measurement Domains
9

HERO/PHA selected these five savings methods because they are feasible in the employer setting, commonly used or advocated, embody safeguards to improve their validity, measured using the employer’s medical and pharmacy claims, and reasonably easy to understand. Each of these methods has advantages and disadvantages. However, as mentioned, none is perfect and—to our knowledge—none has been directly compared (on the same EHM program) to the “gold standard” but infeasible prospective randomized controlled trial methodology. It is, therefore, strongly recommended that results using any of these methodologies be viewed together with the program’s value-chain plausibility metrics in making judgments about cost impact and ROI.
In addition, HERO and PHA recommend reporting impact on lifestyle-related health risk factors. While there is good evidence that preventing or decreasing such risks is cost-saving, current evidence is not sufficient to recommend a specific risk-factor based monetization formula.
A major consideration when measuring financial savings based on health care claims experience is timeliness. The availability of full claims experience results in financial savings estimates that lag months after the program year. The chart below shows important EHM leading and lagging indicators. Sustained high performance on Leading Indicators forecasts high performance on the outcomes of value to employers. Time Course indicates time points at which impact on the listed indicator is typically first observed. Also, Lagging Indicators other than cost are themselves leading indicators for future cost.
LEADING AND LAGGING INDICATORS OF EHM’S FINANCIAL IMPACT
LEADING INDICATORS EXAMPLES TIME COURSE
Identification, Stratification and Targeting (outreach) Count/% with risk factors . ..conditions…etc. Few months
Program enrollment and use of tools Initial enrollment by type of program or tool Few months
Continuing engagement or program completion 4 or more sessions; or (better) program completion 6–12 months
Behavior change (lifestyle risks) Physical activity, tobacco, nutrition, stress 6–12 months
Behavior maintenance 6- or 12-month rates of low lifestyle risk 12+ months
Processes of care % of diabetics with annual LDL testing Six months
Medication adherence % of people with CAD on statins with MPR 80%+ 6–12 months
Achieving clinical targets % of diabetics with LDL less than 100 Six months
Activation (survey or composite measures) Patient Activation Measure or composite performance Six months
Satisfaction with EHM Positive experience and high marks on usefulness 6–12 months
Well-being Gallup-Healthways Well-Being Index 6–12 months
LAGGING INDICATORS EXAMPLES TIME COURSE
Functional status SF-12/36, Activities of Daily Living Six months
Quality of life and well-being SF-12/36, Gallup-Healthways Well-Being Index Six months
Absenteeism and presenteeism Health-related absenteeism and presenteeism scales Six months
Morbidity (ER, hospital, procedures) Rates for ER, hospital, and preference-sensitive procedures 1–3 years
Healthcare claims cost Paid or allowed amounts as trends 2–5 years
KEY CAD: Coronary artery disease; MPR: medication possession ratio (defined as the % of the days that a person should be taking their medication, that they actually are as evidenced by count of days’ supply dispensed); LDL: Low density lipoprotein cholesterol; SF12 and 36: Standard measures of functional status and quality of ; ER: Emergency room
10

In the Financial Outcomes section of the Guide, we provide guidance on the appropriateness of using various financial metrics, including the appropriateness of direct measurement from healthcare claims; the strengths and weaknesses of commonly-recommended methods; and the validity of program savings reports. In all cases, the results must be reasonable (represent an achievable financial impact) and plausible (be supported by elements in the value chain, such as sufficient engagement, acquisition of healthy behaviors, clinical outcomes, and EHM-related utilization).
HEALTH IMPACT
This measurement domain assesses the impact of EHM programs on the overall health and well-being of targeted populations. Prior work on health and well-being models was reviewed including O’Donnell, 2008; Burton, 2010; and Pronk, 2011. This review resulted in identifying four dimensions of health for inclusion in our basic set of measures. Criteria used in finalizing the dimensions were:
1. Clear relationship with health outcomes (as determined by literature review);
2. Clear relationship with healthcare and/or productivity costs (as determined by literature review);
3. Able to be affected by employers via their EHM programs;
4. Industry consensus on the importance of the dimension, as determined by review of: (1) existing guidance documents; and (2) inclusion in more than one (generally most) of the most widely used health risk assessments (HRAs) (i.e., WebMD; StayWell Health Management; Alere; HealthFitness; University of Michigan HMRC; CDC; RedBrick; and Mayo Clinic).
Based on these criteria, the final dimensions chosen for the initial set of measures included:
• Physical Health (biometrics such as blood pressure, height, weight, etc., and existence of chronic conditions)
• Mental/Emotional Health
• Health Behaviors
• Health Status
• Summary Health Measures (i.e., indices relating to risk status)
Metrics within each health dimension were selected for inclusion based on the following general criteria:
1. The measure has been recognized by the field as being an important determinant of health outcomes and of healthcare/productivity costs. This determination was based on literature review; review of major HRAs; review of currently available guidance documents; and the collective experience of the workgroup members as subject matter experts.
11

2. The measure is reasonable for employers to implement. This includes availability and ease of measurement; reasonable cost; and, where applicable, direct measurement capability. For example, measures available in the public domain were preferred over measures that were proprietary and, therefore, had additional costs for use.
3. The measure is or can be made comparable across program providers/vendors.
4. The measure can be affected by the EHM programs provided by employers.
5. Assessment of the measure does not significantly increase the overall length of the measurement tool. The workgroup recognized the need to keep the measurement tool brief enough to avoid reducing completion rates and support users who may wish to enhance the basic question set with unique additional items. Therefore, wherever possible single-item measures were preferred over measures requiring multiple items.
HEALTH IMPACT METRICS SUMMARY1. Physical Health
A. BMI (height; weight)B. Blood Pressure (systolic/diastolic)C. Cholesterol (Total; HDL; LDL)D. Fasting Blood Glucose or HbA1cE. Medical ConditionsF. Perceived Health Status
2. Mental and Emotional Health Impact
A. Perceived StressB. DepressionC. AnxietyD. Perceived Life Satisfaction
3. Health Behaviors
A. Physical Activity (total amount)B. Tobacco Use (all types)C. Alcohol Use (total amount/risky drinking)D. Fruit/Vegetable IntakeE. Seat Belt UseF. Sleep (typical hours/night)G. Daytime SleepinessH. Safety Restraint UseI. Drinking/DrivingJ. Health Screenings According to Recommended Schedule (blood pressure;
glucose/A1c; cholesterol; colorectal, cervical and breast cancer)K. Immunization Status (flu, tetanus/diphtheria, pneumonia, varicella, HPV)
4. Summary of Health Measures (Risk Status Indices)
A. Overall risk reduction—maintenance of low risk status and net risk reductionB. Individual risk reduction
The Guide provides more detail on these measures including definitions, examples, and data capture methods. We also provide guidance on various considerations regarding direct and self-reported data collection, timing of data collection, and health risk measurement.
12
PARTICIPATION
Ideally, participation would be defined as a level of interaction between an EHM program and an individual that has shown some evidence of producing an outcome. The level of interaction would presumably vary based on the program and the modality. Due to a lack of consistency between interventions, levels of intervention, and the outcomes in the literature, the recommended approach is to use a range of participation measures based on general themes we observed in the literature. These were not themes associated with specific outcomes and/or programs but, rather, were those observed across the modalities. In-person contact was associated with the lowest number of contacts able to produce a positive outcome, while online contact was associated with the highest number of contacts required for an outcome.
Thus, a categorical reporting structure using ranges is recommended rather than a prescriptive minimum number of contacts. This recommendation is based upon observations from the literature with regard to the number of contacts associated with a positive health outcome. Displaying a categorical range allows employers to interpret and understand the continuum of what could be defined as participation within their population.
Establishing even general guidelines to support defining participation proved to be a challenging task. Despite limiting the scope to select condition management and lifestyle/wellness programs, the literature contained large variations in the number and type of contact for participants and associated outcomes. Some studies looked at a single contact, while others looked at 10 or more. Additionally, some studies looked at single modalities while others combined them without making discriminations among modalities used. Therefore, even if being non-prescriptive, there are too many variables to recommend a specific threshold, or even a range, for the number of contacts constituting participation. This conclusion guided the approach to the recommendation.
It is recommended that a participation measure include a cascade from the total number identified as eligible for a program, which is program-specific, to the number and percentage of participants. The components of this cascade are:
• Identification
- Identification definition (i.e., identified = any member with a program-related code, Identified = any member with a program-related code AND a valid phone number, etc.)
- Source of identification (i.e., administrative claims, self-referral, referral, etc.)
• Number of members identified for the program
• Of those identified, number and % selected for contact
• Of those identified, number of successful contacts by channel/modality and overall
• Of those identified, number of participants by channel/modality and overall
• Definition of a participant or participation
13
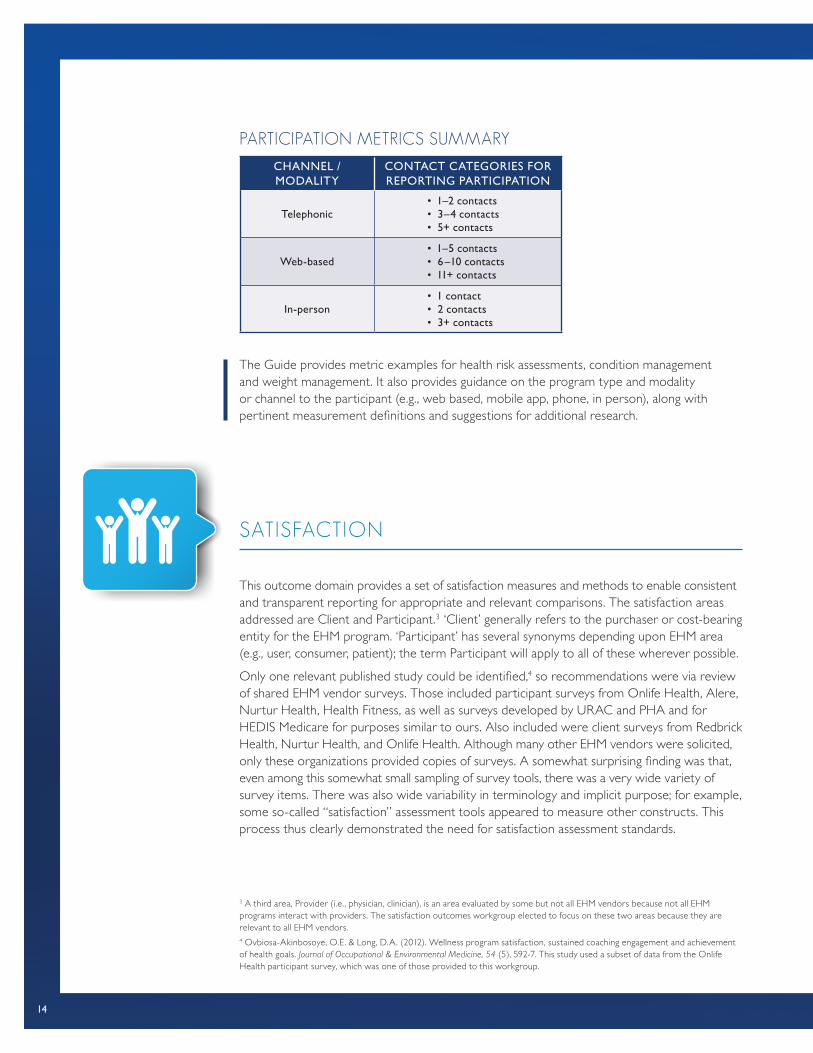
PARTICIPATION METRICS SUMMARY
CHANNEL / MODALITY
CONTACT CATEGORIES FOR REPORTING PARTICIPATION
Telephonic• 1–2 contacts• 3–4 contacts• 5+ contacts
Web-based• 1–5 contacts• 6–10 contacts• 11+ contacts
In-person• 1 contact• 2 contacts• 3+ contacts
The Guide provides metric examples for health risk assessments, condition management and weight management. It also provides guidance on the program type and modality or channel to the participant (e.g., web based, mobile app, phone, in person), along with pertinent measurement definitions and suggestions for additional research.
SATISFACTION
This outcome domain provides a set of satisfaction measures and methods to enable consistent and transparent reporting for appropriate and relevant comparisons. The satisfaction areas addressed are Client and Participant.3 ‘Client’ generally refers to the purchaser or cost-bearing entity for the EHM program. ‘Participant’ has several synonyms depending upon EHM area (e.g., user, consumer, patient); the term Participant will apply to all of these wherever possible.
Only one relevant published study could be identified,4 so recommendations were via review of shared EHM vendor surveys. Those included participant surveys from Onlife Health, Alere, Nurtur Health, Health Fitness, as well as surveys developed by URAC and PHA and for HEDIS Medicare for purposes similar to ours. Also included were client surveys from Redbrick Health, Nurtur Health, and Onlife Health. Although many other EHM vendors were solicited, only these organizations provided copies of surveys. A somewhat surprising finding was that, even among this somewhat small sampling of survey tools, there was a very wide variety of survey items. There was also wide variability in terminology and implicit purpose; for example, some so-called “satisfaction” assessment tools appeared to measure other constructs. This process thus clearly demonstrated the need for satisfaction assessment standards.
3 A third area, Provider (i.e., physician, clinician), is an area evaluated by some but not all EHM vendors because not all EHM programs interact with providers. The satisfaction outcomes workgroup elected to focus on these two areas because they are relevant to all EHM vendors.4 Ovbiosa-Akinbosoye, O.E. & Long, D.A. (2012). Wellness program satisfaction, sustained coaching engagement and achievement of health goals. Journal of Occupational & Environmental Medicine, 54 (5), 592-7. This study used a subset of data from the Onlife Health participant survey, which was one of those provided to this workgroup.
14
SATISFACTION SUMMARYThe domains are listed below by area in a roughly prioritized fashion. The entire list may be part of future standards, but those most critical for near-term adoption are ranked higher:
1. Participant Satisfaction
A. Overall (including loyalty)B. EffectivenessC. ScopeD. ConvenienceE. CommunicationsF. ExperienceG. CostH. Benefits
2. Client Satisfaction
A. Overall (including loyalty)B. EffectivenessC. ValueD. ScopeE. Member experienceF. Account managementG. Reporting
In the Satisfaction section of the Guide, we provide survey items for sub-topics within each metric domain. We also discuss appropriate survey and sampling considerations in collecting the information, as well as performance standards and recommendations for future consideration.
ORGANIZATIONAL SUPPORT
Organizational support refers to the degree to which an organization is committed to the health and well-being of its employees. The formal and informal programs, policies and procedures within an organization that make “the healthy choice the easy choice” are recognized as deliberate steps to which a company is committed. Success in establishing organizational support of EHM programs can be measured by the deliberate steps the company has taken to create the conditions for healthy behaviors, as well as employees’ and managers’ perceived organizational support (POS) of employee health and well-being.
A healthy culture incorporates management policies and practices that involve, empower, and engage the employee in decisions about their work and the direction of the organization.
15
Such a work environment makes it easy, convenient, acceptable, and expected to engage in healthy behaviors. It should also be recognized that a healthy workplace culture can be influenced by what occurs inside and outside of the workplace. As outlined in the World Health Organization’s Healthy Workplace Model5, there are four main facets that influence a workplace culture: physical work environment, personal health resources, psychosocial work environment, and enterprise community involvement. For the Guide, the focus was limited to supportive efforts that can be performed in the workplace.
Two methods were used to identify and select measures: 1) a thorough review of the published literature regarding organizational support and methods for measuring POS, and 2) interviews with employers and expert consultants to learn about current best-practice strategies in organizational support of EHM. The criteria used to select the recommended measures included:
• Usefulness of the measure in providing organizational guidance;
• Practicality of using measures within the employer setting.
Recommended MeasuresIt is recommended that employers measure both their level of organizational support and the degree to which their employees, managers, and leaders perceive both that health is a priority for the business and that they are supported by their employer organization. In addition, an organization should also consider measuring the degree and relative strength of their programs, policies, and procedures (i.e., deliberate steps) that support the adoption and engagement of health behaviors. To accomplish this, these measures would include the assessment of:
1. Deliberate steps (programs, policies, procedures, etc.) the employer has taken to provide an environment that supports health and well-being;
2. Employee-perceived level of organizational support (POS);
3. Leader/manager-perceived level of organizational support (POS).
Measuring the degree of organizational support provided by a company can be approached in different ways. These include:
1. Company assessment of the “key elements” (described in depth in the Organizational Support section of the Guide) on a Likert scale to determine strength or weakness in each specific area of organizational support;
2. Use of a validated tool to self-evaluate efforts;
3. Use of an employee survey to assess employee and leader impressions of company efforts;
4. Implementation of a validated employee assessment tool that summarizes employee and leader opinions regarding how supported they feel.
5 World Health Organization Healthy Workplace Model: Avenues of Influence, Process and Core Principles (www.who.int/occupational_health/healthy_workplaces_workshop_report.pdf )
16

ORGANIZATIONAL SUPPORT SUMMARY1. Organizational support elements
A. Company-stated health valuesB. Health-related policies C. Supportive environment (the physical or “built” environment of the workplace) D. Organizational structureE. Leadership support F. Resources and strategies (adequate EHM services, budget, communication, etc.)G. Employee involvement (employees have opportunity for input and evaluation) H. Rewards and recognition
2. Using validated organizational self-evaluation tools
A. Centers for Disease Control (CDC) Worksite Health Scorecard (HSC)B. Checklist of Health Promotion Environments at Worksites (CHEW)C. Dimensions of Corporate Well-Being Scorecard (DCW)D. Environment Assessment Tool (EAT)E. HealthLead: US Healthiest Workplace Accreditation ProgramF. HeartCheckG. HEcheck (Health Environment)H. HERO Employee Health Management Best Practice Scorecard in
Collaboration with MercerI. Wellness Council of America (WELCOA) Well Workplace ChecklistJ. WiScoreK. Worksite Wellness StrengthsBuilder
3. Employee perception tools
A. Employee Survey Question (Do you feel that your employer supports your health and well-being?)
B. CDC NWHP Health & Safety Climate Survey (INPUTS™)C. Lifegain Health Culture Audit (LHCA)D. Organizational Health & Safety Climate Scale (developed by Basen-Enqguist)E. Perceived Organizational Support Survey (POS)F. Perception of Environmental and Cultural Support for Health SurveyG. Worksite Health Climate Scales (WHCS)
4. Leader Perception Tools
A. Leader Survey Question (How well does your organization support you as a manager to best support your employees’ health and wellbeing?)
B. Leading by Example Instrument (LBE)C. Perception of Environmental and Cultural Support for Health Survey
The Guide also presents organizational assessment tools currently available in the marketplace related to leader, management, and employee perception. Other considerations and delineation between organizational assessment and employee satisfaction are addressed.
17

6 Goetzel RZ, Guindon AM, Turshen IJ, Ozminkowski RJ. Health and productivity management: Establishing key performance measures, benchmarks, and best practices. Journal of Occupational and Environment Medicine. 2001;43(1):10-17 7 Davis K, Collins SR, Doty MM, Ho A, Homgren A. Health and productivity among U.S. workers. Issue Brief (Commonwealth Fund). 2005;856:1-10.8 Stewart WF, Ricci JA, Chee E, Morganstein D. Lost productive work time costs from health conditions in the United States: Results from the American Productivity Audit. Journal of Occupational and Environmental Medicine. 2003:45:1234-1246.
PRODUCTIVITY AND PERFORMANCE
Historically, the focus in EHM outcomes measurement has been on the impact of health risks, chronic conditions, and clinical outcomes on direct health care costs. Recently, the value proposition for EHM has broadened to include harder-to-measure outcomes such as worker productivity.6,7,8 While health care cost management remains a significant concern to employers, there is a need to broaden the value proposition for EHM from a singular focus on health care cost management to also include a focus on optimizing employee productivity and performance.
While there are many non-health related contributors to employee performance, health is an important contributor and EHM programs have the potential to contribute to an improved company bottom line. The challenge for purchasers of EHM programs is to incorporate measurement of productivity-related outcomes in a way that will be accepted by business leaders. Getting beyond a singular focus on health care costs demands a focus on the effects of health (or illness) on work outcomes such as attendance, performance, and turnover. These measures are more readily linked to operations measures that typically matter to business leaders and, therefore, may be more compelling arguments for human capital investments rather than just managing the “cost of doing business”.
The most validated self-report tools available to employers are especially strong when it comes to measuring time away from work (TAW) and productivity loss while at work (PLAW) due to a worker’s poor health. An emerging idea in the area of employee productivity is distinguishing traditional productivity measurement (focused on TAW and PLAW) from optimal employee performance.
To help distinguish the differences among TAW, PLAW, and optimal worker performance, a five-category performance continuum was developed as depicted below. It does not represent a research-tested measurement model but, rather, a conceptual framework to illustrate the potential difference between productivity and performance. A detailed explanation of the continuum is provided in the Guide.
18

PRODUCTIVITY AND PERFORMANCE METRIC SUMMARY Below is a list of metrics that can be used to assess the worker productivity and performance gains realized from EHM. Using the broadest possible definitions of productivity and performance, metrics would ideally quantify worker presence at work and the execution or accomplishment of job-specific tasks against pre-determined performance standards. Some organizations are able to capture employee sick time associated with poor health, fully leverage disability and workers compensation data to manage time away from work, and measure observed changes in work output to optimize on-the-job productivity. However, most employers must rely on self-report tools for at least some of these issues. The recommended metrics below provide options for measurement for organizations to select from based on the availability of appropriate administrative data or self-report tools.
1. Time away from work (TAW) due to poor health
A. Unscheduled absenceB. Workers compensationC. Short term disabilityD. Long term disabilityE. Self-reported absence due to employee poor health
2. Productivity loss while at work (PLAW) due to poor health
A. Self-reported presenteeism
3. Worker Performance
A. Employee performance ratingsB. Objective measures of performance by job type
The Guide provides more information on the distinction between productivity and perfor-mance as well as the appropriateness of using various productivity metrics, including use of administrative versus self-report measures; the strengths and weaknesses of commonly-used methods; the validity of self-report survey tools; and the appropriateness of monetizing the reported impacts of EHM. The Guide also discusses related emerging areas of measurement such as employee performance and employee engagement with their work.
EMPLOYEE PERFORMANCE CONTINUUM 9
9 The employee performance continuum applies to productivity at an individual level but performance must also be measured at the team, division, and organizational level. The total performance opportunity is greater than the sum of the individual parts. There is a need to develop new models that incorporate interactions among employees. A more comprehensive view of performance includes aggregation of individual performance as well as additional performance associated with the synergistic outcomes of teams or divisions. Because the continuum was developed with a focus on the individual as the unit of measurement, what is not represented in the “At work but not productive” category is the scenario where an employee is at work and behaving in a way that disrupts the productivity of others around them. If a continuum were developed at the group-level, the influence of individual workers on the productivity of others should be considered.
At work but not productive
At work and productive but below standards
At work and productive, meeting standards, not optimized
Optimal performance at work
Not at work(absence)
Contributors to performance: market and workplace environment, worker health and engagement
19
VALUE ON INVESTMENT
How does an employer make informed and knowledgeable decisions across all of these domains? Two conditions are necessary for this: an understanding of the appropriate set of relevant EHM program metrics and a sound approach to understanding and interpreting the metrics. The first condition is addressed in other sections of this paper. Value on Investment (VOI) is a measurement framework which addresses the second condition, an approach to understanding and interpreting these metrics.
If there is a default approach to evaluating EHM programs, it is the measurement of ROI. An ROI measurement calculates how much money was saved (e.g., through reduced health care spending) as a result of an EHM program as compared to how much money was spent on the program. The ROI convention expresses the result as a ratio: $saved:$spent. Thus, ROI calculations are interpreted as, for example:
0.75:1 (75 cents were saved for every dollar spent)
3.27:1 (Three dollars and 27 cents were saved for every dollar spent)
1:1 (The program broke even—one dollar saved for one dollar spent)
There is no doubt that the ROI evaluation will continue to be used in the future. As the sole measure of value, however, ROI is an inadequate and incomplete measure of an EHM program’s performance. These inadequacies and limitations include:
• Relying on a single outcome: dollar savings. While it is important that health care costs are reduced, there are many other possible outcomes of value that may result from an EHM program. These should be identified and measured in any comprehensive program evaluation.
• Presuming a program has failed if it fails to produce a positive ROI. There is no rule that states an ROI must be greater than 1:1, but the expectation is created that any program failing to pay for itself is a poor value. Almost none of the $3 trillion spent annually on
• Implying a false sense of precision and certainty. As shown above, an ROI calculation will generally return a result with two or three significant figures. While an ROI calculation might yield a figure of 3.27:1, the methods used for this calculation (particularly for the numerator) are far more imprecise than is suggested by these figures. ROI values are generally not accompanied by confidence intervals; if they were, they would likely be very wide and include values less than 1.
• Creating an incentive to maximize ROI. The simplest way to insure a large, positive ROI is to make a very small investment, but this may leave many unmet needs that could be effectively addressed by a more costly program with a lower ROI but greater net savings.
In response to these shortcomings of a narrow ROI focus, we have adopted VOI, or value on investment, as our overall evaluation framework. What is the difference between ROI and VOI? First, the VOI framework uses the conventions of cost-effectiveness analyses (CEA). A CEA expresses its results in terms of the cost per unit of outcome. The numerator therefore represents the cost component and the denominator, the outcome (this is the opposite of an ROI ratio). CEA analytic techniques can be abstruse, but the central idea is quite simple and straightforward: How to get the most for the money. Beyond this simple exposition, the VOI framework includes several principles, each of which is described in more detail in the Guide.
20

These principles include the following:
• To emphasize the entire range of outcomes that might add value;
• To emphasize the entire range of costs that might be incurred;
• To emphasize that purchasers are entitled to decide what they think is important;
• To emphasize that purchasers are entitled to decide what calculations they think are credible or not credible;
• To express valuations in a manner that is intuitively appealing and understandable;
• To express valuations in a manner that permits apples-to-apples comparisons among various program options;
• To be flexible enough to accommodate all varieties and combinations of PHM programs.
It is important to emphasize that taking a VOI approach does not preclude performing an ROI calculation if one is desired. Simply by reversing the numerator and denominator (for monetized outcomes) a conventional ROI ratio will be created.
VOI METRICS The proposed VOI formula uses a cost effectiveness analysis (CEA) convention, which places the dollar investment or resources used first (the numerator) and the outcomes second (the denominator). The outcomes may be specific clinical measures (reduced rates of a particular disease state), or in dollar amounts representing the monetized value of the outcomes.
The numerator will represent all inputs and investments in an EHM program as shown below:
1. Direct Costs
A. Program Fees (which may include Case Management; Medication Adherence; Biometric Screening; Employee Assistance Programs; Health Risk Assessment; Lifestyle coaching; On-site Fitness Facility or Club Discounts; Decision Assistance; Triage/nurse line; Injury prevention program; Concierge services; On-site Clinics: Ergonomic/back health program: Cost transparency programs; Provider support programs, etc.)
B. Incentive Costs (to the extent they are incremental costs to the purchaser)
2. Indirect Costs
A. Employee Time (biometric screening, etc.)B. Communications/Print MaterialsC. Data Systems and ReportingD. Contract PersonnelE. Legal ReviewF. Facility Space
3. Tangential Costs
A. Employee MoraleB. Company ReputationC. Legal ChallengesD. Selection Effects (on employee population)
The Guide provides additional recommendations related to monetizing indirect costs, tangential cost definitions, and a literature review summary largely focusing on the value of incentives.
21

Next Steps
Nex
t Ste
ps
22
The development and release of the Guide is a major industry initiative, but in many ways it is just the beginning.
These core metrics and methods need to be further applied by employers and other purchasers in assessing the value and improving the performance of EHM programs. Through practical application, the measures will be refined and further standardized, enabling more robust reporting across the industry and leading, eventually, to normative benchmarks. The HERO/PHA measurement collaborative will continue its process of encouraging and assessing the adoption of core metrics and facilitate the development of additional metrics, particularly in the areas of organizational support, productivity and performance, and value on investment.
Next Steps
www.the-hero.org www.populationhealthalliance.org 952.835.4257 202.737.5980
{ }
Design support for the Program Measurement Evaluation Guide provided by HealthFitness.
23
