program on education policy and governance working papers ... · program on education policy and...
TRANSCRIPT
Program on Education Policy and Governance Working Papers Series
Are Educational Vouchers Only Redistributive?
Eric Bettinger Case Western Reserve University
Michael Kremer
Harvard University
Juan Saavedra Harvard University
PEPG 08-08
Preliminary draft
Please do not cite without permission
Prepared for the CESifo/PEPG joint conference “Economic Incentives: Do They Work in Education”
Insights and Findings from Behavioral Research
CESifo Conference Center Munich, Germany May 16-17, 2008

1
Are Educational Vouchers Only Redistributive?1
Eric Bettinger, Michael Kremer, Juan E. Saavedra2
05/06/2008
Voucher programs expand recipients’ choice sets, so standard economic theory suggests they improve their welfare. However, it is less clear whether vouchers increase educational productivity or are purely redistributive, benefiting recipients only by allowing them to obtain more desirable peers at the expense of other students. We take advantage of an educational voucher program in Colombia, for which spots were allocated by lottery, to address this question. Among those who applied for vouchers to vocational schools, lottery winners were less likely to attend academic secondary schools and thus had peers with less desirable observable characteristics. Despite this, lottery winners had better educational outcomes, including higher graduation rates and reading test scores. This suggests that, at least in this population, vouchers improved educational outcomes through channels beyond redistribution of desirable peers. One potential channel is economic incentives. Students lost the voucher if they failed a grade, and for students who applied to vocational schools, voucher winners continued in school rather than entering the labor force. Another potential channel is the tighter fit of private vocational curricula with the needs of the labor market. Whereas many public schools focus on industrial curricula preparing students for traditional manufacturing positions, private vocational schools seem nimbler at adjusting to market conditions, overwhelmingly focusing on preparing students for Colombia's rapidly growing service sector.
1 We are grateful for support from the David Rockefeller Center for Latin American Studies and the World Bank. Research assistance was provided by Meghan Curtis, Amanda Starc and Sara Adler. We benefited from comments and suggestions from Beth King, Harry Patrinos, and Sebastian Martinez. 2 Bettinger: [email protected]; Kremer: [email protected]; Saavedra: [email protected].
2
Much of the debate regarding school vouchers revolves around its impact on voucher recipients (e.g.
Rouse 1998, Howell and Peterson 2002, Krueger and Zhu 2003). However, standard economic theory
suggests a prima facie case that receiving a voucher makes on better off by expanding the opportunity set
for school choice. However, it also suggests that the overall welfare impact of vouchers depends not simply
on their impact on participants, but also on their impact on non-participants. This impact depends on
whether vouchers improve educational productivity, for example by allowing students to attend more
effective schools or to attend schools better matched to their idiosyncratic needs, or whether they simply
redistribute fixed educational inputs.
Vouchers could potentially create negative externalities if students are affected by peers, and share
common preferences over a fixed set of available peers. In this case, if vouchers help some students obtain
more desirable peers, others will have less desirable peers. In particular, the movement of voucher students
from public schools to private schools could potentially reduce the average peer desirability both in private
schools and for those left behind in public school. In the simplest linear-in-mean model of peer effects, re-
sorting does not affect average scores in the population (See Hsieh and Urquiola 2006, Epple and Romano
1998). 3
Testing whether vouchers work solely through peer effects or through some other mechanism is
difficult empirically since lottery winners typically attend schools with more desirable peers. If voucher
effects persisted in a context in which voucher recipients obtained less desirable peers, this would provide
some evidence that, at least in that context, vouchers improve outcomes through channels other than peer
effects. Finding such a perverse lottery is difficult. However, because of some peculiar features of
Colombia's PACES voucher program, we can identify a population in which those who obtain vouchers do
not join peers with superior observed characteristics and measure the effect of vouchers in this population.
To do this, we use data from Colombia’s PACES voucher program, previously discussed in Angrist, 3 Gallego (2006) suggests that vouchers in Chile may have increased student test scores in both voucher and public schools.

3
Bettinger, Bloom, King, Kremer (2002) and Angrist, Bettinger, and Kremer (2006). In the Colombian
voucher program, students were required to apply and be accepted at a private school before they could
apply for the voucher. The program stipulated that students could apply to either academic or vocational
private schools (escuelas tecnicas). After gaining acceptance to these schools, students then submitted
applications to the voucher program and a lottery was used to determine which students received the
voucher. Because it was administratively difficult to retain the voucher if one switched schools, there was
considerable stickiness in schools attended by voucher winners. Less than 20 percent of students that
transferred after the first year of the voucher were able to retain their voucher. Thus, among applicants who
applied to vocational private schools, we find that voucher lottery winners were more likely to stay in
vocational schools whereas applicants who did not win a voucher were more likely to attend an academic
school.
In general, academic schools are more prestigious than vocational schools in Colombia and their
students are more likely to complete secondary school and obtain high exam scores. Therefore, among
applicants to vocational schools, voucher winners did not attend schools with higher average scores or
higher participation rates on Colombia's college entrance exam4 than their counterparts among voucher
losers. In fact, point estimates suggest that among applicants to vocational schools, voucher winners
attended schools where students were 25 percent less likely to attend college and about 33 percent more
likely to drop out. We perform a number of comparisons across multiple measures of peer quality, and we
find that among applicants to vocational schools, voucher winners attended schools with peers with less
desirable observable characteristics than voucher losers. Despite not having observably more desirable
peers, among those who applied to vocational schools, voucher lottery winners have significantly better
educational outcomes than losers, including a 25 percent increase in the likelihood of graduating from high
4 Ninety percent of Colombia’s graduating high school seniors take the college entrance exam while only about 75 percent of these students go on to post-secondary schooling (World Bank 1993). Hence, we view participation in the ICFES exam as a proxy for high school graduation more than an indicator of college attendance.
4
school and a one-third of a standard deviation increase in college entrance exam scores. The results suggest
the observed effects of vouchers, in this context, are not solely the result of interaction with better peers.
What then was the channel by which vouchers led to better outcomes in this population? One
hypothesis is that the voucher created economic incentives for voucher recipients. Students lost the voucher
if they did not complete a grade, and the "outside" option for students who applied to vocational schools is
labor force participation with 22.1 participating within three years of the voucher lottery. While there is no
effect of the voucher on the likelihood that a student works among non-vocational school applicants, the
voucher effect is extremely strong (7.3 percentage points) among vocational students -- a one-third
reduction in workforce participation. The finding that students respond to economic incentives is consistent
with emerging literature on students’ responses to financial incentives in schooling (e.g. Kremer, Miguel,
and Thornton 2007, Bettinger 2008).
Another hypothesis is that private vocational schools may be teaching skills that students’ value
highly, relative to those available at the public vocational schools, and hence students may have more
incentive to stay enrolled and to study. Whereas academic schools are likely to cover a common canonical
curricula whether public or private, in vocational education it is particularly important to adapt to the needs
of the labor market. In Colombia, public vocational schools have a much higher proportion of offerings in
industrial vocational training, such as metal working, carpentry, or electrical working, whereas private
schools are much more likely to offer vocational training in service industries, like business, secretarial
work, communication, and computers. The private sector may have more flexibility than the public sector to
eliminate or transform curriculum that are no longer demanded by the general economy.
The remainder of this paper is organized as follows: In section 2, we present a brief model of
educational attainment that allows for the possibility that vouchers could potentially both have a direct
productive effect and allow recipients to obtain better peers, at the expense of others. We develop a way to

5
test this model to identify whether vouchers have a productive effect or if peer effects are the only
mechanism for any observed voucher effect. In section 3 we present background information about the
PACES program. In section 4, we address the data and empirical strategy. In section 5, we show the
relationship between winning the voucher and subsequent peer quality in the schools voucher winners
attend. We compare a number of different measures of peers to demonstrate that among applicants to
vocational schools, voucher winners had no better peers than voucher winners. In section 6, we show that
voucher winners, particularly those in vocational schools, had better educational outcomes than voucher
losers. Section 7 discusses potential mechanisms by which the voucher affected students.
2. Theoretical Framework
As noted above, there is a presumption that vouchers benefit recipients, but a key question in
assessing their desirability for society as a whole is whether vouchers are simply redistributive or whether
they lead to productivity gains, because private schools are more efficient, because schools respond to
competitive pressures, or because vouchers allow students to better match with the schools that meet their
particular needs.
There are several possible channels through which vouchers could potentially have a negative
impact on non-recipients, but we focus on peer effects, since this is the most plausible channel through
which vouchers could have a significant negative effect on non-participants not just during a transition
period but in steady state. In the short run, before private school capacity can respond, school choice could
hurt non-participants by squeezing them out of a limited supply of private school places. Similarly, there
may be short run fixed costs in public schools so that transfers of students and budget to private schools
could hurt some students at public schools. However, in the long run, if the cost of education is close to
linear in the number of students, and there is free entry into school provision, it is unlikely that there would

6
be significant negative externalities through these channels, particularly as the value of the voucher was less
than the cost of publicly provided education. 5 6
It is worth noting that even if voucher programs benefit participants only by allowing them to obtain
peers they prefer, this need not harm others if students are heterogeneous and have different preferences
about which peers they prefer. For example, if some students in an English speaking country want to go to a
French-immersion school and others want to go to a Chinese-immersion school, a voucher program that
allowed each group to attend a school with peers with similar preferences might help both groups. But if
students share the same preference-ordering over peers and schools are of fixed size then any gains in peer
desirability for students who take advantage of school choice will be linked to losses for other students.
Welfare judgments about the overall desirability of vouchers will clearly depend on distributional
preferences but it seems likely that a key question is whether any benefits of vouchers on participants are
entirely due to zero-sum sorting or whether there is also a “productive” impact of vouchers.
We therefore consider a model which nests the hypotheses that vouchers help participants by
allowing them to attend more productive schools and that they help participants only by allowing them
access to more desirable peers at the expense of other students. In particular, we assume that all schools
have the same number of students and that educational outcomes for person i are given by:
(1) Yi = 0β Xi + is PX εββ ++ 21
where Xi is student i’s socioeconomic status or genetically determined ability, sX is the average level of Xi
in school s, and P indicates program participation. In this linear framework β 1 is a purely productive effect
and 2β is the purely redistributive effect. (More generally, we could assume and that Yi = 0β Xi + β 1 f [Xi
... Xi-1 Xi+1 , XN ] + 2β P + εi ,where N is the number of students per school and f(.) is increasing in all its 5 A number of new schools are believed to have been created in response to Colombia’s voucher program. 6 One other channel through which vouchers could potentially create negative externalities is if they lead to the creation of schools teaching ideologies that are inimical to other members of the population. We do not believe that this took place in this context, and in any case this type of externality is not the focus of this paper.

7
arguments.) Under the hypothesis that 2β > 0 and β 1 = 0 vouchers work purely through a productive effect
and the benefit to participants will be equal to the social benefit.
Consider the case where the voucher has no productive effect ( 02 =β ) but peer effects are positive
( 01>β ), and peer effects are linear in means as in equation one. In this case, the observed difference
between voucher winners and losers in a lottery is just )(1 loserwinner XX −β which is positive so long as the
average peer quality of private school students is greater than the average peer quality of public school
students. However, vouchers will not raise average achievement in society as a whole, since
,10 XXY ββ += where Y and X denote average levels for the entire society. Vouchers may have
positive effects for participants, by helping them to move to schools where their peers have better X values.
However, in this case the quality of peers may decline for students already in private schools as a result of
the influx of less prepared voucher students. Moreover, if the voucher winners had high X values relative to
the public schools they leave, the voucher program may hurt those left behind in public school by lowering
the average achievement level of students in that public school. This pure peer effects story is precisely the
type of model used by previous researchers in studying the general equilibrium effects of vouchers (e.g.
Hsieh and Urquiola 2006, Epple and Romano 1998).
More generally, under equation one, estimating the differences in outcomes between lottery winners
and losers, yields 21 )( ββ +− loserwinner XX . This is the effect estimated by Angrist et al. (2002,
2006). This would be the observed effect of the voucher on participants. However, the social effect of the
program on average test scores would only be equal to 2β . β 1 and 2β are not separately identified, and
hence one cannot conclude there is a productive effect of vouchers, rather than just a redistribution effect.
In this paper, we argue that it is possible to test the hypothesis that β 1 > 0, 2β > 0, by finding a
population for whom winning the lottery does not lead to an improvement in peer quality. If

8
loserwinner XX = , then comparing test scores of winners and losers will yield an estimate of 2β , the
productive effect. We identify two groups of voucher applicants. One set had applied to private academic
schools prior to the voucher lottery. The other applied to private vocational schools prior to the lottery.
Because application took place prior to the voucher assignment, we can treat these two groups separately.
As we show in the next section, among those who applied to academic schools loserwinner XX − is generally
positive or zero. In contrast, for those who applied to vocational schools, loserwinner XX − is likely negative.
As we also show in the next section, voucher winners who had applied to vocational schools obtained peers
with lower academic achievement, lower college attendance rates, and higher rates of dropout than their
fellow applicants who lost the lottery. Thus, if vouchers are purely redistributive, allowing recipients to
obtain better peers but having no intrinsic productive effect, so 2β = 0 and 01>β , our simple model would
imply that the difference between voucher winners and losers should be positive among students who had
applied to academic schools and a negative among those who had applied to vocational schools. However,
in our data we find positive effects in both cases. As we show later in the paper, we find that voucher
winners who applied to vocational schools and voucher winners who applied to non-vocational have better
educational outcomes than their voucher lottery loser counterparts - higher tests scores after three years, a
greater likelihood of taking the college entrance exam, higher scores on this exam, and more years
completed of schooling.
3. Background on the PACES Voucher Program
Private schools have always held a prominent role in education in Colombia. Nationwide, almost
1/3 of students attend private schools. In Bogotá, the percentage of students in private school is much
higher, and over 70 percent of the 1,300 secondary schools in Bogotá are private (King et. al. 1997). During

9
the 1990’s Colombia implemented a secondary school voucher program that provided over 125,000
vouchers to people residing in poor neighborhoods. The program was initially launched in Colombia’s
major cities as an effort to increase secondary enrollment rates amongst the poorest families in Colombia.
Students receiving the voucher could attend any private school that accepted the voucher; however, many
schools, particularly the elite private schools in Colombia, would not accept the voucher. Slightly less than
half of private secondary schools participated in the voucher program. While initially the voucher covered
most tuition fees, the government did to increase the voucher to keep pace with inflation and by 1998 when
we collected data, the voucher covered about 56 percent of tuition.
The private schools that took part in the program served lower-income students and charged lower
tuition fees than those private schools that chose not to participate. Non-participating private schools had
significantly higher teacher-pupil ratios than participating schools. However, teacher-pupil ratios were
comparable between public and participating private schools (King et al 1997).
Schools with a vocational curriculum were over-represented among participating schools. Data from
the Instituto Colombiano para el Fomento de la Educación Superior (ICFES) show that only 16 percent of
all high school graduates attended vocational schools. By contrast, 25 percent of voucher winners in our
sample applied only to vocational schools and an additional 23 percent applied to schools with both
vocational and academic tracts. 7
In order to target the poorest families, eligibility was limited to families living in neighborhoods
classified as belonging to the two lowest (out of six possible) socio-economic strata. To enforce the
eligibility rule, parents were required to present a utility bill with household stratification (Calderón, 1996).
In addition, vouchers were only available to students attending public primary schools.
7 We call schools with both vocational and academic tracts "hybrid" schools throughout the paper. About 23 percent of the students in our data attended such schools. We classify these schools as academic although our results are similar if we classify them as vocational schools or exclude them instead.

10
At the start of the application process, students and their families began by filling out voucher forms
printed in newspapers or available at local offices of the Institute for Educational Loans and Technical
Studies Abroad (ICETEX), the national-level public institution that administered the program. Students
listed a particular school they wished to attend before receiving a voucher. In order to receive a voucher for
that school, the student needed to have applied and been accepted to that school. Where necessary, ICETEX
used a public raffle in cities to select the voucher recipients if the demand exceeded voucher supply. The
voucher's value corresponded to the average tuition for a low-to-middle income level private school.
Renewal of the voucher through the end of students’ secondary schooling was contingent upon passing
grades.
Because students applied to private schools prior to the lottery, we can separate lottery applicants by
the characteristics of the schools they applied to. Technically, the lottery could be viewed as two separate
lotteries – a lottery for students who had applied to vocational schools and a lottery for students who applied
to other schools. Applicants to vocational schools tend to differ systematically from other applicants; they
tend to come from families where the parents are less educated, they are also more likely to be living in the
poorest of Colombian neighborhoods, and they typically applied to schools whose students attained lower
than average scores on college entrance exams.
While the voucher rules suggested that voucher winners could transfer to schools other than the one
they listed on their application, few actually did. The process of transferring the voucher was significantly
complex that, according to the survey data in Angrist, et. al (2002), winners who transferred schools rarely
retained their vouchers. The lack of portability in practice meant voucher winners who initially applied to
vocational schools were much more likely to stay at the same school and hence the same type of school.
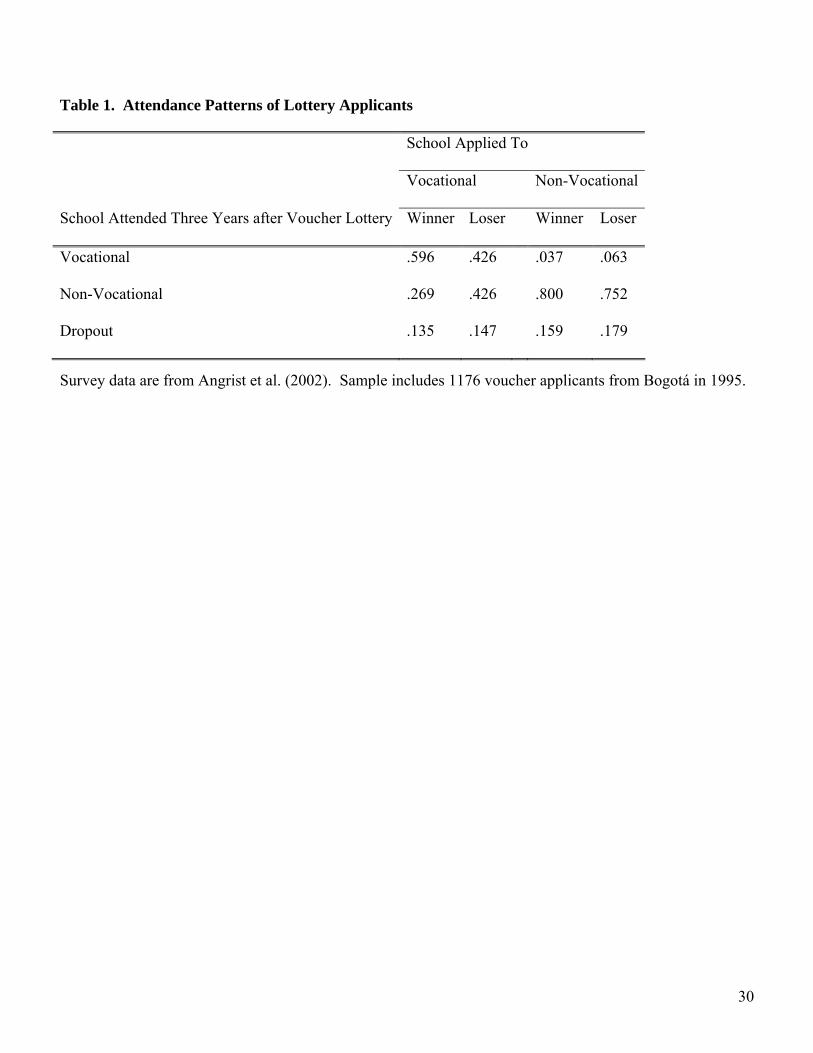
Table 1 shows the enrollment patterns of voucher winners and losers who applied to the voucher program.
Of the students who applied to vocational schools, 60 percent of voucher winners were still in vocational

11
schools three years after the voucher lottery. Only 43 percent of voucher lottery losers who had applied to
vocational schools were still enrolled in vocational schools. As we demonstrate later in the paper, the
vocational schools had inferior characteristics along several dimensions (e.g. academic completion, college
attendance, fees).
Angrist et al (2002) provide support for the validity of the lottery’s randomization. Among all
voucher applicants, there are no significant differences in age, gender, or the likelihood of having a phone
by voucher win/loss status. Similarly, in the sample of students surveyed, there are no differences in pre-
lottery characteristics across voucher lottery winners and losers. This symmetry across winners and losers
suggests the treatment and comparison are comparable and that the randomization in the lottery was valid.
In prior research on the effects of Colombia's voucher program, Angrist et al (2002) find that after
three years, lottery winners were 15 percentage points more likely to have attended private school, had
completed 0.1 more years of schooling, and were about 10 percentage points more likely to have finished
8th grade, primarily because they were less likely to repeat grades. While the program did not significantly
affect dropout rates, lottery winners scored 0.2 standard deviations (or about one grade level) higher on
standardized tests. Angrist et al (2006) show that the voucher also increased the likelihood of secondary
school completion for participants by 15-20 percent. After correcting for the greater percentage of lottery
winners taking college admissions tests, the program increased test scores among participants by two-tenths
of a standard deviation in the distribution of potential test scores. Thus, if the benefits to participants were
not at the expense of negative externalities for non-participants, then the program was very cost effective
given the low cost to the government and the benefits arising from the likely increase in winners' earnings
due to greater educational attainment. Below, we present evidence casting doubt, at least in the Colombian
context, on the hypothesis that the positive impact on beneficiaries was from peer effects of the type that
would create negative externalities for non-participants.
12
4. Data and Empirical Strategy
The data used for this analysis are derived from three sources. First, we use data from a survey of
voucher applicants carried out in Bogotá by Angrist et. al. (2002). During 1998 and 1999, Angrist et. al
(2002) interviewed 1,176 applicants from the 1995 cohort of applicants to the program. Of those, 51 percent
won a voucher to attend a private secondary school. Using the ICFES classification of academic and
vocational schools we determined that roughly 25 percent of applicants applied to vocational schools and
the remaining 75 percent to academic or hybrid schools. For 283 students in the survey sample, we also
have standardized test scores for a test taken three years after the lottery.8 In Table 2 we present some other
descriptive statistics from the survey sample.
The second source of data relies on matching administrative records from the ICFES with data on
their college entrance exams (See Angrist et al., 2006). Since 90 percent of Colombian students take the
ICFES exam (World Bank 1993), this is likely a good proxy for high school graduation.
The final source of data comes from a survey we conducted of schools in our sample. In January
2006, attempts were made to contact a sample of 300 schools with a heavy concentration of voucher
applicants. In choosing which schools to survey, we opted for schools which had the highest number of
voucher applicants in attendance. While not random, the selection procedure accounted for almost 85
percent of the schools that voucher winners attended. In our school survey, we gathered extensive
information about school and peer characteristics that we use to demonstrate the differences between the
various schools students chose to attend.9
8 Tests cover the math, reading, and writing sections of a standardized test entitled La Prueba de Realización. Of the 473 applicants invited, 283 attended. 9 Twenty-seven schools no longer existed, and some schools refused to participate in the survey. There was no significant relationship between voucher status and the likelihood that we were able to contact the student's school of attendance. In surveying the schools in 2006, we are inherently assuming that since the voucher lottery, the characteristics of schools have not changed in a way which is different across voucher status of students. Of the school characteristics we can track performance and participation in the college entrance exam before and after the lottery, we find that these characteristics are stable.

13
As discussed in detail in Angrist, Bettinger, and Kremer (2006), winners and losers seem
comparable on observable characteristics such as age, sex and telephone access; this is consistent with the
hypothesis that the lottery was indeed random. Table 2 reproduces some of these results for the sample of
students upon which we focus while disaggregating these comparisons across voucher status by the type of
schools that students applied to. For example, among applicants to vocational schools, there were no
statistically significant differences between voucher winners and losers in age, sex, parental schooling,
neighborhood wealth, and quality of the schools that they applied to. Similarly, there are no significant
differences between voucher winners and losers at non-vocational schools.
Table 2 also reports differences between individuals who applied to vocational and those who
applied to non-vocational schools. While there is no significant observed difference in age or gender
between applicants to the respective types of schools, there is a significant difference between parents’
education levels and neighborhood of residence. Among students who applied to vocational schools, their
mothers and fathers had completed on average 5.2 and 4.8 years of schooling respectively. Among students
applying to non-vocational schools, parents had completed 5.9 and 5.4 years of schooling. The differences
are statistically significant. Additionally, students who applied to the vocational schools were about 50
percent more likely to be living in the poorest neighborhoods in Bogotá. The average ICFES score was also
much lower at vocational schools relative to non-vocational schools.
5. Effect of Vouchers on Peer Quality
To identify the effects of vouchers on peer quality, we rely on data from a survey of school
administrators. When we compare specific individual school characteristics, we find little evidence that
among voucher applicants who applied to vocational schools, voucher winners attended schools where their
peers had more desirable observable characteristics compared to the schools that voucher lottery losers
attended. In fact, almost all of the point estimates suggest that observable measures of peer quality are lower
14
for voucher winners in the population of those who applied to vocational private schools. Due to the limited
sample size the differences between many of the individual measures of peer quality between winners and
losers are not statistically significant. However, an aggregate Average Effect Size measure, combining
several individual indicators of peer quality is significantly lower for voucher winners.
Schools of Attendance
Among applicants to private vocational schools, lottery winners were much more likely to attend
vocational school. To test whether the voucher winners were more likely than voucher losers to attend
vocational schools, we estimate the following equation in Table 3
(2) Wi = α + γVi +πZi+ ui,
where Wi is an indicator for the type or school that student i attends three years after the voucher lottery, Zi
is a vector of controls (age, gender, access to phone, the time of the survey, and the students' neighborhood),
and Vi is an indicator of whether the student won a voucher. The coefficient γ shows the effect of winning
the voucher on the type of school attended. The standard errors reported throughout the paper correct for
heteroskedasticity.
Among applicants to vocational schools, voucher winners stayed in vocational schools while many
voucher losers transferred to non-vocational schools. Among students who originally applied to vocational
schools, voucher winners were 40 percent (.17/.43) more likely to be attending vocational schools three
years later. The effect of the voucher on the type of school attended is much larger for vocational school
applicants than it is for non-vocational school applicants; among applicants to non-vocational schools, both
voucher winners and losers stayed in non-vocational schools.
The other panels of Table 3 show that there are also significant effects on private school attendance
for both vocational and non-vocational schools. Voucher winners at vocational schools are about 17

15
percentage points more likely to attend private school after three years than voucher lottery losers, and there
is a 15 percentage point difference in private school attendance rates for voucher winners and losers at the
non-vocational schools. For vocational schools, the difference is not significant until the second year after
the lottery while the difference at non-vocational schools is already significant in the first year of the
voucher.
Measures of Peer Quality
To test whether the voucher winners had peers with different characteristics, we reestimate equation
2 where Wi represents an indicator for peer quality at the school that student i attends three years after the
voucher lottery, As before, Zi is a vector of controls (age, gender, access to phone for interview, the time of
the survey, and the students' neighborhood), and Vi is an indicator of whether the student won a voucher.
The coefficient γ shows the effect of winning the voucher on the average quality of peers. The standard
errors reported throughout the paper correct for heteroskedasticity. We report these estimates in Table 4.
One limitation of Table 4 is the small sample size. We could obtain data only for a sample of
schools. When we examine the effects of the voucher on students' peers among students who initially
applied to vocational schools, we generally find point estimates that suggest that voucher winners attended
lower quality schools than voucher losers; however, the standard errors are large in part because of our
small sample size.
In order to increase our power, we can take advantage of the fact that we have multiple measures of
school quality. One technique to do this is to compute the Average Effect Sizes (AES) across a category of
peer characteristics. AES is a technique used for estimating the effect of treatment on multiple dependent
16
variables.10 , while allowing for correlation between these variables. To estimate the Average Effect Size
we first scale outcome variables in terms of standard deviation units, and so that positive numbers indicate
more desirable peers. We jointly estimate the effects of the voucher on observable measures of peer quality
and report these "average effect sizes" for vocational schools in Column 4 of Table 4.
The first set of peer characteristics upon which we focus relate to the ICFES exam. The ICFES
exam is the college entrance exam in Colombia and 90 percent of high school graduates take the exam
although only about 75 percent of exam takers go on to college (World Bank 1993). These graduating
students are the peers and perhaps the role models of entering students at the high school. Throughout the
1990's, the median and standard deviations for schools were stable, and the relative rankings of schools did
not change. Since these test scores tend to be stable over time, they likely indicate the average "type" of
student attracted to the school.
The central ICFES measures we use are (1) the mean ICFES score for the school, (2) the proportion
of students who take the ICFES relative to 6th grade class (the first year of high school), 11 and (3) the
proportion of students who take the ICFES relative to the size of the senior class. A limitation of our
strategy is that we only measure the characteristics of the schools after the voucher lottery. Ideally we
would like to use pre-voucher ICFES scores so that we measure pre-determined characteristics of the school
population and not the possible results of improvements in educational attainment due to the voucher
program. Our measure of mean test scores and our measure of the proportion of students taking the ICFES
(relative to the 6th grade class) are taken from the 1998-99 school year. At that time, none of the applicants
in the voucher sample had taken the ICFES exam. In 1998-99, students were typically in 7th or 8th grade and
10 "Average effect sizes" have long been used in medical research (e.g. O'Brien 1984). Recent research by Kling, Katz, and Leibman, (2006) and Bloom, Bhushan, Clingingsmith, Hong, King, Kremer, Loevinsohn, and Schwartz (2006) utilize this methodology as well. 11 While we observe the number of students taking the ICFES exam from each school, we only observe the number of students in sixth grade for schools participating in the SABER, a national survey of a random sample of schools.

17
still had several years before they could take the ICFES exam. Our other ICFES exam statistics were
measured in January 2006. As discussed above, schools' ICFES test scores are stable over time, so this may
be an adequate proxy for ability. The PACES program we examine was small relative to the relevant
population. For example, in 1995, there were 2,378 voucher students out of the 567,000 students in Bogotá.
Hence, any impact of the program on school quality is likely to be small.
Among vocational school applicants, voucher lottery winners attend schools that score .15 to .18
points lower on the ICFES exam than voucher lottery losers. The point estimate is negative but the
difference is not significant. Among non-vocational school applicants, the difference in the types of schools
that voucher winners attend is similarly insignificant. In our other measures of students' ICFES taking
behavior, we find that voucher winners at vocational schools attend schools where a lower proportion of
students go on to take the college entrance exam, although these differences are not statistically significant.
In Column 4 of Table 4, we pool these estimates across these ICFES characteristics and report the average
effect size. Here we find significant estimates. Among students who initially applied to vocational schools,
voucher winners attended schools where their peers were less likely to attend college.
In the other rows of Table 4, we show other measures of school quality, many of which are
significant. For example, voucher winners at vocational schools attend schools where a smaller fraction of
students enroll in college.12 Voucher winners also appear to attend schools where a higher percentage of
students drop out, although these correlations are at best marginally significant. When we look at the
average effect size, students who won the voucher attended schools where their peers were more likely to
drop out but the effect is not significant.
Panel B of Table 4 presents other school characteristics that may serve as indicators of peer quality.
Among applicants to vocational schools, voucher winners are more likely than voucher losers to attend
12 The effects on college attendance should not necessarily match with the ICFES taking results because only 75 percent of ICFES test takers go on to attend college (World Bank 1993) and our data for each of these outcomes come from separate sources (ICFES administrative records and headmaster self-reports).

18
schools with programs focused on tutoring disadvantaged students and unsurprisingly with vocational
programs.13 The existence of these programs suggests that voucher winners' peers were preparing for
vocational careers and/or their peers potentially had learning difficulties. Additionally, voucher winners
also attended significantly less expensive schools. The fact that voucher winners attended less expensive
schools even before considering the voucher subsidy may suggest that voucher winners' peers’ parents were
either poor or had less interest in their children's education. In Column 4, we estimate the average effect
sizes for these other categories of peer quality. We find that voucher winners are more likely to attend
schools with remedial or vocational programs than voucher lottery losers. The schools that these voucher
winners attend also tend to charge lower fees.14 These differences are all statistically significant.
Table 4 also reports differences in school characteristics for students who did not apply to vocational
schools prior to the voucher lottery. In this group, the results are mixed. At times the coefficients suggest
that voucher winners attend schools with lower academic quality than the schools attended by voucher
losers, and in some cases, the point estimate suggest the reverse. Across all of these individual measures,
however, we fail to find any significant differences between voucher winners and losers.
The key lesson that we draw from Table 4 is that voucher winners at vocational schools do not
attend schools with peers of higher status across a variety of measures. Most of the time, the differences are
insignificant; however, despite our small sample size, we frequently find that schools that voucher winners
had less desirable peers than schools that voucher losers attended. When we look at average effect sizes, we
also find that among students initially applying to vocational schools, voucher winners attend schools with
lower peer quality than voucher losers.
13 The sample sizes in Table B for the final five measures often reflect multiple measures per student. For example, in the job training measure, we combine two measures – one about job training and the other about sponsored apprenticeships. Econometrically, we estimate Equation 2 by stacking these measures, including a dummy variable to control for the different measures, and clustering our standard errors at the individual level. We have two measures of fees and two measures of the availability of programs for disadvantaged students. 14 Both public and private schools can charge fees. We focus on matriculation and monthly fees. The matriculation fees are much larger for voucher lottery losers than for winners while monthly fees are more comparable across the groups.
19
While we fail to find that voucher winners’ had peers with better observable outcomes, we cannot
rule out the possibility that there could be selection on unobserved peer quality. However, it seems unlikely
that selection on unobservables would go in the opposite direction (i.e. student with better observable
characteristics would have worse unobserved characteristics), and even more unlikely that it would go
strongly enough in that direction to outweigh the differences on observables.
6. Voucher Effects
Thus far we have presented some evidence to show that among students who applied to vocational
schools prior to the voucher lottery, voucher winners attended schools with inferior peers and school quality
measures when compared to voucher lottery losers. In this section, we demonstrate that even in this
population in which winning a voucher led to less desirable peers, winning a voucher led to improved
educational outcomes.
In Table 5, we estimate the effects on both the likelihood that students take the college entrance
exam and students' performance on that exam. These outcomes are available for a much larger sample
because the data is taken from administrative sources rather than survey data. There are, however, a number
of obstacles in matching the administrative data. The student records from PACES often included incorrect
ID numbers. To improve the accuracy of matching, we used multiple matching strategies – matching by ID
alone, matching by ID and city of residence, and matching by ID number and name.
Table 5 shows the proportion of voucher lottery losers who take the college entrance exam and the
difference by voucher status for applicants to each type of school. The results suggest that students who
applied to vocational schools and won vouchers were 5-6 percentage points more likely to take the ICFES
exam than students who applied to vocational school and did not win the voucher. The voucher effect on
the likelihood of taking the ICFES exam at non-vocational schools was between 3 to 6 percentage points.

20
Given that more students from non-vocational schools took the ICFES exam, the relative effect on voucher
students in vocational schools is much larger. In our most conservative matching strategy, the voucher led to
about a 25 percent increase in the likelihood that a student at a vocational school took the ICFES exam
while the voucher led to a 13 percent increase in the likelihood a voucher winning student from a non-
vocational school took the ICFES exam. Given that the ICFES exam is a better indicator of high school
completion than college entrance, the results suggest that voucher lottery winners were much more likely
than voucher lottery losers to complete secondary school.
Moreover, as the second panel of Table 5 shows, voucher students who applied to vocational schools
tend to have higher reading test scores than students who lost the voucher lottery. As discussed in Angrist,
Bettinger, and Kremer (2006), the unconditional comparisons are likely lower bounds on the true estimate
since the average test scores for voucher winners are likely lower because the voucher affected the
probability of taking the exam (and the marginal students were likely of lower ability). Angrist, Bettinger,
and Kremer (2006) provide a discussion of how to estimate an upper bound for the true effect under the
assumption that any voucher effect is monotonic. These estimates are reported in Table 5 and suggest
significant positive effects of the voucher in both math and reading among vocational students. The raw
difference in test scores of voucher winners and losers at non-vocational schools is not significant, but
similar to the vocational schools, this difference is likely biased downward. The upper bounds suggest
significant positive effects suggesting that at the end of high school, voucher lottery winners had higher
academic achievement than voucher lottery losers.
In Table 6, we estimate the effects of the educational voucher on other outcomes. These other
outcomes were measured using survey data three years after students applied for the voucher and three years
before they took the ICFES exam. In terms of academic outcomes, the results are different in their
significance between vocational and non-vocational schools. The signs of the coefficients suggest

21
uniformly that voucher winners at both types of schools are more likely to complete more years of schooling
and less likely to repeat grades. In the non-vocational schools, the effects on school years finished, grade
repetition, and 8th grade completion are statistically significant. However, while the coefficients are of
similar magnitude in the vocational schools, only the coefficient on 8th grade completion is statistically
significant.
The key finding in Tables 5 and 6 is that voucher winners who applied to vocational schools had
better outcomes than voucher losers who had also applied to vocational schools. While it is useful to note
that voucher winners at non-vocational schools also had positive outcomes, the effect in vocational schools
is of greater interest for the purpose of this paper. This is because among applicants to vocational schools,
voucher winners had peers with lower quality observable characteristics.
7. Other Voucher Mechanisms
Based on these results above, there is no evidence that voucher effects worked solely through
observable differences in peers. Winners did not attend schools with peers who had higher test scores.
Therefore, the results are inconsistent with the hypothesis that voucher winners raised scores for participants
by helping them obtain peers with better observable characteristics. Nonetheless, voucher lottery winners in
vocational schools experienced better outcomes than voucher lottery losers.
If peer effects were not the channel through which vouchers worked, then what was? The data
suggest a few hypotheses. First, winners had more incentive to devote effort to school. Voucher students
lost the voucher if they failed to pass a grade. In recent years, economists have found evidence that students
in primary and secondary school respond to financial incentives in making educational decisions (e.g.
Kremer, Miguel, and Thornton 2007, Bettinger 2008, Angrist and Lavy 2007). While the incentives to stay
in school did not lead to a difference in labor market participation among students who applied to academic

22
schools, it led to significant differences in hours worked and labor market participation among applicants to
vocational programs. Voucher winners who had applied to vocational school were 7.3 percentage points
less likely to be in the labor force than voucher lottery losers who had applied to vocational schools. The
decrease in labor force participation represents a one-third reduction in workforce participation within just
three years of students winning the voucher. Given that vocational school applicants come from poorer
families where the voucher represents a much larger marginal gain to the family, the finding that there is a
difference in working behavior only in the vocational sample reinforces the idea that incentives explain at
least part of the voucher effect on workforce participation. .
A second possibility is that voucher winners attended schools with greater school inputs; however,
we find little evidence to support this. When we look at schools that voucher winners attended, we find that
winners were more likely to attend schools with a greater proportion of teachers who only have secondary
school training and a smaller proportion of teachers with advanced degrees. We find no differences in
voucher status in what types of facilities were available at students' schools.
Another channel through which the greater demand-side choice offered by vouchers may have
improved outcomes is by allowing students to choose the type of schooling they valued. Academic schools
instruct students in the fields of science, humanities or the arts. Vocational schools prepare students
primarily for participation in the labor market, either in the production sector or the service sector. They
typically focus on commercial, industrial, agrarian or pedagogical skills, and their curricula exhibit
considerable heterogeneity.
The focus of public and private vocational schools is very different. Table 7 shows some basic
characteristics of private and public vocational schools in Colombia. Of public schools, 25 percent have an
industrial curriculum, and 62 percent have a commercial one, whereas only 4 percent of private vocational
schools have an industrial curriculum and 92 percent have a commercial focus (both differences are highly
23
statistically significant).15 Accordingly, vocational enrollment differs between public and private schools: in
public vocational schools, 32 percent of students are enrolled in a school with an industrial focus and 48
percent in schools with a commercial focus. By contrast, only 9 percent of private vocational enrollment is
in schools with an industrial focus and 85 percent is in schools with a commercial focus.
In schools with an industrial focus, emphasis and instruction are on activities such as welding,
electrical works, carpentry and cabinetmaking, metallurgy, smelting, welding and metallic ornamentation.
By contrast, in schools with a commercial curriculum, students spend a significant amount of time, both
during school time and in apprenticeships outside school learning how to carry out basic accounting
functions, how to setup and administer a small enterprise, communication skills, information technology,
computer maintenance and software design; event logistics; and office clerical work. Similarly, the type of
apprenticeships that students undertake differs depending on the vocational focus of the school. For
example, data from the 2006 school survey suggests that students in industrial schools are more likely to
participate in apprenticeships that take place with Servicio Nacional de Aprendizaje (SENA), Colombia’s
governmental job training agency, while students in schools with a commercial focus are more likely to
undertake apprenticeships in the private sector, working in offices, small enterprises, universities, and
communications.
Students may value some types of vocational or academic education more than others. In the annual
school census for Bogotá, we can identify the central emphasis of vocational schools that voucher winners
and losers attend.16 Among students not attending academic programs, there is a clear preference for
commercial education as opposed to an industrial, agricultural, or pedagogical curriculum. Lottery winners
who had initially applied to vocational schools were more likely to attend schools with job training or
apprenticeship programs (Table 4). Almost all of these apprenticeships took place in the service sector.
15 These are not the only tracks but they represent 85 percent of the supply of vocational curricula. The others are social work (9 percent) and pedagogic (3 percent), which basically trains students to become school teachers. 16 The annual school census is entitled the C-600. We can only match 1856 students (of 4044) to their school of application.

24
Students' preferences for commercial schools may derive from the fact that students value a commercial
education more than other types of vocational training. White collar jobs are more prestigious than blue
collar jobs, and the service sector has grown considerably while the share of jobs in factories has declined
(Cárdenas and Bernal 1999).
Students who lose the lottery are more likely to attend public schools, and there are a limited number
of commercial vocational schools in the public sector. If student demand for these schools is greater than
the available spots, then students who want to attend vocational schools will be forced to attend industrial
rather than commercial vocational schools or to attend academic schools. Students in the industrial school
may be more likely to drop out because that training is less valuable to them than the commercial education
would be. If the voucher increases the share of students who can attend a commercial school (because they
switch to private commercial schools), then this effect may be driving the increase in retention/years of
education attained. Whether voucher applicants attend academic schools or industrially oriented vocational
public schools, the match between students and schools is likely to be worse than for voucher winners. This
could explain why voucher winners in vocational schools are 25 percent more likely to graduate from high
school (Table 5).17
The finding that vocational students have greater academic attainment is consistent with research on
vocational schooling in the United States. For example, Kemple and Snipes (2000) and Cullen, Jacob, and
Levitt (2005) find that students in vocational schools have greater academic attainment even though their
peer groups have not improved.18
Why are public vocational schools less likely to supply the types of training in demand from the
labor market and from students? The private market may be able to adapt more quickly than the
17 We would have liked to investigate this hypothesis in our data, but unfortunately, the sample of commercial and industrial schools is small in our data preventing any conclusive statistical analysis. 18 Other studies on the efficacy of vocational education include Kemple (2004), Kemple and Rock (1996), Stern, Dayton, and Raby (2000), and Maxwell and Rubin (2000).

25
government to changes in the economy and the demand for skills. For example, the Secretariat of Education
in Bogotá determines the curriculum and curricular standards for all public schools (both vocational and
academic), while private schools have complete autonomy to select their curricular focus. Additionally, in
public schools, hiring and firing of teachers is strongly influenced by FECODE, the Colombian teachers
union, whereas in private schools the school principal exercises such authority. The potential to adapt
quickly to the needs of the labor market depends on a school’s ability to change curriculum and, more
importantly, select qualified teachers. Table 7 shows some evidence that private schools can change faculty
more readily than public schools. In the school census, we find that the probability a public vocational
school has a specialized teacher for industrial teaching is 37 percent--a number ten times larger than the
probability a private vocational school has such teacher (3.8 percent). By contrast, private vocational
schools are 10 percentage points more likely than public vocational ones to have a specialized teacher for
commercial teaching.19 Given the bureaucratic and administrative hurdles for firing or substituting a teacher
in the government sector, it is plausible that specialized curricular conversion will take much longer in
public than in private schools.
Based on the 1998 school census for Bogotá, amongst schools with a vocational focus, dropout rates
in grade 10 (when students fully engage in their vocational curriculum) are more than twice as high in
public than in private schools. The dropout rate for 10th graders in public vocational schools is 7.2 percent,
while for private vocational schools is 3 percent (the difference is highly statistically significant – t-stat of
3.93). Similarly, the dropout rate in 11th grade in public vocational schools is 9 percent while in private
vocational schools is 2.2 percent (the difference is highly statistically significant – t-stat of 4.91). Given that
the likelihood of this population attending a post-secondary institution is very low, it is also likely that the
19 In the data underlying Table 7, we find that public vocational schools have, on average 1.1 more specialized industrial teachers than private vocational ones (the difference is highly statistically significant – t-stat of 3.59). Private vocational schools have, on average 1.2 more specialized commercial teachers than public vocational ones (the difference is highly statistically significant – t-stat of 3.22).

26
practicality and expected return of what students learn in 10th and 11th grade greatly influences their decision
to remain in school. For example, in the census data underlying Table 7, we find that dropout rates are
twice as high in industrial than in commercial vocational schools. The dropout rate (combining 10th and 11th
grades) in industrial schools is 7.9 percent whereas in commercial ones it is 4 percent (the difference is
highly statistically significant – t-stat of 2.46). Even within private vocational schools, dropout rates are
almost twice as high for industrial (4 percent) as for commercial schools (2.5 percent, the difference is not
statistically significant at conventional levels).
Finally, practical training in private vocational schools is much more attuned with the growing
demands of the economy. According to data from Colombia’s Central Bank, salaries in the commercial
sector grew at least as much as salaries for industrial workers between 1999 and 2005.20
8. Conclusion
Previous work suggested that students who participated in voucher programs had better academic
outcomes than students who applied unsuccessfully for the voucher. The previous research, however, could
not rule out the hypothesis that vouchers were purely redistributive and that while voucher participants
benefited from more desirable peers, others had less desirable peers due to the general equilibrium effects of
the program, so there, were no overall social educational gain from the program. (e.g. Hsieh and Urquiola
2006, Epple and Romano 1998).
In this paper, we examine a subpopulation in which voucher winners do not join peers of higher
observable quality. Among applicants to vocational schools, voucher winners stayed in vocational schools,
while voucher losers were more likely to transfer into academic schools. Across a variety of measures,
voucher winners who had applied to vocational schools prior to the lottery attended schools with no higher
and indeed often with lower observable peer quality as compared to voucher losers. Yet voucher winners in 20 http://www.banrep.gov.co/estad/dsbb/srea_011.xls, cited May 29, 2006

27
this population had significantly better outcomes than voucher losers. They are more likely to stay in private
school, more likely to finish eighth grade, and less likely to repeat a grade. Furthermore, voucher winners
are more likely to take the college entrance exam, and their test scores are between 1/3 and 2/3 of a standard
deviation higher than losers. This suggests that, at least in this population, vouchers are not merely a zero-
sum game in which benefits to voucher participants are offset by losses to non-participants. There are
multiple channels that can explain the voucher effect. We find some suggestive evidence that the voucher
created economic incentives which were more salient to students who applied to vocational schools.
Students may have responded to these incentives to stay in school. Another important channel of impact in
this population may be from private schools greater nimbleness in adapting to labor market needs.

28
REFERENCES
Angrist, Joshua, Eric Bettinger, and Michael Kremer (2006), "Long-Term Educational Consequences of Secondary School Vouchers: Evidence from Administrative Records in Colombia," American Economic Review 96(3): 847-862.
Angrist, Joshua, Eric Bettinger, Erik Bloom, Michael Kremer, and Elizabeth King (2002) “The Effects of School Vouchers on Students: Evidence from Colombia,” American Economic Review 92(5): 1535-1558.
Bloom, Erik, Indu Bushhan, David Clingingsmith, Rathavuth Hong, Elizabeth King, Michael Kremer, Benjamin Loevinsohn, and Schwartz (2006) "Contracting for Health: Evidence from Cambodia." Harvard University Mimeo. Calderón, Alberto (1996): “Voucher Program for Secondary Schools: The Colombian Experience”. World Bank, Human Capital Development Working Papers # 66. Cárdenas, Mauricio and Raquel Bernal. (1999) "Wage Inequality and Structural Reform: Evidence from Colombia" Northwestern University. Mimeo. Cullen, J. B., Jacob, B. A. , and S. D. Levitt (2005). “the impact of schooll choice on student outcomes: an analysis of the chicago Public Schools.” Journal of Public Economics (89): 729-60. Gallego, Francisco A. (2006) "Voucher School Competition, Incentives, and Outcomes: Evidence from Chile." MIT Mimeo. Hsieh, Chang-Tai and Miguel Urquiola (2006). “The Effects of Generalized School Choice on Achievement and Stratification: Evidence from Chile's Voucher Program," Journal of Public Economics 90:8-9(1477-1503). Howell, William G. and Paul E. Peterson (2002), The Education Gap: Vouchers and Urban Schools, Washington, DC: The Brookings Institution. Kemple, J. J. (2004). Career Academies: Impacts on labor market outcomes and educational attainment. New York: Manpower Demonstration Research Corporation. Kemple, J. J. and J. C. Snipes (2000) Career Academies: Impacts on students’ engagement and performance in high school. New York: Manpower Demonstration Research Corporation. Kemple, J. J. and J. C. Snipes (1996) Career Academies: Early implementation lessons from a 10-site evaluation. New York: Manpower Demonstration Research Corporation.
King E., Rawlings L., Gutierrez M., Pardo C., Torres C. (1997). “Colombia’s Targeted Education Voucher Program: Features, Coverage, and Participation”. Working paper series on Impact Evaluation of Education Reforms, Paper No. 3, Development Economics Research Group, World Bank. Kling, Jeffrey, Jeffrey Leibman, and Lawrence Katz (2006) "Experimental Analysis of Neighborhood Effects." Forthcoming in Econometrica.

29
Krueger, Alan and Pei Zhu, “Another Look at the New York City School Voucher Experiment,” NBER Working Paper 9418, January 2003. Maxwell, Nan, and Victor Rubin. 2000. High School Career Academies: A Pathway to Educational Reform in Urban School Districts? Kalamazoo, MI: W. E. Upjohn Institute for Employment Research. O'Brien, P. C. (1984): “Procedures for Comparing Samples with Multiple Endpoints,” Biometrics, 40, 1079-1087. Rouse, Cecilia Elena, “Private School Vouchers and Student Achievement: An Evaluation of the Milwaukee Parental Choice Program,” Quarterly Journal of Economics, 13(2), 1998, 553-602. Stern, David, Charles Dayton, and Marilyn Raby. 2000. Career Academies: Building Blocks for Reconstructing American High Schools. Berkeley: University of California, Graduate School of Education. The World Bank. Staff appraisal report: Colombia, Secondary education project, Human Resources Operations Division, Latin America and the Caribbean Region, Report No. 11834-CO, November 19, 1993.
30
Table 1. Attendance Patterns of Lottery Applicants
Survey data are from Angrist et al. (2002). Sample includes 1176 voucher applicants from Bogotá in 1995.
School Applied To
Vocational Non-Vocational
School Attended Three Years after Voucher Lottery Winner Loser Winner Loser
Vocational .596
.426 .037 .063
Non-Vocational .269
.426 .800 .752
Dropout .135 .147 .159 .179

31
Table 2. Summary Statistics by Type of School Applied to
Vocational School Applicants
Non-Vocational School Applicants
(1) Mean
(2) Difference by Voucher Status
(3) Mean
(4) Difference by Voucher Status
(5) Difference Between Vocational and Non-Vocational Schools
Age 14.96 (1.299)
.155 (.154)
15.01 (1.361)
.027 (.092)
.052 (.092)
Male .497 -.051 (.060) .505 -.012
(.034) .008 (.034)
Mother's Schooling 5.22 (2.58)
.303 (.322)
5.935 (2.882)
-.048 (.203)
.713** (.200)
Father's Schooling 4.75 (2.90)
-.089 (.394)
5.429 (3.202)
.583** (.243)
.678** (.242)
Living in Poorest Neighborhood
.197 -.003 (.048) .1295 -.006
(.023) -.068** (.024)
Living in Next Poorest Neighborhood
.535 -.050 (.060) .5746 .026
(.034) .039 (.034)
Mean ICFES at Schools Applied to
45.8 (2.5)
.266 (.301)
46.38 (3.162)
-.375 (.230)
.610** (.209)
Data are from the household surveys. Standard deviations are in parentheses in columns one and three. Standard errors are in parentheses in the other columns reporting differences.

32
Table 3. Effect of Voucher on Likelihood of Remaining in the Same Type of Schooling
Coefficient on Voucher Status
Applicants to Vocational School Applicants to Non-Vocational School
Loser's Mean
Without Covariates
With Covariates
Loser's Mean
Without Covariates
With Covariates
.426 0.171** 0.176** .0631 -0.025* -0.029* Attending Vocational School (.497) (0.059) (0.059) (.243) (0.014) (0.015)
.898 0.025 0.024 .898 0.053** 0.049** Attending Private School in 6th Grade (.303) (0.034) (0.034) (.304) (0.018) (0.018)
.695 0.134** 0.132** .683 0.177** 0.179** Attending Private School in 7th Grade (.462) (0.051) (0.052) (.466) (0.028) (0.028)
.531 0.178** 0.171** .539 0.153** 0.151** Attending Private School at the Time of the Survey (.501) (0.058) (0.059) (.499) (0.033) (0.032)
.426 0.171** 0.176** .757 0.040 0.035 Staying in the Same Type of School (.497) (0.059) (0.059) (.430) (0.028) (0.027) Robust standard errors are in parentheses. Covariates include age, gender, access to phone for interview, the time of the survey, and controls for the students' neighborhood.

33
Table 4. Characteristics of School of Attendance and Voucher Status Vocational Non-Vocational
(1) Losers' Mean
(2) Coefficient on Voucher Status Without Covariates
(3) Coefficient on Voucher Status With Covariates
(4) Average Effect Size
(5) Losers' Mean
(6) Coefficient on Voucher Status Without Covariates
(7) Coefficient on Voucher Status With Covariates
A. Academic Indicators of Peer Quality Student College Entrance & Graduation Behavior (8 measures)
Mean ICFES Score 46.50 (3.19) [94]
-.152 (.423) [220]
-.186 (.455) [215]
47.21 (3.47) [317]
.005 (.287) [645]
-.117 (.297) [632]
Proportion of Entering Class who later take the ICFES
.759 (.423) [50]
-.043 (.075) [126]
-.070 (.085) [125]
.905 (.879) [172]
.130 (.097) [353]
.142 (.102) [345]
Ratio of Students Taking the ICFES and the Size of Senior Class
1.060 (.015) [88]
.011 (.020) [198]
.023 (.019) [194]
1.05 (.59) [247]
-.034 (.038) [493]
-.040 (.042) [482]
Proportion of Students Enrolling in College
.314 (.316) [85]
-.074* (.042) [189]
-.090** (.045) [185]
-.167* (.094)
.352 (.312) [231]
.046 (.029) [457]
-.028 (.030) [488]
Student Dropout Behavior (3 measures) Percentage of Students Who Dropped Out
.034 (.034) [89]
.012* (.006) [202]
.008 (.007) [198]
.119 (.227)
.028 (.034) [254]
-.003 (.003) [502]
-.003 (.003) [491]
B. Other Indicators of Peer Quality Existence of Remedial or Vocational Programs (6 measures)
Has Job Training Program
.152 (.360) [178]
.089** (.042) [402]
.093** (.045) [394]
.216 (.412) [504]
.030 (.030) [498]
.032 (.031) [974]
Has Tutoring for Disadvantaged Students
.281 (.045) [178]
.072 (.056) [402]
.065 (.057) [394]
.267** (.116)
.349 (.477) [504]
.063* (.037) [996]
.074** (.037) [974]
Fees (2 measures)
Fees 40752.6 (47212.4) [174]
-8778.2 (5959.8) [243]
-9497.9 (6151.0) [241]
-.387** (.176)
63318.4 (62572.9) [482]
-2136.1 (4384.0) [774]
-5361.6 (4874.1) [752]
Standard deviations appear in columns 1 and 5. Robust standard errors appear in the other columns. The number of observations is in brackets. The first two outcomes are from administrative records from ICFES and SABER. The other outcomes are from a survey conducted in January 2006 of schools in our sample. Covariates are from survey data from Angrist et al (2002) and include age, gender, access to phone, the time of the survey, and controls for the students' neighborhood. Sample sizes are listed in square brackets and in the last four rows reflect multiple measures per student. Standard errors are clustered at the student level in these regressions. For the Average Effect Sizes, outcomes are standardized so that they are monotonic in school quality. Effect sizes are standardized within outcomes. Effects are measured in a model with covariates including age, gender, access to phone, the time of the survey, and controls for the students' neighborhood. Standard errors take into account correlation within measures.

34
Table 5. Effects of Voucher on College Entrance Exam Outcomes
Vocational Non-vocational Dependent Variable
(1) Losers' Means
(2) Regression-Adjusted Voucher Diff
(3) Losers' Means
(4) Regression-Adjusted Voucher Diff
A. Probability of Taking ICFES ID Match .255
(.436) .061* (.030) .288
(.453) .059** (.018)
ID & City Match .252 (.435)
.049* (.030) .273
(.445) .058** (.017)
ID & Name Match .188 (.392)
.054* (.028) .212
(.409) .034** (.016)
N 361 810 1200 2612 B. Performance Outcomes on the ICFES Math Score cond'l on taking 41.46
(4.87)
.766 (.637) [257]
42.39 (4.762)
.309 (.356) [875]
Reading Score cond'l on taking
45.71 (5.95)
2.06** (.780) 47.19
(5.450) .343 (.396)
Math Score (Upper Bound Estimate) -- 2.517**
(.616) -- 1.527** (.330)
Reading Score (Upper Bound Estimate) -- 4.364**
(.738) -- 1.695** (.3648)
N 87 256 319 874 Robust standard errors appear in parentheses in columns 2 and 4. Standard deviations appear in columns 1 and 3. In the regression results reported in columns 2 and 4, we include covariates for age, gender, and access to phone. Upper bounds are computed using method described in Angrist, Bettinger, and Kremer (2006).

35
Table 6. Voucher Effects by Type of School Applied to
Coefficient on Voucher Status Dependent Variable
Vocational Non-vocational (1)
Losers' Means(2) Basic Controls (3)
Losers' Means (4) Basic Controls
Started 6th Grade in Private .898 .024 (.034) .898 .049**
(.018) Started 7th Grade in Private .695 .132**
(.052) .683 .179** (.028)
Currently in Private .531 .171** (.059) .539 .151**
(.032) School Years Finished 7.51
(.936) .139 (.099) 7.53 .092
(.058) Currently in School .853 -.011
(.041) .820 .006 (.023)
Finished 6th Grade .946 .032 (.023) .941 .016
(.013) Finished 7th Grade .861 .045
(.039) .854 .018 (.022)
Finished 8th Grade .643 .094* (.056) .655 .087**
(.031) Ever Repeated a Grade .248 -.063
(.052) .207 -.053** (.026)
Number of Repetitions of 6th Grade .242 -.063 (.052) .171 -.053**
(.026) Applicant is Working .225 -.047
(.047) .176 -.029 (.024)
Total Hours Worked 6.65 (15.72)
-2.42 (1.65) 5.36
(14.46) -.856 (.903)
N 129 283 444 858
Standard errors appear in parentheses in columns 2 and 4. Standard deviations appear in the other columns.

36
Table 7. Characteristics of Public and Private Vocational Schools
Vocational Schools Private Public Private-Public Total Number of Schools 316 266 Share Industrial 0.038 0.248 -0.210*** (0.029) Share Commercial 0.924 0.624 0.300*** (0.033) Total Enrollment 62,871 79,367 Share of Enrollment in Industrial Schools 0.092 0.318 -0.226*** (0.002) Share of Enrollment in Commercial Schools 0.853 0.482 0.371*** (0.002) Probability School Has Specialized Industrial Teacher 0.038 0.365 -0.327*** (0.063) Probability School Has Specialized Commercial Teacher 0.794 0.683 0.111 (0.069) Dropout Rate - 10th Grade 0.030 0.072 -0.042*** (0.011) Dropout Rate - 11th Grade 0.022 0.092 -0.070 (0.014)
Notes: Data based on C-600 1998 School Census. Shares don't add up to one because the other vocational categories (Agricultural, Pedagogic and Social Promotion) have been omitted. The coefficient in parentheses in the last column is the standard error of the difference between private and public. Standard errors appear in parentheses in the final column.