progress and opportunity in district of columbia … · of students in district of columbia public...
TRANSCRIPT
LOOKING BACK TO MOVE FORWARD
Drew Atchison, Ed.D.Laura B. Stein, M.A.
Progress and Opportunity in District of Columbia Public Schools
September 2017
ACKNOWLEDGMENTSThe authors would like to thank District of Columbia Public Schools (DCPS) staff, namely Colin Taylor, Kimberly Hanauer, Brandee Tate, Patrick Spring, and Michelle Lerner, for providing AIR with context on DCPS, timely access to the data analyzed herein, and thoughtful feedback on the content of the brief. We’d also like to thank our AIR colleagues who reviewed our analyses and provided feedback on the content, along with Susan Armstrong who provided her creative services to design
1LOOKING BACK TO MOVE FORWARD: Progress and Opportunity in District of Columbia Public Schools
FOREWORD At the close of School Year 2010−11, less than 50% of students in District of Columbia Public Schools (DCPS) were performing at “proficient” or better levels in reading or mathematics, and only half of students were graduating high school within four years. Students in DCPS’ lowest-performing schools were faring even worse; on average, less than a quarter of students in these schools were performing at the “proficient” level or better. Despite concerted and often controversial efforts to spur rapid improvement under then-Chancellor Michelle Rhee, DCPS was still not adequately serving the majority of its students.
FIVE GOALS LAID OUT IN A CAPITAL COMMITMENT:
1. IMPROVE ACHIEVEMENT RATES. At least 70% of students proficient in reading and mathematics, and double the number of advanced students.
2. INVEST IN STRUGGLING SCHOOLS. Increase proficiency rates by 40 percentage points in 40 lowest-performing schools.
3. INCREASE GRADUATION RATES. At least 75% of entering ninth-graders graduate from high school in four years.
4. IMPROVE SATISFACTION. At least 90% of students say they like their school.
5. INCREASE ENROLLMENT. At least 47,000 students enrolled in DCPS.
In fall of 2010, Chancellor Rhee resigned, and DC’s recently elected mayor, Vincent Gray, appointed Kaya Henderson as the new chancellor of DCPS. Under the leadership of Chancellor Henderson, DCPS launched a five-year plan, entitled A Capital Commitment, to strategically address the dire circumstances facing DCPS students. In many ways, DCPS has made considerable progress toward the goals laid out five years ago:
� Proficiency rates in English language arts (ELA) and mathematics have increased for nearly all student subgroups at all school levels, and many of the lowest-performing schools have shown improvements in test scores.
� Graduation rates have risen substantially overall and for all racial subgroups in both selective and comprehensive high schools.
� Enrollment has grown from approximately 45,000 students to more than 48,000 students.
� Student satisfaction, especially among Hispanic and Black students, has increased substantially.
And yet, the overall purpose of Chancellor Henderson’s five-year plan—“to ensure every DCPS school provides a world-class education that prepares ALL of our students, regardless of background or circumstance, for success in college, career, and life”i—has not yet been fully realized. Black and Hispanic students still lag far behind their White peers in terms of ELA and mathematics proficiency, high school graduation, and college enrollment. And many of DCPS’ historically low-performing schools, located in wards that predominantly serve Black and at-risk students, remain the lowest-performing. DCPS has no doubt made steady and significant progress toward achieving the goals laid out five years ago, but focused efforts to improve the learning experience for DCPS’ underserved student populations must be paramount moving forward.
OVERVIEWAs DCPS launches a new strategic plan that will guide the District’s work over the next five years, the timing is appropriate to reflect on progress over the last five years. This brief summarizes many of DCPS’ accomplishments and highlights areas where improvement is still needed to meet DCPS’ overarching goal of “providing every student with a safe, academically challenging and inspiring learning experience.” In particular, the brief examines each goal and focuses on (a) whether DCPS met the goal set out in A Capital Commitment, and (b) the extent to which progress toward each goal was experienced by certain subgroups of students.
2 LOOKING BACK TO MOVE FORWARD: Progress and Opportunity in District of Columbia Public Schools
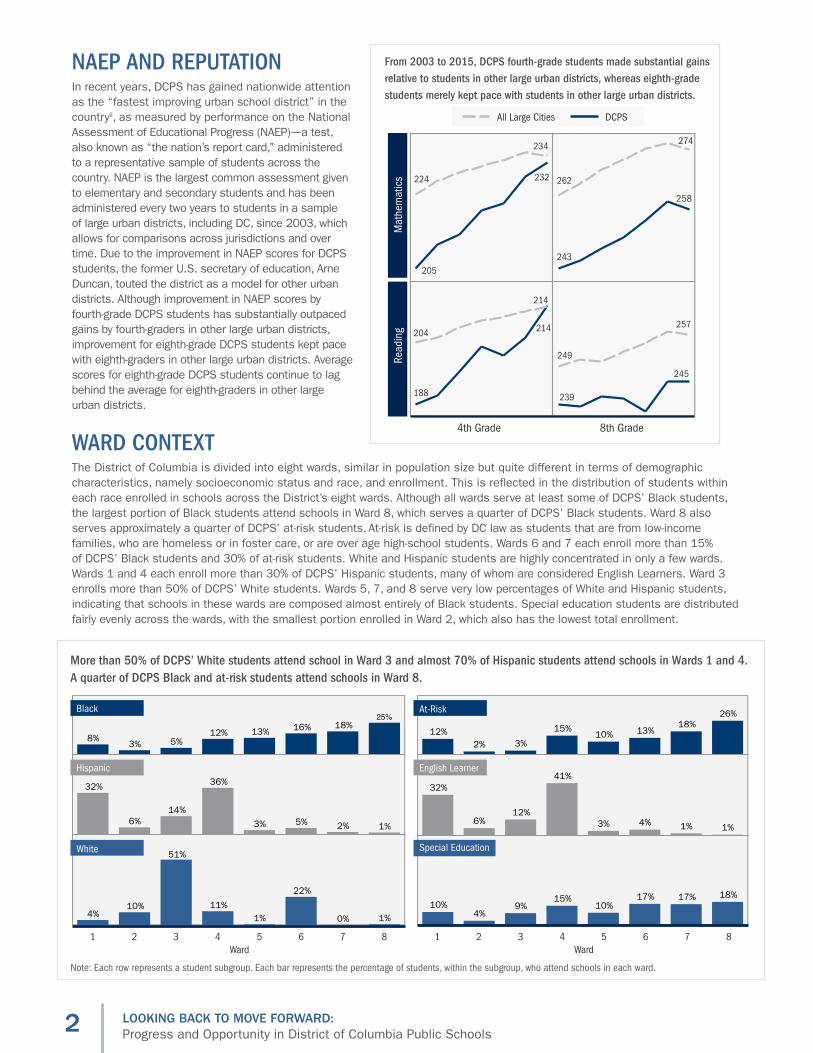
NAEP AND REPUTATIONIn recent years, DCPS has gained nationwide attention as the “fastest improving urban school district” in the countryii, as measured by performance on the National Assessment of Educational Progress (NAEP)—a test, also known as “the nation’s report card,” administered to a representative sample of students across the country. NAEP is the largest common assessment given to elementary and secondary students and has been administered every two years to students in a sample of large urban districts, including DC, since 2003, which allows for comparisons across jurisdictions and over time. Due to the improvement in NAEP scores for DCPS students, the former U.S. secretary of education, Arne Duncan, touted the district as a model for other urban districts. Although improvement in NAEP scores by fourth-grade DCPS students has substantially outpaced gains by fourth-graders in other large urban districts, improvement for eighth-grade DCPS students kept pace with eighth-graders in other large urban districts. Average scores for eighth-grade DCPS students continue to lag behind the average for eighth-graders in other large urban districts.
WARD CONTEXT The District of Columbia is divided into eight wards, similar in population size but quite different in terms of demographic characteristics, namely socioeconomic status and race, and enrollment. This is reflected in the distribution of students within each race enrolled in schools across the District’s eight wards. Although all wards serve at least some of DCPS’ Black students, the largest portion of Black students attend schools in Ward 8, which serves a quarter of DCPS’ Black students. Ward 8 also serves approximately a quarter of DCPS’ at-risk students. At-risk is defined by DC law as students that are from low-income families, who are homeless or in foster care, or are over age high-school students. Wards 6 and 7 each enroll more than 15% of DCPS’ Black students and 30% of at-risk students. White and Hispanic students are highly concentrated in only a few wards. Wards 1 and 4 each enroll more than 30% of DCPS’ Hispanic students, many of whom are considered English Learners. Ward 3 enrolls more than 50% of DCPS’ White students. Wards 5, 7, and 8 serve very low percentages of White and Hispanic students, indicating that schools in these wards are composed almost entirely of Black students. Special education students are distributed fairly evenly across the wards, with the smallest portion enrolled in Ward 2, which also has the lowest total enrollment.
188
205
239
243
232
245
258
204
224
249
262
214
234
257
274
4th Grade 8th Grade
All Large Cities DCPS
Mat
hem
atic
sRe
adin
g 214
From 2003 to 2015, DCPS fourth-grade students made substantial gains relative to students in other large urban districts, whereas eighth-grade students merely kept pace with students in other large urban districts.
8%
32%
4%
3%
6%
10%
5%
14%
51%
12%
36%
11%
13%
3%
1%
16%
5%
22%
18%
2%
0%
25%
1%
1%
1 2 3 4 5 6 7 8Ward
Black
Hispanic
White
More than 50% of DCPS’ White students attend school in Ward 3 and almost 70% of Hispanic students attend schools in Wards 1 and 4. A quarter of DCPS Black and at-risk students attend schools in Ward 8.
12%
32%
10%
2%
6%
4%
3%
12%
9%
15%
41%
15%
10%
3%
10%
13%
4%
17%
18%
1%
17%
26%
1%
18%
Special Education
English Learner
At-Risk
1 2 3 4 5 6 7 8Ward
Note: Each row represents a student subgroup. Each bar represents the percentage of students, within the subgroup, who attend schools in each ward.
3LOOKING BACK TO MOVE FORWARD: Progress and Opportunity in District of Columbia Public Schools
DID DCPS IMPROVE STUDENT ACHIEVEMENT?
Elementary Middle High
Mat
hem
atic
s Pr
o�ci
ency
(%)
0
20
40
60
80
100
2015 2017 2015 2017 2015 2017
Elementary Middle High
0
20
40
60
80
100
ELA
Pro�
cien
cy (%
)
2015 2017 2015 2017 2015 2017
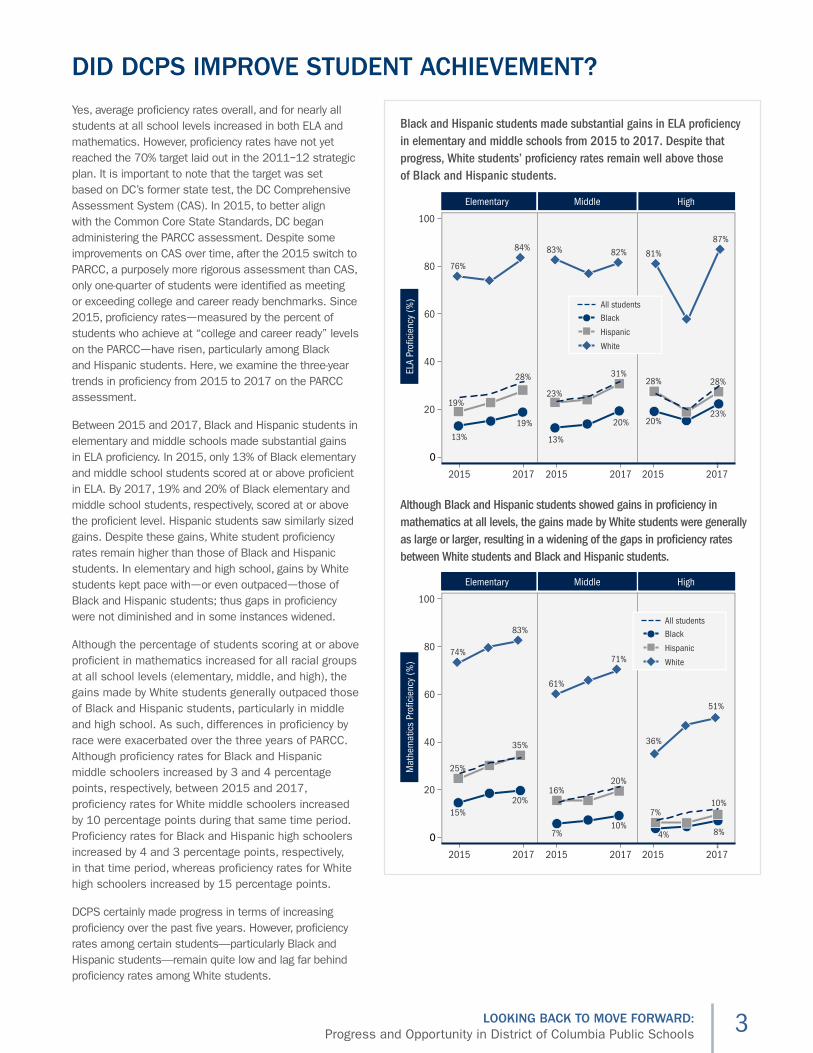
Black and Hispanic students made substantial gains in ELA pro�ciency in elementary and middle schools from 2015 to 2017. Despite that progress, White students’ pro�ciency rates remain well above those of Black and Hispanic students.
Although Black and Hispanic students showed gains in pro�ciency in mathematics at all levels, the gains made by White students were generally as large or larger, resulting in a widening of the gaps in pro�ciency rates between White students and Black and Hispanic students.
Elementary Middle High
Black
Hispanic
White
All students
Black
Hispanic
White
All students
13%
19%
19%
28%
76%
84%
13%
20%
23%
31%
83% 82%
20%23%
28% 28%
81%
87%
15%20%
25%
35%
74%
83%
7%10%
16%20%
61%
71%
8%
7%10%
36%
51%
4%
Yes, average proficiency rates overall, and for nearly all students at all school levels increased in both ELA and mathematics. However, proficiency rates have not yet reached the 70% target laid out in the 2011−12 strategic plan. It is important to note that the target was set based on DC’s former state test, the DC Comprehensive Assessment System (CAS). In 2015, to better align with the Common Core State Standards, DC began administering the PARCC assessment. Despite some improvements on CAS over time, after the 2015 switch to PARCC, a purposely more rigorous assessment than CAS, only one-quarter of students were identified as meeting or exceeding college and career ready benchmarks. Since 2015, proficiency rates—measured by the percent of students who achieve at “college and career ready” levels on the PARCC—have risen, particularly among Black and Hispanic students. Here, we examine the three-year trends in proficiency from 2015 to 2017 on the PARCC assessment.
Between 2015 and 2017, Black and Hispanic students in elementary and middle schools made substantial gains in ELA proficiency. In 2015, only 13% of Black elementary and middle school students scored at or above proficient in ELA. By 2017, 19% and 20% of Black elementary and middle school students, respectively, scored at or above the proficient level. Hispanic students saw similarly sized gains. Despite these gains, White student proficiency rates remain higher than those of Black and Hispanic students. In elementary and high school, gains by White students kept pace with—or even outpaced—those of Black and Hispanic students; thus gaps in proficiency were not diminished and in some instances widened.
Although the percentage of students scoring at or above proficient in mathematics increased for all racial groups at all school levels (elementary, middle, and high), the gains made by White students generally outpaced those of Black and Hispanic students, particularly in middle and high school. As such, differences in proficiency by race were exacerbated over the three years of PARCC. Although proficiency rates for Black and Hispanic middle schoolers increased by 3 and 4 percentage points, respectively, between 2015 and 2017, proficiency rates for White middle schoolers increased by 10 percentage points during that same time period. Proficiency rates for Black and Hispanic high schoolers increased by 4 and 3 percentage points, respectively, in that time period, whereas proficiency rates for White high schoolers increased by 15 percentage points.
DCPS certainly made progress in terms of increasing proficiency over the past five years. However, proficiency rates among certain students—particularly Black and Hispanic students—remain quite low and lag far behind proficiency rates among White students.
4 LOOKING BACK TO MOVE FORWARD: Progress and Opportunity in District of Columbia Public Schools
Belo
w Av
erag
eAb
ove
Aver
age
STAN
DARD
IZED
ELA
SCA
LE S
CORE
S
Elementary Middle High
Belo
w Av
erag
eAb
ove
Aver
age
STAN
DARD
IZED
MAT
HEM
ATIC
S SC
ALE
SCOR
ES
Elementary Middle High
2015 2016 2017 2015 2016 2017 2015 2016 2017
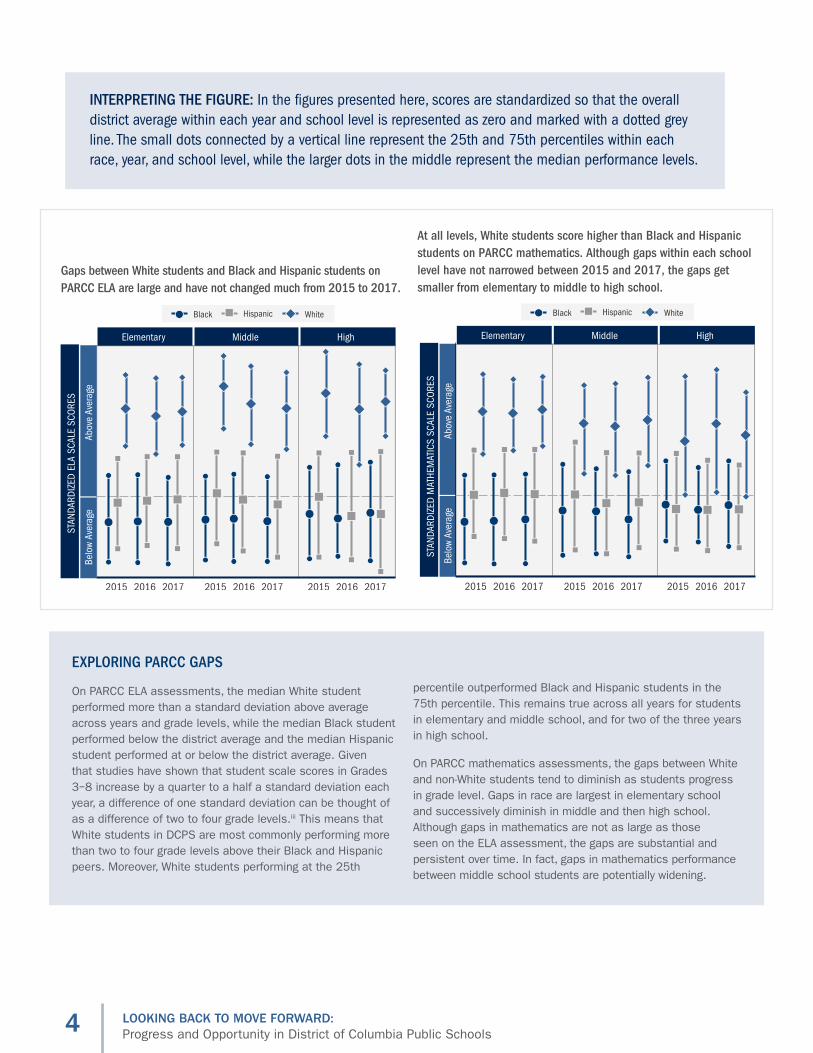
Gaps between White students and Black and Hispanic students on PARCC ELA are large and have not changed much from 2015 to 2017.
At all levels, White students score higher than Black and Hispanic students on PARCC mathematics. Although gaps within each school level have not narrowed between 2015 and 2017, the gaps get smaller from elementary to middle to high school.
Black Hispanic White
2015 2016 2017 2015 2016 2017 2015 2016 2017
Black Hispanic White
Belo
w Av
erag
eAb
ove
Aver
age
STAN
DARD
IZED
ELA
SCA
LE S
CORE
S
Elementary Middle High
Belo
w Av
erag
eAb
ove
Aver
age
STAN
DARD
IZED
MAT
HEM
ATIC
S SC
ALE
SCOR
ES
Elementary Middle High
2015 2016 2017 2015 2016 2017 2015 2016 2017
Gaps between White students and Black and Hispanic students on PARCC ELA are large and have not changed much from 2015 to 2017.
At all levels, White students score higher than Black and Hispanic students on PARCC mathematics. Although gaps within each school level have not narrowed between 2015 and 2017, the gaps get smaller from elementary to middle to high school.
Black Hispanic White
2015 2016 2017 2015 2016 2017 2015 2016 2017
Black Hispanic White
EXPLORING PARCC GAPS
On PARCC ELA assessments, the median White student performed more than a standard deviation above average across years and grade levels, while the median Black student performed below the district average and the median Hispanic student performed at or below the district average. Given that studies have shown that student scale scores in Grades 3−8 increase by a quarter to a half a standard deviation each year, a difference of one standard deviation can be thought of as a difference of two to four grade levels.iii This means that White students in DCPS are most commonly performing more than two to four grade levels above their Black and Hispanic peers. Moreover, White students performing at the 25th
percentile outperformed Black and Hispanic students in the 75th percentile. This remains true across all years for students in elementary and middle school, and for two of the three years in high school.
On PARCC mathematics assessments, the gaps between White and non-White students tend to diminish as students progress in grade level. Gaps in race are largest in elementary school and successively diminish in middle and then high school. Although gaps in mathematics are not as large as those seen on the ELA assessment, the gaps are substantial and persistent over time. In fact, gaps in mathematics performance between middle school students are potentially widening.
INTERPRETING THE FIGURE: In the figures presented here, scores are standardized so that the overall district average within each year and school level is represented as zero and marked with a dotted grey line. The small dots connected by a vertical line represent the 25th and 75th percentiles within each race, year, and school level, while the larger dots in the middle represent the median performance levels.
Belo
w Av
erag
eAb
ove
Aver
age
STAN
DARD
IZED
ELA
SCA
LE S
CORE
S
Elementary Middle High
Belo
w Av
erag
eAb
ove
Aver
age
STAN
DARD
IZED
MAT
HEM
ATIC
S SC
ALE
SCOR
ES
Elementary Middle High
2015 2016 2017 2015 2016 2017 2015 2016 2017
Gaps between White students and Black and Hispanic students on PARCC ELA are large and have not changed much from 2015 to 2017.
At all levels, White students score higher than Black and Hispanic students on PARCC mathematics. Although gaps within each school level have not narrowed between 2015 and 2017, the gaps get smaller from elementary to middle to high school.
Black Hispanic White
2015 2016 2017 2015 2016 2017 2015 2016 2017
Black Hispanic White
5LOOKING BACK TO MOVE FORWARD: Progress and Opportunity in District of Columbia Public Schools
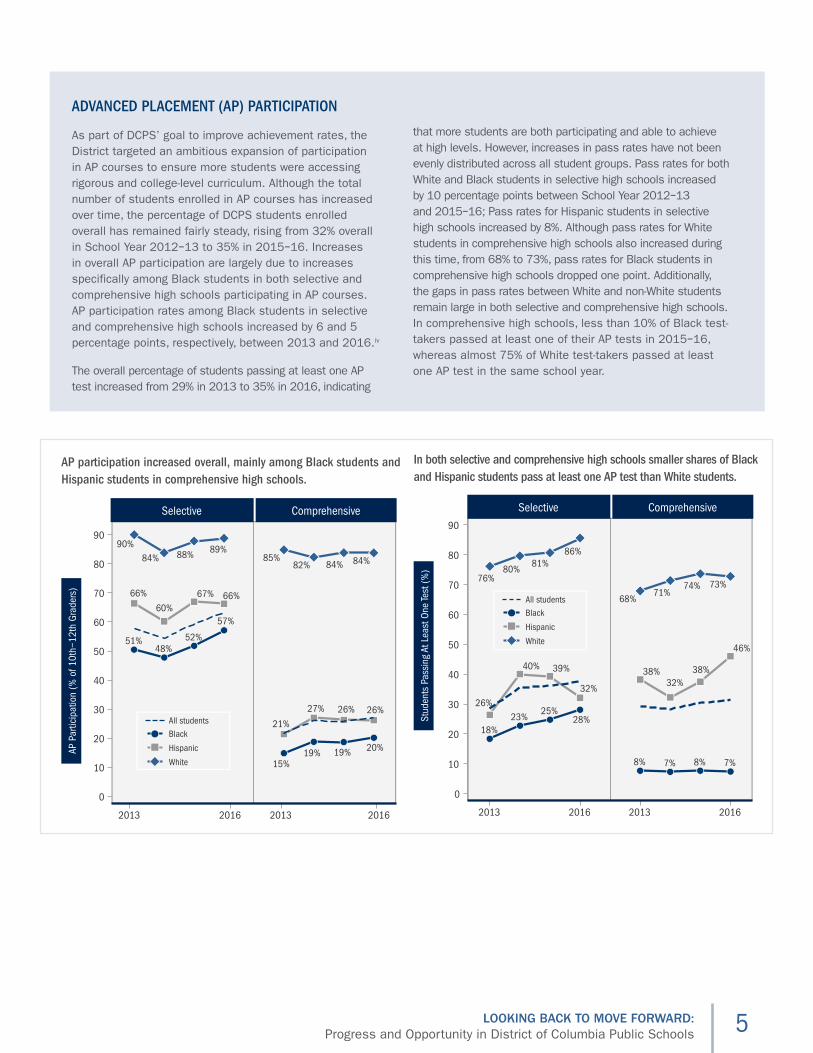
ADVANCED PLACEMENT (AP) PARTICIPATION
As part of DCPS’ goal to improve achievement rates, the District targeted an ambitious expansion of participation in AP courses to ensure more students were accessing rigorous and college-level curriculum. Although the total number of students enrolled in AP courses has increased over time, the percentage of DCPS students enrolled overall has remained fairly steady, rising from 32% overall in School Year 2012−13 to 35% in 2015−16. Increases in overall AP participation are largely due to increases specifically among Black students in both selective and comprehensive high schools participating in AP courses. AP participation rates among Black students in selective and comprehensive high schools increased by 6 and 5 percentage points, respectively, between 2013 and 2016.iv
The overall percentage of students passing at least one AP test increased from 29% in 2013 to 35% in 2016, indicating
that more students are both participating and able to achieve at high levels. However, increases in pass rates have not been evenly distributed across all student groups. Pass rates for both White and Black students in selective high schools increased by 10 percentage points between School Year 2012−13 and 2015−16; Pass rates for Hispanic students in selective high schools increased by 8%. Although pass rates for White students in comprehensive high schools also increased during this time, from 68% to 73%, pass rates for Black students in comprehensive high schools dropped one point. Additionally, the gaps in pass rates between White and non-White students remain large in both selective and comprehensive high schools. In comprehensive high schools, less than 10% of Black test-takers passed at least one of their AP tests in 2015−16, whereas almost 75% of White test-takers passed at least one AP test in the same school year.
AP participation increased overall, mainly among Black students and Hispanic students in comprehensive high schools.
In both selective and comprehensive high schools smaller shares of Black and Hispanic students pass at least one AP test than White students.
2013 2016 2013 2016
Selective Comprehensive
AP P
artic
ipat
ion
(% o
f 10t
h−12
th G
rade
rs)
26%
40% 39%
32%
18%23%
25%28%
76%80%
81%86%
38%32%
38%
46%
8% 7% 8% 7%
68%71%
74% 73%
0
10
20
30
40
50
60
70
80
90
2013 2016 2013 2016
Selective Comprehensive
Black
Hispanic
White
All students
Stud
ents
Pas
sing
At L
east
One
Test
(%)
Black
Hispanic
White
All students
66%
60%67% 66%
51%48%
52%
57%
90%84% 88% 89%
21%
27% 26% 26%
15%19% 19% 20%
85%82% 84% 84%
0
10
20
30
40
50
60
70
80
90
6 LOOKING BACK TO MOVE FORWARD: Progress and Opportunity in District of Columbia Public Schools
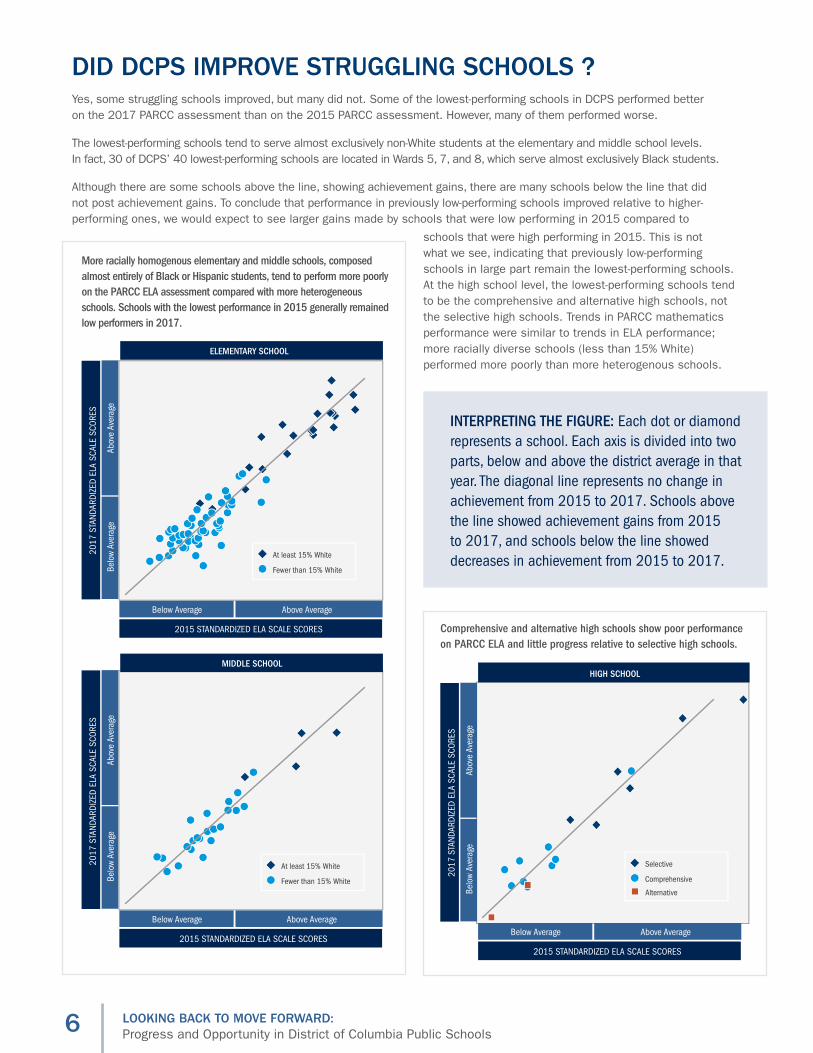
DID DCPS IMPROVE STRUGGLING SCHOOLS ? Yes, some struggling schools improved, but many did not. Some of the lowest-performing schools in DCPS performed better on the 2017 PARCC assessment than on the 2015 PARCC assessment. However, many of them performed worse.
The lowest-performing schools tend to serve almost exclusively non-White students at the elementary and middle school levels. In fact, 30 of DCPS’ 40 lowest-performing schools are located in Wards 5, 7, and 8, which serve almost exclusively Black students.
Although there are some schools above the line, showing achievement gains, there are many schools below the line that did not post achievement gains. To conclude that performance in previously low-performing schools improved relative to higher-performing ones, we would expect to see larger gains made by schools that were low performing in 2015 compared to
Belo
w Av
erag
eAb
ove
Aver
age
2017
STA
NDAR
DIZE
D EL
A SC
ALE
SCOR
ES
Below Average Above Average
2015 STANDARDIZED ELA SCALE SCORES
Selective
Comprehensive
AlternativeBelo
w Av
erag
eAb
ove
Aver
age
2017
STA
NDAR
DIZE
D EL
A SC
ALE
SCOR
ES
Below Average Above Average
2015 STANDARDIZED ELA SCALE SCORES
At least 15% White
Fewer than 15% White
HIGH SCHOOL
More racially homogenous elementary and middle schools, composed almost entirely of Black or Hispanic students, tend to perform more poorly on the PARCC ELA assessment compared with more heterogeneous schools. Schools with the lowest performance in 2015 generally remained low performers in 2017.
Comprehensive and alternative high schools show poor performance on PARCC ELA and little progress relative to selective high schools.
Belo
w Av
erag
eAb
ove
Aver
age
2017
STA
NDAR
DIZE
D EL
A SC
ALE
SCOR
ES
Below Average Above Average
2015 STANDARDIZED ELA SCALE SCORES
At least 15% White
Fewer than 15% White
MIDDLE SCHOOL
ELEMENTARY SCHOOL
INTERPRETING THE FIGURE: Each dot or diamond represents a school. Each axis is divided into two parts, below and above the district average in that year. The diagonal line represents no change in achievement from 2015 to 2017. Schools above the line showed achievement gains from 2015 to 2017, and schools below the line showed decreases in achievement from 2015 to 2017.
Belo
w Av
erag
eAb
ove
Aver
age
2017
STA
NDAR
DIZE
D EL
A SC
ALE
SCOR
ES
Below Average Above Average
2015 STANDARDIZED ELA SCALE SCORES
Selective
Comprehensive
AlternativeBelo
w Av
erag
eAb
ove
Aver
age
2017
STA
NDAR
DIZE
D EL
A SC
ALE
SCOR
ES
Below Average Above Average
2015 STANDARDIZED ELA SCALE SCORES
At least 15% White
Fewer than 15% White
HIGH SCHOOL
More racially homogenous elementary and middle schools, composed almost entirely of Black or Hispanic students, tend to perform more poorly on the PARCC ELA assessment compared with more heterogeneous schools. Schools with the lowest performance in 2015 generally remained low performers in 2017.
Comprehensive and alternative high schools show poor performance on PARCC ELA and little progress relative to selective high schools.
Belo
w Av
erag
eAb
ove
Aver
age
2017
STA
NDAR
DIZE
D EL
A SC
ALE
SCOR
ES
Below Average Above Average
2015 STANDARDIZED ELA SCALE SCORES
At least 15% White
Fewer than 15% White
MIDDLE SCHOOL
ELEMENTARY SCHOOLschools that were high performing in 2015. This is not what we see, indicating that previously low-performing schools in large part remain the lowest-performing schools. At the high school level, the lowest-performing schools tend to be the comprehensive and alternative high schools, not the selective high schools. Trends in PARCC mathematics performance were similar to trends in ELA performance; more racially diverse schools (less than 15% White) performed more poorly than more heterogenous schools.
7LOOKING BACK TO MOVE FORWARD: Progress and Opportunity in District of Columbia Public Schools
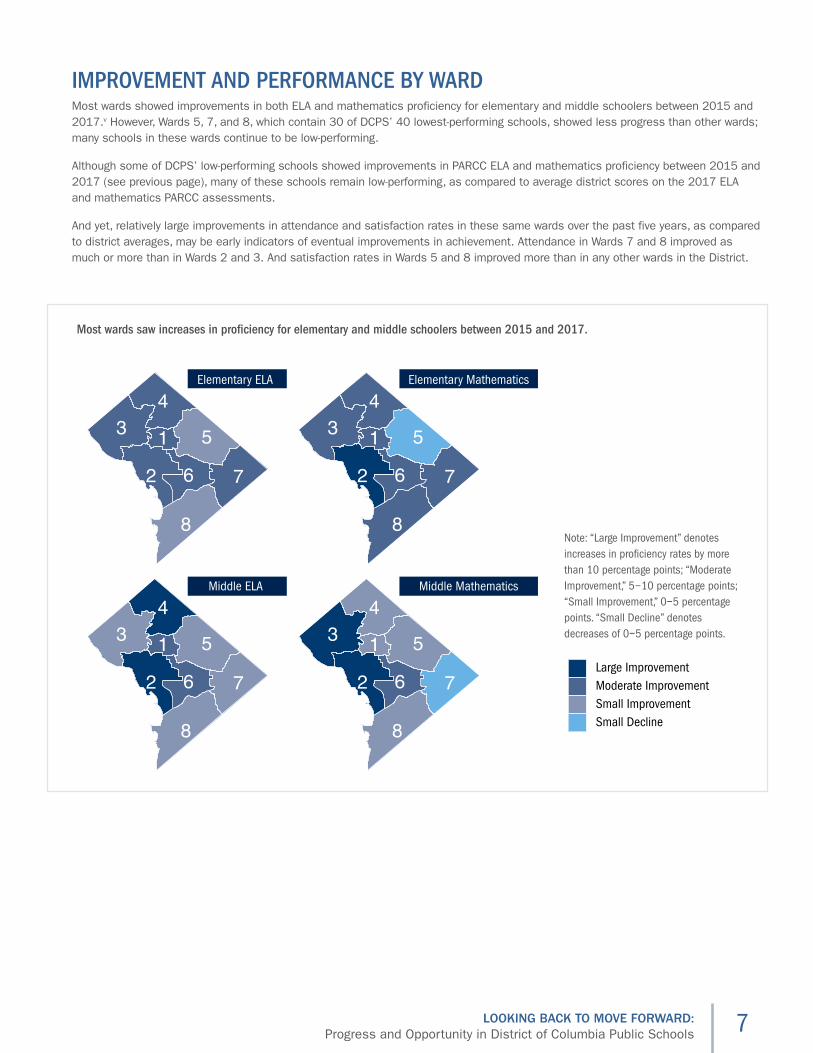
IMPROVEMENT AND PERFORMANCE BY WARD Most wards showed improvements in both ELA and mathematics proficiency for elementary and middle schoolers between 2015 and 2017.v However, Wards 5, 7, and 8, which contain 30 of DCPS’ 40 lowest-performing schools, showed less progress than other wards; many schools in these wards continue to be low-performing.
Although some of DCPS’ low-performing schools showed improvements in PARCC ELA and mathematics proficiency between 2015 and 2017 (see previous page), many of these schools remain low-performing, as compared to average district scores on the 2017 ELA and mathematics PARCC assessments.
And yet, relatively large improvements in attendance and satisfaction rates in these same wards over the past five years, as compared to district averages, may be early indicators of eventual improvements in achievement. Attendance in Wards 7 and 8 improved as much or more than in Wards 2 and 3. And satisfaction rates in Wards 5 and 8 improved more than in any other wards in the District.
8
88
8
66
6 6
7 7
7 7
2
2 2
2
11
1 1
5
5 5
5
3 3
33
4
4
4
4
Middle ELA Middle Mathematics
Large ImprovementModerate ImprovementSmall ImprovementSmall Decline
Most wards saw increases in pro�ciency for elementary and middle schoolers between 2015 and 2017.
Elementary ELA Elementary Mathematics
Note: “Large Improvement” denotes increases in proficiency rates by more than 10 percentage points; “Moderate Improvement,” 5–10 percentage points; “Small Improvement,” 0−5 percentage points. “Small Decline” denotes decreases of 0−5 percentage points.
8 LOOKING BACK TO MOVE FORWARD: Progress and Opportunity in District of Columbia Public Schools
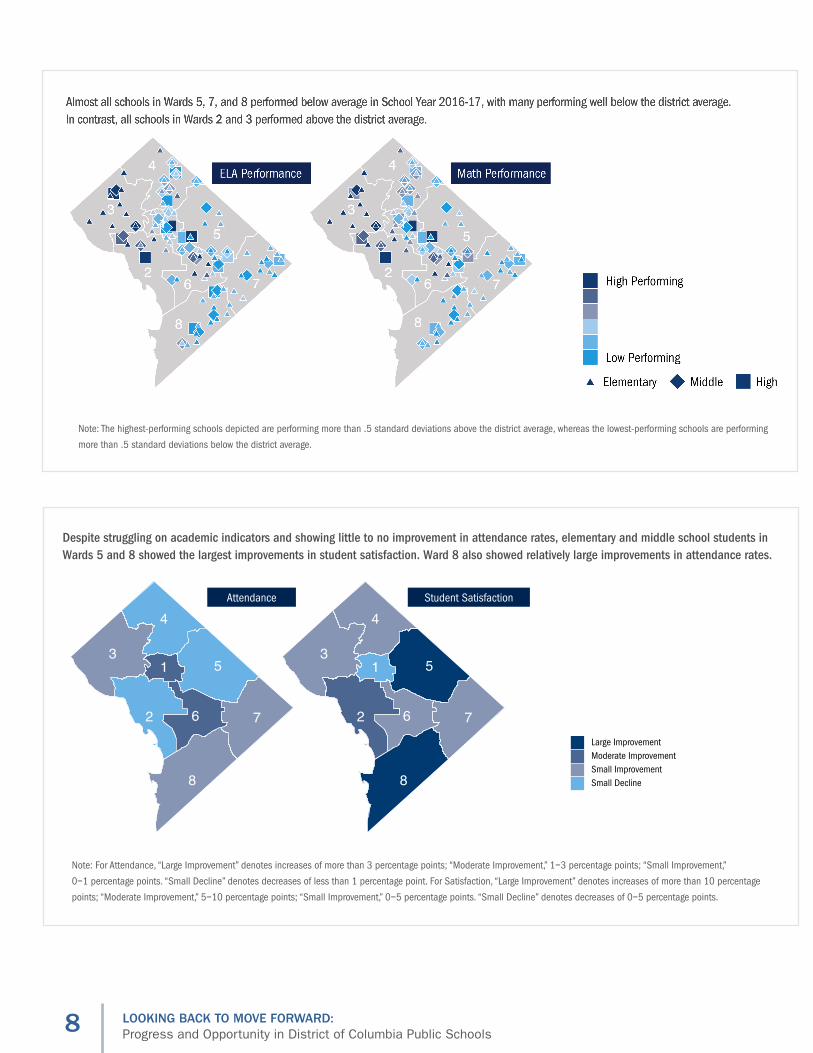
Note: The highest-performing schools depicted are performing more than .5 standard deviations above the district average, whereas the lowest-performing schools are performing
more than .5 standard deviations below the district average.
8 8
6 67 72 2
11 5 533
4 4
Student SatisfactionAttendance
Large ImprovementModerate ImprovementSmall ImprovementSmall Decline
Despite struggling on academic indicators and showing little to no improvement in attendance rates, elementary and middle school students in Wards 5 and 8 showed the largest improvements in student satisfaction. Ward 8 also showed relatively large improvements in attendance rates.
Note: For Attendance, “Large Improvement” denotes increases of more than 3 percentage points; “Moderate Improvement,” 1−3 percentage points; “Small Improvement,”
0−1 percentage points. “Small Decline” denotes decreases of less than 1 percentage point. For Satisfaction, “Large Improvement” denotes increases of more than 10 percentage
points; “Moderate Improvement,” 5−10 percentage points; “Small Improvement,” 0−5 percentage points. “Small Decline” denotes decreases of 0−5 percentage points.
9LOOKING BACK TO MOVE FORWARD: Progress and Opportunity in District of Columbia Public Schools
DID DCPS INCREASE HIGH SCHOOL GRADUATION RATES?
20
40
60
80
100
2013 2017 2013 2017
Selective Comprehensive
20
40
60
80
100
2013 2017 2013 2017
Four
Year
Gra
duat
ion
Rate
(%)
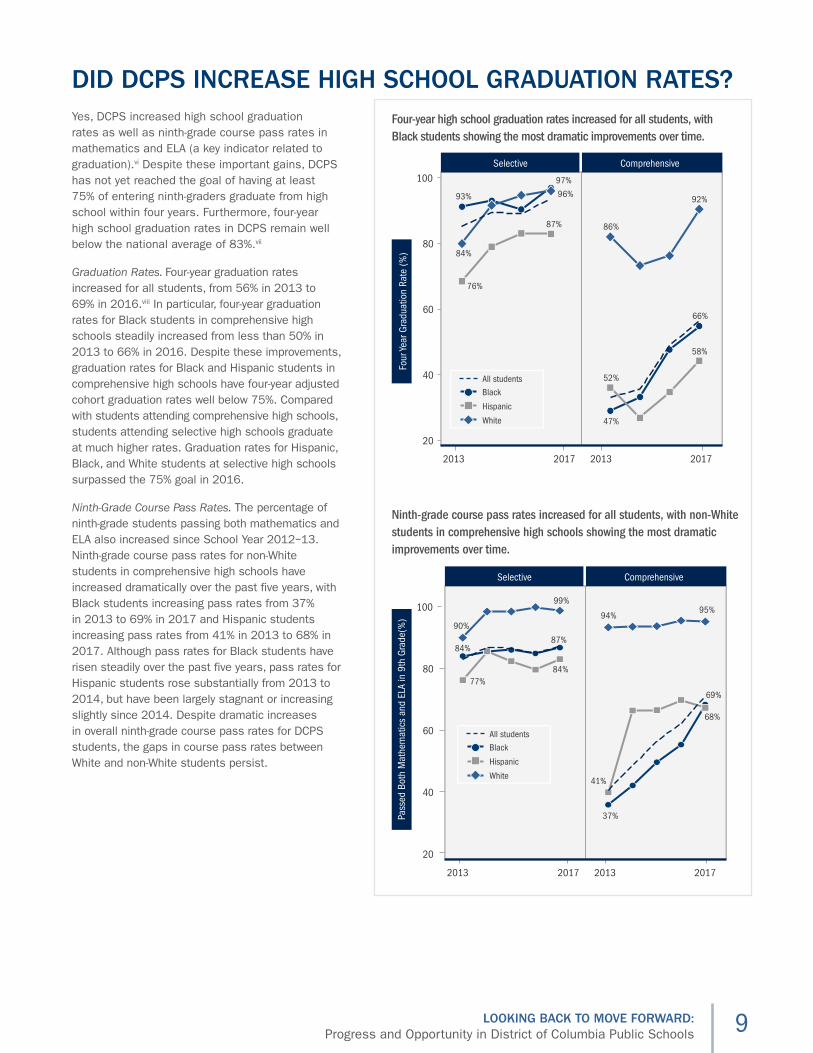
Ninth-grade course pass rates increased for all students, with non-White students in comprehensive high schools showing the most dramatic improvements over time.
Four-year high school graduation rates increased for all students, with Black students showing the most dramatic improvements over time.
Selective Comprehensive
Pass
ed B
oth
Mat
hem
atic
s an
d EL
A in
9th
Gra
de(%
)
Black
Hispanic
White
All students
Black
Hispanic
White
All students
93%
97%
76%
87%
84%
96%
47%
66%
52%
58%
86%
92%
84%87%
77%84%
90%
99%
37%
69%
41%
68%
94%95%
Yes, DCPS increased high school graduation rates as well as ninth-grade course pass rates in mathematics and ELA (a key indicator related to graduation).vi Despite these important gains, DCPS has not yet reached the goal of having at least 75% of entering ninth-graders graduate from high school within four years. Furthermore, four-year high school graduation rates in DCPS remain well below the national average of 83%.vii
Graduation Rates. Four-year graduation rates increased for all students, from 56% in 2013 to 69% in 2016.viii In particular, four-year graduation rates for Black students in comprehensive high schools steadily increased from less than 50% in 2013 to 66% in 2016. Despite these improvements, graduation rates for Black and Hispanic students in comprehensive high schools have four-year adjusted cohort graduation rates well below 75%. Compared with students attending comprehensive high schools, students attending selective high schools graduate at much higher rates. Graduation rates for Hispanic, Black, and White students at selective high schools surpassed the 75% goal in 2016.
Ninth-Grade Course Pass Rates. The percentage of ninth-grade students passing both mathematics and ELA also increased since School Year 2012−13. Ninth-grade course pass rates for non-White students in comprehensive high schools have increased dramatically over the past five years, with Black students increasing pass rates from 37% in 2013 to 69% in 2017 and Hispanic students increasing pass rates from 41% in 2013 to 68% in 2017. Although pass rates for Black students have risen steadily over the past five years, pass rates for Hispanic students rose substantially from 2013 to 2014, but have been largely stagnant or increasing slightly since 2014. Despite dramatic increases in overall ninth-grade course pass rates for DCPS students, the gaps in course pass rates between White and non-White students persist.
20
40
60
80
100
2013 2017 2013 2017
Selective Comprehensive
20
40
60
80
100
2013 2017 2013 2017
Four
Year
Gra
duat
ion
Rate
(%)
Ninth-grade course pass rates increased for all students, with non-White students in comprehensive high schools showing the most dramatic improvements over time.
Four-year high school graduation rates increased for all students, with Black students showing the most dramatic improvements over time.
Selective Comprehensive
Pass
ed B
oth
Mat
hem
atic
s an
d EL
A in
9th
Gra
de(%
)
Black
Hispanic
White
All students
Black
Hispanic
White
All students
93%
97%
76%
87%
84%
96%
47%
66%
52%
58%
86%
92%
84%87%
77%84%
90%
99%
37%
69%
41%
68%
94%95%
10 LOOKING BACK TO MOVE FORWARD: Progress and Opportunity in District of Columbia Public Schools
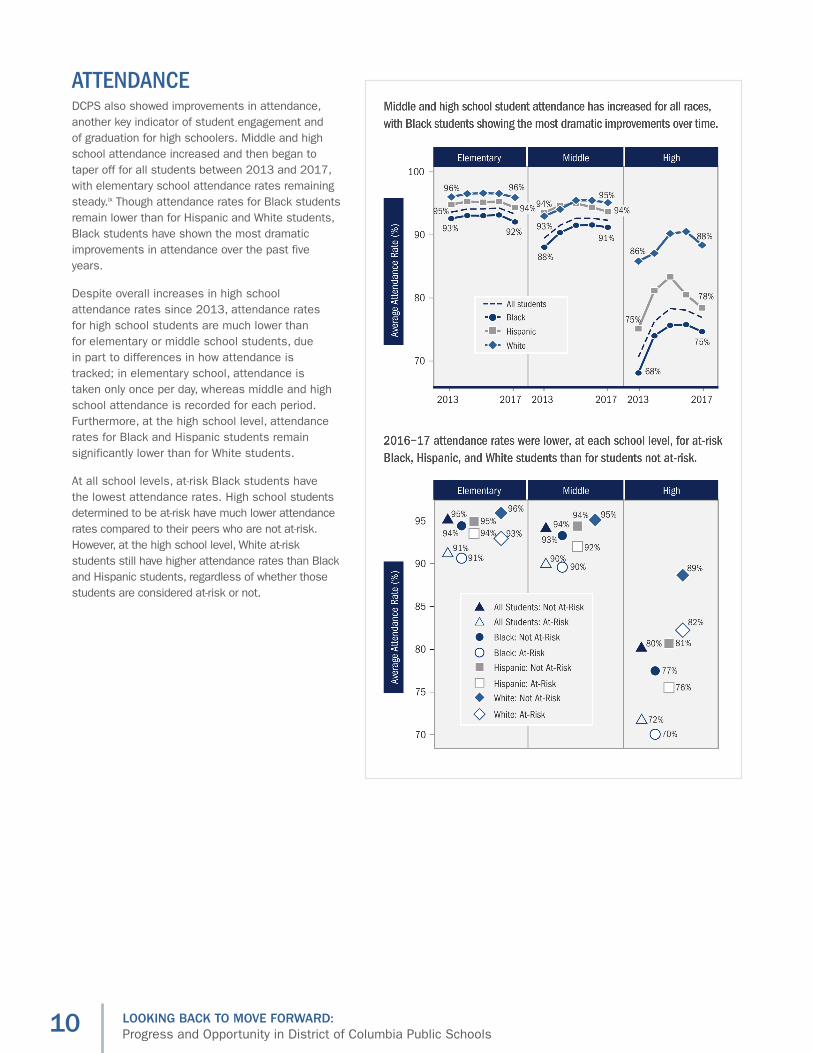
ATTENDANCEDCPS also showed improvements in attendance, another key indicator of student engagement and of graduation for high schoolers. Middle and high school attendance increased and then began to taper off for all students between 2013 and 2017, with elementary school attendance rates remaining steady.ix Though attendance rates for Black students remain lower than for Hispanic and White students, Black students have shown the most dramatic improvements in attendance over the past five years.
Despite overall increases in high school attendance rates since 2013, attendance rates for high school students are much lower than for elementary or middle school students, due in part to differences in how attendance is tracked; in elementary school, attendance is taken only once per day, whereas middle and high school attendance is recorded for each period. Furthermore, at the high school level, attendance rates for Black and Hispanic students remain significantly lower than for White students.
At all school levels, at-risk Black students have the lowest attendance rates. High school students determined to be at-risk have much lower attendance rates compared to their peers who are not at-risk. However, at the high school level, White at-risk students still have higher attendance rates than Black and Hispanic students, regardless of whether those students are considered at-risk or not.
11LOOKING BACK TO MOVE FORWARD: Progress and Opportunity in District of Columbia Public Schools
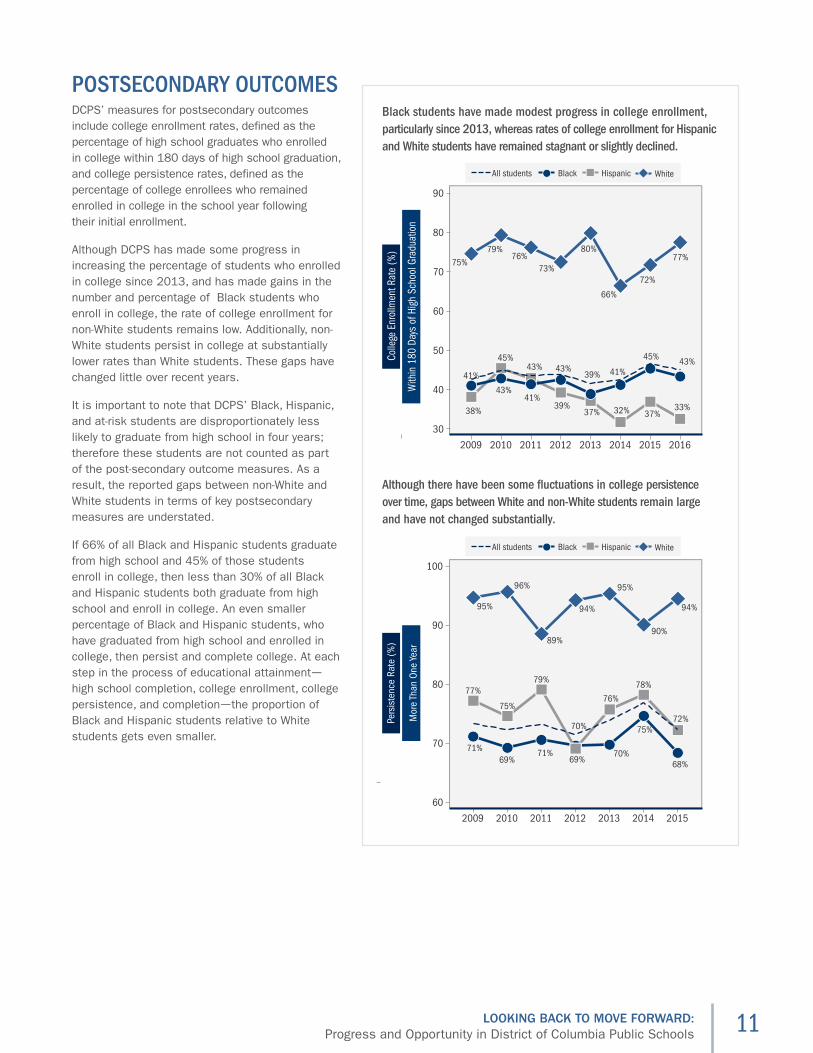
POSTSECONDARY OUTCOMESDCPS’ measures for postsecondary outcomes include college enrollment rates, defined as the percentage of high school graduates who enrolled in college within 180 days of high school graduation, and college persistence rates, defined as the percentage of college enrollees who remained enrolled in college in the school year following their initial enrollment.
Although DCPS has made some progress in increasing the percentage of students who enrolled in college since 2013, and has made gains in the number and percentage of Black students who enroll in college, the rate of college enrollment for non-White students remains low. Additionally, non-White students persist in college at substantially lower rates than White students. These gaps have changed little over recent years.
It is important to note that DCPS’ Black, Hispanic, and at-risk students are disproportionately less likely to graduate from high school in four years; therefore these students are not counted as part of the post-secondary outcome measures. As a result, the reported gaps between non-White and White students in terms of key postsecondary measures are understated.
If 66% of all Black and Hispanic students graduate from high school and 45% of those students enroll in college, then less than 30% of all Black and Hispanic students both graduate from high school and enroll in college. An even smaller percentage of Black and Hispanic students, who have graduated from high school and enrolled in college, then persist and complete college. At each step in the process of educational attainment—high school completion, college enrollment, college persistence, and completion—the proportion of Black and Hispanic students relative to White students gets even smaller.
All students Black Hispanic White
Black students have made modest progress in college enrollment, particularly since 2013, whereas rates of college enrollment for Hispanic and White students have remained stagnant or slightly declined.
Although there have been some �uctuations in college persistence over time, gaps between White and non-White students remain large and have not changed substantially.
Colle
ge E
nrol
lmen
t Rat
e (%
)Pe
rsis
tenc
e Ra
te (%
)
38%
45%43%
39%37% 32% 37%
33%
41%
43%41%
43%39% 41%
45% 43%
75%79%
76%73%
80%
66%
72%
77%
30
40
50
60
70
80
90
2009 2010 2011 2012 2013 2014 2015 2016
71%69%
71%
70%
70%
75%
68%
77%
75%
79%
69%
76%
78%
72%
95%
96%
89%
94%
95%
90%
94%
60
70
80
90
100
2009 2010 2011 2012 2013 2014 2015
Mor
e Th
an O
ne Ye
arW
ithin
180
Day
s of
Hig
h Sc
hool
Gra
duat
ion
All students Black Hispanic White
12 LOOKING BACK TO MOVE FORWARD: Progress and Opportunity in District of Columbia Public Schools
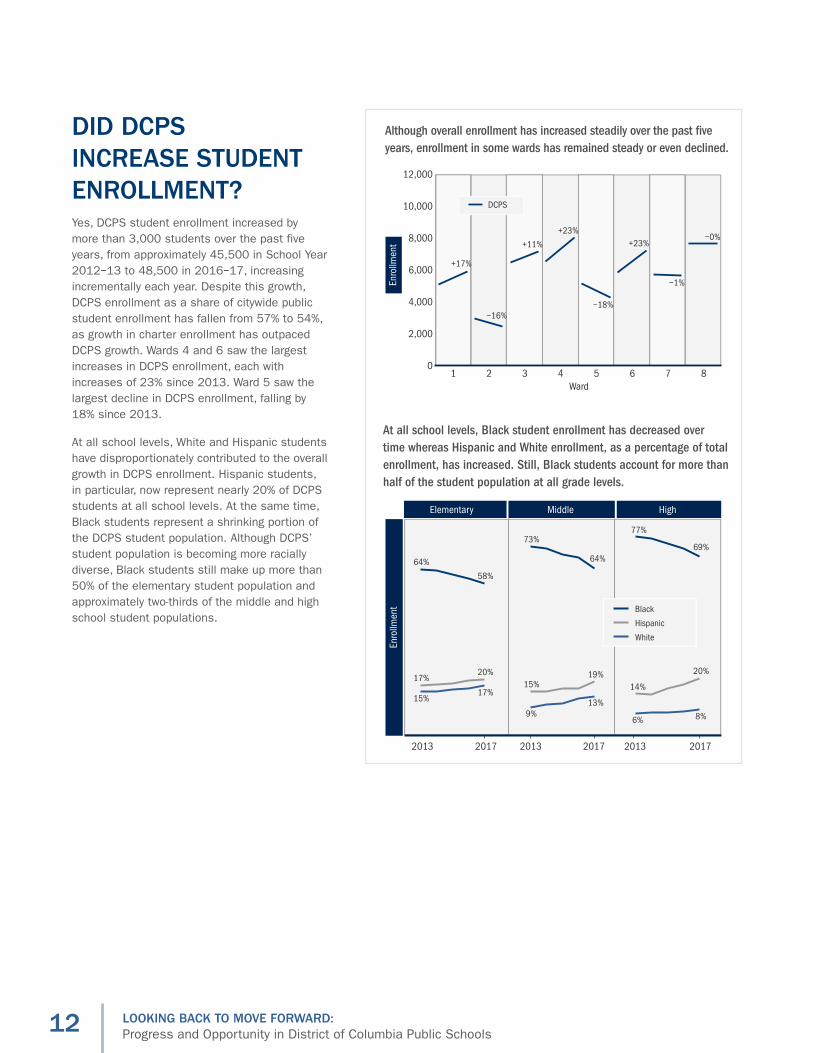
At all school levels, Black student enrollment has decreased over time whereas Hispanic and White enrollment, as a percentage of total enrollment, has increased. Still, Black students account for more than half of the student population at all grade levels.
+17%
−16%
+11%
+23%
−18%
+23%
−1%
−0%
0
2,000
4,000
6,000
8,000
10,000
12,000
1 2 3 4 5 6 7 8Ward
Although overall enrollment has increased steadily over the past �ve years, enrollment in some wards has remained steady or even declined.
DCPS
Enro
llmen
t
17%20%
64%
58%
15%17%
15%19%
73%
64%
9%13%
14%
20%
77%
69%
6% 8%
2013 2017 2013 2017 2013 2017
Enro
llmen
t
Elementary Middle High
Black
Hispanic
White
DID DCPS INCREASE STUDENT ENROLLMENT?Yes, DCPS student enrollment increased by more than 3,000 students over the past five years, from approximately 45,500 in School Year 2012−13 to 48,500 in 2016−17, increasing incrementally each year. Despite this growth, DCPS enrollment as a share of citywide public student enrollment has fallen from 57% to 54%, as growth in charter enrollment has outpaced DCPS growth. Wards 4 and 6 saw the largest increases in DCPS enrollment, each with increases of 23% since 2013. Ward 5 saw the largest decline in DCPS enrollment, falling by 18% since 2013.
At all school levels, White and Hispanic students have disproportionately contributed to the overall growth in DCPS enrollment. Hispanic students, in particular, now represent nearly 20% of DCPS students at all school levels. At the same time, Black students represent a shrinking portion of the DCPS student population. Although DCPS’ student population is becoming more racially diverse, Black students still make up more than 50% of the elementary student population and approximately two-thirds of the middle and high school student populations.
13LOOKING BACK TO MOVE FORWARD: Progress and Opportunity in District of Columbia Public Schools
DID DCPS IMPROVE STUDENT SATISFACTION?
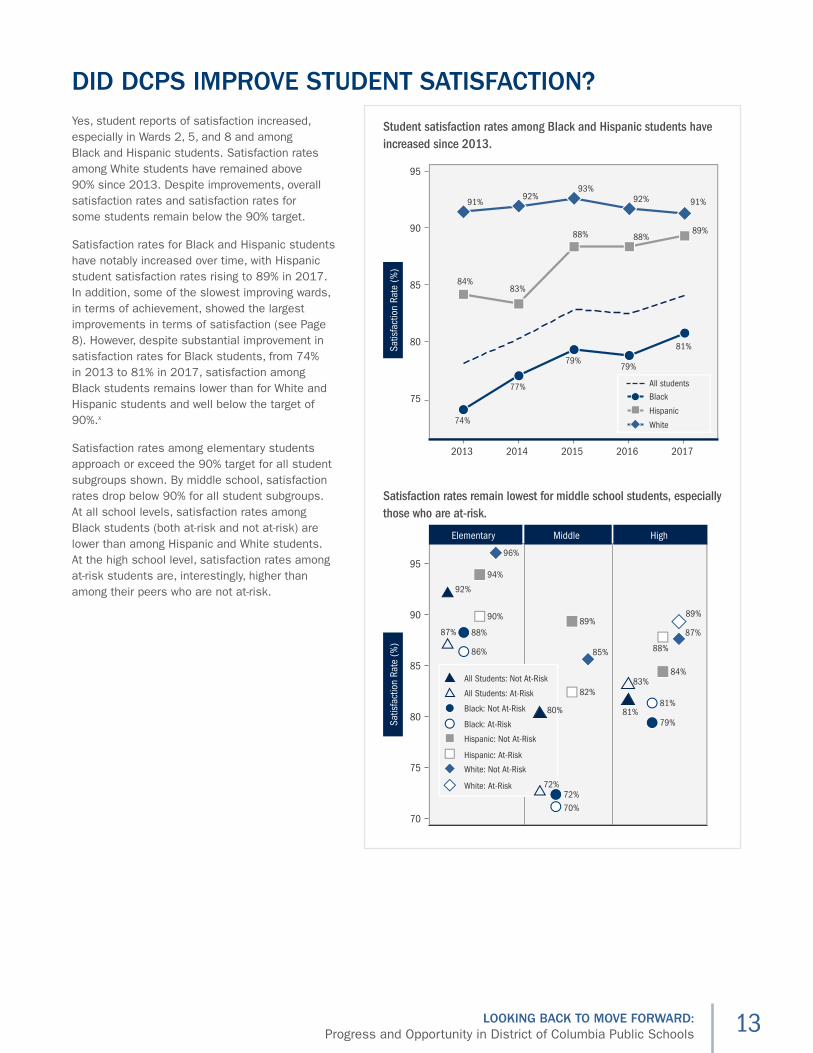
Student satisfaction rates among Black and Hispanic students have increased since 2013.
Satisfaction rates remain lowest for middle school students, especially those who are at-risk.
Satis
fact
ion
Rate
(%)
75
80
85
90
95
2013 2014 2015 2016 2017
84%83%
88% 88%89%
74%
77%
79%79%
81%
91%92%
93%92% 91%
Black
Hispanic
White
All studentsSa
tisfa
ctio
n Ra
te (%
)
70
75
80
85
90
95
Black: Not At-Risk
Black: At-Risk
Hispanic: At-Risk
White: At-Risk
Hispanic: Not At-Risk
White: Not At-Risk
All Students: Not At-Risk
All Students: At-Risk
Elementary Middle High
88%
72%
79%
86%
70%
81%
94%
89%
84%
90%
82%
88%
96%
85%
87%
89%
92%
80% 81%
87%
72%
83%
Yes, student reports of satisfaction increased, especially in Wards 2, 5, and 8 and among Black and Hispanic students. Satisfaction rates among White students have remained above 90% since 2013. Despite improvements, overall satisfaction rates and satisfaction rates for some students remain below the 90% target.
Satisfaction rates for Black and Hispanic students have notably increased over time, with Hispanic student satisfaction rates rising to 89% in 2017. In addition, some of the slowest improving wards, in terms of achievement, showed the largest improvements in terms of satisfaction (see Page 8). However, despite substantial improvement in satisfaction rates for Black students, from 74% in 2013 to 81% in 2017, satisfaction among Black students remains lower than for White and Hispanic students and well below the target of 90%.x
Satisfaction rates among elementary students approach or exceed the 90% target for all student subgroups shown. By middle school, satisfaction rates drop below 90% for all student subgroups. At all school levels, satisfaction rates among Black students (both at-risk and not at-risk) are lower than among Hispanic and White students. At the high school level, satisfaction rates among at-risk students are, interestingly, higher than among their peers who are not at-risk.
14 LOOKING BACK TO MOVE FORWARD: Progress and Opportunity in District of Columbia Public Schools
CONCLUSIONSince announcing A Capital Commitment five years ago, DCPS has shown improvement in terms of all five goals identified. Moreover, improvement in nonacademic outcomes, such as attendance and satisfaction, among some lower-performing student subgroups and in schools located in typically low-performing wards, may be early indicators that achievement and graduation rates among those subgroups and in those wards will continue to rise. It is clear that DCPS has a strong foundation on which to build, including:
� IMPROVED STUDENT ACHIEVEMENT RATES. Achievement rates have improved for nearly all students at all school levels, but only White students have surpassed the 70% proficiency target. Proficiency rates for Black and Hispanic students are still well below 70%, and longstanding achievement gaps have not narrowed much, if at all. AP participation rates for Black students have increased but remain well below participation rates for both White and Hispanic students.
� INVESTMENTS IN STRUGGLING SCHOOLS. The wards containing DCPS’ lowest-performing schools have shown some improvements in elementary and middle ELA and mathematics, but generally are improving at a slower rate than wards containing higher-performing schools. Despite improvements, many of DCPS’ lowest-performing schools remain low-performing. These lower-performing schools overwhelmingly serve the Black student population in DCPS.
� INCREASED GRADUATION RATES. Graduation rates for students in selective high schools, and White students in comprehensive high schools, have surpassed 75%. Although graduation rates for Black and Hispanic students remain below 75%, graduation rates for these students have increased over time and the gap between these students and White students has narrowed. Similar trends in attendance and ninth-grade course pass rates suggest graduation rates will continue to rise. Postsecondary enrollment however, particularly for Black and Hispanic students, has not kept pace with increases in graduation rates. With only 43% of Black high school graduates and 33% of Hispanic high school graduates enrolling in college in the semester following their high school graduation, there is much room for improvement.
� IMPROVED STUDENT SATISFACTION. Satisfaction rates among Black and Hispanic students have improved but have not yet reached the 90% target. Some of the lowest-performing wards have shown the largest improvements in satisfaction rates over time. Satisfaction rates among middle and high schoolers remain below 90% for all students.
� INCREASED ENROLLMENT. More than 48,000 students were enrolled in DCPS for School Year 2016−17, an increase of more than 3,000 students from School Year 2011−12. However, DCPS serves a smaller share of the student population than it did in 2011−12; charter schools now serve nearly half of DC students. In addition, DCPS students remain largely segregated, with the majority of DCPS’ White and Hispanic students located in just a few of the eight wards.
Although the progress DCPS has made toward achieving the goals laid out five years ago should certainly be recognized and perhaps explored by other urban school districts, there is still much work to be done before DCPS can claim to provide all students with “a safe, academically challenging and inspiring learning experience.” Stark racial and geographic inequities persist. Black and Hispanic students, and at-risk students from all racial groups, are still performing well below their White and not-at-risk peers in terms of academic achievement rates, high school graduation rates, and postsecondary enrollment and persistence. Moreover, the lowest-performing schools are still concentrated in the same few wards, serving a majority and supermajority Black student population. Ensuring that all students, of all races and levels of need, in all wards have access to “a safe, academically challenging and inspiring learning experience” is still very much a work in progress for DCPS, and is a goal that must be prioritized moving forward.
15LOOKING BACK TO MOVE FORWARD: Progress and Opportunity in District of Columbia Public Schools
ENDNOTESi https://dcps.dc.gov/sites/default/files/dc/sites/dcps/publication/attachments/DCPS-Capital-Commitment-Strategic-Plan-April-2012.pdf
ii In 2014, then Secretary of Education, Arne Duncan, called DC “the fastest-improving big city school district in the nation.” Since then, many have echoed this claim including the current Education Secretary, Betsy DeVos, DCPS officials, and others.
iii Lipsey, M., Pusio, K., Yun, C., Herbert, M., Steinka-Fry, K., Cole, M., Roberts, M., Anthony, K., & Busik, M. (2012). Translating the Statistical Representation of Effects of Education Interventions Into More Readily Interpretable Forms. Washington, DC: U.S. Department of Education. https://ies.ed.gov/ncser/pubs/20133000/pdf/20133000.pdf
iv DCPS has six selective high schools, to which eligible students in Grades 9−12 can apply, and are admitted based on specific criteria set by the schools.
v Data based on school-level performance within each ward. In DC, students do not necessarily attend schools in the same ward in which they live.
vi See Allensworth, E., & Easton, J.Q. (2005). The On-Track Indicator as a Predictor of High School Graduation.
vii For further information on high school graduation rates nationally and across states, see https://nces.ed.gov/programs/coe/indicator_coi.asp
viii 2017 graduation rates for DCPS are set to be released in fall 2017.
ix Beginning in the 2013−14 school year, the definition of a full day’s absence changed from missing 40% of required courses to missing just 20% of required courses.
x The data used for these figures was obtained from the National Student Clearinghouse (NSC). Although these data are widely accepted as the most comprehensive records of college enrollment and persistence, there are several known sources of error in NSC data. First, not all colleges report their enrollment data to NCS. Furthermore, coverage is not even across types of postsecondary institutions with higher rates of coverage in public and private nonprofit four-year colleges and lower rates in for-profit institutions. Additionally, estimates for DCPS’ White and Hispanic subpopulations are more prone to fluctuations due to the relatively small numbers in those cohorts. Enrollment estimates are based on 2,100 to 2,400 Black students, 210 to 340 Hispanic students, and 120 to 190 White students, varying by year. Persistence estimates are based on 840 to 1010 Black students, 80 to 130 Hispanic students, and 90 to 130 White students, varying by year. For information on the limitation of NSC data see: Dynarski, S., Hemelt, S., & Hyman, J. (2015). The missing manual: Using national student clearinghouse data to track postsecondary outcomes. Educational Evaluation and Policy Analysis, 37(1S), 53S−79S.
1715_06/17
ABOUT AMERICAN INSTITUTES FOR RESEARCH
Established in 1946, with headquarters in Washington, D.C.,
American Institutes for Research (AIR) is an independent,
nonpartisan, not-for-profit organization that conducts behavioral
and social science research and delivers technical assistance
both domestically and internationally. As one of the largest
behavioral and social science research organizations in the
world, AIR is committed to empowering communities and
institutions with innovative solutions to the most critical
challenges in education, health, workforce, and international
development.
2800 Campus Drive, Suite 200San Mateo, CA 94043202.403.5000
www.air.org
LOCATIONS
DomesticWashington, D.C.
Atlanta, GA
Austin, TX
Baltimore, MD
Cayce, SC
Chapel Hill, NC
Chicago, IL
Columbus, OH
Frederick, MD
Honolulu, HI
Indianapolis, IN
Metairie, LA
Naperville, IL
New York, NY
Rockville, MD
Sacramento, CA
San Mateo, CA
Waltham, MA
InternationalEgypt
Honduras
Ivory Coast
Kyrgyzstan
Liberia
Tajikistan
Zambia
LOCATIONS
Domestic Washington, D.C.
Atlanta, GA
Austin, TX
Baltimore, MD
Cayce, SC
Chapel Hill, NC
Chicago, IL
Columbus, OH
Frederick, MD
Honolulu, HI
Indianapolis, IN
Metairie, LA
Naperville, IL
New York, NY
Rockville, MD
Sacramento, CA
San Mateo, CA
Waltham, MA
International Egypt
Honduras
Ivory Coast
Kyrgyzstan
Liberia
Tajikistan
Zambia
ABOUT AMERICAN INSTITUTES FOR RESEARCH
Established in 1946, with headquarters in Washington, D.C., American
Institutes for Research (AIR) is an independent, nonpartisan, not-for-profit
organization that conducts behavioral and social science research and
delivers technical assistance both domestically and internationally. As
one of the largest behavioral and social science research organizations
in the world, AIR is committed to empowering communities and
institutions with innovative solutions to the most critical challenges
in education, health, workforce, and international development.