progress, challenges and opportunities for vaccines to reduce under-5 childhood mortality - prof....
TRANSCRIPT
National Institute for Communicable Diseases & University of Witwatersrand, South Africa
Respiratory and Meningeal Pathogens Research Unit,& DST/NRF: Vaccine Preventable Diseases
Shabir A. Madhi
Progress, Challenges and Opportunities for Vaccines to
Reduce Under-5 Childhood Mortality
● Institution received research grants from GSK, Pfizer and Novartis
● Honoraria for speaking from GSK, Pfizer, Abbott and Sanofi Pasteur
● Investigator in clinical vaccine trials for GSK, Wyeth, Novartis, Medimmune and Sanofi Pasteur
● Consultant/member of advisory boards for GSK, Pfizer, Merck and Novartis
Disclosure
Overview
● Trends in Global and sub-Saharan Africa under-5 childhood mortality.
● Recent contribution and challenges of childhood vaccines in reducing under-5 mortality.
● Potential of new childhood vaccines in reducing under-5 mortality.
● New horizons in reducing under-5/neonatal morbidity and mortality by vaccination.
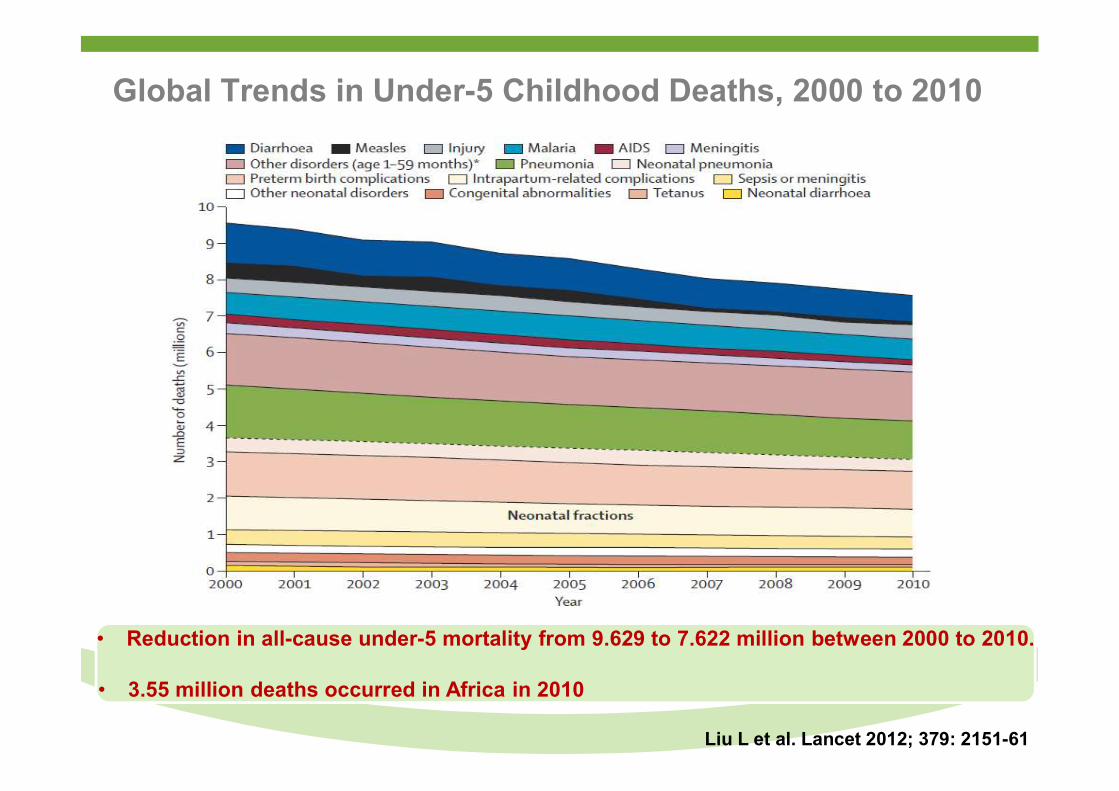
Global Trends in Under-5 Childhood Deaths, 2000 to 2010
• Reduction in all-cause under-5 mortality from 9.629 to 7.622 million between 2000 to 2010.
• 3.55 million deaths occurred in Africa in 2010
Liu L et al. Lancet 2012; 379: 2151-61
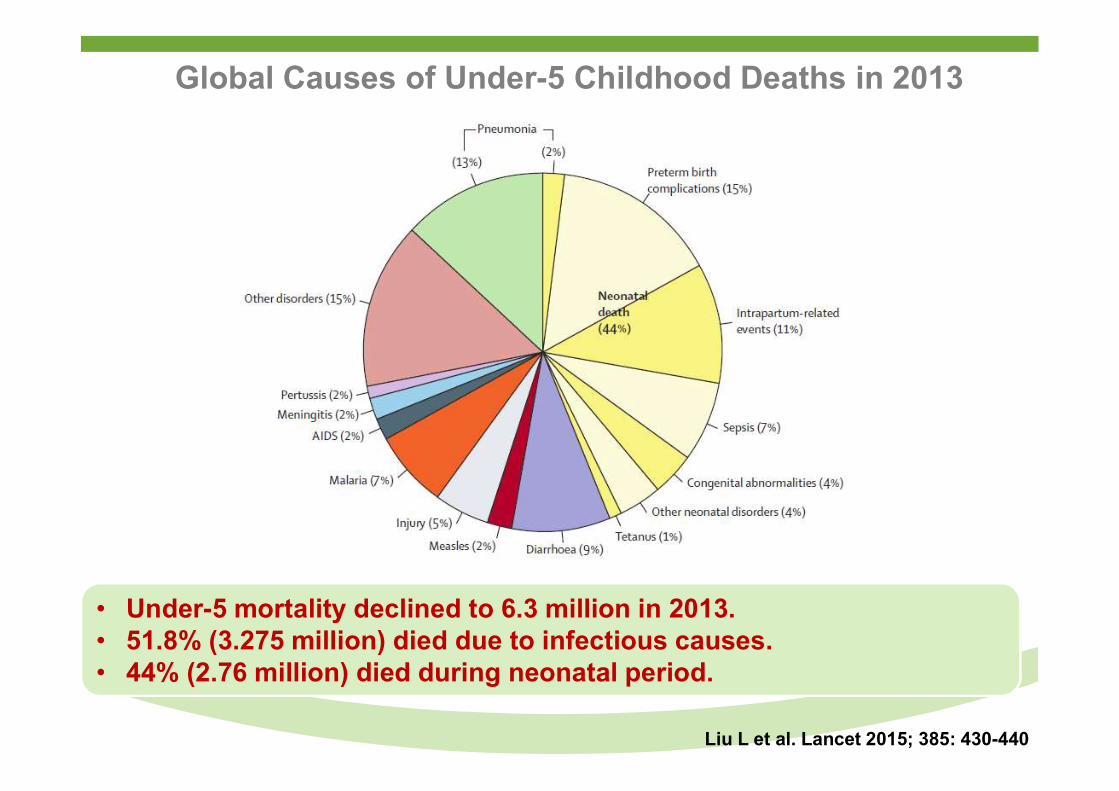
Global Causes of Under-5 Childhood Deaths in 2013
Liu L et al. Lancet 2015; 385: 430-440
• Under-5 mortality declined to 6.3 million in 2013.• 51.8% (3.275 million) died due to infectious causes.• 44% (2.76 million) died during neonatal period.
Liu L et al. Lancet 2015; 385: 430-440
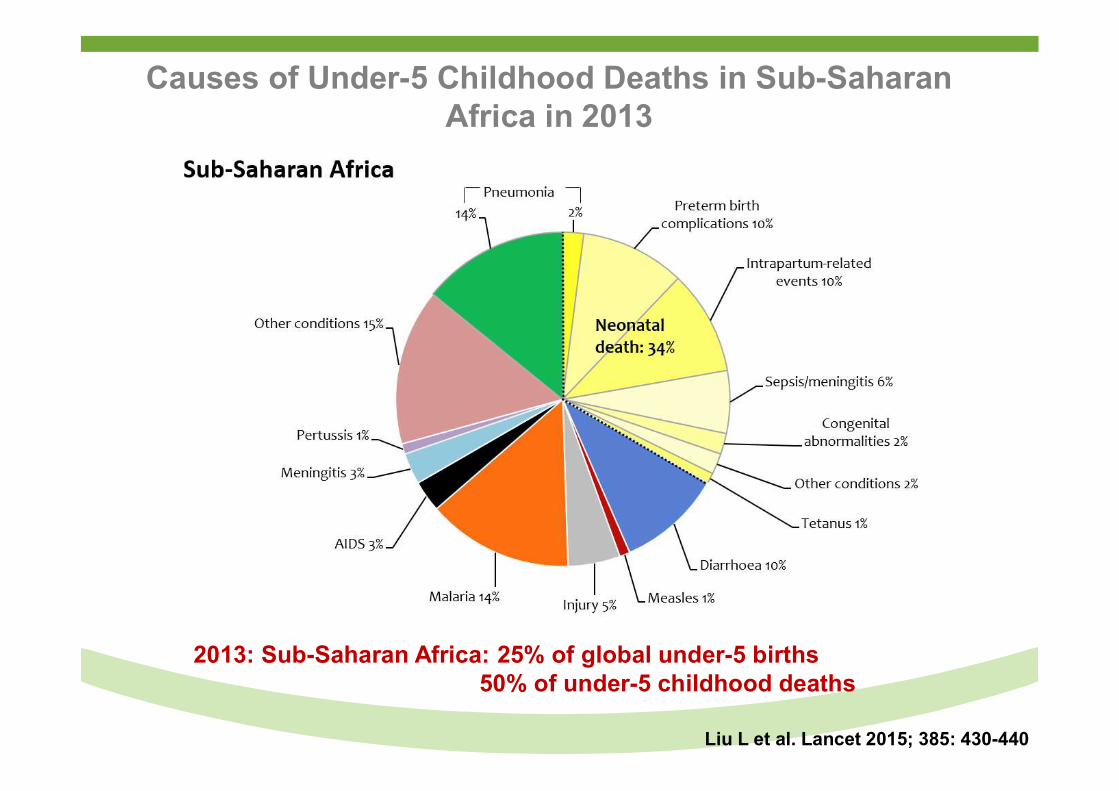
Causes of Under-5 Childhood Deaths in Sub-Saharan Africa in 2013
2013: Sub-Saharan Africa: 25% of global under-5 births50% of under-5 childhood deaths
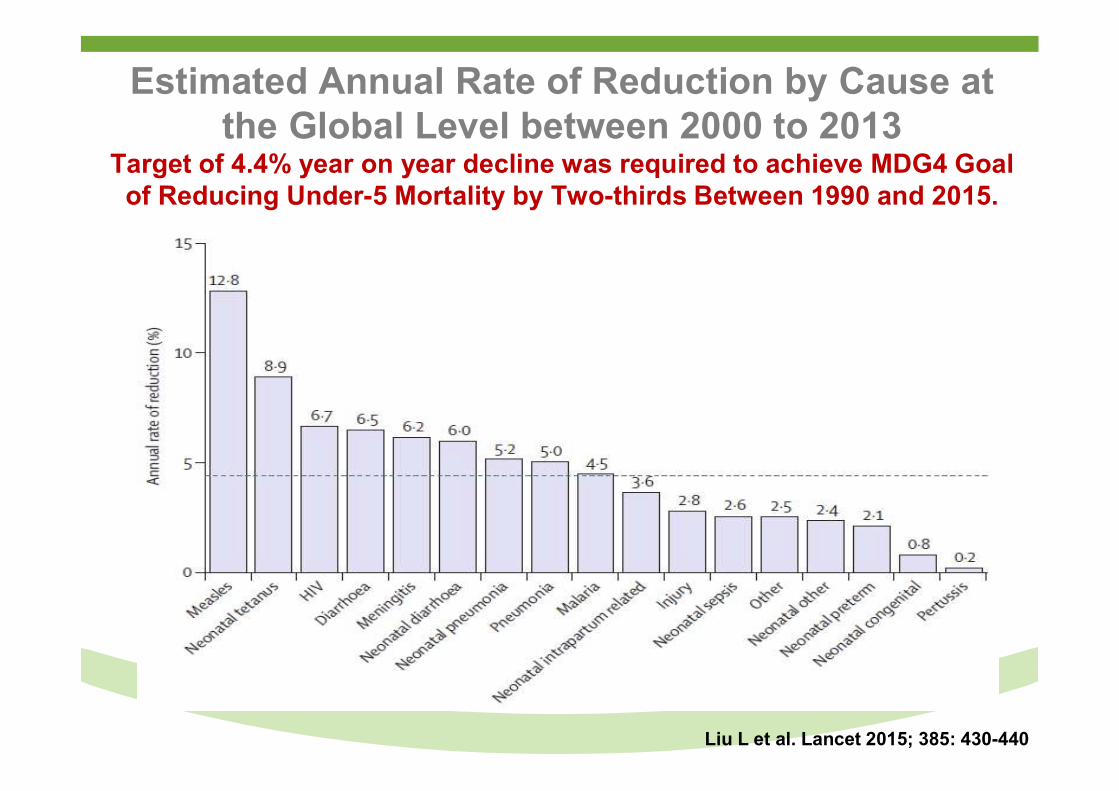
Estimated Annual Rate of Reduction by Cause at the Global Level between 2000 to 2013
Target of 4.4% year on year decline was required to achieve MDG4 Goal of Reducing Under-5 Mortality by Two-thirds Between 1990 and 2015.
Liu L et al. Lancet 2015; 385: 430-440
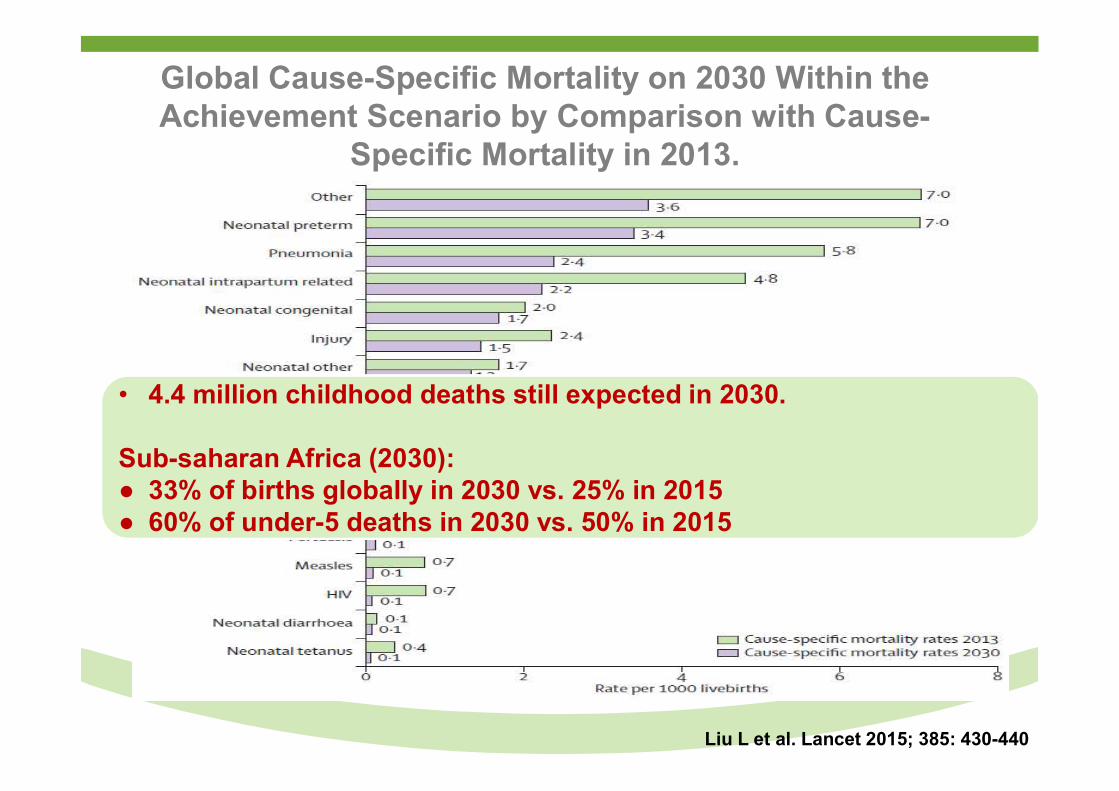
Global Cause-Specific Mortality on 2030 Within the Achievement Scenario by Comparison with Cause-
Specific Mortality in 2013.
Liu L et al. Lancet 2015; 385: 430-440
• 4.4 million childhood deaths still expected in 2030.
Sub-saharan Africa (2030):● 33% of births globally in 2030 vs. 25% in 2015● 60% of under-5 deaths in 2030 vs. 50% in 2015
Overview
● Trends in Global and sub-Saharan Africa under-5 childhood mortality.
● Recent contribution and challenges of childhood vaccines in reducing under-5 mortality.
● Potential of new childhood vaccines in reducing under-5 mortality.
● New horizons in reducing under-5/neonatal morbidity and mortality by vaccination.
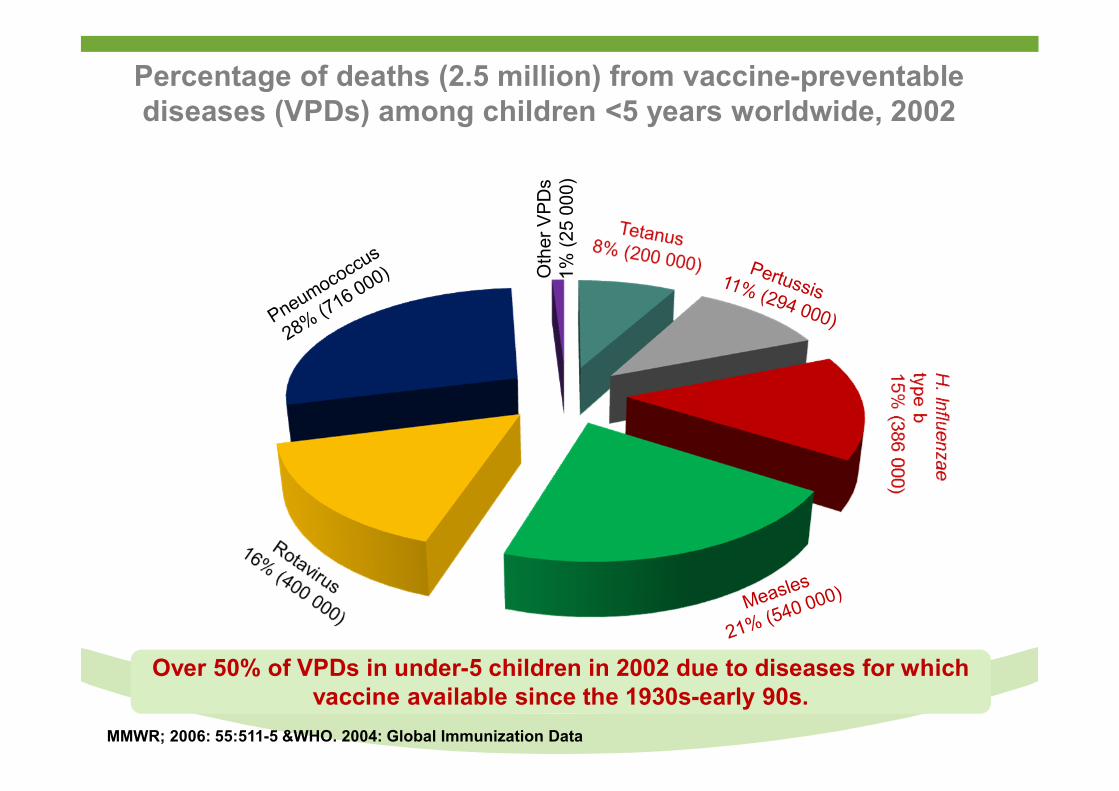
Percentage of deaths (2.5 million) from vaccine-preventable diseases (VPDs) among children <5 years worldwide, 2002
Oth
er V
PD
s1
% (
25
000)
MMWR; 2006: 55:511-5 &WHO. 2004: Global Immunization Data
Over 50% of VPDs in under-5 children in 2002 due to diseases for which vaccine available since the 1930s-early 90s.
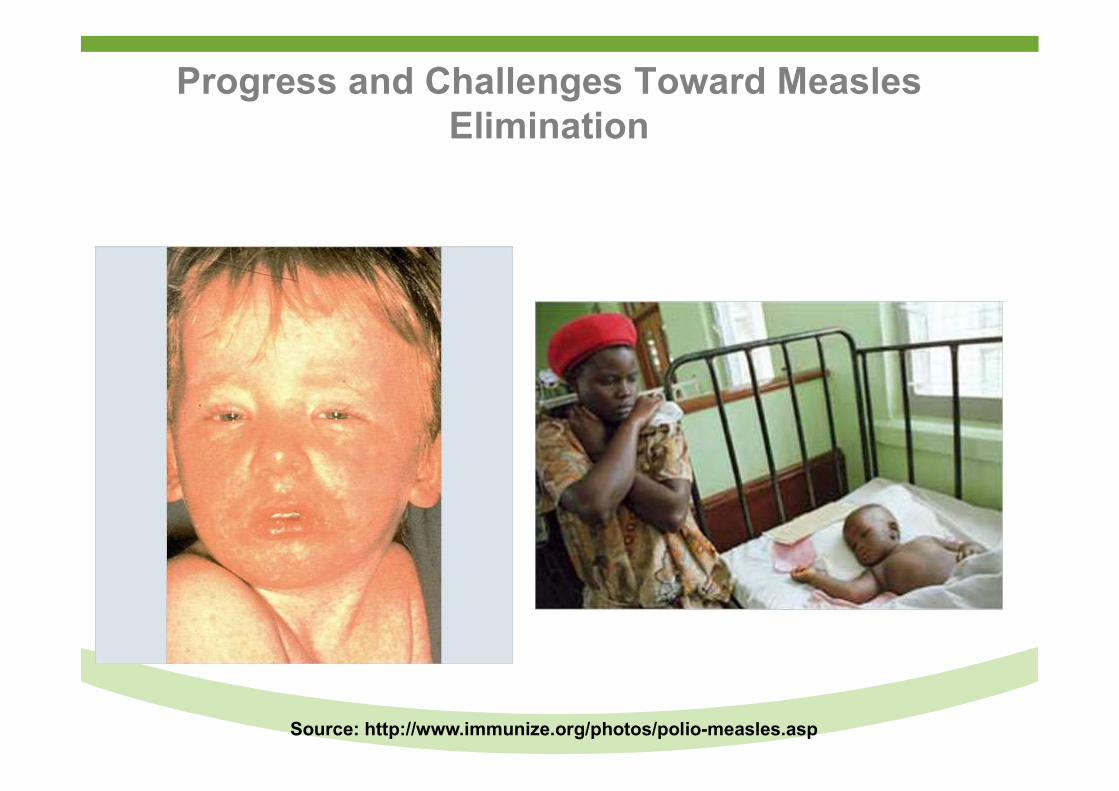
Progress and Challenges Toward Measles Elimination
Source: http://www.immunize.org/photos/polio-measles.asp
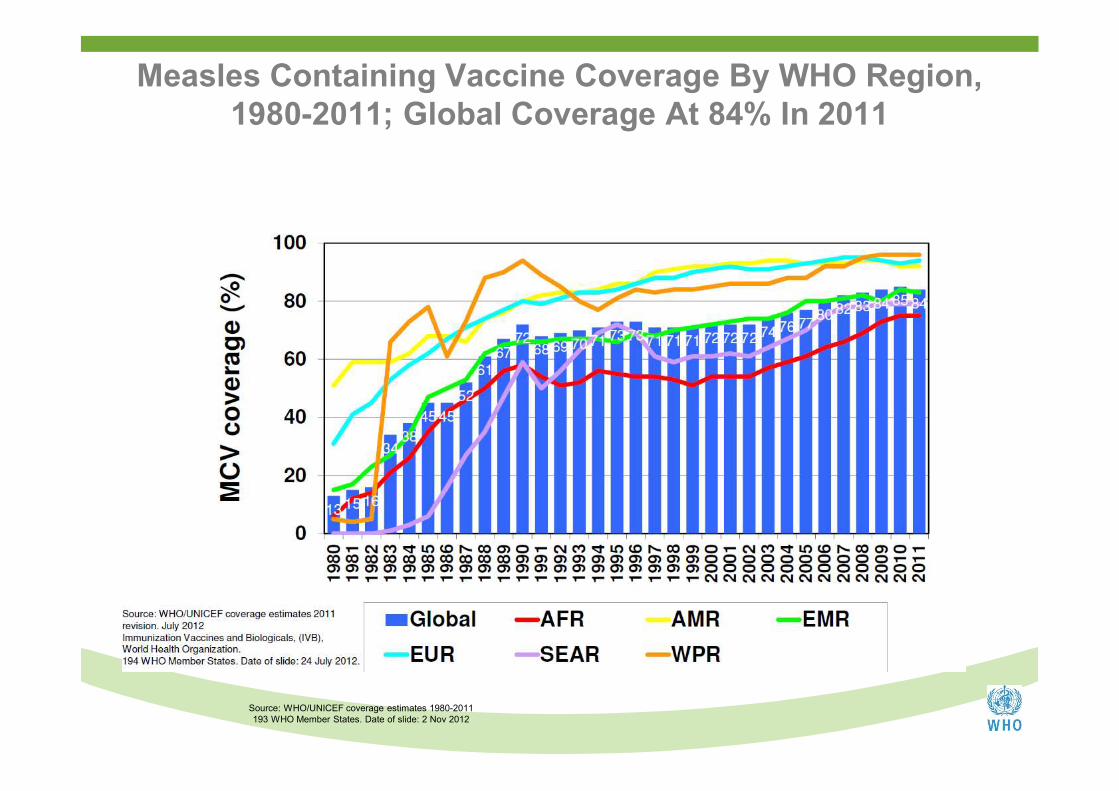
Measles Containing Vaccine Coverage By WHO Region,1980-2011; Global Coverage At 84% In 2011
Source: WHO/UNICEF coverage estimates 1980-2011193 WHO Member States. Date of slide: 2 Nov 2012
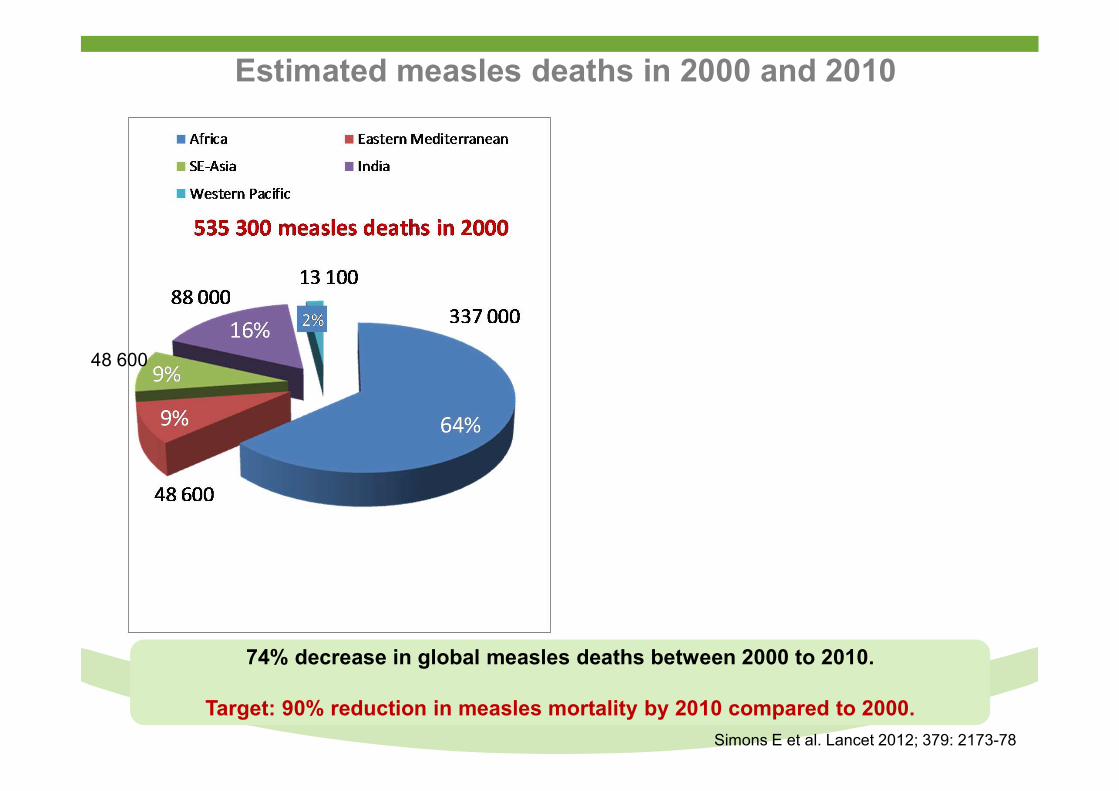
Estimated measles deaths in 2000 and 2010
10 100
48 600
139 300 measles deaths in 2010
Simons E et al. Lancet 2012; 379: 2173-78
74% decrease in global measles deaths between 2000 to 2010.
Target: 90% reduction in measles mortality by 2010 compared to 2000.
85%26%
76%1
78%
78%
1 Per cent reduction in 2010 compared to 2000
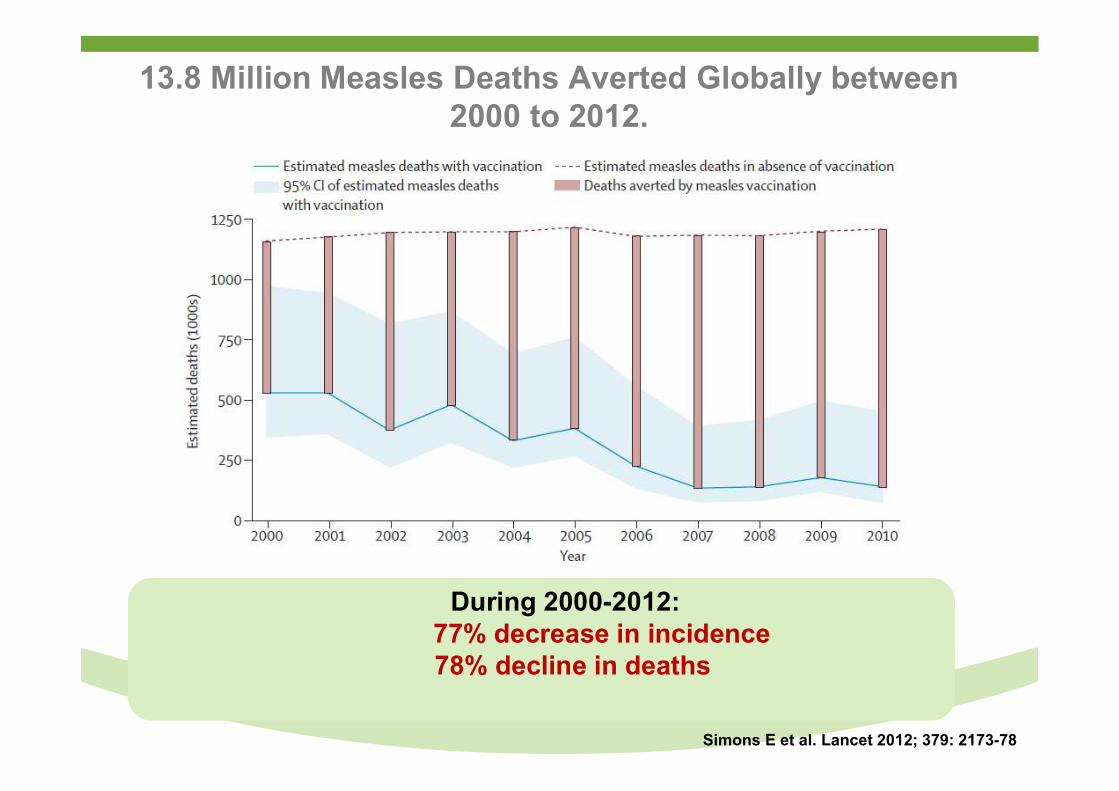
13.8 Million Measles Deaths Averted Globally between 2000 to 2012.
Simons E et al. Lancet 2012; 379: 2173-78
During 2000-2012:77% decrease in incidence78% decline in deaths
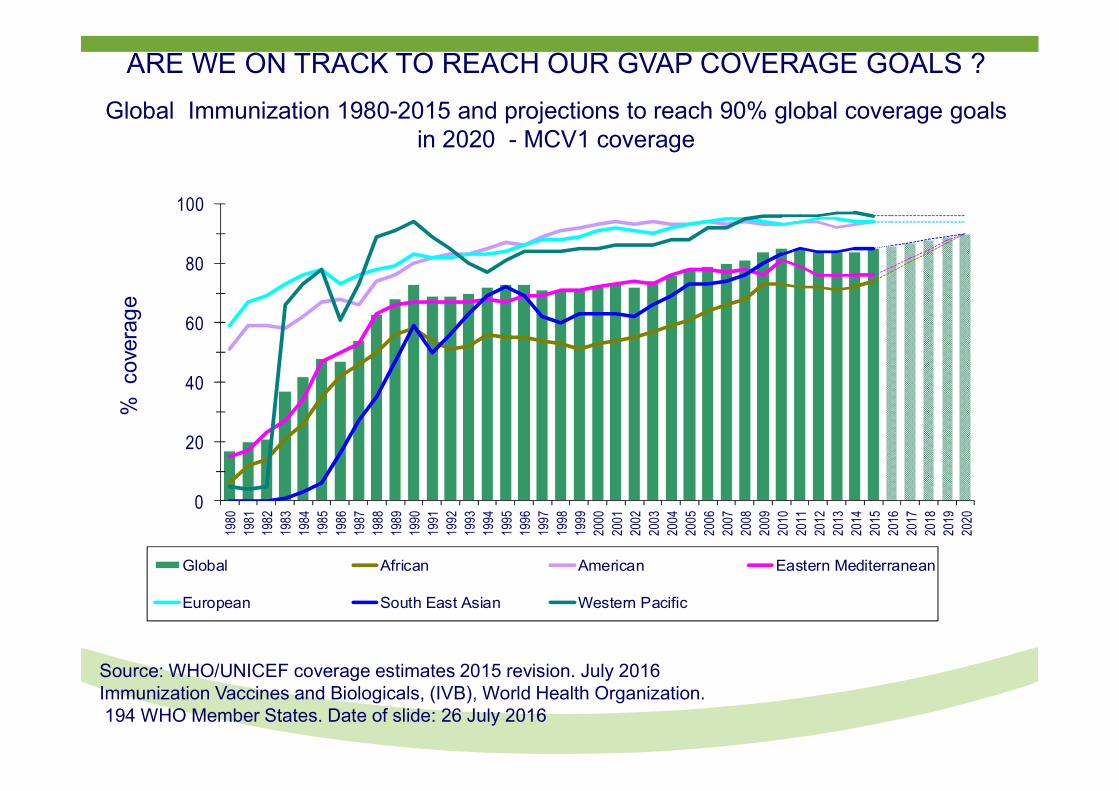
ARE WE ON TRACK TO REACH OUR GVAP COVERAGE GOALS ?
Global Immunization 1980-2015 and projections to reach 90% global coverage goals in 2020 - MCV1 coverage
0
20
40
60
80
10019
8019
8119
8219
8319
8419
8519
8619
8719
8819
8919
9019
9119
9219
9319
9419
9519
9619
9719
9819
9920
0020
0120
0220
0320
0420
0520
0620
0720
0820
0920
1020
1120
1220
1320
1420
1520
1620
1720
1820
1920
20
%
cove
rag
e
Global African American Eastern Mediterranean
European South East Asian Western Pacific
Source: WHO/UNICEF coverage estimates 2015 revision. July 2016Immunization Vaccines and Biologicals, (IVB), World Health Organization.194 WHO Member States. Date of slide: 26 July 2016
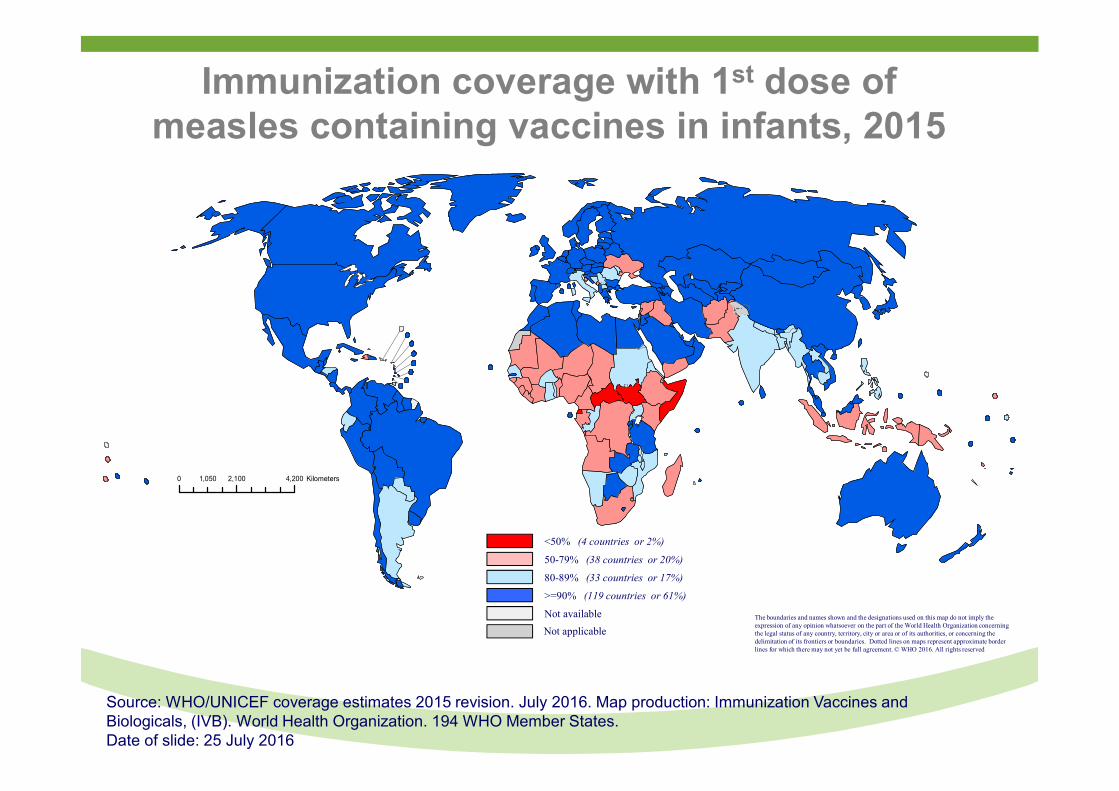
0 2,100 4,2001,050 Kilometers
Immunization coverage with 1st dose of measles containing vaccines in infants, 2015
Source: WHO/UNICEF coverage estimates 2015 revision. July 2016. Map production: Immunization Vaccines and Biologicals, (IVB). World Health Organization. 194 WHO Member States.Date of slide: 25 July 2016
The boundaries and names shown and the designations used on this map do not imply the expression of any opinion whatsoever on the part of the World Health Organization concerning the legal status of any country, territory, city or area or of its authorities, or concerning the delimitation of its frontiers or boundaries. Dotted lines on maps represent approximate border lines for which there may not yet be full agreement. © WHO 2016. All rights reserved
<50% (4 countries or 2%)
50-79% (38 countries or 20%)
80-89% (33 countries or 17%)
>=90% (119 countries or 61%)
Not available
Not applicable
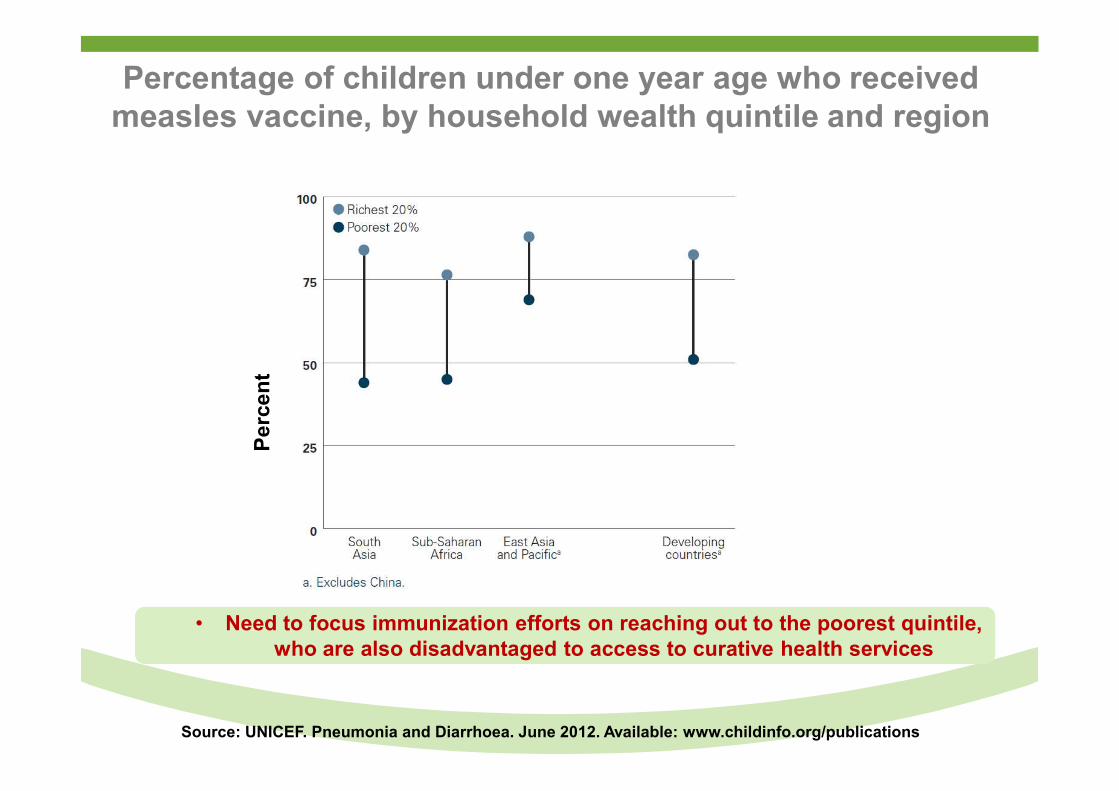
Percentage of children under one year age who received measles vaccine, by household wealth quintile and region
Pe
rce
nt
Source: UNICEF. Pneumonia and Diarrhoea. June 2012. Available: www.childinfo.org/publications
• Need to focus immunization efforts on reaching out to the poorest quintile, who are also disadvantaged to access to curative health services
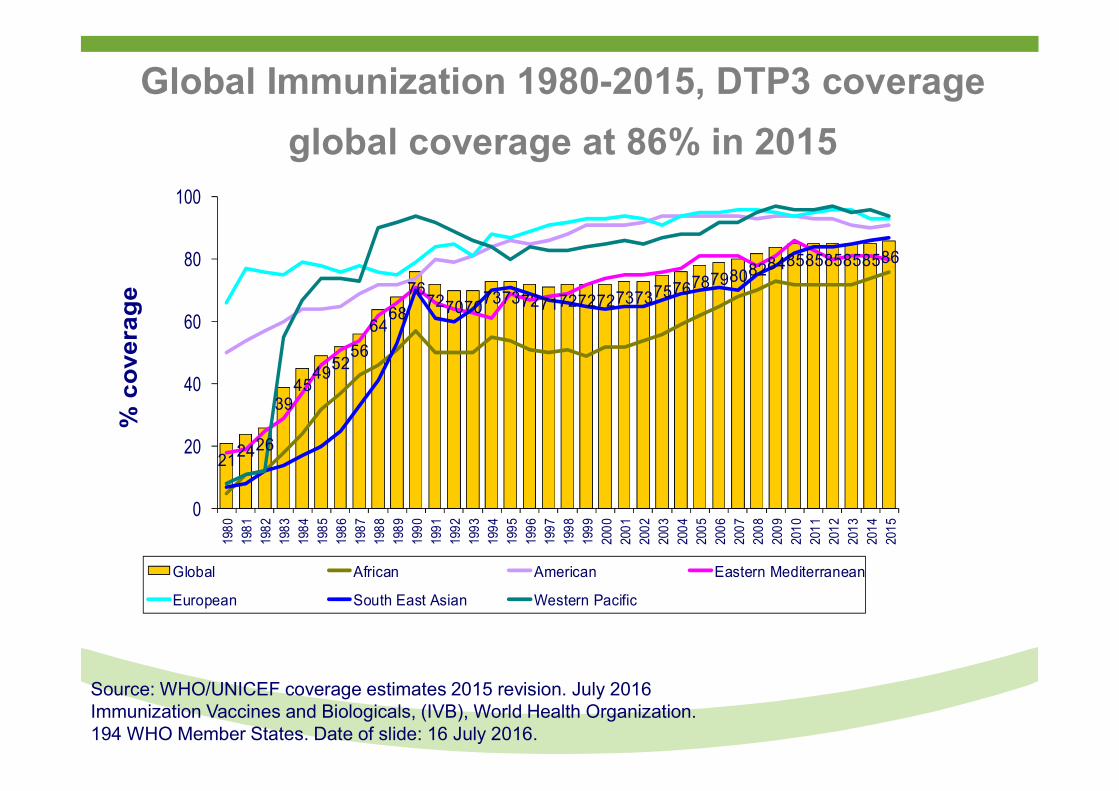
Global Immunization 1980-2015, DTP3 coverage
global coverage at 86% in 2015
212426
3945
495256
6468
7672707073737271727272737375767879808284858585858586
0
20
40
60
80
1001980
1981
1982
1983
1984
1985
1986
1987
1988
1989
1990
1991
1992
1993
1994
1995
1996
1997
1998
1999
2000
2001
2002
2003
2004
2005
2006
2007
2008
2009
2010
2011
2012
2013
2014
2015
% c
ove
rag
e
Global African American Eastern Mediterranean
European South East Asian Western Pacific
Source: WHO/UNICEF coverage estimates 2015 revision. July 2016Immunization Vaccines and Biologicals, (IVB), World Health Organization.194 WHO Member States. Date of slide: 16 July 2016.
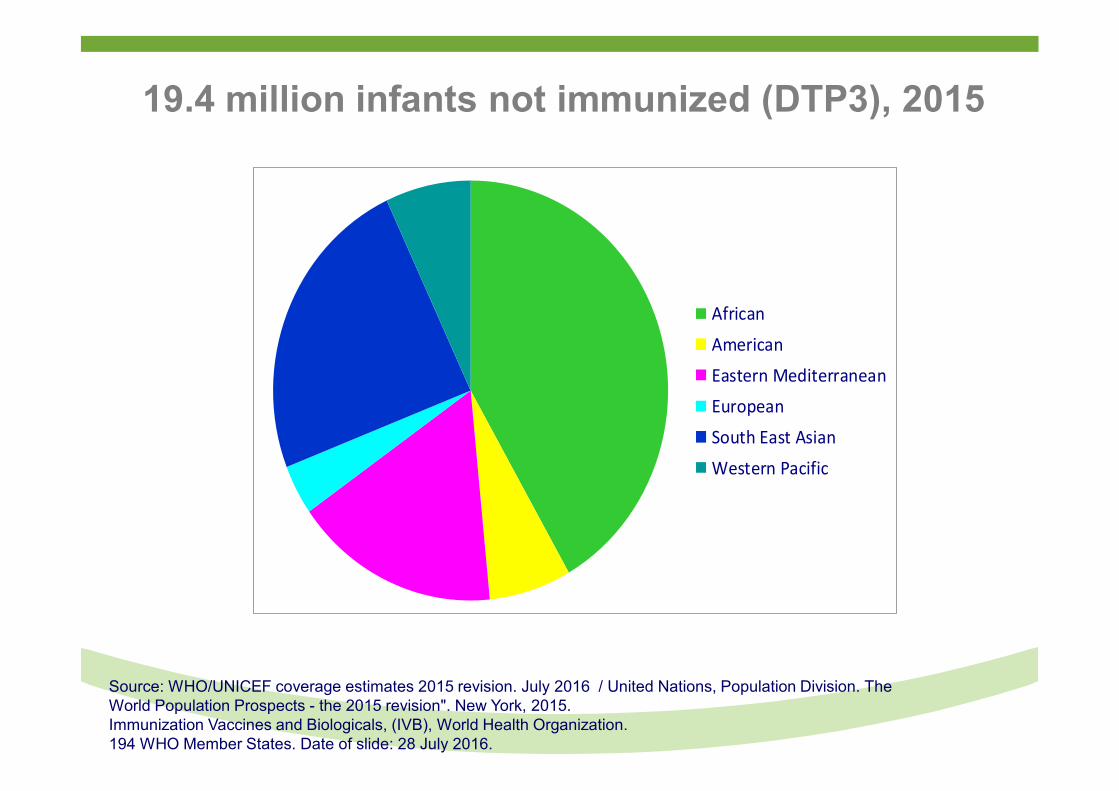
19.4 million infants not immunized (DTP3), 2015
African
American
Eastern Mediterranean
European
South East Asian
Western Pacific
Source: WHO/UNICEF coverage estimates 2015 revision. July 2016 / United Nations, Population Division. The World Population Prospects - the 2015 revision". New York, 2015.Immunization Vaccines and Biologicals, (IVB), World Health Organization.194 WHO Member States. Date of slide: 28 July 2016.
0 2,100 4,2001,050 Kilometers
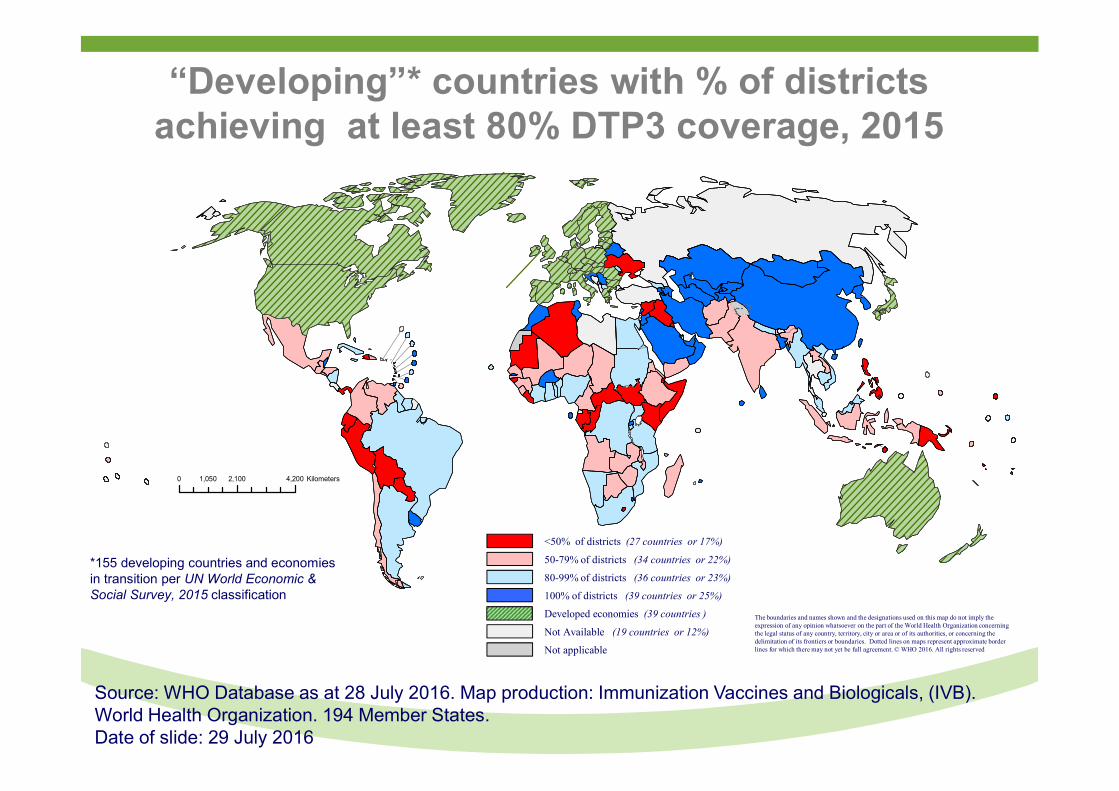
“Developing”* countries with % of districts achieving at least 80% DTP3 coverage, 2015
The boundaries and names shown and the designations used on this map do not imply the expression of any opinion whatsoever on the part of the World Health Organization concerning the legal status of any country, territory, city or area or of its authorities, or concerning the delimitation of its frontiers or boundaries. Dotted lines on maps represent approximate border lines for which there may not yet be full agreement. © WHO 2016. All rights reserved
<50% of districts (27 countries or 17%)
50-79% of districts (34 countries or 22%)
80-99% of districts (36 countries or 23%)
100% of districts (39 countries or 25%)
Developed economies (39 countries )
Not Available (19 countries or 12%)
Not applicable
*155 developing countries and economies in transition per UN World Economic & Social Survey, 2015 classification
Source: WHO Database as at 28 July 2016. Map production: Immunization Vaccines and Biologicals, (IVB). World Health Organization. 194 Member States. Date of slide: 29 July 2016
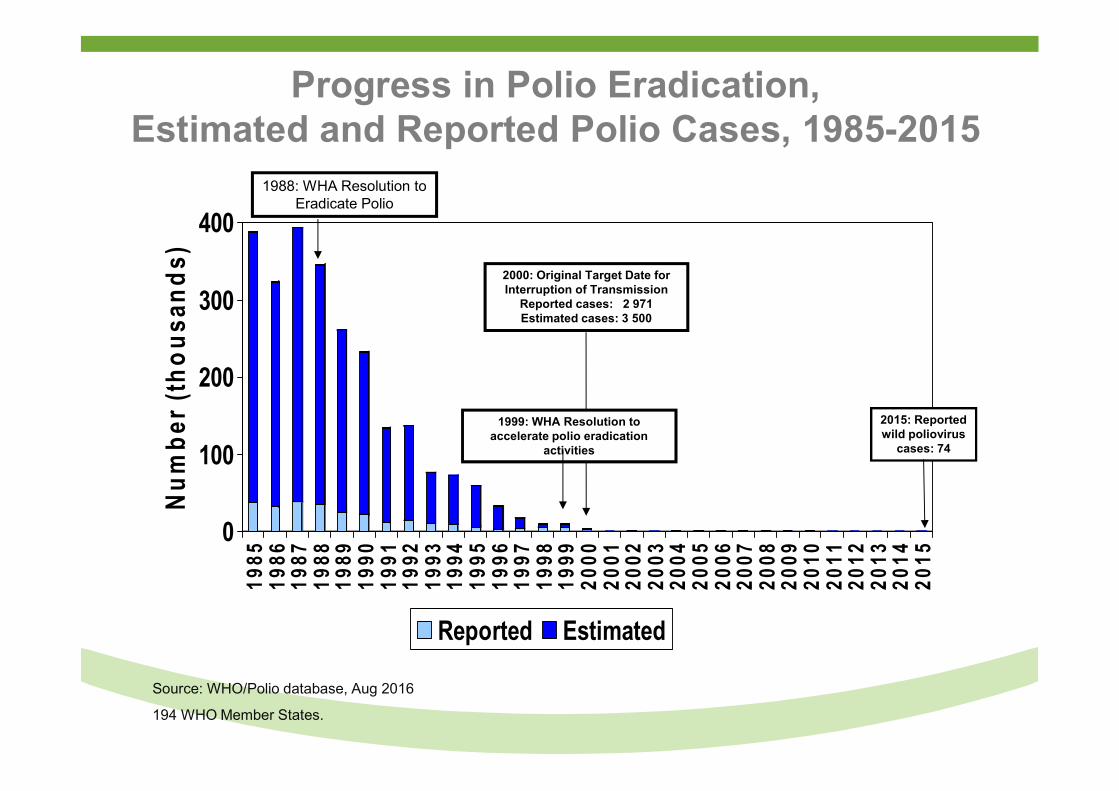
Progress in Polio Eradication, Estimated and Reported Polio Cases, 1985-2015
Source: WHO/Polio database, Aug 2016
194 WHO Member States.
0
100
200
300
400
Nu
mb
er (
tho
usa
nd
s)
19
85
19
86
19
87
19
88
19
89
19
90
19
91
19
92
19
93
19
94
19
95
19
96
19
97
19
98
19
99
20
00
20
01
20
02
20
03
20
04
20
05
20
06
20
07
20
08
20
09
20
10
20
11
20
12
20
13
20
14
20
15
Reported Estimated
1988: WHA Resolution to Eradicate Polio
2000: Original Target Date for Interruption of Transmission
Reported cases: 2 971Estimated cases: 3 500
1999: WHA Resolution to accelerate polio eradication
activities
2015: Reported wild poliovirus
cases: 74
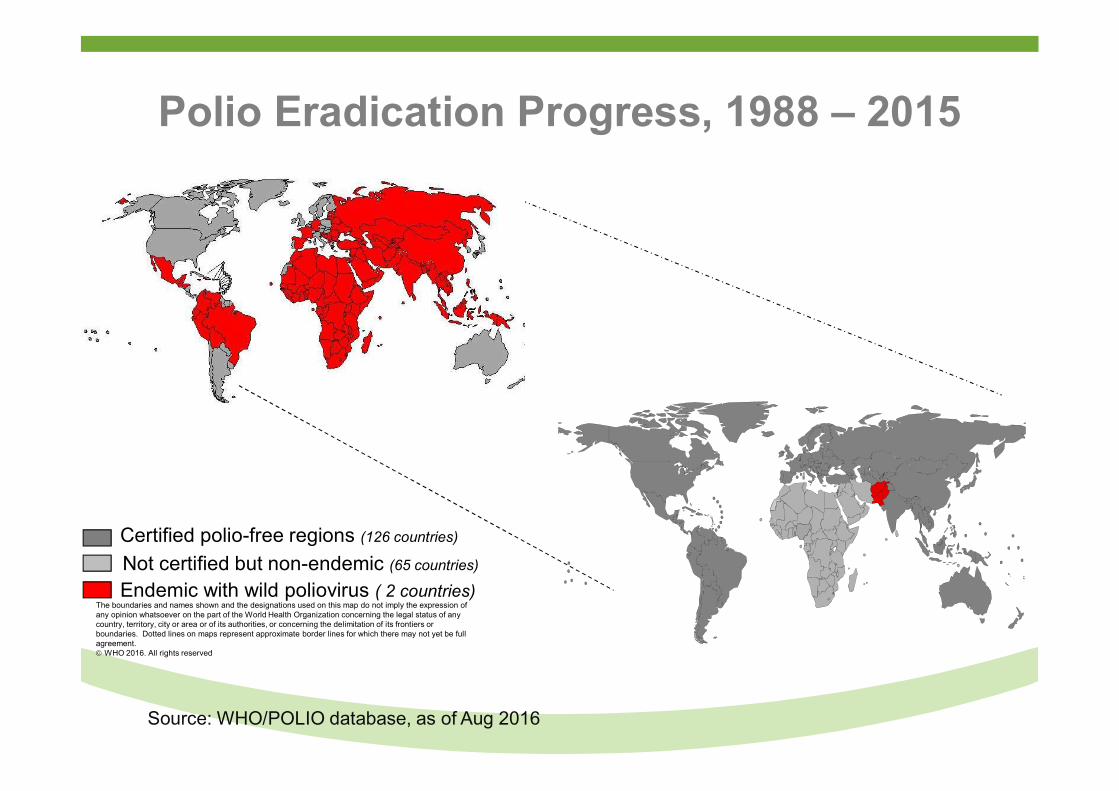
Polio Eradication Progress, 1988 – 2015
Source: WHO/POLIO database, as of Aug 2016
The boundaries and names shown and the designations used on this map do not imply the expression of any opinion whatsoever on the part of the World Health Organization concerning the legal status of any country, territory, city or area or of its authorities, or concerning the delimitation of its frontiers or boundaries. Dotted lines on maps represent approximate border lines for which there may not yet be full agreement. WHO 2016. All rights reserved
Certified polio-free regions (126 countries)
Endemic with wild poliovirus ( 2 countries)
Not certified but non-endemic (65 countries)
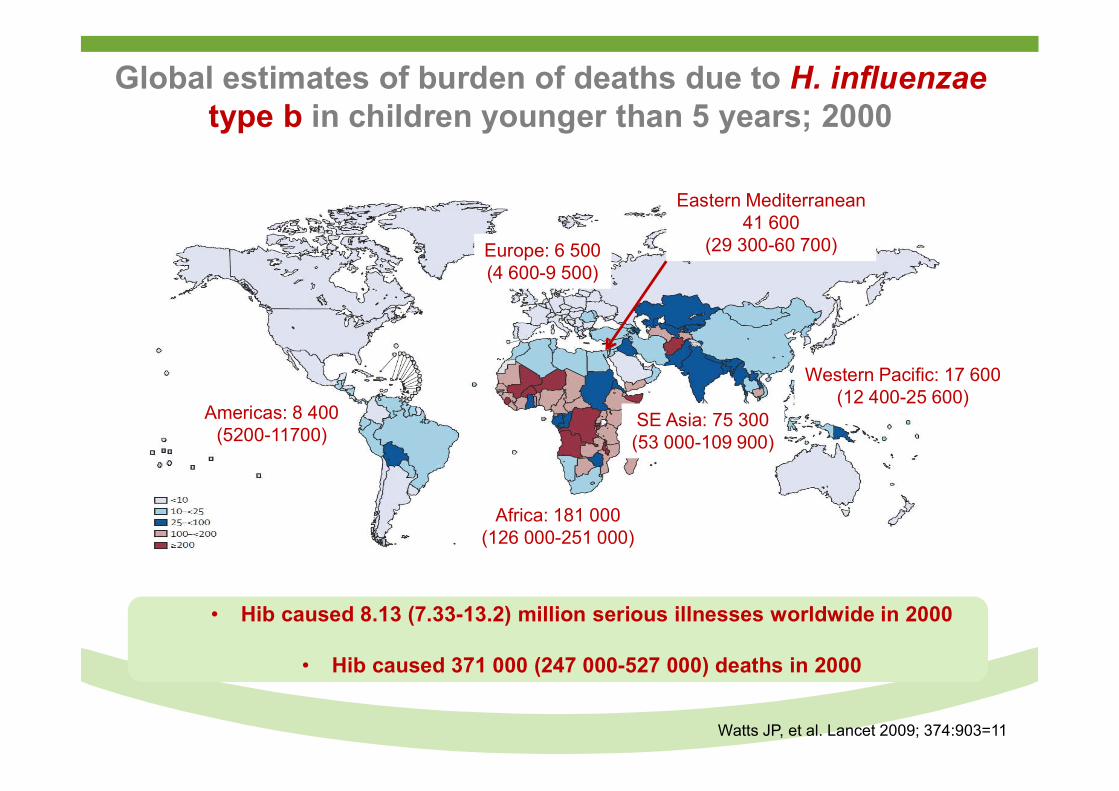
Global estimates of burden of deaths due to H. influenzae type b in children younger than 5 years; 2000
Watts JP, et al. Lancet 2009; 374:903=11
• Hib caused 8.13 (7.33-13.2) million serious illnesses worldwide in 2000
• Hib caused 371 000 (247 000-527 000) deaths in 2000
Africa: 181 000(126 000-251 000)
Americas: 8 400(5200-11700)
SE Asia: 75 300(53 000-109 900)
Western Pacific: 17 600(12 400-25 600)
Europe: 6 500(4 600-9 500)
Eastern Mediterranean41 600
(29 300-60 700)
Proportion of countries, by income-group, that have introduced Hib conjugate vaccine into immunization
programs
Source: UNICEF. Pneumonia and Diarrhoea. June 2012. Available: www.childinfo.org/publications
Per
ce
nt
cou
ntr
ies
in w
hic
h H
ibC
V
intr
od
uce
d
Overview
● Trends in Global and sub-Saharan Africa under-5 childhood mortality.
● Recent contribution and challenges of childhood vaccines in reducing under-5 mortality.
● Potential of new childhood vaccines in reducing under-5 mortality.
● New horizons in reducing under-5/neonatal morbidity and mortality by vaccination.
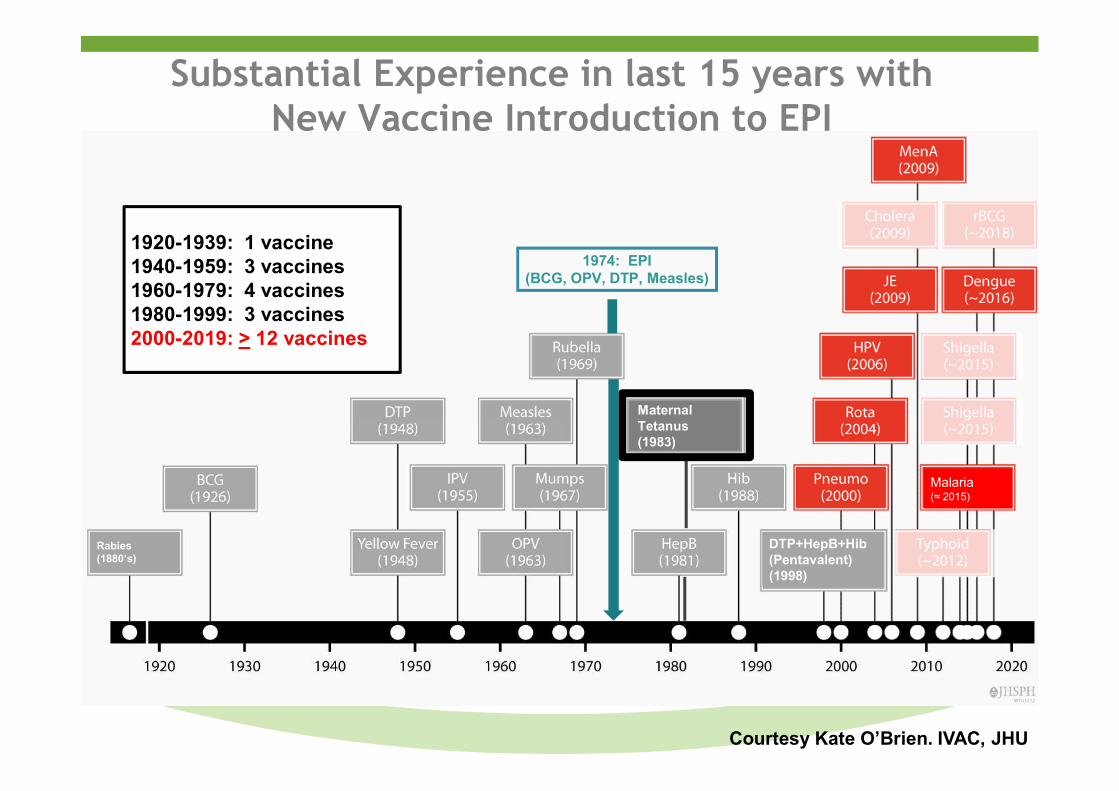
Substantial Experience in last 15 years with New Vaccine Introduction to EPI
Malaria (≈ 2015)
Maternal Tetanus (1983)
1920-1939: 1 vaccine1940-1959: 3 vaccines1960-1979: 4 vaccines1980-1999: 3 vaccines2000-2019: > 12 vaccines
Rabies(1880’s)
1974: EPI(BCG, OPV, DTP, Measles)
DTP+HepB+Hib(Pentavalent)(1998)
Courtesy Kate O’Brien. IVAC, JHU
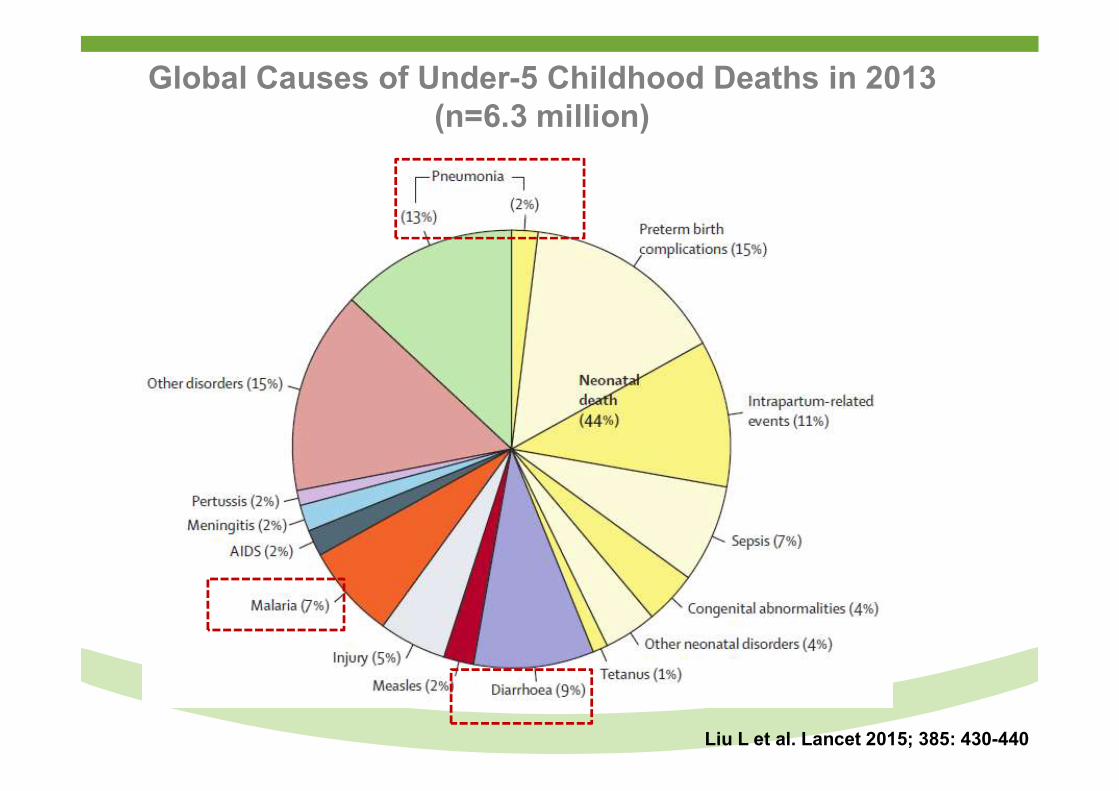
Global Causes of Under-5 Childhood Deaths in 2013 (n=6.3 million)
Liu L et al. Lancet 2015; 385: 430-440
Overview
● Trends in Global and sub-Saharan Africa under-5 childhood mortality.
● Recent contribution and challenges of childhood vaccines in reducing under-5 mortality.
● Potential of new childhood vaccines in reducing under-5 mortality.
● New horizons in reducing under-5/neonatal morbidity and mortality by vaccination.
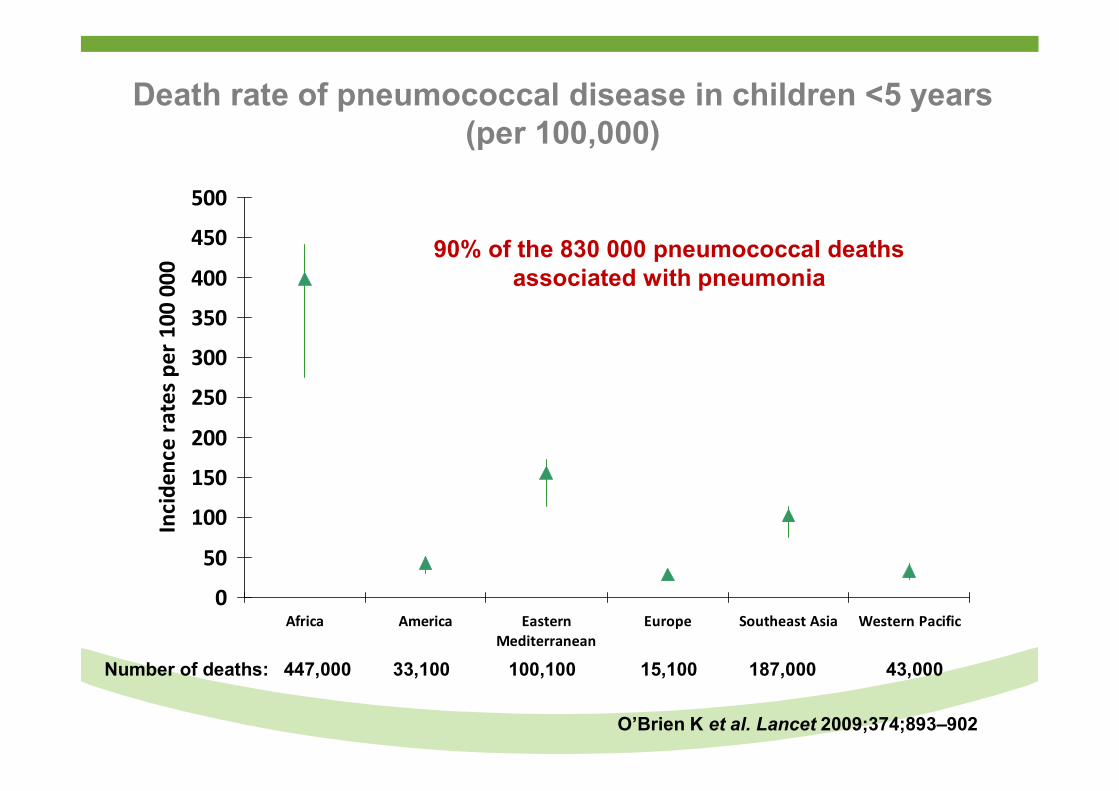
Death rate of pneumococcal disease in children <5 years (per 100,000)
0
50
100
150
200
250
300
350
400
450
500
Africa America EasternMediterranean
Europe Southeast Asia Western Pacific
Inci
denc
e ra
tes
per 1
00 0
00
100,100 15,100 187,000 43,000Number of deaths: 447,000 33,100
O’Brien K et al. Lancet 2009;374;893–902
90% of the 830 000 pneumococcal deathsassociated with pneumonia
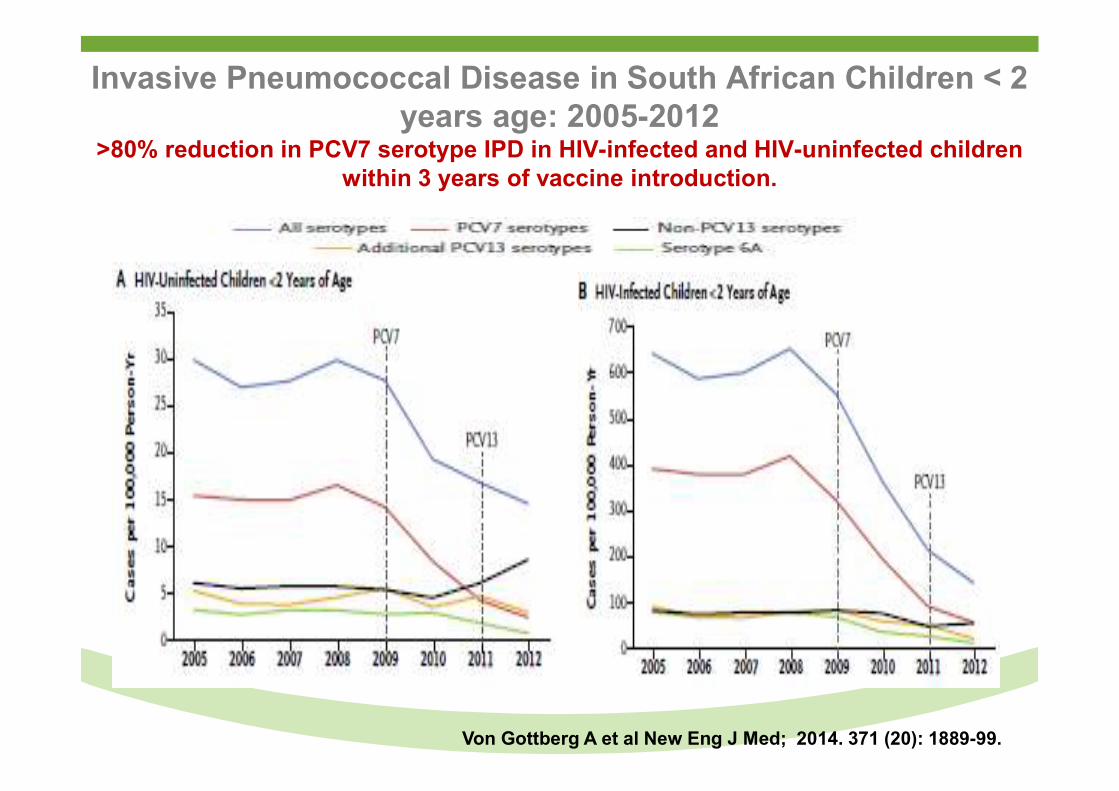
Invasive Pneumococcal Disease in South African Children < 2 years age: 2005-2012
>80% reduction in PCV7 serotype IPD in HIV-infected and HIV-uninfected children within 3 years of vaccine introduction.
Von Gottberg A et al New Eng J Med; 2014. 371 (20): 1889-99.
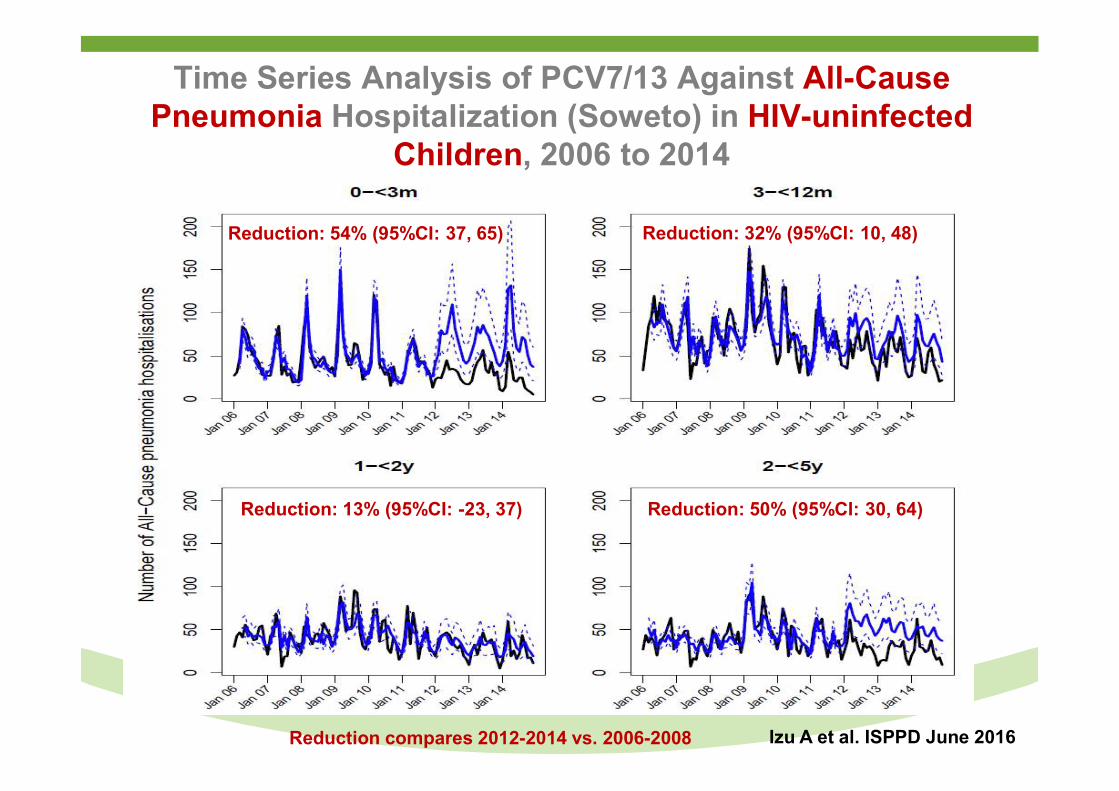
Time Series Analysis of PCV7/13 Against All-Cause Pneumonia Hospitalization (Soweto) in HIV-uninfected
Children, 2006 to 2014
Izu A et al. ISPPD June 2016
Reduction: 54% (95%CI: 37, 65) Reduction: 32% (95%CI: 10, 48)
Reduction: 13% (95%CI: -23, 37) Reduction: 50% (95%CI: 30, 64)
Reduction compares 2012-2014 vs. 2006-2008
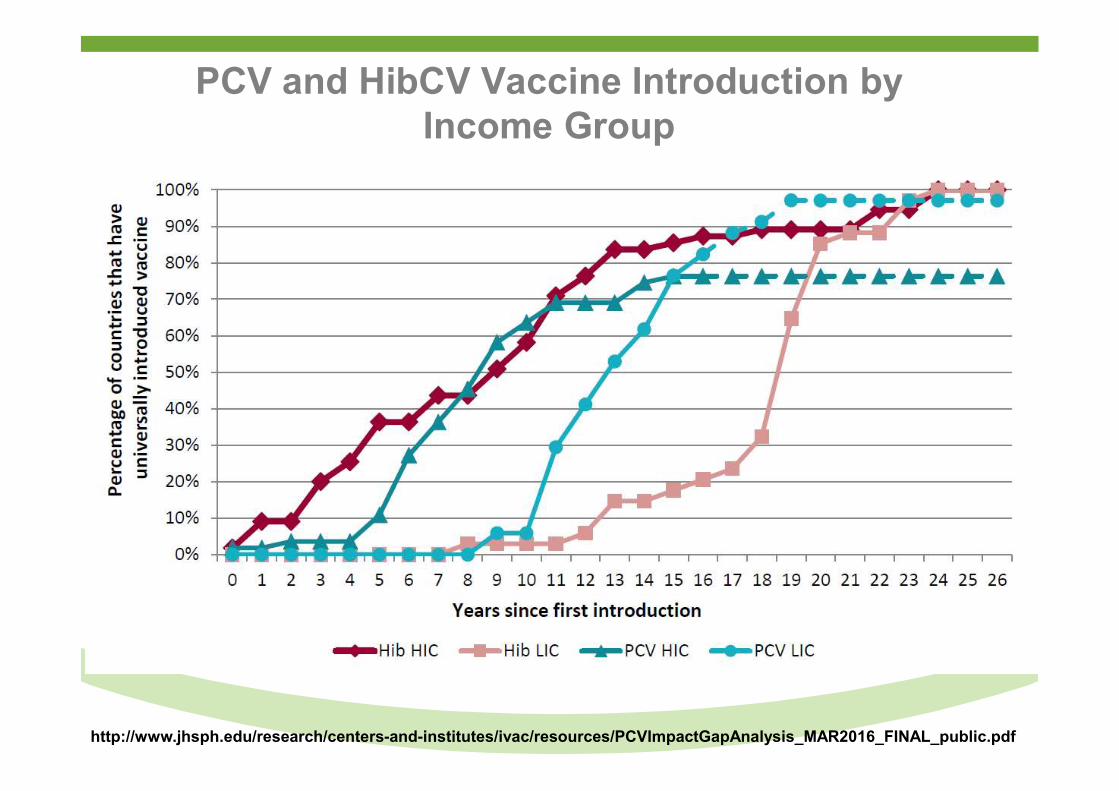
PCV and HibCV Vaccine Introduction by Income Group
http://www.jhsph.edu/research/centers-and-institutes/ivac/resources/PCVImpactGapAnalysis_MAR2016_FINAL_public.pdf
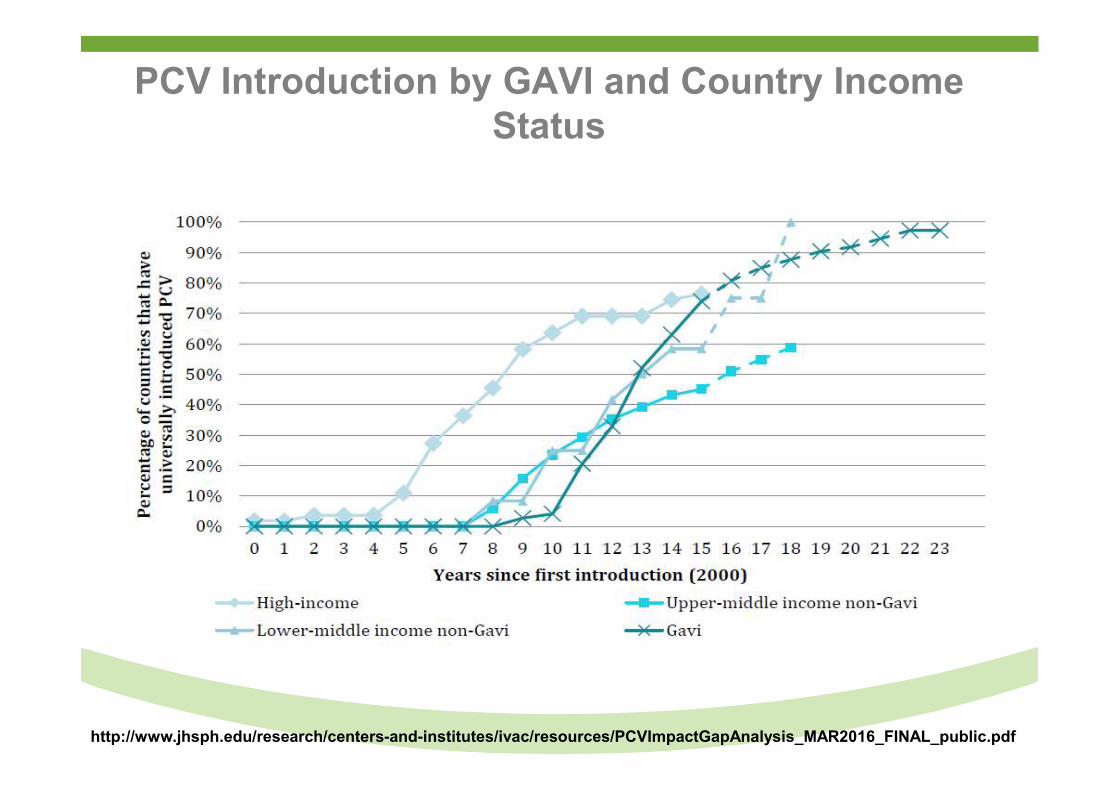
PCV Introduction by GAVI and Country Income Status
http://www.jhsph.edu/research/centers-and-institutes/ivac/resources/PCVImpactGapAnalysis_MAR2016_FINAL_public.pdf
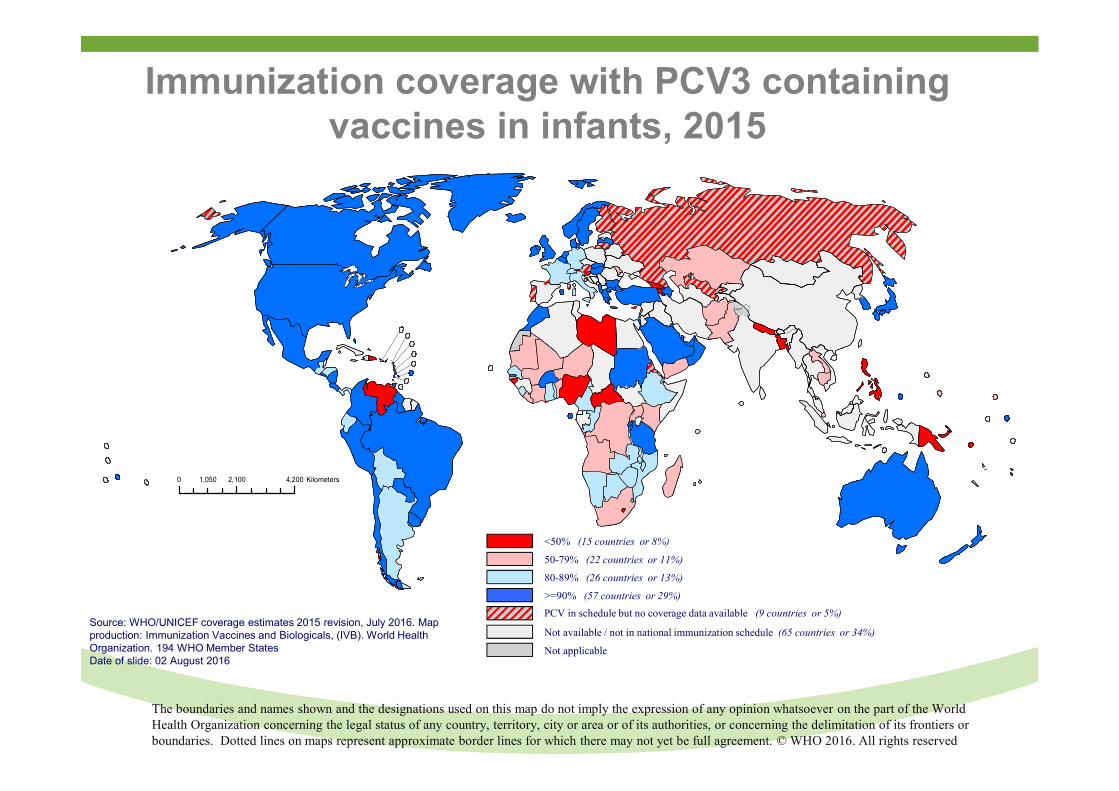
Immunization coverage with PCV3 containing vaccines in infants, 2015
The boundaries and names shown and the designations used on this map do not imply the expression of any opinion whatsoever on the part of the World Health Organization concerning the legal status of any country, territory, city or area or of its authorities, or concerning the delimitation of its frontiers or boundaries. Dotted lines on maps represent approximate border lines for which there may not yet be full agreement. © WHO 2016. All rights reserved
<50% (15 countries or 8%)
50-79% (22 countries or 11%)
80-89% (26 countries or 13%)
>=90% (57 countries or 29%)
Not available / not in national immunization schedule (65 countries or 34%)
Not applicable
PCV in schedule but no coverage data available (9 countries or 5%)Source: WHO/UNICEF coverage estimates 2015 revision, July 2016. Map production: Immunization Vaccines and Biologicals, (IVB). World Health Organization. 194 WHO Member StatesDate of slide: 02 August 2016
0 2,100 4,2001,050 Kilometers
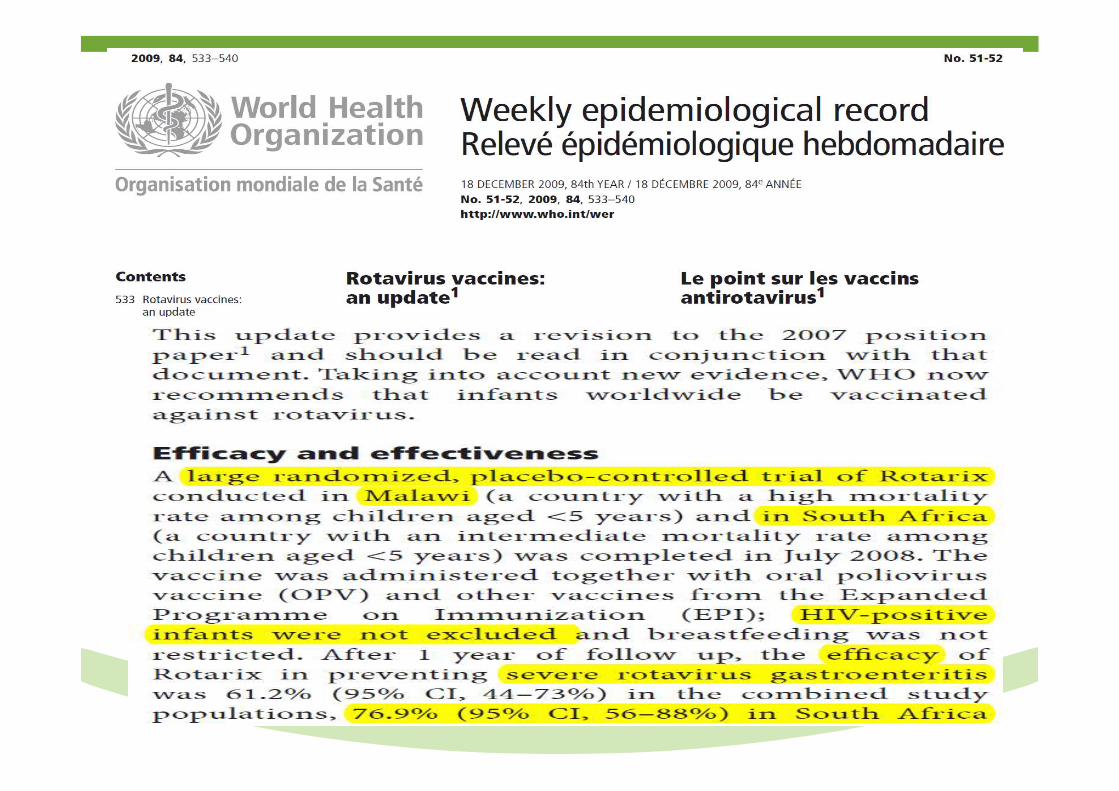
Point estimates of Rotarix* and RotaTeq† vaccine Efficacy in Relation to Country GDP
Nelson EAS & Glass RI, Lancet 2010; 367: 568-9
Possible reasons for lower efficacy in developing countries• High maternal antibody titres• Breastfeeding at vaccination
• Micronutrient deficiencies • Interfering microorganisms
• HIV and malaria
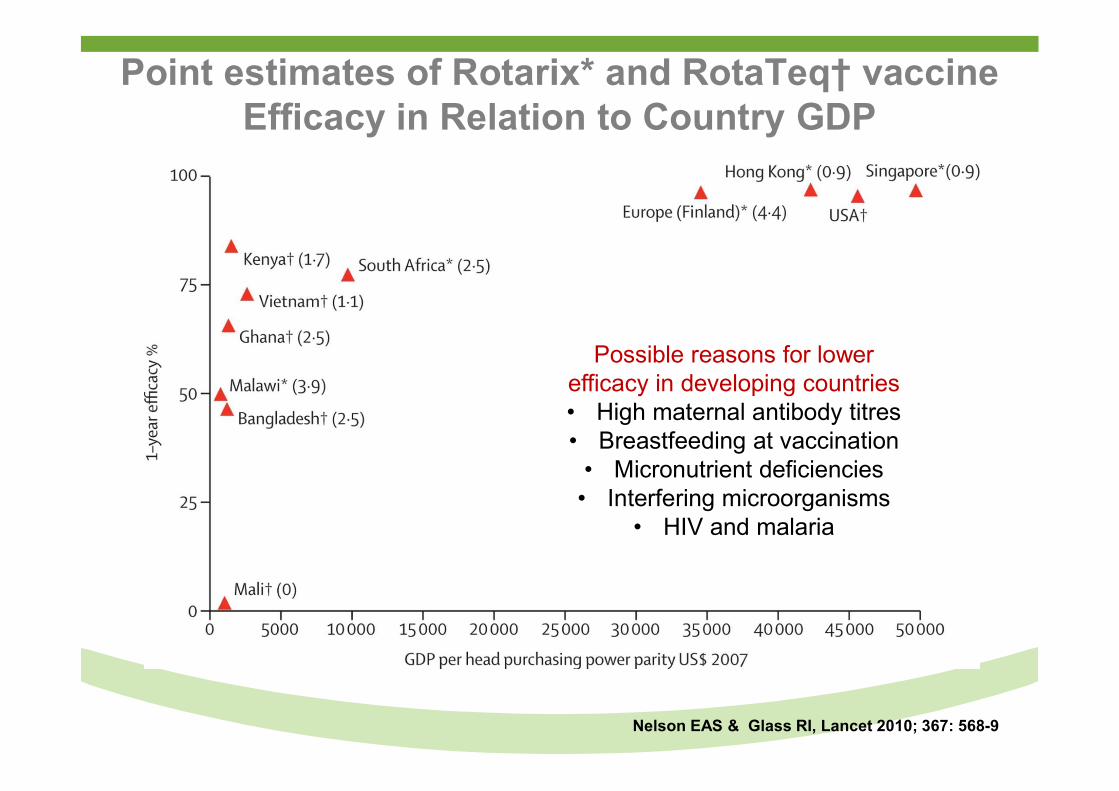
Severe Rotavirus GE Episodes Prevented per 100 children
0
1
2
3
4
5
6
7
8
9
Africa South Africa MalawiSev
ere
rota
viru
s G
E e
pis
od
es p
er 1
00
Placebo
Vaccine
3 episodes prevented
2.5 episodes prevented
3.9 episodes prevented
VE:61.2% 76.9% 49.5%
(44.0 – 73.2) (56.0 – 88.5) (19.2 – 68.3)
Madhi SA, Cunliffe NA et al. NEJM. 2010; 362: 289-298
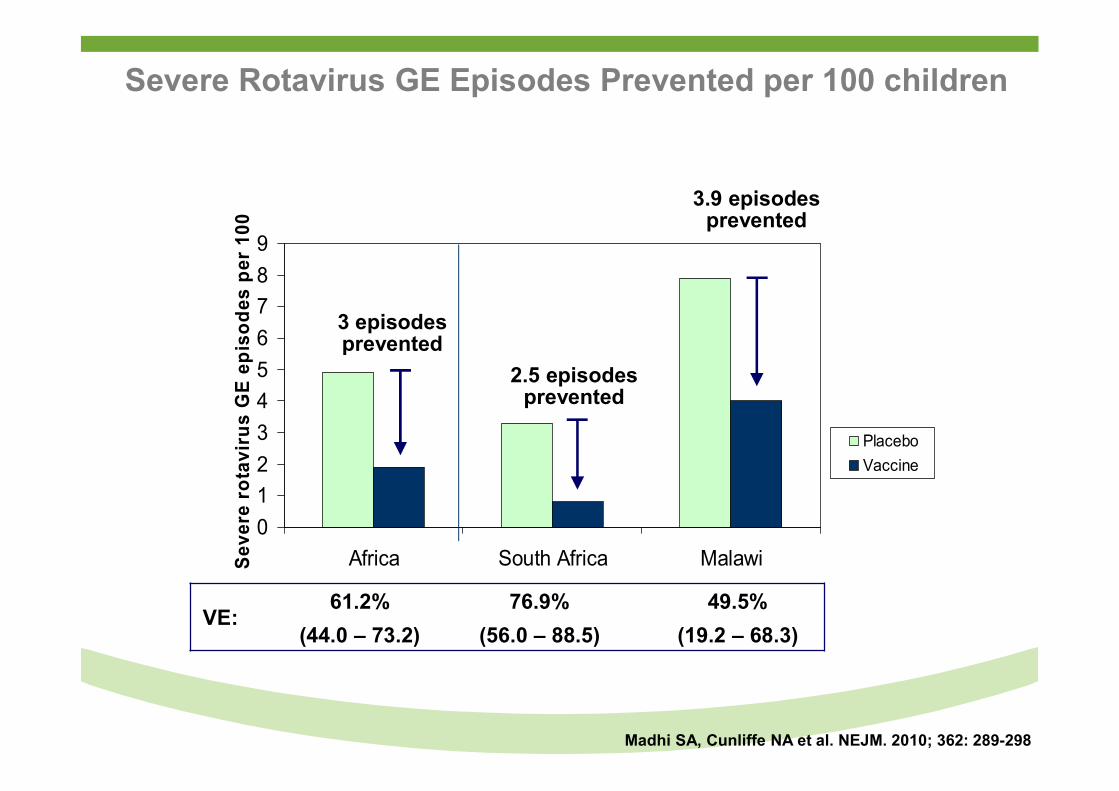
Number of diarrhea-related deaths among children aged <59 months in Mexico by age group; July 2002 to May
2009
Richardson V et al. N Eng J Med 2010; 362; 299-305
41%; 95%CI 36 to 47
29%; 95%CI 17 to 39
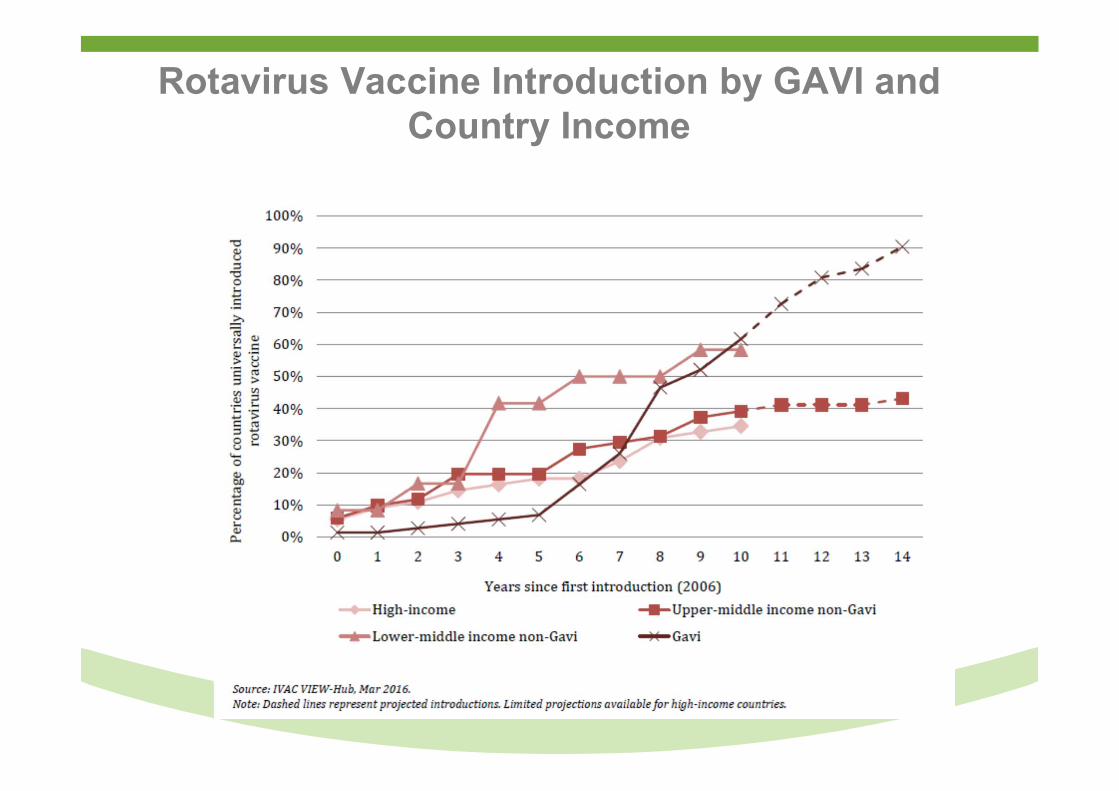
Rotavirus Vaccine Introduction by GAVI and Country Income
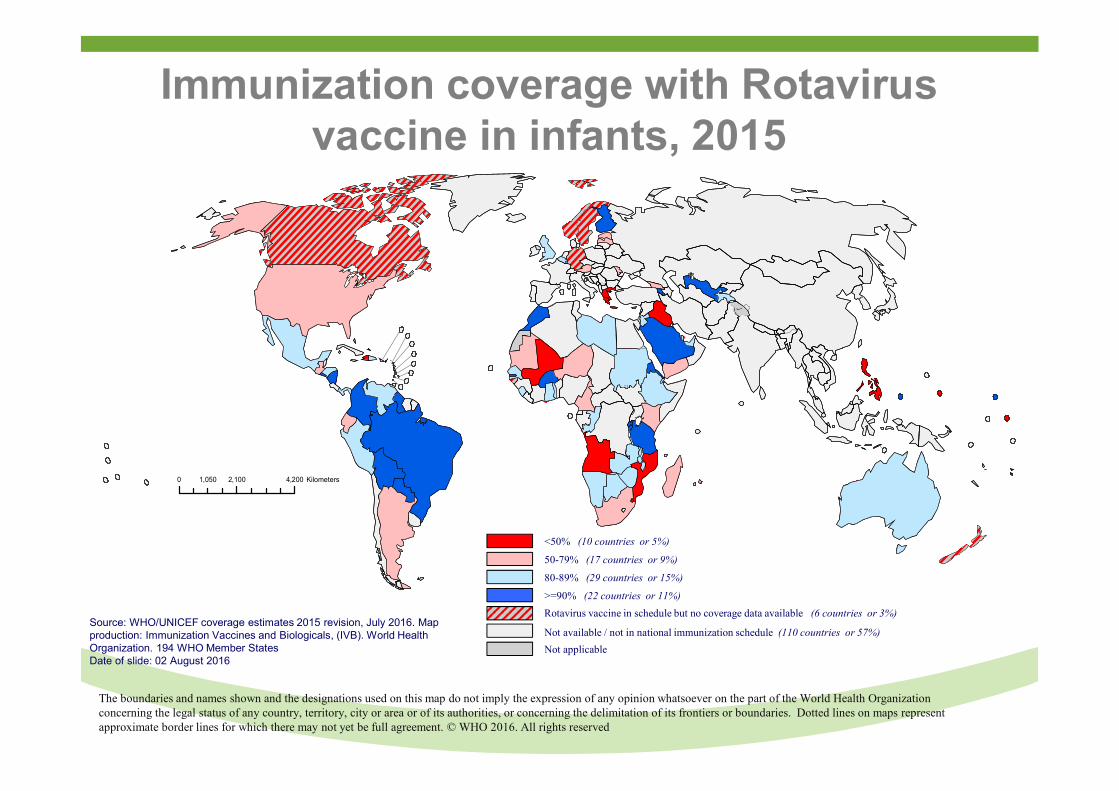
Immunization coverage with Rotavirus vaccine in infants, 2015
The boundaries and names shown and the designations used on this map do not imply the expression of any opinion whatsoever on the part of the World Health Organization concerning the legal status of any country, territory, city or area or of its authorities, or concerning the delimitation of its frontiers or boundaries. Dotted lines on maps represent approximate border lines for which there may not yet be full agreement. © WHO 2016. All rights reserved
<50% (10 countries or 5%)
50-79% (17 countries or 9%)
80-89% (29 countries or 15%)
>=90% (22 countries or 11%)
Not applicable
Rotavirus vaccine in schedule but no coverage data available (6 countries or 3%)
Not available / not in national immunization schedule (110 countries or 57%)Source: WHO/UNICEF coverage estimates 2015 revision, July 2016. Map production: Immunization Vaccines and Biologicals, (IVB). World Health Organization. 194 WHO Member StatesDate of slide: 02 August 2016
0 2,100 4,2001,050 Kilometers
Overview
● Trends in Global and South American under-5 childhood mortality.
● Recent contribution of childhood vaccines in reducing under-5 mortality.
● Potential of new childhood vaccines in reducing under-5 mortality:
Malaria vaccine
● New horizons in reducing under-5/neonatal morbidity and mortality by vaccination.
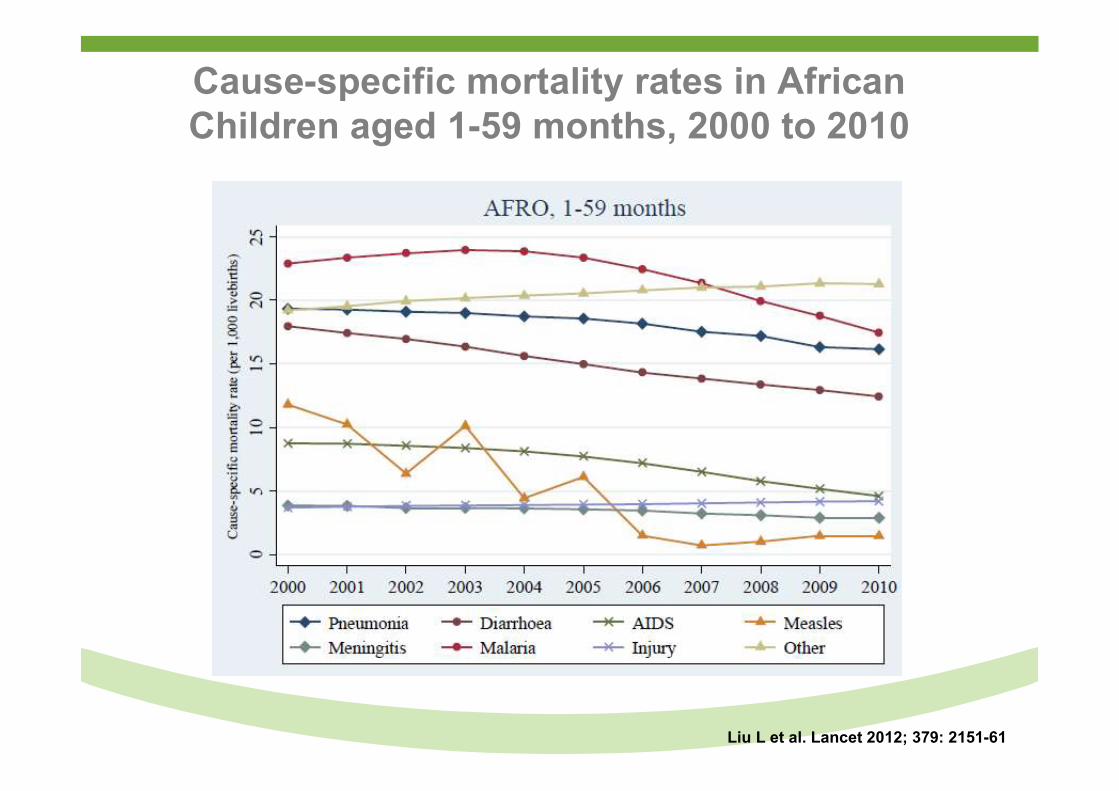
Cause-specific mortality rates in African Children aged 1-59 months, 2000 to 2010
Liu L et al. Lancet 2012; 379: 2151-61
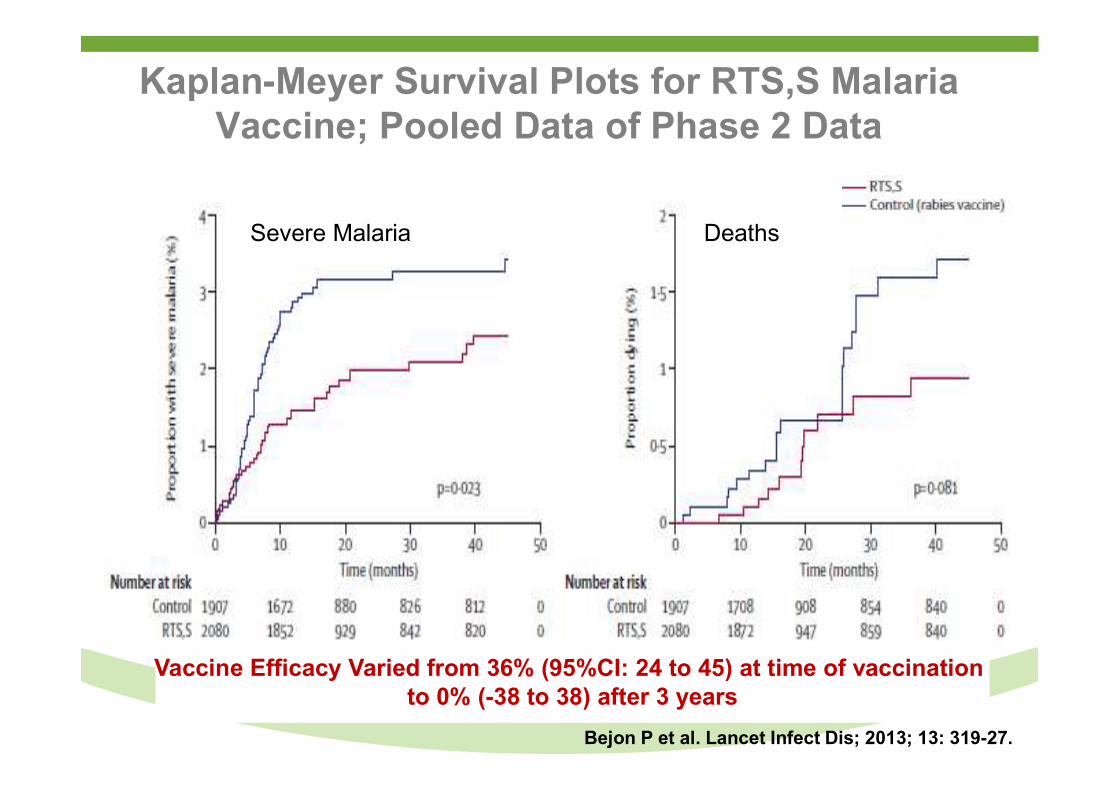
Kaplan-Meyer Survival Plots for RTS,S Malaria Vaccine; Pooled Data of Phase 2 Data
Severe Malaria Deaths
Bejon P et al. Lancet Infect Dis; 2013; 13: 319-27.
Vaccine Efficacy Varied from 36% (95%CI: 24 to 45) at time of vaccination to 0% (-38 to 38) after 3 years
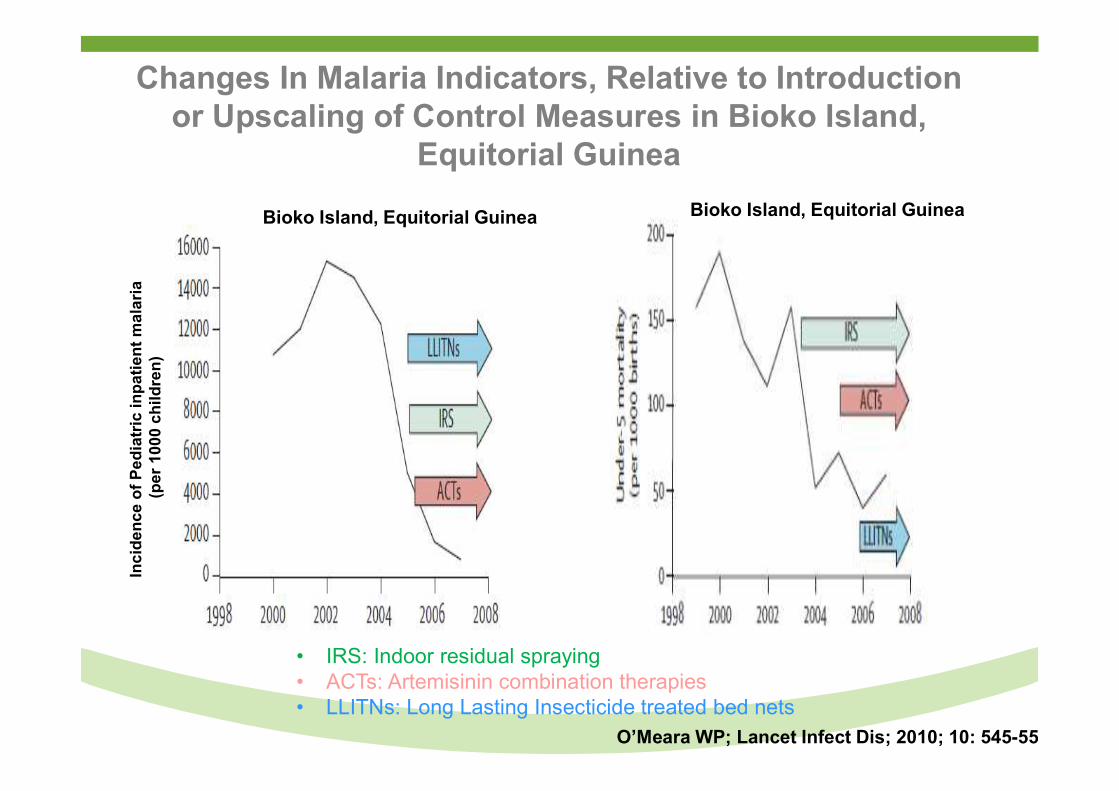
Changes In Malaria Indicators, Relative to Introduction or Upscaling of Control Measures in Bioko Island,
Equitorial GuineaIn
cid
en
ce
of
Pe
dia
tric
inp
ati
en
t m
ala
ria
(p
er
10
00
ch
ild
ren
)
Bioko Island, Equitorial GuineaBioko Island, Equitorial Guinea
• IRS: Indoor residual spraying• ACTs: Artemisinin combination therapies• LLITNs: Long Lasting Insecticide treated bed nets
O’Meara WP; Lancet Infect Dis; 2010; 10: 545-55
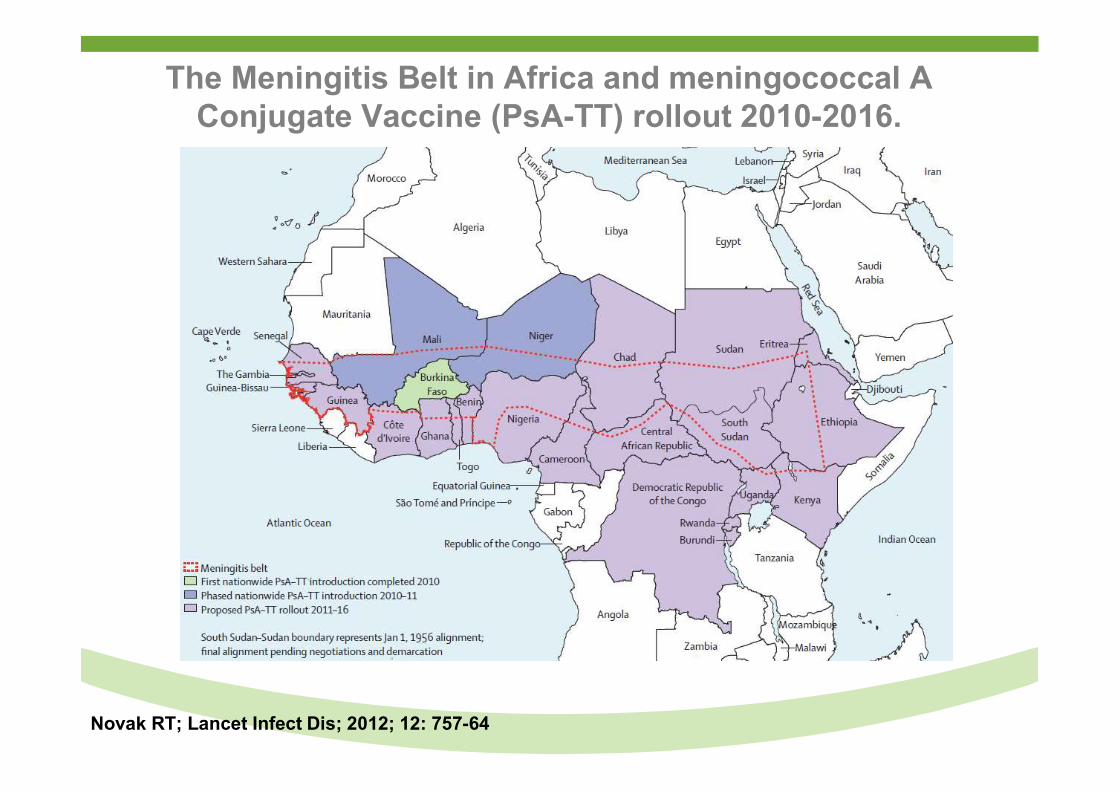
The Meningitis Belt in Africa and meningococcal A Conjugate Vaccine (PsA-TT) rollout 2010-2016.
Novak RT; Lancet Infect Dis; 2012; 12: 757-64
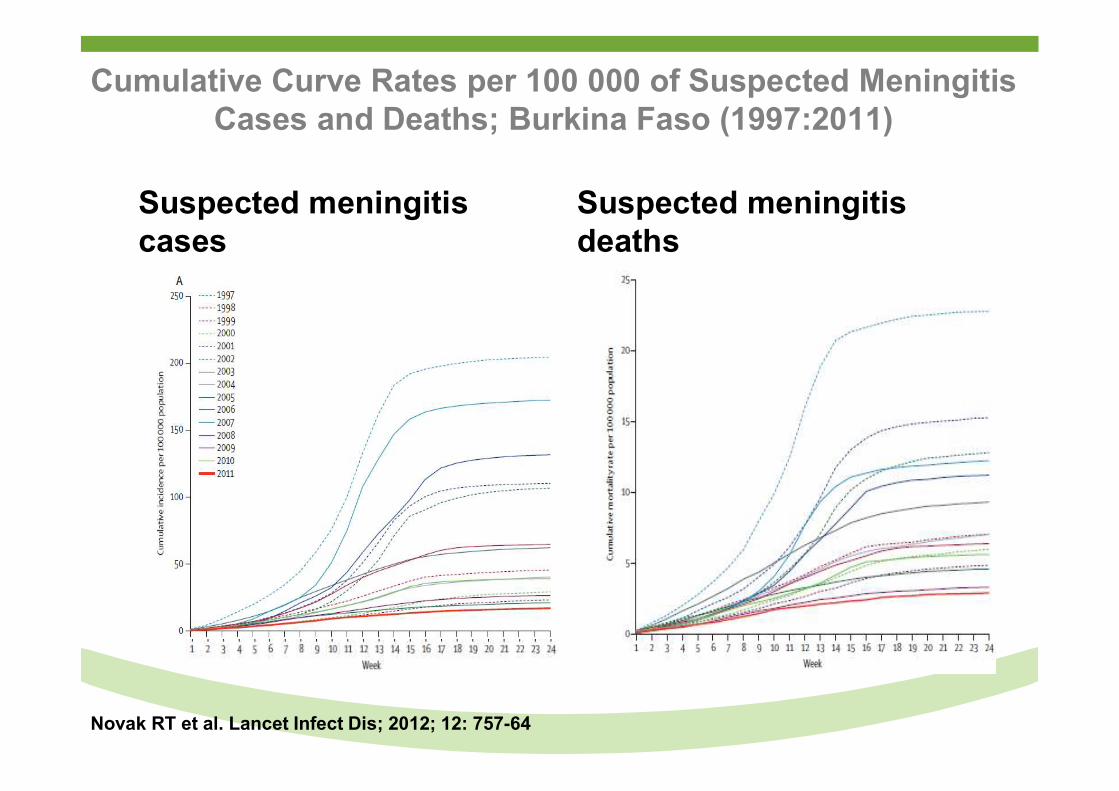
Cumulative Curve Rates per 100 000 of Suspected Meningitis Cases and Deaths; Burkina Faso (1997:2011)
Suspected meningitis cases
Suspected meningitis deaths
Novak RT et al. Lancet Infect Dis; 2012; 12: 757-64
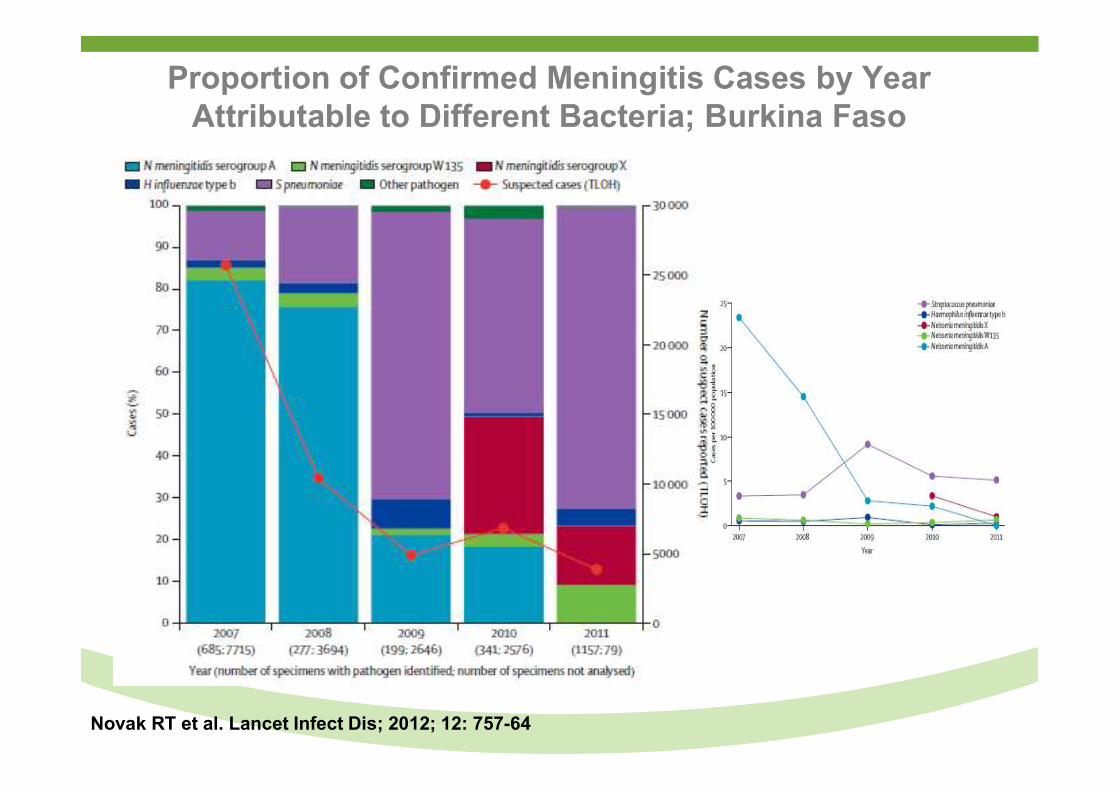
Proportion of Confirmed Meningitis Cases by Year Attributable to Different Bacteria; Burkina Faso
Novak RT et al. Lancet Infect Dis; 2012; 12: 757-64
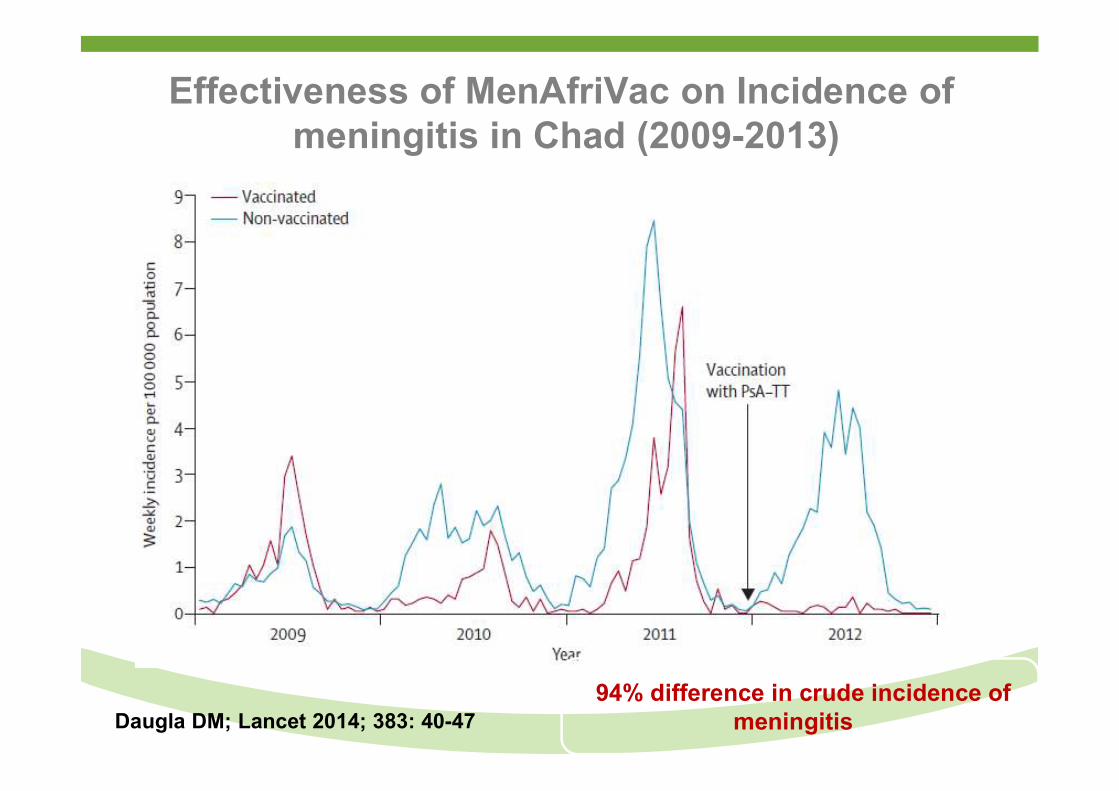
Effectiveness of MenAfriVac on Incidence of meningitis in Chad (2009-2013)
Daugla DM; Lancet 2014; 383: 40-47 94% difference in crude incidence of
meningitis
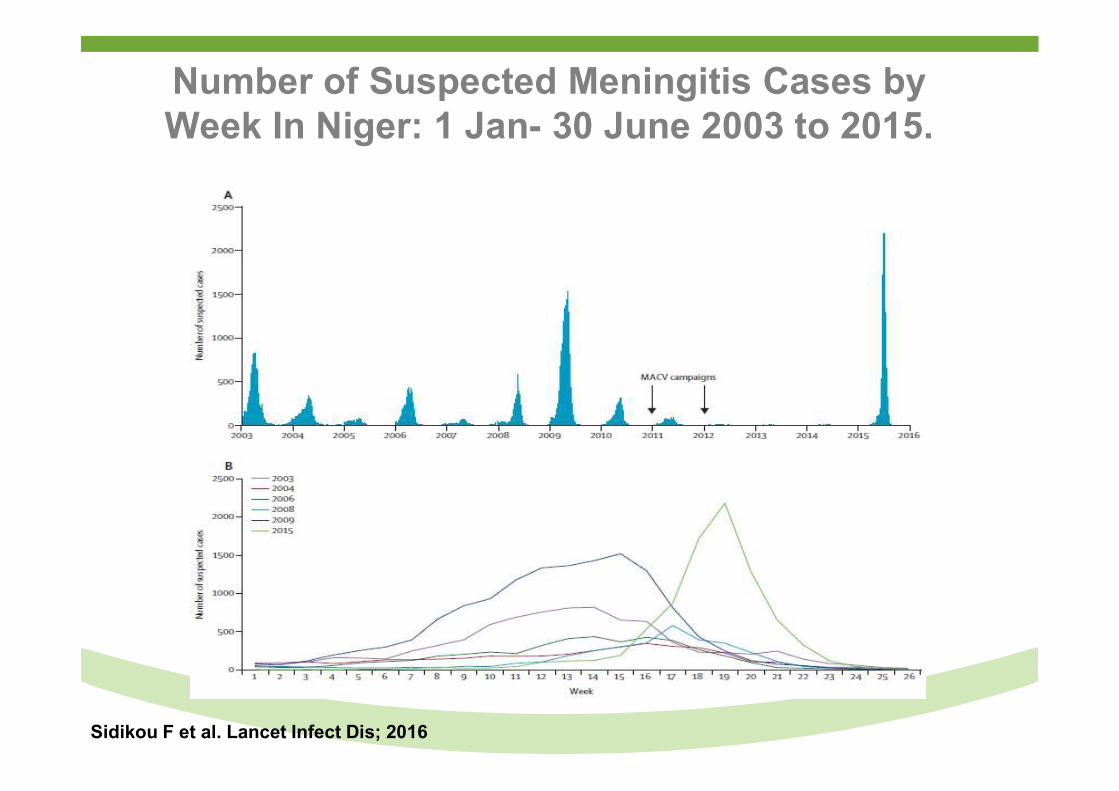
Number of Suspected Meningitis Cases by Week In Niger: 1 Jan- 30 June 2003 to 2015.
Sidikou F et al. Lancet Infect Dis; 2016
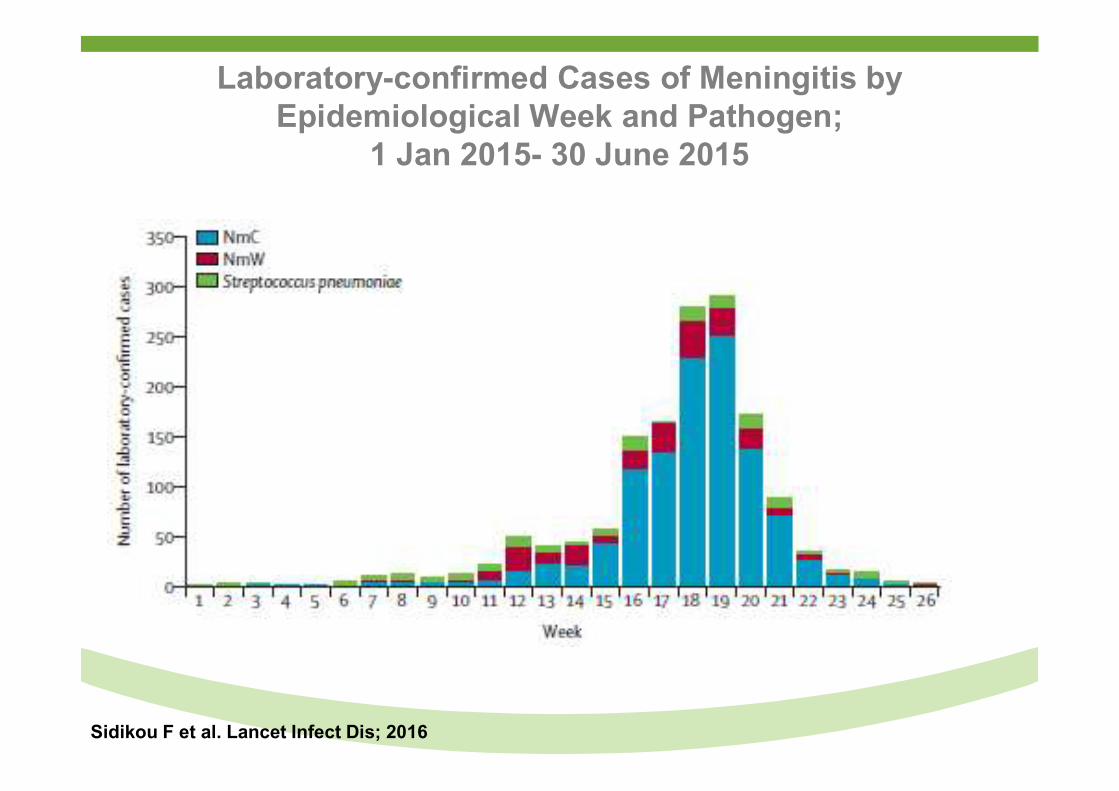
Laboratory-confirmed Cases of Meningitis by Epidemiological Week and Pathogen;
1 Jan 2015- 30 June 2015
Sidikou F et al. Lancet Infect Dis; 2016
Overview
● Trends in Global and South American under-5 childhood mortality.
● Recent contribution of childhood vaccines in reducing under-5 mortality.
● Potential of new childhood vaccines in reducing under-5 mortality.
● New horizons in reducing under-5 (neonatal) morbidity and mortality by vaccination.
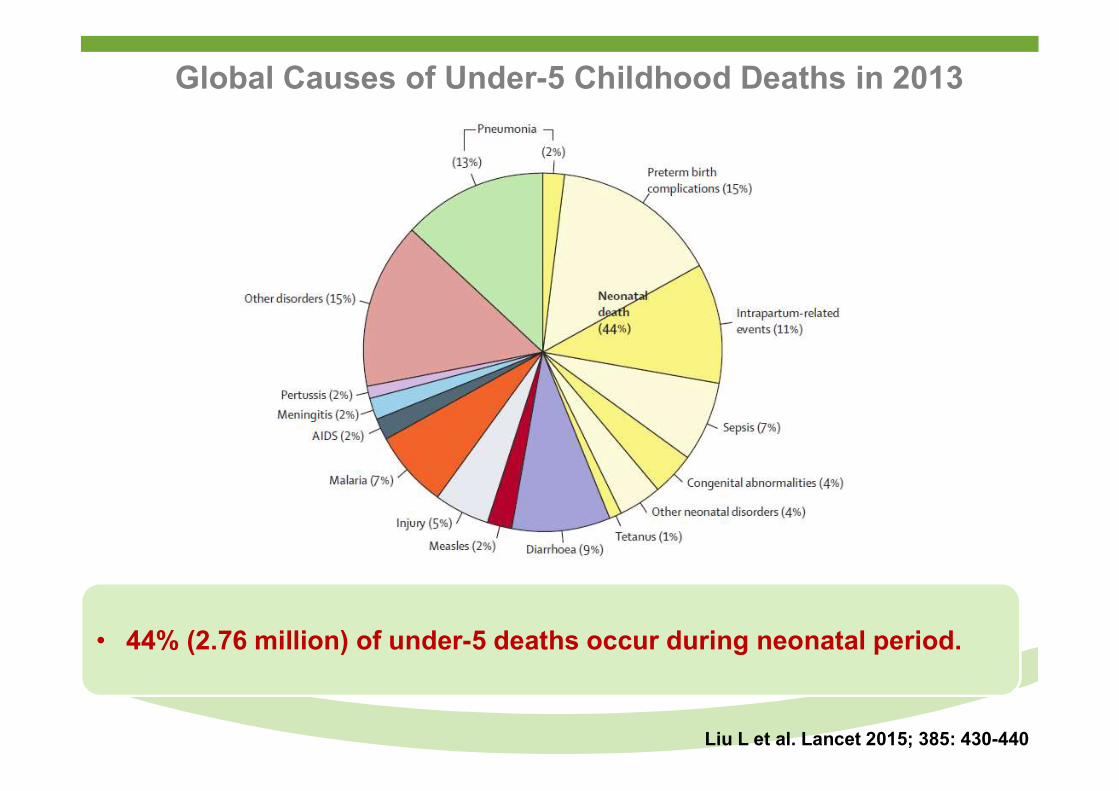
Global Causes of Under-5 Childhood Deaths in 2013
Liu L et al. Lancet 2015; 385: 430-440
• 44% (2.76 million) of under-5 deaths occur during neonatal period.
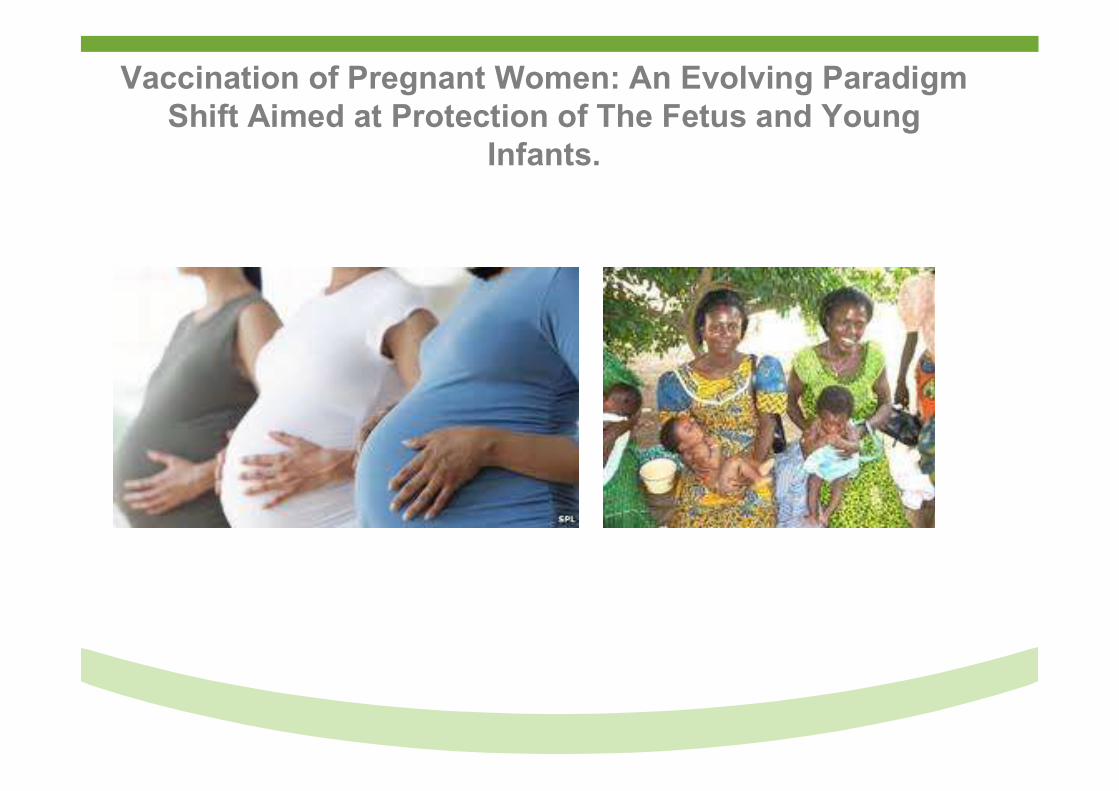
Vaccination of Pregnant Women: An Evolving Paradigm Shift Aimed at Protection of The Fetus and Young
Infants.
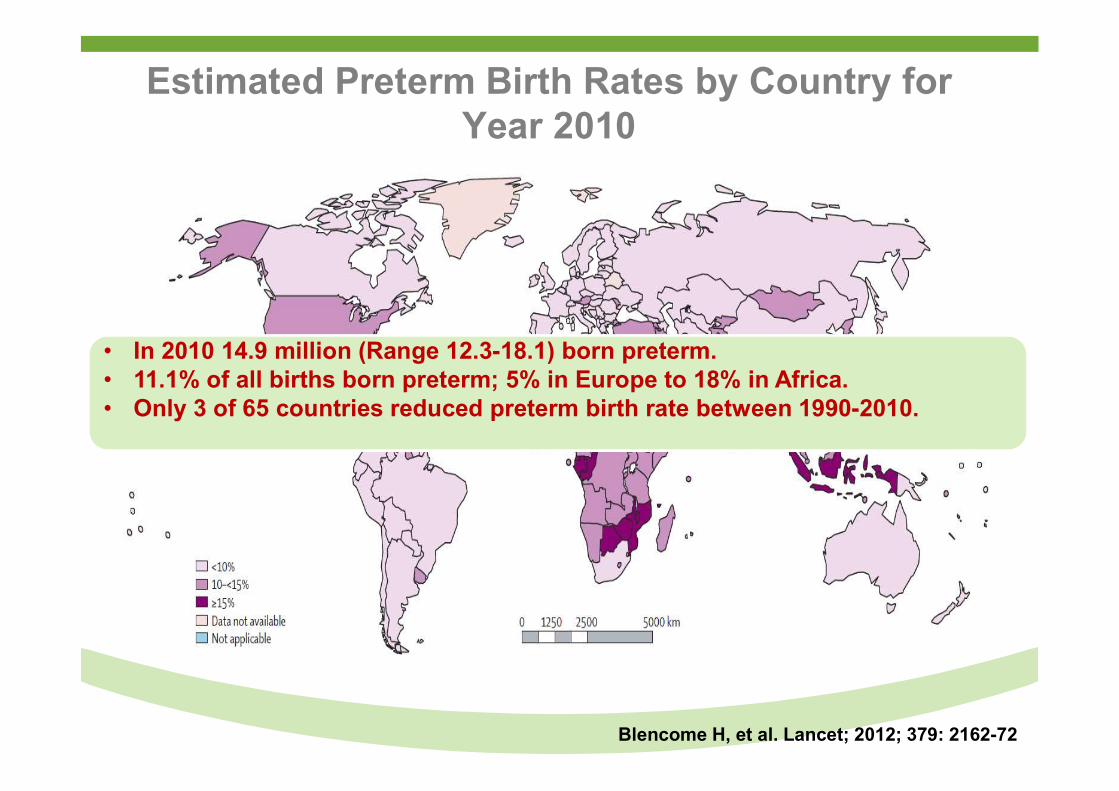
Estimated Preterm Birth Rates by Country for Year 2010
Blencome H, et al. Lancet; 2012; 379: 2162-72
• In 2010 14.9 million (Range 12.3-18.1) born preterm.• 11.1% of all births born preterm; 5% in Europe to 18% in Africa.• Only 3 of 65 countries reduced preterm birth rate between 1990-2010.
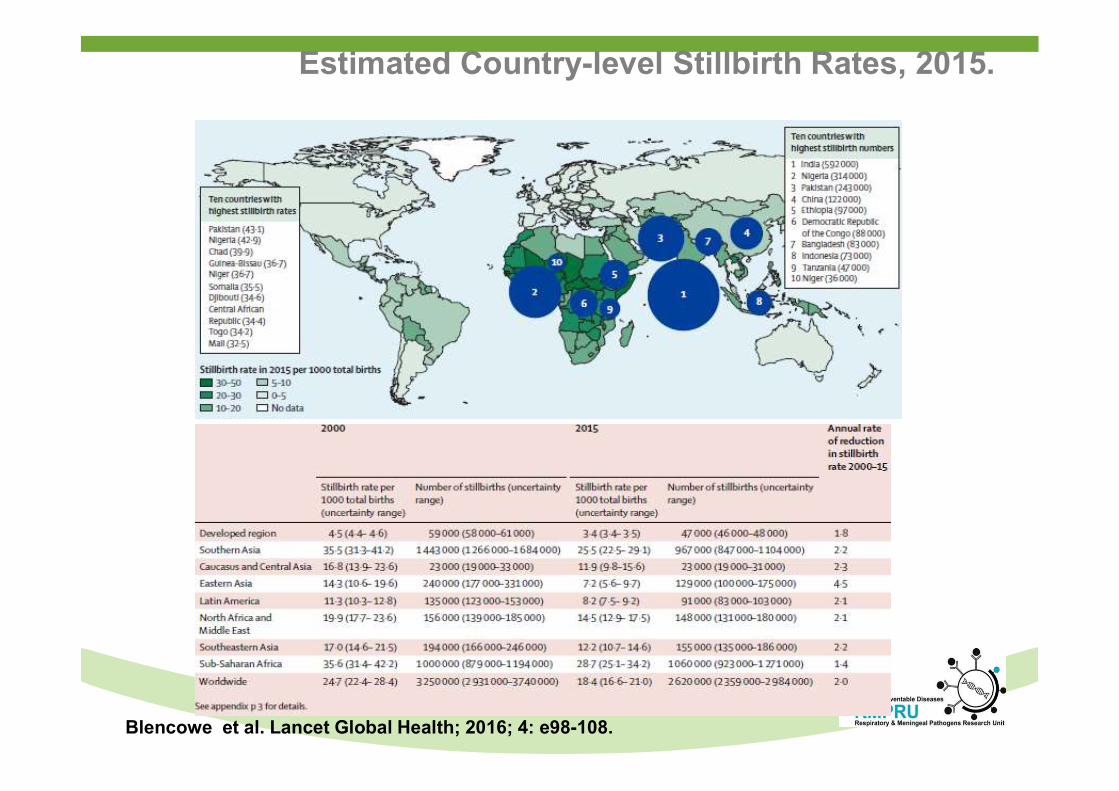
Blencowe et al. Lancet Global Health; 2016; 4: e98-108.
Estimated Country-level Stillbirth Rates, 2015.
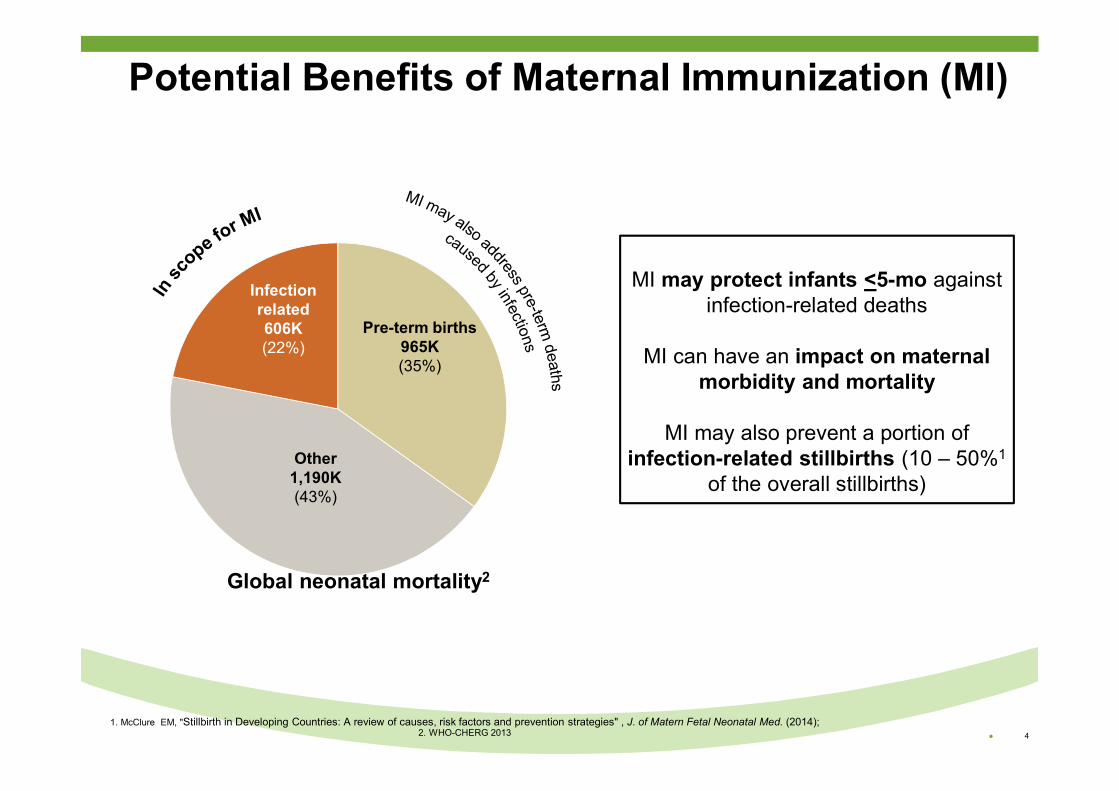
Potential Benefits of Maternal Immunization (MI)
MI may protect infants <5-mo against infection-related deaths
MI can have an impact on maternal morbidity and mortality
MI may also prevent a portion of infection-related stillbirths (10 – 50%1
of the overall stillbirths)
1. McClure EM, "Stillbirth in Developing Countries: A review of causes, risk factors and prevention strategies" , J. of Matern Fetal Neonatal Med. (2014); 2. WHO-CHERG 2013 ● 4
Global neonatal mortality2
Infectionrelated606K(22%)
Pre-term births965K(35%)
Other1,190K(43%)
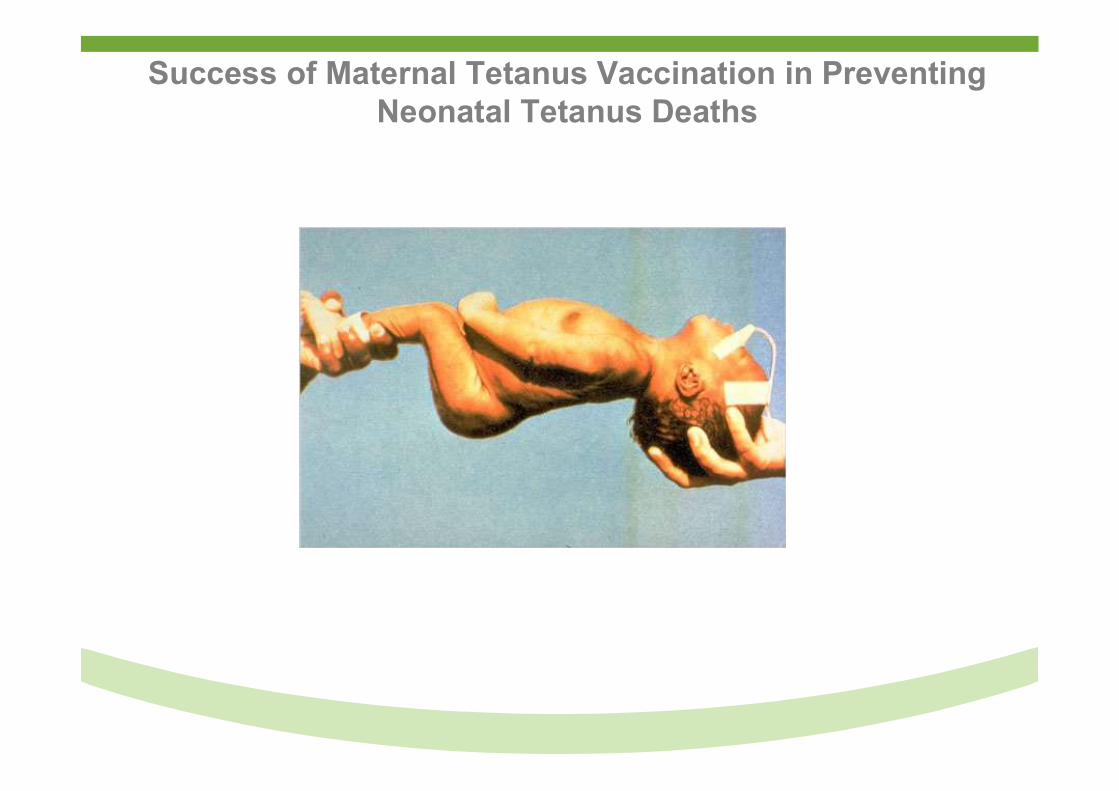
Success of Maternal Tetanus Vaccination in Preventing Neonatal Tetanus Deaths
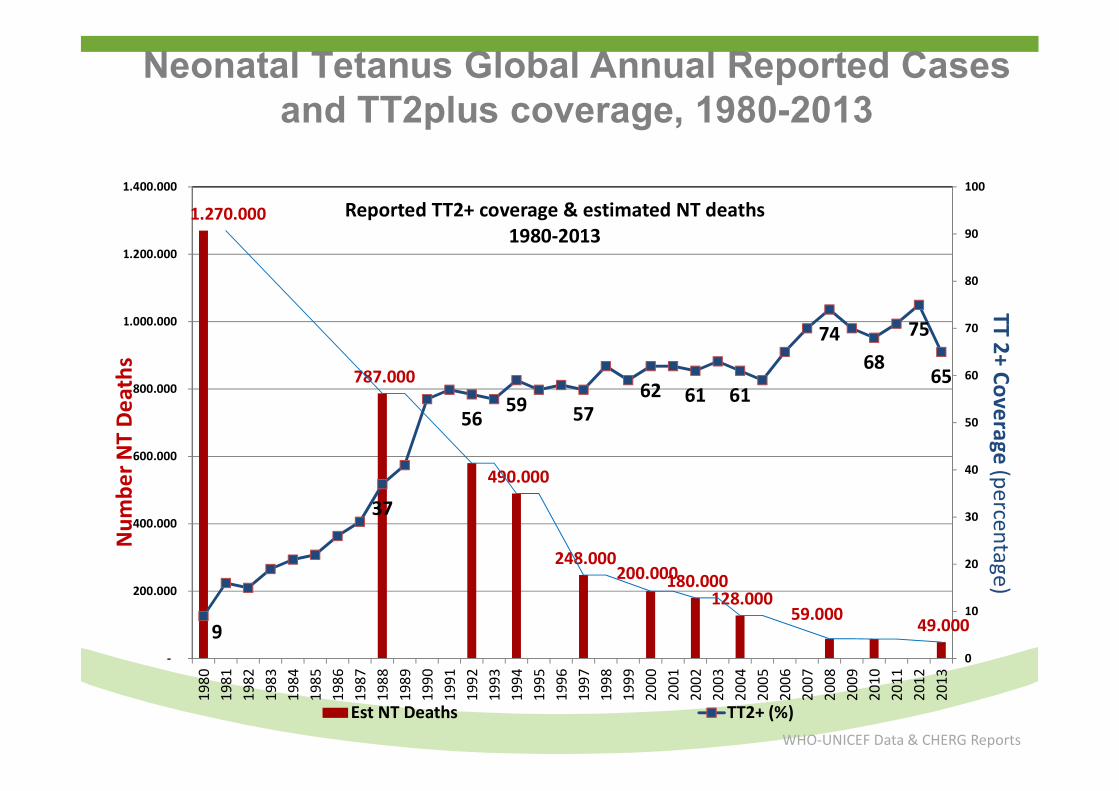
1.270.000
787.000
490.000
248.000 200.000 180.000
128.000 59.000
… 49.000 9
37
5659 57
62 61 61
7468
75
65
0
10
20
30
40
50
60
70
80
90
100
-
200.000
400.000
600.000
800.000
1.000.000
1.200.000
1.400.00019
8019
8119
8219
8319
8419
8519
8619
8719
8819
8919
9019
9119
9219
9319
9419
9519
9619
9719
9819
9920
0020
0120
0220
0320
0420
0520
0620
0720
0820
0920
1020
1120
1220
13
Reported TT2+ coverage & estimated NT deaths1980-2013
Est NT Deaths TT2+ (%)WHO-UNICEF Data & CHERG Reports
TT2+ Coverage (percentage)
Num
ber N
T D
eath
s
Neonatal Tetanus Global Annual Reported Cases and TT2plus coverage, 1980-2013
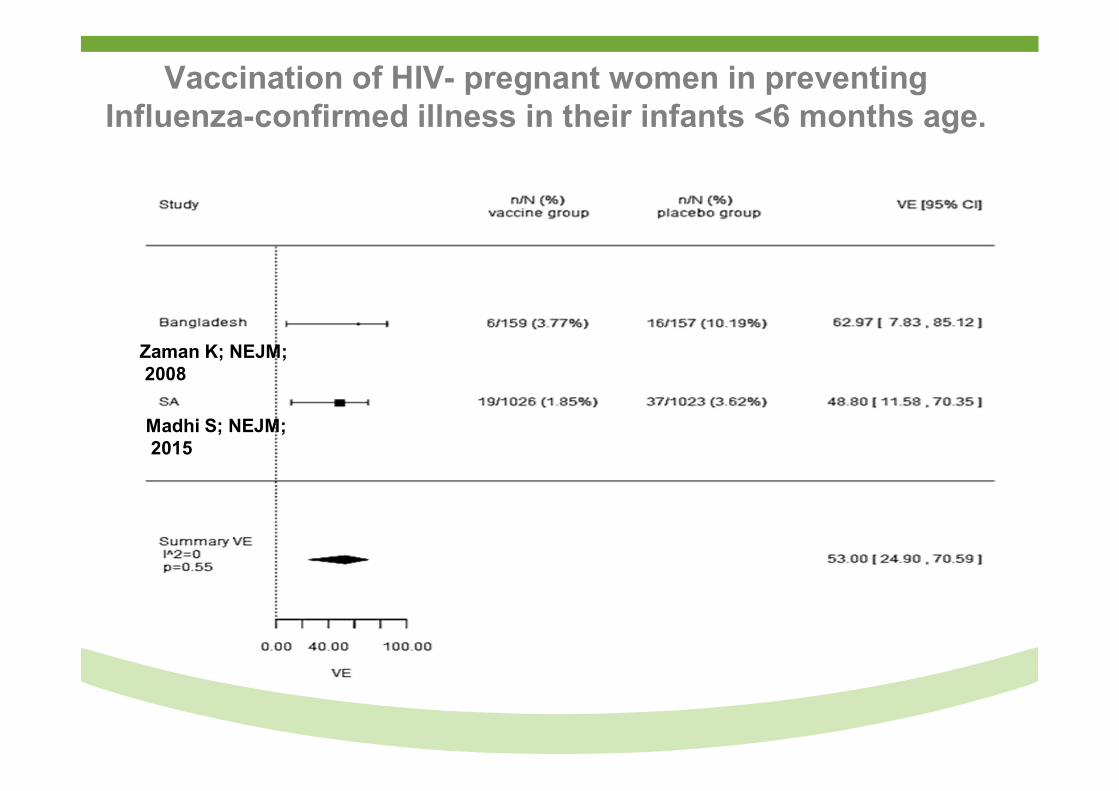
Zaman K; NEJM;2008
Madhi S; NEJM;2015
Vaccination of HIV- pregnant women in preventing Influenza-confirmed illness in their infants <6 months age.
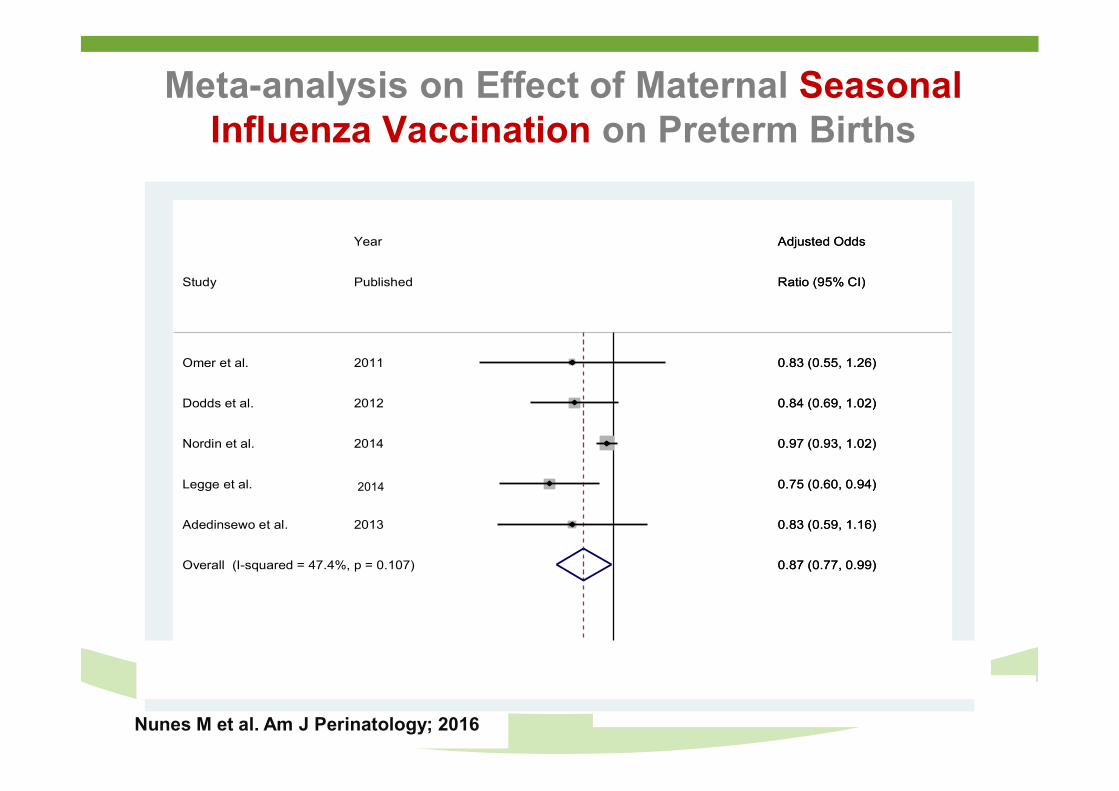
Meta-analysis on Effect of Maternal Seasonal Influenza Vaccination on Preterm Births
Nunes M et al. Am J Perinatology; 2016
Overall (I-squared = 47.4%, p = 0.107)
Adedinsewo et al.
Dodds et al.
Legge et al.
Omer et al.
Nordin et al.
Study
2013
2012
Year
2010-2012
2011
2014
Published
0.87 (0.77, 0.99)
0.83 (0.59, 1.16)
0.84 (0.69, 1.02)
Adjusted Odds
0.75 (0.60, 0.94)
0.83 (0.55, 1.26)
0.97 (0.93, 1.02)
Ratio (95% CI)
0.87 (0.77, 0.99)
0.83 (0.59, 1.16)
0.84 (0.69, 1.02)
Adjusted Odds
0.75 (0.60, 0.94)
0.83 (0.55, 1.26)
0.97 (0.93, 1.02)
Ratio (95% CI)
1.5 .75 1 1.25 1.5 1.75 2
TIV containing or not H1N1 papers not restricted to flu season Preterm
2014
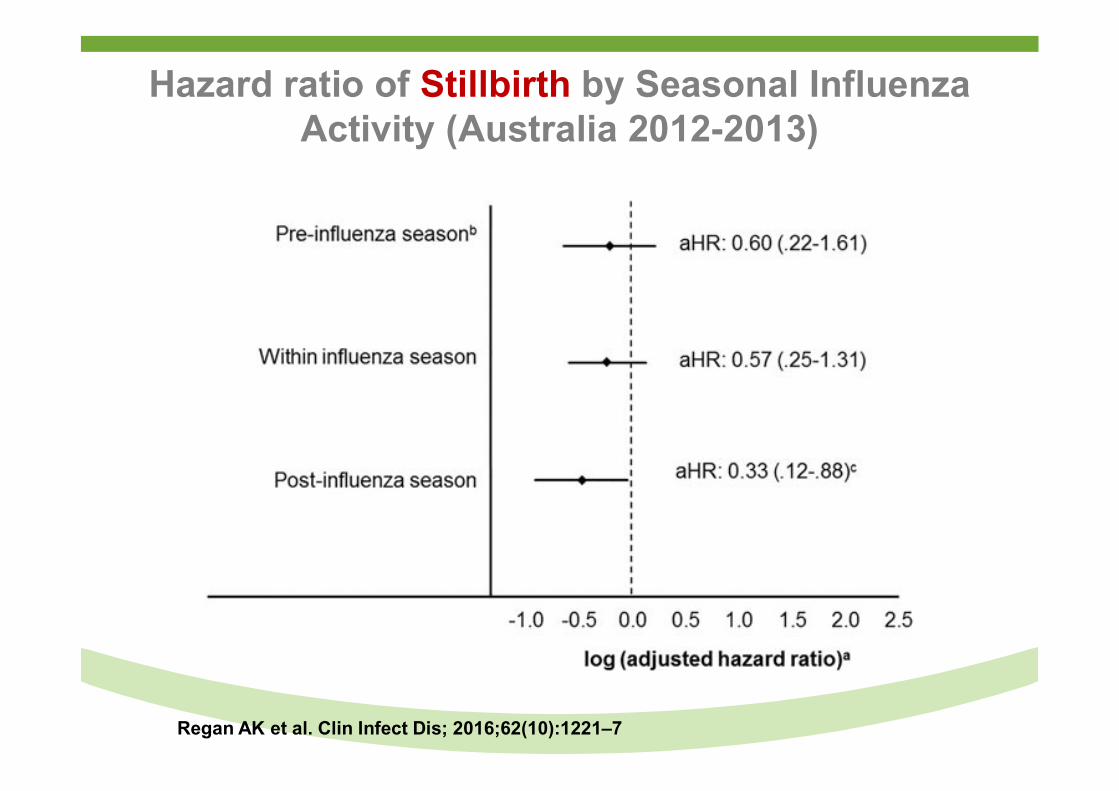
Hazard ratio of Stillbirth by Seasonal Influenza Activity (Australia 2012-2013)
Regan AK et al. Clin Infect Dis; 2016;62(10):1221–7
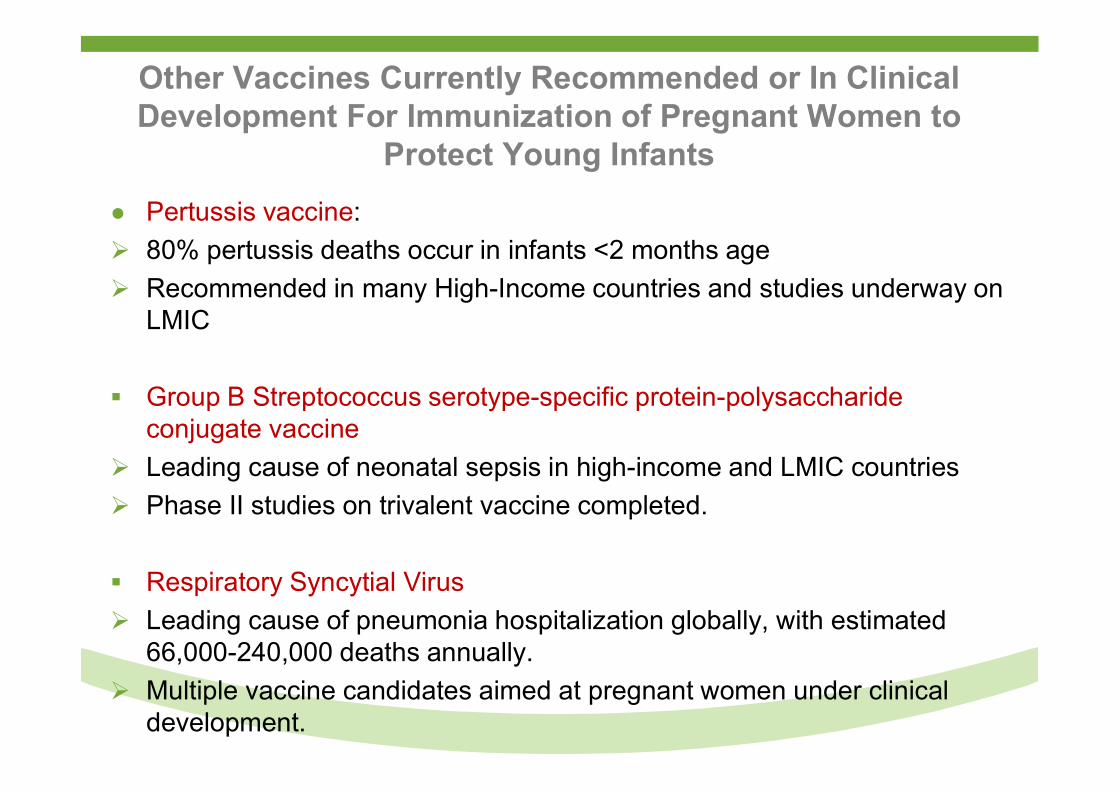
Other Vaccines Currently Recommended or In Clinical Development For Immunization of Pregnant Women to
Protect Young Infants
● Pertussis vaccine:
80% pertussis deaths occur in infants <2 months age
Recommended in many High-Income countries and studies underway on LMIC
Group B Streptococcus serotype-specific protein-polysaccharide conjugate vaccine
Leading cause of neonatal sepsis in high-income and LMIC countries
Phase II studies on trivalent vaccine completed.
Respiratory Syncytial Virus
Leading cause of pneumonia hospitalization globally, with estimated 66,000-240,000 deaths annually.
Multiple vaccine candidates aimed at pregnant women under clinical development.
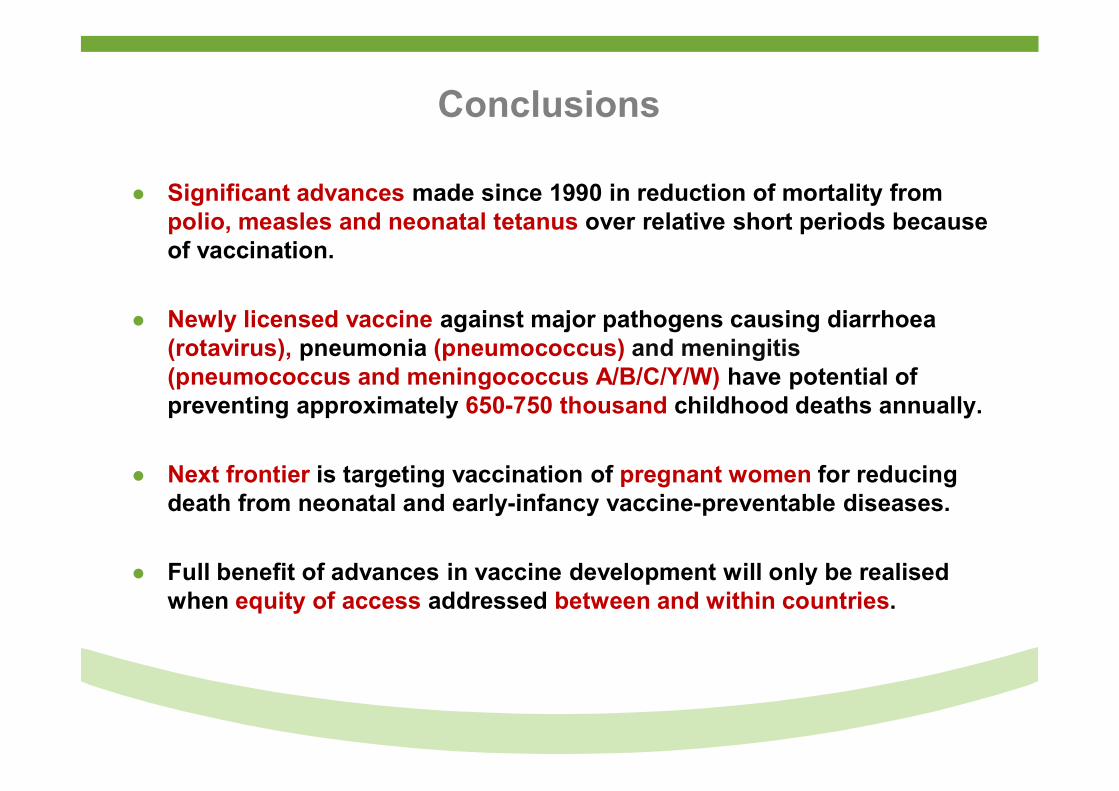
Conclusions
● Significant advances made since 1990 in reduction of mortality from polio, measles and neonatal tetanus over relative short periods because of vaccination.
● Newly licensed vaccine against major pathogens causing diarrhoea (rotavirus), pneumonia (pneumococcus) and meningitis (pneumococcus and meningococcus A/B/C/Y/W) have potential of preventing approximately 650-750 thousand childhood deaths annually.
● Next frontier is targeting vaccination of pregnant women for reducing death from neonatal and early-infancy vaccine-preventable diseases.
● Full benefit of advances in vaccine development will only be realised when equity of access addressed between and within countries.

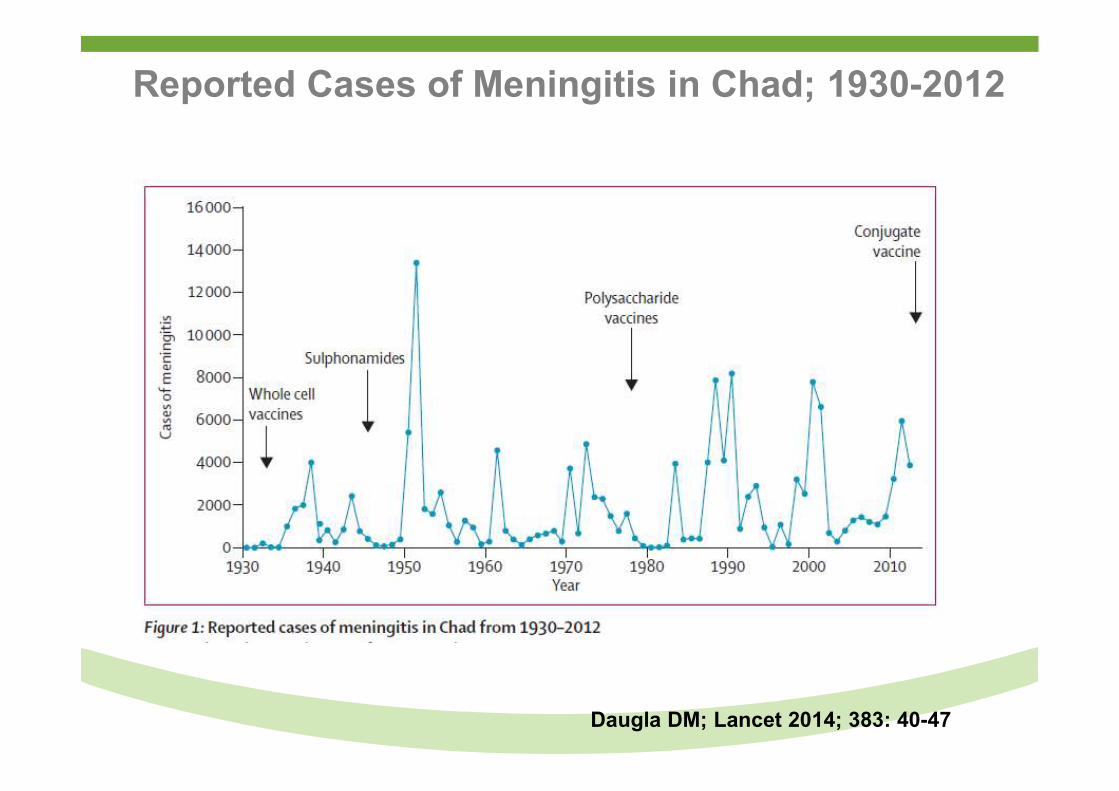
Reported Cases of Meningitis in Chad; 1930-2012
Daugla DM; Lancet 2014; 383: 40-47