progress in lidar altimeter remote sensing … · progress in lidar altimeter remote sensing of...
TRANSCRIPT

PROGRESS IN LIDAR ALTIMETER REMOTE SENSING OF STAND STRUCTUREIN DECIDUOUS AND CONIFEROUS FORESTS USING SLICER DATA.
Michael A. Lefsky1, David J. Harding2, Geoffery G. Parker3 ,Warren B. Cohen1 , Steven A. Acker4
1Pacific Northwest Experiment Station3200 SW Jefferson Way
Corvallis, OR 97331, USA
2Laboratory for Terrestrial PhysicsNASA’s Goddard Space Flight Center
Greenbelt MD 20771, USA
3Smithsonian Environmental Research CenterP.O. Box 28
Edgewater, MD 21037, USA
4Oregon State University, Department of Forest Science3200 SW Jefferson Way
Corvallis, OR 97331, USA
KEY WORDS: Lidar, forest structure, biomass, canopy.
ABSTRACT
Large footprint, waveform sampling lidar altimetry has a number of benefits over traditional, small footprint, single return laseraltimetry for the remote sensing of forest structure. Nevertheless, its application has been impeded by a lack of 1) algorithms forconverting the lidar data to biophysical measurements, 2) validation of the resulting measurements, and 3) applicationsdemonstrating the utility of the measurements. Over the course of the last five years, we have developed algorithms and softwarepackages for the extraction of height, cover, canopy height profile and light transmittance related measurements, and validated themusing field measurements in two contrasting forested ecosystems: eastern deciduous forests in Maryland and North Carolina, USA;and western coniferous Douglas-fir/western hemlock forests at H.J. Andrews Experimental Forest, Oregon, USA. In both systems,field measurements of forest height and cover were accurately estimated by the lidar measurements. In eastern deciduous forest,SLICER was able to accurately predict canopy height profiles, ie. the vertical distribution of foliage. In addition, estimates of thevertical distribution of PAR transmittance derived from the lidar measurements matched field measurements, in terms of the heightand rate of change in transmittance, in both systems. Interpretative methods to describe canopy structure have ranged from simpleestimates of the total height and mean height of the canopy, to a complex method describing the entire three-dimensional distributionof canopy elements (canopy volume method). These basic measurements of the physical structure of the canopy have been used topredict a wide range of forest stand structure attributes, including basal area, aboveground biomass, leaf area index, mean andstandard deviation of tree diameters at breast height, and density of large individuals. The ability of lidar to predict these variable hasbeen very good, as compared with non-lidar remotely sensed estimates, with coefficients of determination usually in excess of 80%of variance explained. Through this work, the utility of waveform sampling lidar altimetry has been established, and theimpediments to its use have been substantially decreased.
1. INTRODUCTION
Characterization of canopy structure is a major challenge inremote sensing, particularly for moderate to high biomassforests. A new class of instruments, referred to here as lidaraltimeters, developed at NASA’s Goddard Flight Space Center(Bufton, 1989; Blair et al., 1994; 1997) have demonstrated apotential to greatly improve remotely sensed estimates ofimportant aspects of canopy structure. These devices measurethe vertical distribution of canopy structure directly using the
principles of laser altimetry. The capability of traditional laseraltimeters, that measure a single range to a target, is expandedby recording the laser backscatter amplitude with very hightemporal resolution. The approach yields a measure of theheight distribution of illuminated surfaces within the laserfootprint. Recent work has demonstrated that this measure canbe used to accurately predict both the total biomass (Lefsky,1997; Lefsky et al., 1999a; Means et al., 1999; Lefsky 1999b)and variability of forest structure (Lefsky, 1999b) over a largerange of biomass. In this paper, the measurement principles oflidar altimeters as applied to canopies and a review of several

validations of their ability to measure various aspects of canopystructure and forest stand structure are presented.
This description and validation of the SLICER (Scanning LidarImager of Canopies by Echo Recovery) canopy measurementsprovides a summary for the use of SLICER data in studies offorest canopy structure, including the work of Harding et al.(1994; 1995), Lefsky (1997), Lefsky et al., (1999a; 1999b),Harding (1998), Drake and Weishampel (1998), Means et al.,(1999), and Rodriguez et al., (in review) and for future studies.The principles developed here also apply to canopy lidar databeing acquired by the airborne Lidar Vegetation ImagingSystem (LVIS) and to be acquired by the spaceborneVegetation Canopy Lidar (VCL). LVIS is a wide-swath,mapping system developed at GSFC that has supersededSLICER (Blair et al., 1999). VCL, scheduled for launch in2000, is expected to inventory canopy height and structure overapproximately 5% of the Earth’s land surface between ±68°during its 2 year mission (Dubayah et al., 1997).
2. SLICER BACKGROUND
The SLICER airborne lidar altimeter system consists of aranging component and ancillary instrumentation forgeolocation. The ranging component consists of a lasertransmitter, scan mechanism, receiver telescope, detector,timing electronics, waveform digitizer, and an instrumentcontrol and data collection system. The ranginginstrumentation is augmented by an Inertial Navigation Systemfor precise determination of laser beam pointing, GPS receiversfor differential, kinematic determination of aircraft position,and video equipment for image documentation of the groundtrack. Integration of the ranging data with laser beam pointingand aircraft position yields a position and elevation for eachlaser pulse return with respect to a geodetic reference frame.Key aspects of the SLICER system are reviewed below;complete documentation of the instrumentation and dataproducts is provided in Harding et al., (In Review). SLICERdata sets available for public distribution are describedat http://denali.gsfc.nasa.gov/lapf.
Several aspects of the SLICER design make it a powerful toolfor characterizing canopy vertical structure. The combinationof a very narrow transmit pulse and a high-speed detectorresults in exceptional vertical resolution, allowing closelyspaced canopy layers and the underlying ground within eachfootprint to be distinguished. Use of a very high-speeddigitizer results in a non-aliased waveform record ofbackscatter energy that has extremely good vertical sampling,necessary for full analysis of waveform structure. SLICERevolved from a profiling lidar altimeter described by Blair etal., (1994) by the addition of a scanning mechanism. Byscanning the laser footprints across the flight path a narrowswath results which provides both cross- and along-trackinformation on canopy heterogeneity and ground slope beneaththe canopy. SLICER employs a high power laser that enables asignificantly higher flight altitude than is typical used byairborne laser altimeters, yielding larger footprints (nominally
10 m but as large as 70 m) that are contiguous or evenoverlapped. The larger footprints thus fully illuminate thecanopy, providing a measure of average canopy structure thatavoids the sampling bias inherent to small footprint altimeters.The canopy in these large footprints typically contains someopenings at nadir to the ground thus consistently yielding aground return and enabling a measure of vegetation height foreach laser pulse. In addition, the high flight altitude minimizesthe variation in footprint size and received backscatter energycaused by changes in ranging distance due to topographicrelief, thus simplifying data interpretation. Accurate pointingand position knowledge, and associated geolocation software,enable accurate determination of the location of each footprintso that the lidar data can be directly correlated with groundobservations and remote sensing images. SLICER’s controlsystems and operational modes were designed to be flexible sothat the effect of variations in footprint size, spacing andvertical sampling on characterization of canopy structure couldbe evaluated.
Several implications of the instrument characteristics aresignificant for proper use of the SLICER data. First, the laserillumination across the swath is not uniform and thus canopystructure across the swath is sampled unequally. The pattern ofcircular, approximately contiguous footprints that each have aradial, Gaussian distribution of laser energy yields a swathillumination that is analogous to an inverted egg carton.Second, the backscatter amplitude recorded in the waveform isnot an absolute measure of reflected laser energy. The transferfunction between optical energy received by the instrument (i.e.backscattered photons) and the resulting digital countamplitude in the waveform is unknown due to uncalibratedinstrument parameters. The transfer function varies spatially, asa function of beam position across the swath, and temporally onmultiple time-scales, as a function of operating conditions.Thus, the amplitudes of waveforms can not be compared in anabsolute sense. The waveform can only be used as a relativemeasure of the height distribution of backscattered energywithin an individual footprint.
Third, SLICER utilizes a threshold detection scheme to definethe range to the first detected target within a footprint.Therefore, the detection of the canopy top requires thatsufficient backscatter energy be received exceeding thedetection threshold. The backscatter intensity depends onintercepted area and the near infrared (NIR) reflectance of theintercepted surfaces at 0° phase angle. Thus SLICER's abilityto detect the canopy top, and the resulting derivation of canopyheight, depends on the geometry of the outer canopy surfaceand the reflectivity of the components making up the outersurface. For example, narrow, erect conifer tips with NIR-darkneedles are less easily detected than a concentration of NIR-bright deciduous leaves forming a well defined, umbrella-likecrown top. Depending on these canopy characteristics, theSLICER measurement of canopy height can be biased low tovarying degrees as compared to the outer-most canopy surface.

3. WAVEFORM LIDAR PROCESSING ALGORITHMS
Waveform Height Algorithm
To process the waveform into an estimate of the total height ofthe vegetation sampled, a sequence of processing steps isapplied to the raw waveform data (Lefsky, 1997, Harding et al.,Submitted). First, to improve the signal-to-noise ratio of thedistribution, the raw amplitudes (Fig. 1a) are summed byaccumulating the signal in adjacent waveform bins. Generally,either 6 or 9 adjacent bins have been summed, yielding either a66 or 99 cm vertical sampling. The 66cm vertical sampling isapproximately equal to the vertical resolution defined by thelaser pulse width and detector response, while the 99 cmsampling has been used for compatibility with non-lidar fieldmeasurements. Next, the mean and variance of the backgroundnoise is established using the final portion of the waveform,beyond any potential last ground return. The mean backgroundnoise is subtracted from the summed distribution yieldingsignal above the noise level (Fig. 1b).
We then distinguish the ground reflection in the signal byassuming that it is the last return above noise. The end of thelast return is defined as the last signal above a threshold that isa multiple of the background noise variance (Fig. 1b). Thepeak of the last return is defined to be the first inflection insignal strength prior to the end of the last return, identifiedusing its first derivative. The start of the last return can not beuniquely identified from the raw distribution becausebackscatter return from low vegetation could be convolved intime with the ground return. Therefore, the start of the last
return is identified based on the width characteristics of thesystem impulse response. The impulse response is thetheoretical signal recorded from a smooth and flat surface anddepends on the convolved effects of pulse width and detectorresponse. The SLICER impulse response is established fromwater surface returns. A ratio is determined for the impulseresponse between the width from the signal end to peak ascompared to the width from peak to start. The observed end-to-peak width of the last return is scaled by this ratio in order todefine the start position of the last return. This methodaccounts for any pulse broadening of the last return due toslope or roughness of the ground within the footprint. Afterautomated identification of the last returns, the results areinteractively evaluated, and modified where necessary, byexamining profile plots of last return start, peak, and endelevations. Anomalous variations in elevation or last returnwidth, either along or across the SLICER swath, revealimproperly identified ground returns that are then manuallycorrected. Recently, morphological filtering operations havebeen applied to the problem of correcting anomalous groundreturn estimates, eliminating the need for manual correction
The amplitude of the ground reflection is then scaled to accountfor the difference between average canopy and ground NIRreflectance at 0° phase angle. In the existing work withSLICER, the ground return amplitude was increased by a factorof two based on the assumption that the reflectance of theground, dominantly comprised of leaf-litter with some bare soiland rare live foliage, was half that of the canopy. The results ofour work have been relatively insensitive to potential errors inthis reflectance scaling factor, as described in Harding et al.,(Submitted).
Intercepted Surfaces / Transmittance Algorithm
A cumulative height distribution for the canopy return can thenbe calculated, normalized by the adjusted total return (canopy +scaled ground), yielding a height distribution of canopy closure(Figure 1c). This Normalized Cumulative Power Distribution(NCPD) can be further transformed to estimate the verticaldistribution of transmittance at the sensor orientation. TheNCPD is used to estimate transmittance as follows:
TSLICER(h)=1-NCDPh+1
where TSLICER(h) is the SLICER estimate of transmittance atheight h and NCPD(h+1) is the normalized cumulative powerdistribution at h+1. Since SLICER measures the reflectance ofthe laser at each height (assuming the contribution of multiplescattering to signal delay is small), TSLICER at a height is equalto one minus the cumulative reflectance from the height aboveit. In reality, transmittance is equal to one minus the sum ofcumulative reflectance and absorbence. The NCPD can beused as a proxy for the sum of cumulative reflectance andabsorbence when the ratio of absorbence to reflectance does notvary with height. Where the assumption of a constant ratio isviolated, the error in TSLICER compared to actual transmittanceshould be small because absorbence by foliage and needles at
Fig. 1. Steps in converting a raw SLICER waveform to variousprocessing levels (Panels a-d left to right) Harding et al.,(In Prep.)
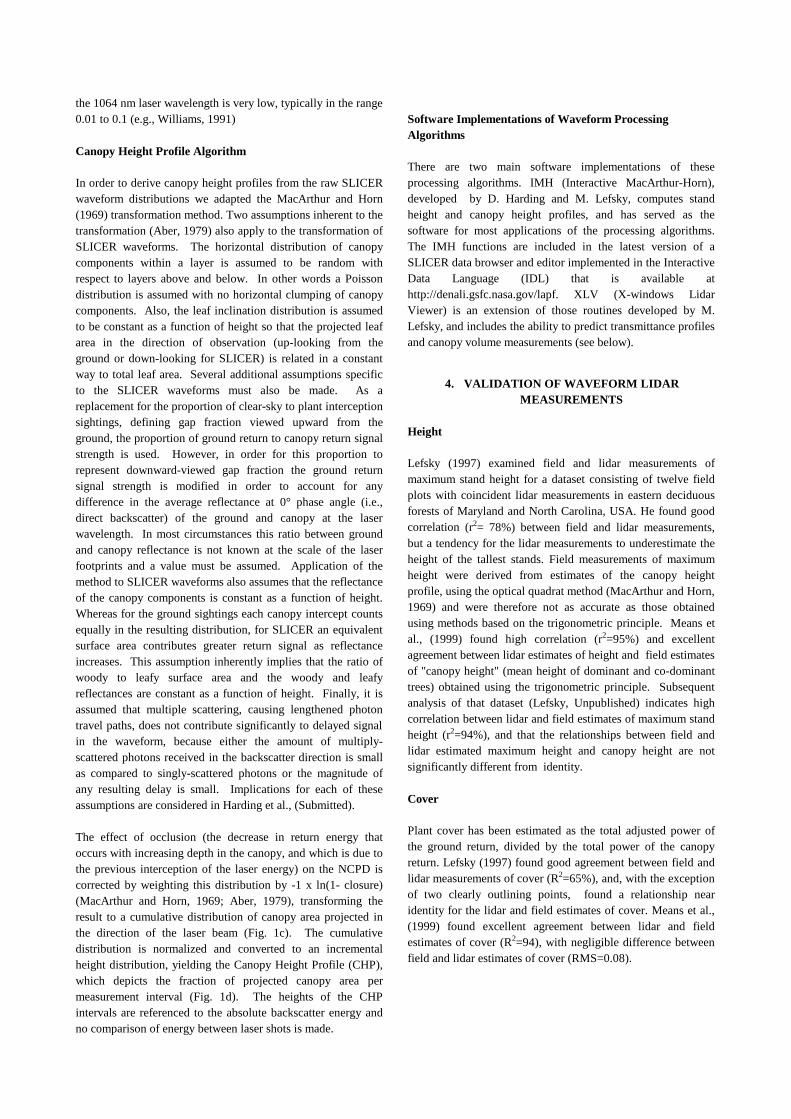
the 1064 nm laser wavelength is very low, typically in the range0.01 to 0.1 (e.g., Williams, 1991)
Canopy Height Profile Algorithm
In order to derive canopy height profiles from the raw SLICERwaveform distributions we adapted the MacArthur and Horn(1969) transformation method. Two assumptions inherent to thetransformation (Aber, 1979) also apply to the transformation ofSLICER waveforms. The horizontal distribution of canopycomponents within a layer is assumed to be random withrespect to layers above and below. In other words a Poissondistribution is assumed with no horizontal clumping of canopycomponents. Also, the leaf inclination distribution is assumedto be constant as a function of height so that the projected leafarea in the direction of observation (up-looking from theground or down-looking for SLICER) is related in a constantway to total leaf area. Several additional assumptions specificto the SLICER waveforms must also be made. As areplacement for the proportion of clear-sky to plant interceptionsightings, defining gap fraction viewed upward from theground, the proportion of ground return to canopy return signalstrength is used. However, in order for this proportion torepresent downward-viewed gap fraction the ground returnsignal strength is modified in order to account for anydifference in the average reflectance at 0° phase angle (i.e.,direct backscatter) of the ground and canopy at the laserwavelength. In most circumstances this ratio between groundand canopy reflectance is not known at the scale of the laserfootprints and a value must be assumed. Application of themethod to SLICER waveforms also assumes that the reflectanceof the canopy components is constant as a function of height.Whereas for the ground sightings each canopy intercept countsequally in the resulting distribution, for SLICER an equivalentsurface area contributes greater return signal as reflectanceincreases. This assumption inherently implies that the ratio ofwoody to leafy surface area and the woody and leafyreflectances are constant as a function of height. Finally, it isassumed that multiple scattering, causing lengthened photontravel paths, does not contribute significantly to delayed signalin the waveform, because either the amount of multiply-scattered photons received in the backscatter direction is smallas compared to singly-scattered photons or the magnitude ofany resulting delay is small. Implications for each of theseassumptions are considered in Harding et al., (Submitted).
The effect of occlusion (the decrease in return energy thatoccurs with increasing depth in the canopy, and which is due tothe previous interception of the laser energy) on the NCPD iscorrected by weighting this distribution by -1 x ln(1- closure)(MacArthur and Horn, 1969; Aber, 1979), transforming theresult to a cumulative distribution of canopy area projected inthe direction of the laser beam (Fig. 1c). The cumulativedistribution is normalized and converted to an incrementalheight distribution, yielding the Canopy Height Profile (CHP),which depicts the fraction of projected canopy area permeasurement interval (Fig. 1d). The heights of the CHPintervals are referenced to the absolute backscatter energy andno comparison of energy between laser shots is made.
Software Implementations of Waveform ProcessingAlgorithms
There are two main software implementations of theseprocessing algorithms. IMH (Interactive MacArthur-Horn),developed by D. Harding and M. Lefsky, computes standheight and canopy height profiles, and has served as thesoftware for most applications of the processing algorithms.The IMH functions are included in the latest version of aSLICER data browser and editor implemented in the InteractiveData Language (IDL) that is available athttp://denali.gsfc.nasa.gov/lapf. XLV (X-windows LidarViewer) is an extension of those routines developed by M.Lefsky, and includes the ability to predict transmittance profilesand canopy volume measurements (see below).
4. VALIDATION OF WAVEFORM LIDARMEASUREMENTS
Height
Lefsky (1997) examined field and lidar measurements ofmaximum stand height for a dataset consisting of twelve fieldplots with coincident lidar measurements in eastern deciduousforests of Maryland and North Carolina, USA. He found goodcorrelation (r2= 78%) between field and lidar measurements,but a tendency for the lidar measurements to underestimate theheight of the tallest stands. Field measurements of maximumheight were derived from estimates of the canopy heightprofile, using the optical quadrat method (MacArthur and Horn,1969) and were therefore not as accurate as those obtainedusing methods based on the trigonometric principle. Means etal., (1999) found high correlation (r2=95%) and excellentagreement between lidar estimates of height and field estimatesof "canopy height" (mean height of dominant and co-dominanttrees) obtained using the trigonometric principle. Subsequentanalysis of that dataset (Lefsky, Unpublished) indicates highcorrelation between lidar and field estimates of maximum standheight (r2=94%), and that the relationships between field andlidar estimated maximum height and canopy height are notsignificantly different from identity.
Cover
Plant cover has been estimated as the total adjusted power ofthe ground return, divided by the total power of the canopyreturn. Lefsky (1997) found good agreement between field andlidar measurements of cover (R2=65%), and, with the exceptionof two clearly outlining points, found a relationship nearidentity for the lidar and field estimates of cover. Means et al.,(1999) found excellent agreement between lidar and fieldestimates of cover (R2=94), with negligible difference betweenfield and lidar estimates of cover (RMS=0.08).

Transmittance
Parker et al., (In Prep) have examined the relationship betweenfield and lidar measurements of the vertical distribution oftransmittance in both eastern deciduous and western coniferousforests. Although the lidar measurements estimate thetransmittance of direct illumination at the nadir angle of thesensors, and the field measurements estimate the transmittanceof both direct and diffuse illumination at the sun azimuthangle, the two measurements closely track each other, both interms of the total vertical distribution of transmittance, andseveral key derived statistics (Fig. 2).
Canopy Height Profiles
Validation of the ability of SLICER to estimate fieldmeasurements of the canopy height profile (CHP) are presentedin Lefsky (1997) and Harding et al., (Submitted). Despite theinherent difficulties in comparing the upward looking fieldestimates and the downward looking lidar estimates of theCHP, good agreement between the two estimates was found forfour stands of differing age (Fig. 3). They also found thatSLICER estimates of the CHP fell within the range ofvariability observed when different subsets of the field CHPdata were compared. Lefsky (1997) applied a smoothingalgorithm to both field and lidar estimates of the CHP, andfound no statistically significant differences between the fieldand lidar estimates of the CHP.
5. APPLICATIONS OF WAVEFORM LIDARMEASUREMENTS
Three published studies document the utility of SLICER forprediction of forest stand structure. Lefsky (1997) and Lefsky etal., (1999a) used data from SLICER to predict abovegroundbiomass and basal area, using indices derived from the canopyheight profile, in eastern deciduous forests. In Lefsky et al.,(1999a), a number of height related indices were evaluated forthe prediction of stand basal area and biomass, and thequadratic mean canopy height was found to be the best overallpredictor. The quadratic mean canopy height is the mean heightof the canopy height profile, with each element of the profileweighted by its squared height. Of particular note, they foundthat relationships between height indices and forest structureattributes (basal area and aboveground biomass), could begenerated using field estimates of the CHP, and applied directlyto the lidar estimates of the CHP, resulting in unbiasedestimates of forest structure. Means et al., (1999) appliedsimilar methods to 26 plots in forests of Douglas-fir andwestern hemlock, at the H.J. Andrews experimental forest.They found that very accurate estimates of basal area,aboveground biomass and foliage biomass could be made usinglidar height and cover estimates.
The third published study (Lefsky et al., 1999b) is the first totake advantage of SLICER’s ability to measure the three-dimensional distribution of canopy structure in a direct fashion(Figure 4). Five-by-five blocks of waveforms (correspondingto a 50 x 50 m field plot) were processed using the novelcanopy volume profile algorithm. Following the proceduresabove, each waveform was transformed into an estimate of thecanopy height profile (CHP), the relative distribution of thecanopy as a function of height. A threshold value was then usedto classify each element of the CHP into either “filled” or“empty” volume, depending on the presence or absence (in thewaveform) of returned energy. A second step classifies thefilled elements of the matrix into an “euphotic” zone, whichcontains all filled elements of the profile that are within theuppermost 65 % of canopy closure, and an “oligophotic” zone,consisting of the balance of the filled elements of the profile.These two classifications were then combined to form threeclasses; empty volume beneath the canopy- (i.e., closed gapspace), filled volume within the euphotic zone, and filledvolume within the oligophotic zone.
These same classes are then computed for each of the twentyfive SLICER waveforms in the 5 by 5 array. The waveformswere then compared, and a fourth class was added, “open” gapvolume is defined as the empty space between the top of eachof the waveforms and the maximum height in the array. At thispoint, the total volume of each of the four classes of canopystructure can be tabulated for each 5 by 5 array of waveforms.To determine the ability of SLICER measured canopy structureindices to predict aboveground biomass and Leaf Area Index(LAI), stepwise multiple regressions were performed using asindependent variables the total volume of each of the four
0.00
0.05
0.10
0.15
0.00
0.05
0.10
0.00
0.05
0.00
0.05
Heig
ht (m
)
Corn Tower
Fraction of CHP
Contees Belt- woods
0.00
0.05
0.10
0.15
0.00
0.05
0.10
0.00
0.05
0.00
0.05
Heig
ht (m
)
40
30
20
10
0
Fig. 3. Comparison of lidar (line) and field (bars) estimates of
the canopy height profile. Harding et al. (Submitted)
Hei
ght
m
Hei
ght m
1.0
0.8
0.6
0.4
0.2
0.0
1.0
0.8
0.6
0.4
0.2
0.0
0
10
20
30
40
50
Hei
ght
m
Tower
0
20
40
60
80
Hei
ght m
Wind River
1.0
0.8
0.6
0.4
0.2
0.0
1.0
0.8
0.6
0.4
0.2
0.0
Fractional Transmittance
Fig. 2. Comparison of field (solid) and lidar (dashed) estimates
of transmittance as a function of height in an eastern
(Tower) and western (Wind River) forest. Parker et al (In
Prep)

canopy structure classes and the total volume occupied byvegetation material, as measured by the combined volume ofthe euphotic and oligophotic zones.
Fig. 5 presents canopy volume profile diagrams forrepresentative young, mature and old-growth plots. Thesediagrams indicate, for each 1 meter vertical interval, thepercent of each plot’s 25 waveforms that belong to each of thefour canopy structure classes. Young stands are characterizedby short stature, a uniform canopy surface (as indicated by theheight distribution of the interface between the euphotic zoneand open gap space), and an absence of empty space within thecanopy (ie. closed gap space). Mature stands are taller, but stillare characterized by a uniform upper canopy surface. Incontrast to young stands, mature stands have a large volume ofclosed gap space. Mature stands of Douglas-fir often have ahigh density of large trees with uniform DBH. The uniformityof size leads to the uniform canopy surface height, and theinterception of light and other resources by these trees results inthe absence of canopy material at lower levels. Old-growthstands are distinguished from mature stands by their unevencanopy surface, and the wide vertical distribution of each of thefour canopy structure classes. Whereas stands from earlierstages in stand development have canopy structure classes indistinct vertical layers, in the old-growth stands each canopystructure class occurs throughout the height range of the stands.
The continuous distribution of canopy surfaces from the top ofthe canopy to the ground has been cited as a key physicalfeature of old-growth forests distinguishing them from thesimpler canopies of young and mature stands (Spies andFranklin, 1991)
Scatterplots of predicted vs observed stand structure attributesare presented in Fig. 6. The strength of the relationshipsdeveloped here are very strong in comparison to other remotesensing techniques, and compare favorably with allometricequations relating complementary aspects of individual treegeometry. Examination of the scatterplots indicates that thepredicted values of aboveground biomass and LAI show noasymptotic tendency, even at extremely large values (1200Mg/ha Biomass, LAI of 12). The equation predicting biomassinvolved positive correlations with the total filled volume, andthe number of waveforms taller than 55 m. The equationpredicting LAI involved a positive correlation with the totalfilled volume and the open gap volume, and a negativecorrelation with the closed gap volume. This may be interpretedas suggesting that the all-sided surface area of leaves isproportional to the volume they are distributed in. Increases inthe vertical range of the upper canopy surface tends to increase
Gro
und
Trac
k of
Lid
ar S
enso
r
Cumulative Canopy Closure1.00.0
0
20
40
60
Empty/Filled Threshold ValueCanopy Closure 0.10.0
Fill
edE
mpt
y
EuphoticZone
F
heig
ht (
m)
OligophoticZone
Euphotic/OligophoticThreshold
ClosedGap
Space
Oligo. Zone.
OpenGap
Space
Fig. 4. The Canopy Volume Method (Lefsky et al., 1999b)

LAI, and the presence of empty spaces within the canopy tendsto decrease LAI. Although both LAI and aboveground biomassuse the total filled volume variable in their equations,scatterplots and regressions have shown that the predictedvalues of each variable are no more highly correlated with eachother than the original data.
Fig. 5. Canopy Volume Profiles (Lefsky et al., 1999b)
-2000
200400600800
100012001400
-200 200 600 1000 1400Predicted Aboveground
Biomass (Mg/ha)
R2=90%
02468
101214
0 2 4 6 8 10 12 14Predicted LAI (m2/m2)
R2=88%
Obs
erve
dA
bove
grou
nd B
iom
ass
Obs
erve
d L
AI
Fig. 6. Predictions of Stand Structure from Canopy Volume
Method
6. CONCLUSION
The development of forest ecology applications of lidar remotesensing will depend on detailed knowledge of canopyorganization, and the interaction of lidar sensors with thatorganization. Using data from the SLICER device, we havemade several introductory studies of the interaction of thesensor with two very different canopy types, and developed
algorithms that relate lidar measurements to standard fieldmeasurements of forest canopies. Additionally, we have shownthe utility of these measurements for the estimation of foreststand structure attributes, such as aboveground biomass andLAI, in both forest types.
7. REFERENCES
Aber, J.D. (1979), Foliage-height profiles and succession inNorthern Hardwood forest. Ecology, 60:18-23.
Blair, J.B., Coyle, D.B., Bufton, J.L., and Harding, D.J. (1994),Optimization of an airborne laser altimeter for remote sensingof vegetation and tree canopies. Proc. IGARSS ’94, 2:939-941.
Blair, J.B., Rabine, D.L, and Hofton, M.A. (1999), The LaserVegetation Imaging Sensor: a medium-altitude, digitisation-only, airborne laser altimeter for mapping vegetation andtopography. ISPRS, 54(2-3):115-122
Bufton, J.L. (1989), Laser altimetry measurements from aircraftand spacecraft. Proc. IEEE, 77(3):463-477.
Drake J.B., and Weishampel, J.F. (1998), Multifractal analysisof laser altimeter and ground-based canopy height measures ofa longleaf pine savanna. Proc. First Int. Conf. Geospatial Infor.Agric. Forestry, 1:403-410.
Dubayah, R., Blair, J.B., Bufton, J.L., Clark, D.B., JaJa, J.,Knox, R., Luthcke, S.B., Prince, S., and Weishampel, J. (1997),The Vegetation Canopy Lidar mission, proceedings, landsatellite information in the next decade II: sources andapplications. Am. Soc. for Photogramm. and Remote Sens.,Bethesda, MD, 100-112.
Harding, D.J., Blair, J.B., Garvin, J.B., and Lawrence, W.T.(1994), Laser altimetry waveform measurement of vegetationcanopy structure. Proc. IGARSS ’94, 2:1251-1253.
Harding, D.J., Blair, J.B., Rodriguez, E., and Michel, T. (1995),Airborne laser altimetry and interferometric SAR measurementsof canopy structure and sub-canopy topography in the PacificNorthwest. Proc. Second Topical Symposium on CombinedOptical - Microwave Earth and Atmosphere Sensing (CO-MEAS’95), 22-24.
Harding, D.J. (1998), Airborne lidar observations of canopystructure at the BOREAS tower flux sites. Proc. IGARSS ’98,Seattle, WA, 1550-1552.
Harding, D.J., Blair, J.B., Rabine, D.L., and Still, K.L. (InReview), Scanning Lidar Imager of Canopies by EchoRecovery (SLICER): Instrument and Data Product Description.NASA Technical Memorandum.
Harding, D.J. Lefsky, M.A., Parker, G.G., and Blair, J.B.(Submitted), Airborne lidar measurements of canopy structure:
heig
ht (
m)
heig
ht (
m)
heig
ht (
m)
40
20
40
60
0
20
60
0
0 100%Volume0 100%Volume
Young Stand (~20 years)
20
40
60
00 100%
Volume
Euphotic Zone: Foliage or woody structure returned in the uppermost 65% of canopy closure.
Closed Gap: No foliage or woody structure detected
Open Gap: Volume between the upper canopy surface and the height of the tallest waveform.
Mature Stand (~100 years)
Old- growth Stand(~250 years)
heig
ht (
m)
heig
ht (
m)
heig
ht (
m)
Oligophotic Zone:Foliage or woody structure below the Euphotic Zone

methods and validation for deciduous, broadleaf forests. Rem.Sensing of Environ.
Lefsky, M.A. (1997), Application of lidar remote sensing to theestimation of forest canopy and stand structure. Ph.D. thesis,Environmental Sciences, University of Virginia,Charlottesville, VA.
Lefsky, M.A., Harding, D.J., Cohen, W.B., Parker, G.G., andShugart, H.H. (1999a), Lidar remote sensing of forest basalarea and biomass: application and theory. Rem. Sensing ofEnviron., 67:83-98.
Lefsky, M., Cohen, W., Acker, S., Parker, G., Spies, T., andHarding, D. (1999b), Lidar remote sensing of biophysicalproperties and canopy structure of forests of Douglas-fir andwestern hemlock. Rem. Sensing of Environ., 70(3), 339-361.
MacArthur, R.H., and Horn, H.S. (1969), Foliage profiles byvertical measurements. Ecology, 50:802-804.
Means, J.E., Acker, S.A., Harding, D.J., Blair, J.B., Lefsky,M.J., Cohen, W.B., Harmon, M.E., and Mckee, W.A. (1999),Use of large-footprint scanning airborne lidar to estimate forest
stand characteristics in the western Cascades of Oregon. Rem.Sens. Environ.,. 67:298-308.
Parker, G.G., Lefsky, M.A., Harding, D.J. (In Prep), PARtransmittance in forest canopies determined from airborne lidaraltimetry and from in-canopy quantum measurements. Rem.Sens. Environ.
Rodriguez, E., Michel, T.R., Harding, D.J. (In review),Interferometric measurements of canopy height characteristicsfor coniferous forests. Radio Sci.
Spies, T. A., and Franklin, J. F. (1991), The structure of naturalyoung, mature, and old-growth Douglas-fir forests in Oregonand Washington. USDA Forest Service general technicalreport PNW-GTR. Pacific Northwest Research Station.,Portland, Or., 91-109.
Williams, D.L. (1991), A comparison of spectral reflectanceproperties at the needle branch and canopy level for selectedconifer species. Remote Sens. Environ., 35:79-93.