progress of the milkit project in tanzania (july – november 2012)
DESCRIPTION
PROGRESS OF THE MILKIT PROJECT IN TANZANIA (July – November 2012). Progress along Project Components. Component 1. Institutional Strengthening – Tanzania Component 2. Productivity Enhancement – Tanzania Component 3. Knowledge Sharing – Tanzania. - PowerPoint PPT PresentationTRANSCRIPT

PROGRESS OF THE MILKIT PROJECT IN TANZANIA
(July – November 2012)

Progress along Project Components Component 1. Institutional Strengthening –
Tanzania Component 2. Productivity Enhancement –
Tanzania Component 3. Knowledge Sharing – Tanzania

Component 1. Institutional Strengthening – Tanzania
1a. Mechanisms for enhancing innovation capacity through local stakeholder platforms to address dairy value chain constraints.
Identification of sites Rapid value chain assessment Institutional analysis (stakeholder assessment) Engage and/or establish regional platforms Establish site (village) platforms

MilkIT Interaction with PartnersTwo meetings held so farFirst meeting on 5th – 6th July 2012 in Dar es Salaam
Activity plan and budgetingAgreement with partnersPrior site selection
Second meeting on 26th Oct. 2012 in Arusha Reviewing work planProgress of the projectAgree on forage germplasm establishmentProject administration
Great delay in administration – letters of agreement Release of funds to partners – only in October 2012

Initial Projects related to the Dairy Value Chain (DVC) in Tanzania
1. More milk in Tanzania (Irish Aid) – MoreMilkiT
2. MilkIT (IFAD) 3. Livestock Data Project (BMGF/WB) 4. SFFF (Safe Food Fare Food) 5. African Rising – Feed the Future (Not yet
confirmed)

Process of Site Selection ‘More meat, milk & fish’ (CRP 3.7) market channels to
consider (Peri-)urban – not to be considered for MilkIT project Rural to urban Rural to rural
GIS-based spatial analysis Cattle density – high density areas Poverty – high poverty areas Population/market – high population areasProduction potential – high LGP areasSurplus vs deficit areas – deficit areas where there is potential
for increasing supply through feed interventions. Range of other more qualitative criteria
Complimentary to other projects (create synergies), e.g. IFAD Active partners available Proportion of improved cattle
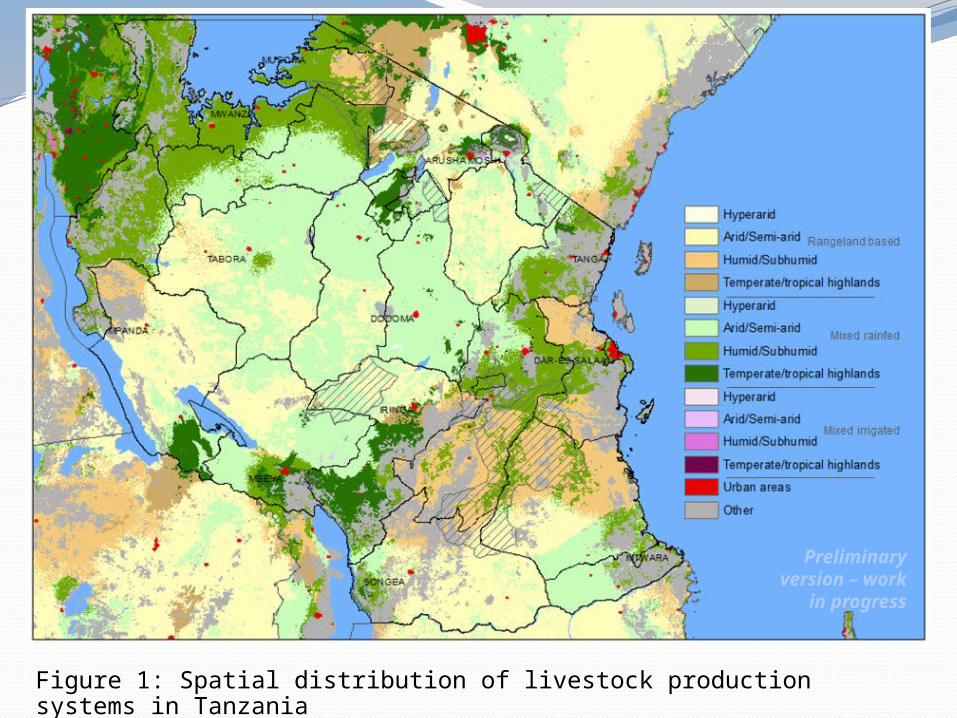
Figure 1: Spatial distribution of livestock production systems in Tanzania
Preliminary version –
work in progress

Distribution of human population
density in Tanzania
Figure 3: Distribution of the number of people living on less than $1.25 per day
Figure 4: Distribution of the number of people living on less than $2 per day
Preliminary version – work in progress

Figure 4: Travel time (hr) to the nearest town of 50,000 people in Tanzania
Figure 5: Travel time (hr) to local markets
Market access
Preliminary version – work in progress

Figure 11: Bovine feed requirements for milk production in Tanzania
Figure 19: Length of growing period (in days) for Tanzania
Figure 8: Bovine density in
TanzaniaPreliminary version – work in progress
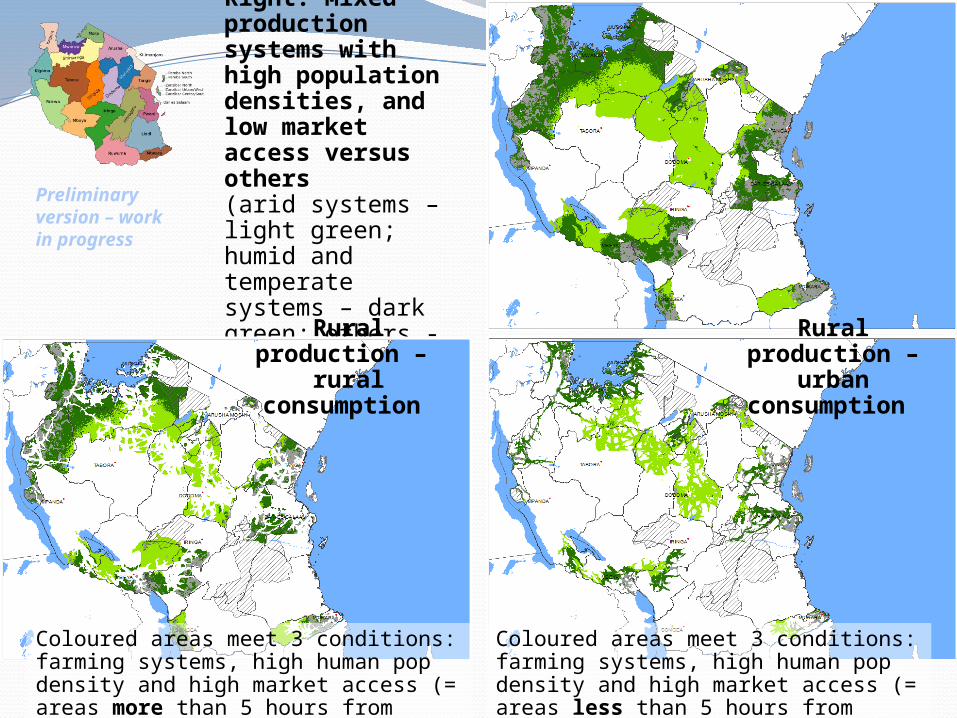
Right: Mixed production systems with high population densities, and low market access versus others (arid systems – light green; humid and temperate systems – dark green; others - grey)
Coloured areas meet 3 conditions: farming systems, high human pop density and high market access (= areas more than 5 hours from large urban centres)
Coloured areas meet 3 conditions: farming systems, high human pop density and high market access (= areas less than 5 hours from large urban centres)
Rural production – rural consumption
Rural production – urban consumption
Preliminary version – work in progress

Figure 15: Surplus - deficit areas for milk in Tanzania
Tanga Region
Morogoro Region

Right: Mixed production systems with high population densities (cut off 25 persons/km2)
versus others (arid systems – light green; humid and temperate
systems – dark green; others - grey)
Rural production – rural consumption
Rural production – urban consumption
Morogoro Region
Kilosa
Kilombero
Kilosa
Kilombero
Kilosa
Kilombero
Coloured areas meet 3 conditions: farming systems, high human population density and low market access (= areas more than 5 hours from large urban centres)
Coloured areas meet 3 conditions: farming systems, high human population density and high market access
(= areas less than 5 hours from large urban centres)

Right: Mixed production systems with high population densities (cut off 25 persons/km2)
versus others (arid systems – light green; humid and temperate
systems – dark green; others - grey)
Coloured areas meet 3 conditions: farming systems, high human population density and low market access (= areas more than 5 hours from large urban centres)
Coloured areas meet 3 conditions: farming systems, high human population density and high market access
(= areas less than 5 hours from large urban centres)
Rural production – rural consumption
Rural production – urban consumption
Tanga RegionKorogwe
Handeni
Muheza
Korogwe
Handeni
Muheza
Korogwe
Handeni
Muheza

Process of site selection GIS mapping Stakeholder
consultation Ground truthing
Collaboration with other ProjectsMore-MilkIT SFFF (Safe Food Fare
Food)
Component 1. Institutional Strengthening – Tanzania
1b. Approaches for involving local stakeholders in analysis of feed-related aspects of the dairy value chain.
Develop value chain tools Conduct value chain assessment Periodic market appraisals outputs/inputs
1c. Identification of intervention strategies emerging from dairy value chain analysis.
Develop inventory of potential interventions (feed supply and feed use)

Research ActivitiesDVC Assessment in Morogoro and Tanga
(More-MilkiT, MilkIT and SFFF July–Aug 2012 )


Component 1. Institutional Strengthening – Tanzania
1b. Approaches for involving local stakeholders in analysis of feed-related aspects of the dairy value chain.
Develop value chain tools Conduct value chain assessment Periodic market appraisals outputs/inputs
1c. Identification of intervention strategies emerging from dairy value chain analysis.
Develop inventory of potential interventions (feed supply and feed use) Fred to report some advances
Inventory potential interventions Tanzania

Research & improvement of feeding required – situational analysis
Serious imbalance in investment into animals vs. pastures or other feeds
Great opportunity for impact, e.g. Production about 303,000 bales of hay (2010), while demand
exceeds 1,000,000 bales/annum Production of compounded feedstuffs estimated 800,000
t/annum, while potential demand stands at 2.5 million t/annum About 60 feed mills not operating to optimal capacity; not
equally distributed over country; providing mostly to poultry and pig farms
Opportunities and needs identified Training programs for sustainable pasture management and
general animal feeds for existing farms, including renewal of all depleted pastures
Introduction of supplements, especially targeting smallholders