progress report los angeles county strategic plan for economic development 2010-2014
TRANSCRIPT
Our region’s progress on key economic goals
PROGRESS REPORT: 2010-2014 Los Angeles County Strategic Plan for Economic Development
The Los Angeles County Strategic Plan for Economic Development (2010-2014) was initiated during the depths of the Great Recession. At a time when one out of eight L.A. County residents was either unemployed or not even looking for work; when budget deficits of unimaginable levels predominated in many of our municipalities; when housing foreclosures and empty storefronts littered our communities; and when our social service safety net was fraying as a result, L.A.’s economic and fiscal future seemed in peril, and our unmatched quality of life felt at risk.
We’ve made a lot of progress since those bleak recessionary days. In many respects, the Strategic Plan and the results achieved over its five-year implementation reflected our region’s resiliency during those dark times. It fully displayed our collective determination to improve the economic standing of our great County, and it helped define our County’s incredible creativity and inimitable entrepreneurial “can do” spirit with regard to what can be accomplished together in the face of seemingly intractable and daunting challenges.
Together, we the people of L.A. County worked to create a stronger, more diverse and sustainable economy for our residents and communities. But as importantly, we molded an innovative paradigm for creating and implementing a “living and breathing” economic development strategy; one in which over 1,000 engaged civic stewards across our county could overcome cynicism and form a consensus around 52 strategies and 12 objectives to achieve five aspirational goals:
This was a plan by and for the residents and communities of L.A. County. Accordingly, the top-line results described herein paint a portrait of an ambitious people intent on delivering a better economy, a healthier environment and greater social equity.
However, this is in no way a “completion report,” only a snapshot of our progress. This is because we still have a lot more work to do. We need to significantly decrease poverty rates in L.A. County; create opportunities that help families earn more; work on mobility and traffic congestion challenges; and grow the economy in ways that address widening income inequality. All of this work is essential to LA County’s economic prospects and our shared future.
With that as our collective guidepost, we must continue to move L.A. County onward and upward, and so we look forward to working with all of you to develop the next five-year (2016-2020) strategic plan for economic development.
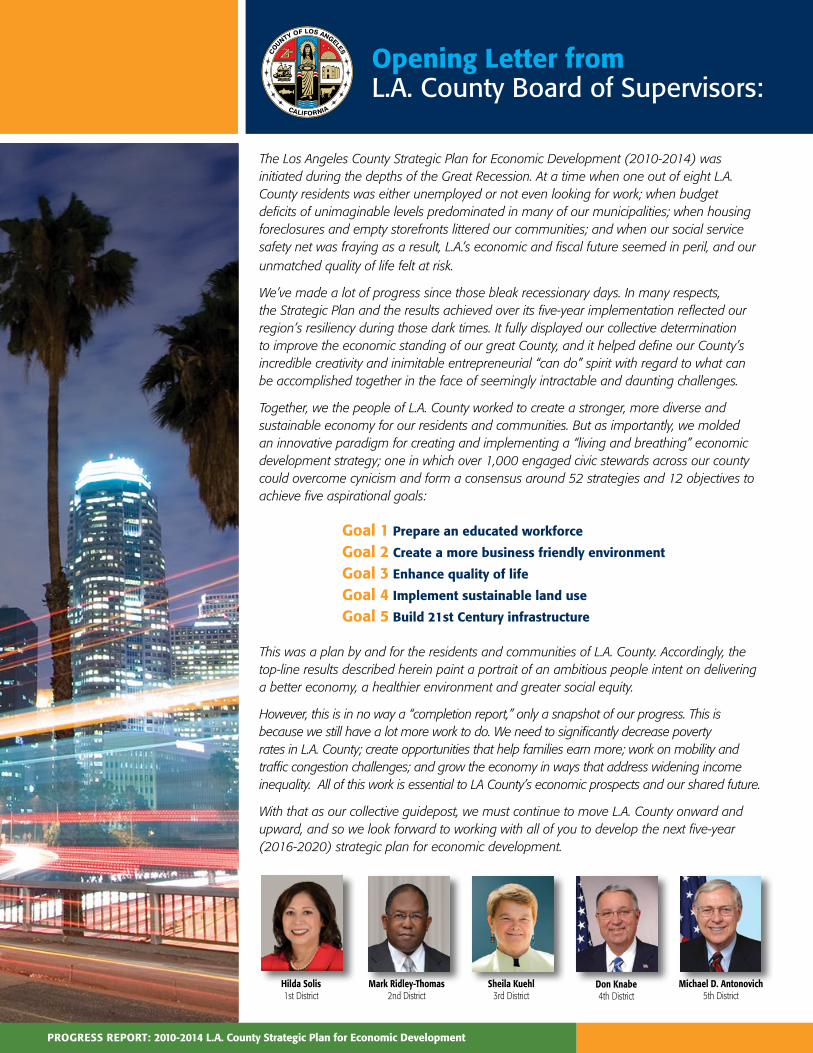
Hilda Solis1st District
Mark Ridley-Thomas2nd District
Sheila Kuehl3rd District
Don Knabe4th District
Michael D. Antonovich5th District
Opening Letter from L.A. County Board of Supervisors:
PROGRESS REPORT: 2010-2014 L.A. County Strategic Plan for Economic Development
Goal 1 Prepare an educated workforce
Goal 2 Create a more business friendly environment
Goal 3 Enhance quality of life
Goal 4 Implement sustainable land use
Goal 5 Build 21st Century infrastructure
www.LAEDC.org/StrategicPlan
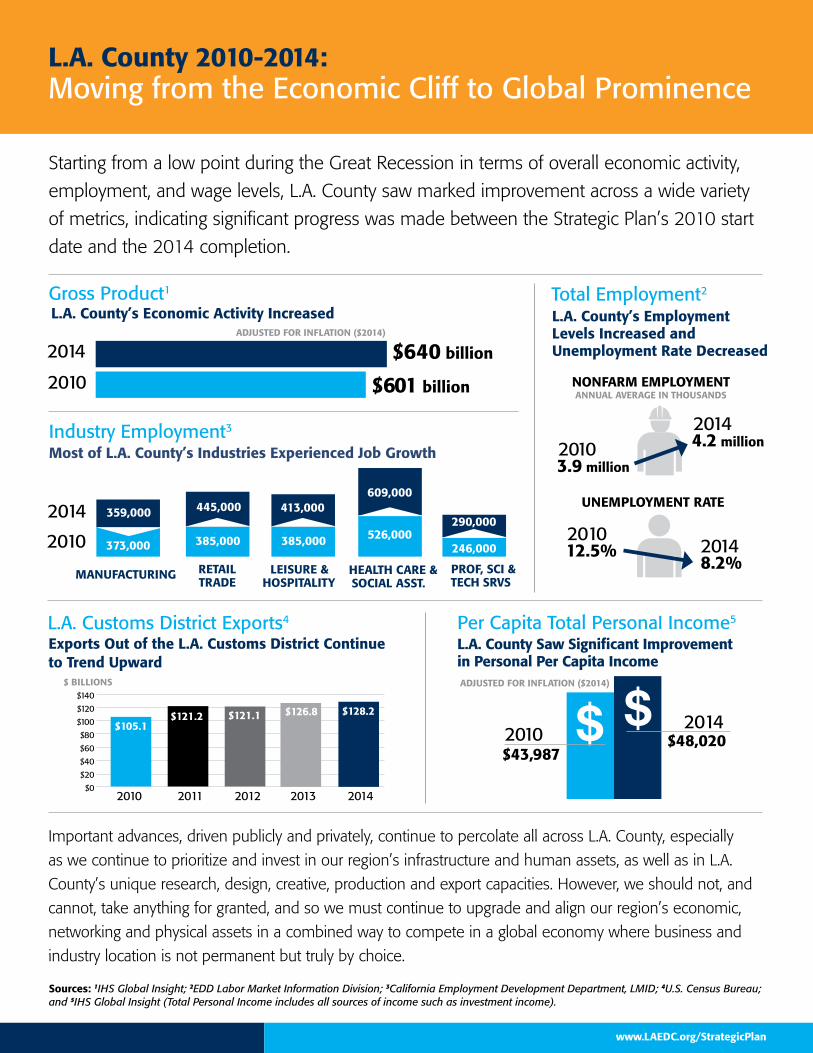
Important advances, driven publicly and privately, continue to percolate all across L.A. County, especially
as we continue to prioritize and invest in our region’s infrastructure and human assets, as well as in L.A.
County’s unique research, design, creative, production and export capacities. However, we should not, and
cannot, take anything for granted, and so we must continue to upgrade and align our region’s economic,
networking and physical assets in a combined way to compete in a global economy where business and
industry location is not permanent but truly by choice.
L.A. County 2010-2014: Moving from the Economic Cliff to Global Prominence
Starting from a low point during the Great Recession in terms of overall economic activity,
employment, and wage levels, L.A. County saw marked improvement across a wide variety
of metrics, indicating significant progress was made between the Strategic Plan’s 2010 start
date and the 2014 completion.
L.A. County Saw Significant Improvement in Personal Per Capita Income
Most of L.A. County’s Industries Experienced Job Growth
Sources: 1IHS Global Insight; 2EDD Labor Market Information Division; 3California Employment Development Department, LMID; 4U.S. Census Bureau;and 5IHS Global Insight (Total Personal Income includes all sources of income such as investment income).
2014
Gross Product1
2010
$640 billion
$601 billion
L.A. County’s Economic Activity IncreasedTotal Employment2
20103.9 million
NONFARM EMPLOYMENT
20144.2 million
ANNUAL AVERAGE IN THOUSANDS
Per Capita Total Personal Income5
Industry Employment3
201012.5% 2014
8.2%
L.A. County’s Employment Levels Increased and Unemployment Rate Decreased
2010
2014
MANUFACTURING RETAIL TRADE
LEISURE & HOSPITALITY
HEALTH CARE & SOCIAL ASST.
PROF, SCI & TECH SRVS
609,000
526,000290,000
413,000445,000359,000
385,000385,000373,000 246,000
L.A. Customs District Exports4
UNEMPLOYMENT RATE
$ $ 2014$48,0202010
$43,987
2010 2011 2012 2013 2014
13,746
$105.1$121.2 $121.1 $126.8 $128.2
$140
$120
$100
$80
$60
$40
$20
$0
$ BILLIONS
Exports Out of the L.A. Customs District Continue to Trend Upward
ADJUSTED FOR INFLATION ($2014)
ADJUSTED FOR INFLATION ($2014)
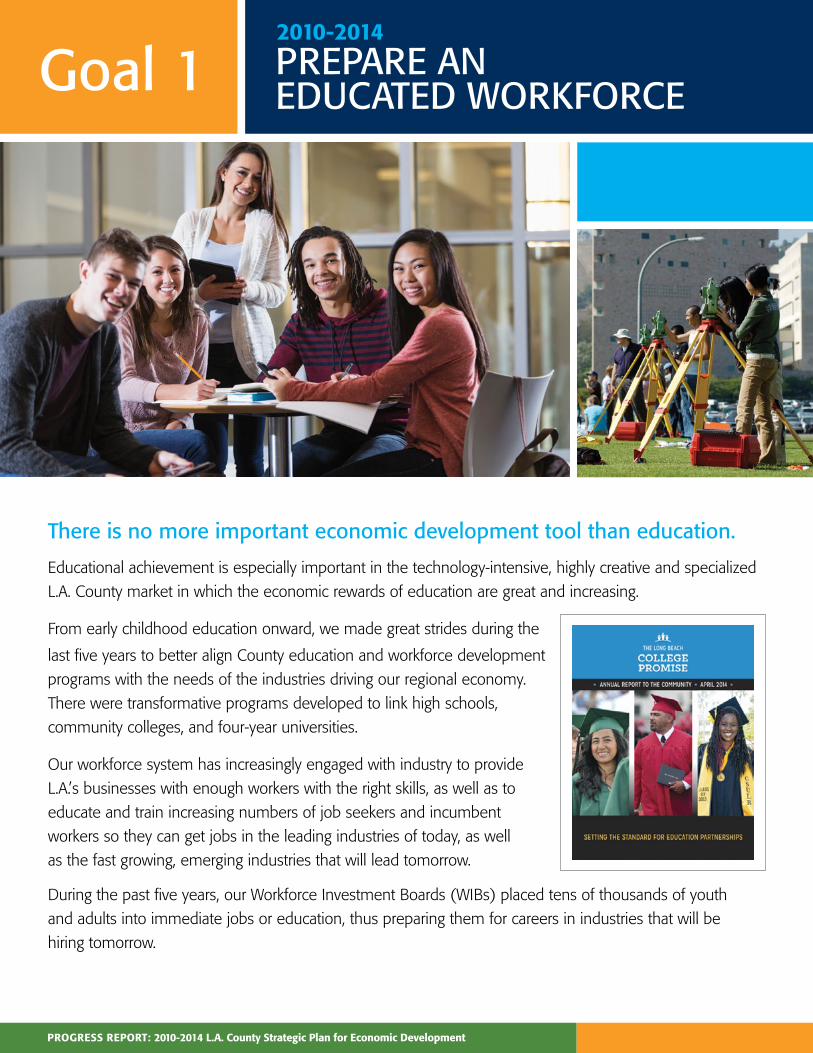
Goal 1
There is no more important economic development tool than education.
Educational achievement is especially important in the technology-intensive, highly creative and specialized
L.A. County market in which the economic rewards of education are great and increasing.
From early childhood education onward, we made great strides during the
last five years to better align County education and workforce development
programs with the needs of the industries driving our regional economy.
There were transformative programs developed to link high schools,
community colleges, and four-year universities.
Our workforce system has increasingly engaged with industry to provide
L.A.’s businesses with enough workers with the right skills, as well as to
educate and train increasing numbers of job seekers and incumbent
workers so they can get jobs in the leading industries of today, as well
as the fast growing, emerging industries that will lead tomorrow.
During the past five years, our Workforce Investment Boards (WIBs) placed tens of thousands of youth
and adults into immediate jobs or education, thus preparing them for careers in industries that will be
hiring tomorrow.
PROGRESS REPORT: 2010-2014 L.A. County Strategic Plan for Economic Development
2010-2014
PREPARE AN EDUCATED WORKFORCE
Looking forward...We must continue to make progress on ensuring that L.A. County’s youth and adults are educated, prepared
and trained for the highly technical, knowledge-based careers of the future. We must also work to keep
education costs more affordable, as up-front costs and future debt burdens increasingly put higher education
out of reach for more L.A. residents. And we need to look for opportunities to prioritize early childhood
education and development; indeed, the correlation to future success is profound and well-known. Finally,
further braiding of program infrastructure, capital and other resources among K-12, the community college
and four-year college systems, adult schools, and the workforce development system (especially with the
enactment of the Workforce Innovation and Opportunity Act in 2014), may enable the L.A. region to more
effectively leverage, prioritize, coordinate and direct limited dollars for education, training and placement
programs based on demand and need.
And the number of L.A. County residents (age 25 and over) who attained at least some college or received an Associate’s Degree/Bachelor’s Degree increased.
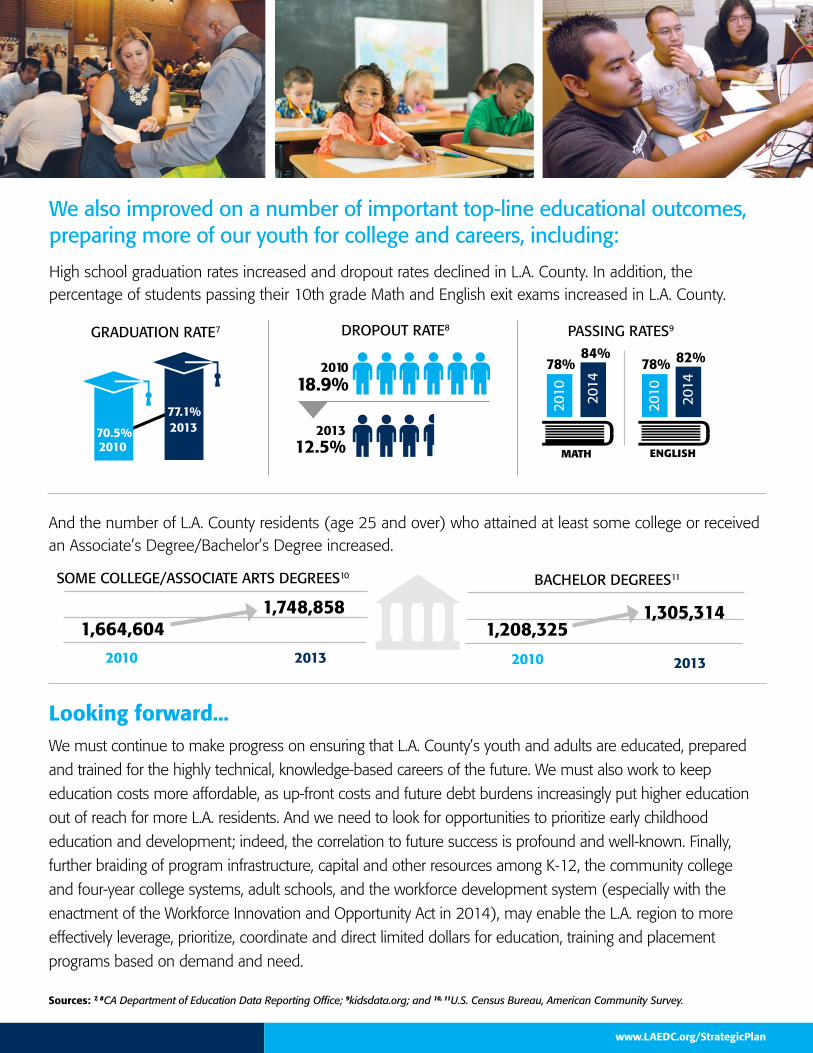
We also improved on a number of important top-line educational outcomes, preparing more of our youth for college and careers, including:
High school graduation rates increased and dropout rates declined in L.A. County. In addition, the percentage of students passing their 10th grade Math and English exit exams increased in L.A. County.
ENGLISH
2010
2014
82%78%
2010 2014
84%78%
MATH
PASSING RATES9
2010 2013
SOME COLLEGE/ASSOCIATE ARTS DEGREES10
1,664,6041,748,858
2010 2013
BACHELOR DEGREES11
1,208,325 1,305,314
www.LAEDC.org/StrategicPlan
70.5%
77.1%
2010
2013
GRADUATION RATE7 DROPOUT RATE8
2013 12.5%
2010
18.9%
Sources: 7, 8CA Department of Education Data Reporting Office; 9kidsdata.org; and 10, 11U.S. Census Bureau, American Community Survey.
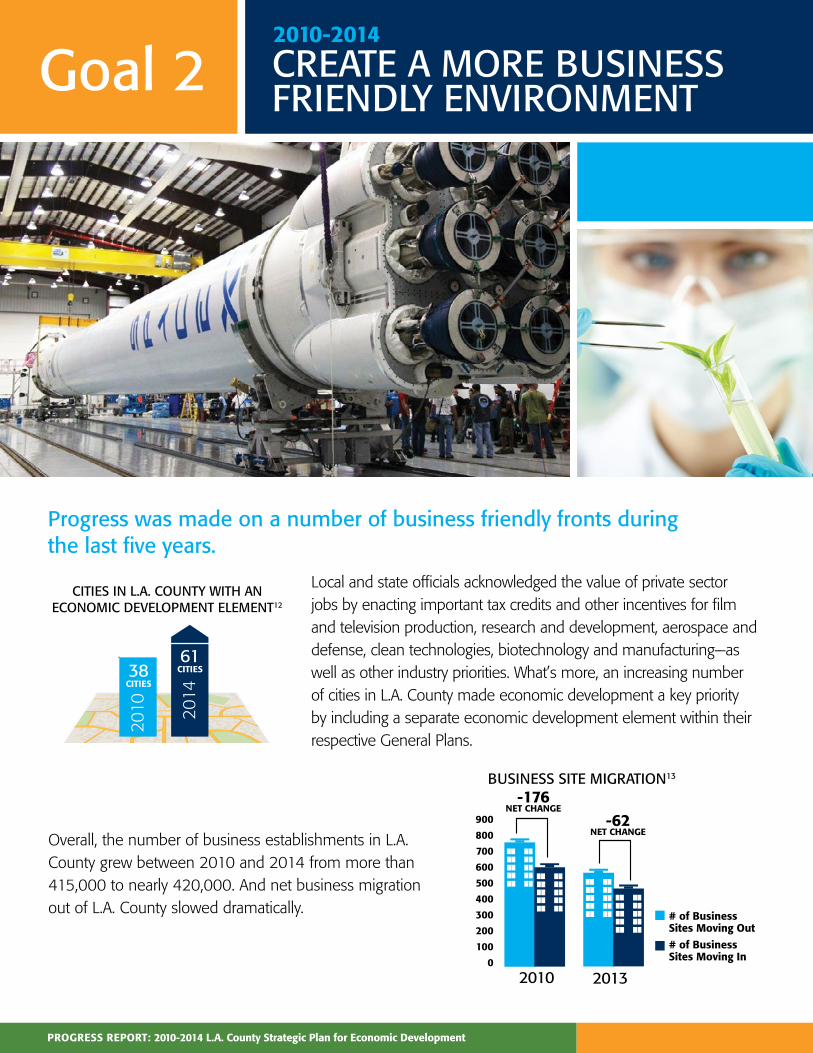
Progress was made on a number of business friendly fronts during the last five years.
Local and state officials acknowledged the value of private sector jobs by enacting important tax credits and other incentives for film and television production, research and development, aerospace and defense, clean technologies, biotechnology and manufacturing—as well as other industry priorities. What’s more, an increasing number of cities in L.A. County made economic development a key priority by including a separate economic development element within their respective General Plans.
PROGRESS REPORT: 2010-2014 L.A. County Strategic Plan for Economic Development
Goal 2 2010-2014
CREATE A MORE BUSINESS FRIENDLY ENVIRONMENT
# of Business Sites Moving Out
# of Business Sites Moving In
900
800
700
600
500
400
300
200
100
0
2010 2013
-176NET CHANGE
-62NET CHANGE
BUSINESS SITE MIGRATION13
Overall, the number of business establishments in L.A. County grew between 2010 and 2014 from more than 415,000 to nearly 420,000. And net business migration out of L.A. County slowed dramatically.
CITIES IN L.A. COUNTY WITH AN ECONOMIC DEVELOPMENT ELEMENT12
2014
2010
61CITIES38
CITIES
www.LAEDC.org/StrategicPlan
Looking forward...While we are making progress on a number of fronts, the business “unfriendly” perception of L.A. County persists – both within our borders and outside of them, leaving many to believe that L.A. County is an inhospitable place to do business. It has truly been a good news/bad news narrative on this goal. While L.A.’s global brand is unsurpassed, L.A.’s industry-specific value propositions and strategies remain somewhat vague and elusive. As new and more sources of capital (seed-, early- and late-stage) flowed into the region from domestic and foreign sources, development procedures continued to be cumbersome, antiquated and opaque in some parts of L.A. County. Finally, during the last five years, local and state programs that align with economic development priorities in many of L.A.’s underserved communities have either been completely eliminated or remained few and far between; this needs to be addressed if we are to begin to close the growing economic and income gaps between different communities and residents and truly increase our regional economic competitiveness.
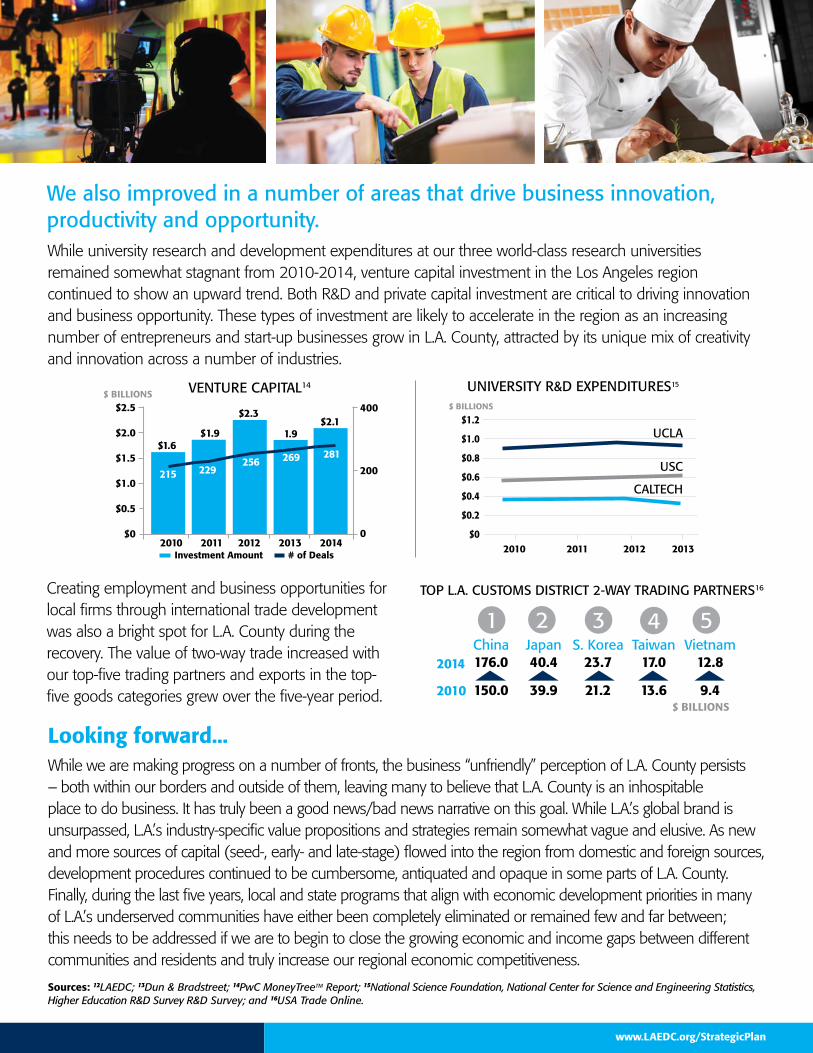
While university research and development expenditures at our three world-class research universities remained somewhat stagnant from 2010-2014, venture capital investment in the Los Angeles region continued to show an upward trend. Both R&D and private capital investment are critical to driving innovation and business opportunity. These types of investment are likely to accelerate in the region as an increasing number of entrepreneurs and start-up businesses grow in L.A. County, attracted by its unique mix of creativity and innovation across a number of industries.
Creating employment and business opportunities for local firms through international trade development was also a bright spot for L.A. County during the recovery. The value of two-way trade increased with our top-five trading partners and exports in the top-five goods categories grew over the five-year period.
Sources: 12LAEDC; 13Dun & Bradstreet; 14PwC MoneyTreeTM Report; 15National Science Foundation, National Center for Science and Engineering Statistics, Higher Education R&D Survey R&D Survey; and 16USA Trade Online.
We also improved in a number of areas that drive business innovation, productivity and opportunity.
VENTURE CAPITAL14
$2.5
$2.0
$1.5
$1.0
$0.5
$02010 2011 2012 2013 2014
400
200
0
$1.6$1.9
$2.3
1.9$2.1
215 229256 269 281
$ BILLIONS
Investment Amount # of Deals
UNIVERSITY R&D EXPENDITURES15
$1.2
$1.0
$0.8
$0.6
$0.4
$0.2
$02010 2011 2012 2013
UCLA
USC
CALTECH
$ BILLIONS
5TOP L.A. CUSTOMS DISTRICT 2-WAY TRADING PARTNERS16
2014
2010
1 2 3 4China 176.0
150.0
Japan 40.4
39.9
S. Korea 23.7
21.2
Taiwan 17.0
13.6
Vietnam 12.8
9.4$ BILLIONS
PROGRESS REPORT: 2010-2014 L.A. County Strategic Plan for Economic Development
Goal 3
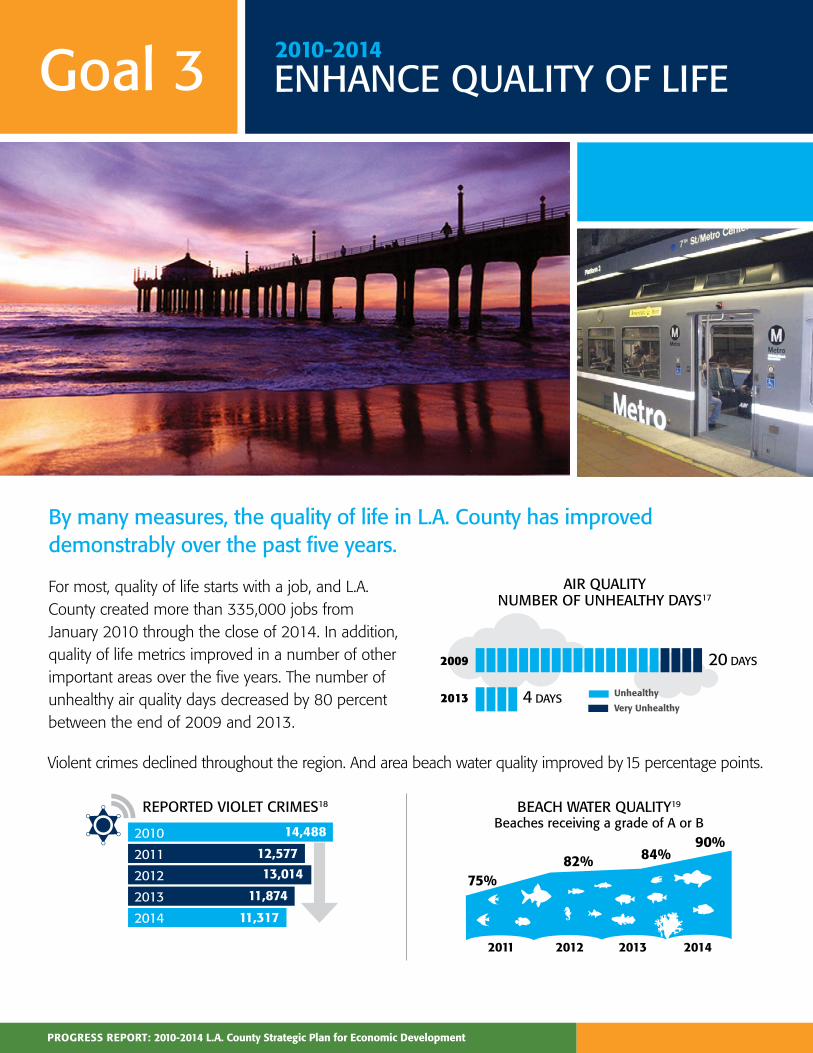
By many measures, the quality of life in L.A. County has improved demonstrably over the past five years.
For most, quality of life starts with a job, and L.A. County created more than 335,000 jobs from January 2010 through the close of 2014. In addition, quality of life metrics improved in a number of other important areas over the five years. The number of unhealthy air quality days decreased by 80 percent between the end of 2009 and 2013.
2010-2014
ENHANCE QUALITY OF LIFE
20 DAYS
4 DAYS
2009
2013 Unhealthy
Very Unhealthy
AIR QUALITYNUMBER OF UNHEALTHY DAYS17
BEACH WATER QUALITY19
Beaches receiving a grade of A or B
2011 2012 2013 2014
75%82% 84%
90%
Violent crimes declined throughout the region. And area beach water quality improved by 15 percentage points.
REPORTED VIOLET CRIMES18
14,488
12,57713,014
11,874
11,317
2010
2011
2012
2013
2014
www.LAEDC.org/StrategicPlan
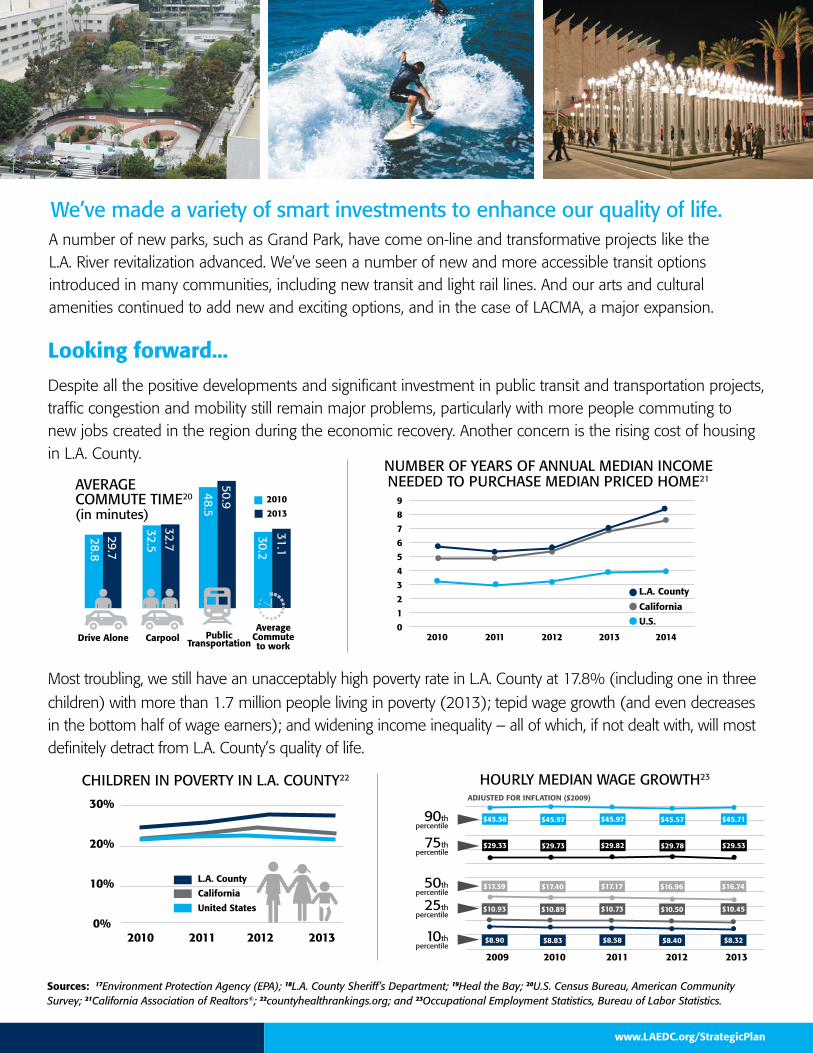
A number of new parks, such as Grand Park, have come on-line and transformative projects like the L.A. River revitalization advanced. We’ve seen a number of new and more accessible transit options introduced in many communities, including new transit and light rail lines. And our arts and cultural amenities continued to add new and exciting options, and in the case of LACMA, a major expansion.
Looking forward...
Despite all the positive developments and significant investment in public transit and transportation projects, traffic congestion and mobility still remain major problems, particularly with more people commuting to new jobs created in the region during the economic recovery. Another concern is the rising cost of housing in L.A. County.
Most troubling, we still have an unacceptably high poverty rate in L.A. County at 17.8% (including one in three
children) with more than 1.7 million people living in poverty (2013); tepid wage growth (and even decreases in the bottom half of wage earners); and widening income inequality – all of which, if not dealt with, will most definitely detract from L.A. County’s quality of life.
HOURLY MEDIAN WAGE GROWTH23
$45.58 $45.97 $45.97 $45.57 $45.71
$29.33 $29.73 $29.82 $29.78 $29.53
$17.39 $17.40 $17.17 $16.96 $16.74
$10.93 $10.89 $10.73 $10.50 $10.45
$8.90 $8.83 $8.58 $8.40 $8.32
2009 2010 2011 2012 2013
ADJUSTED FOR INFLATION ($2009)
90th percentile
75th percentile
50th percentile
25th percentile
10th percentile
NUMBER OF YEARS OF ANNUAL MEDIAN INCOME NEEDED TO PURCHASE MEDIAN PRICED HOME21
Drive Alone Carpool Public Transportation
28.829.7
32.732.5
50.948.5
31.1
30.2
AverageCommute to work
2010
2013
AVERAGE COMMUTE TIME20
(in minutes)
Sources: 17Environment Protection Agency (EPA); 18L.A. County Sheriff’s Department; 19Heal the Bay; 20U.S. Census Bureau, American Community Survey; 21California Association of Realtors®; 22countyhealthrankings.org; and 23Occupational Employment Statistics, Bureau of Labor Statistics.
We’ve made a variety of smart investments to enhance our quality of life.
2010 2011 2012 2013 2014
9
8
7
6
5
4
3
2
1
0
L.A. County
California
U.S.
CHILDREN IN POVERTY IN L.A. COUNTY22
30%
20%
10%
0%2010 2011 2012 2013
L.A. County
California
United States
PROGRESS REPORT: 2010-2014 L.A. County Strategic Plan for Economic Development
Goal 4
L.A. County’s economy depends on having the requisite “jobs-producing” industrial and commercial land on which to support the businesses and industries that are – and will be – driving our economy. In many parts of the county over the last few decades, we failed to adequately appreciate the important
economic development connection with industrial land and proceeded to redeploy (and rezone) large swaths
of our industrially-zoned land base for population-accommodating uses.
Thankfully, during the last five years, this legitimized program of sanctioned
“land use swapping” slowed dramatically. Certainly, the Great Recession
played a marked role, making market-rate residential development on industrial
parcels less financially attractive. But public sensibilities have also changed,
and communities throughout L.A. County have begun to appreciate the
importance of our employment land base in supporting many of our
leading industry clusters, especially the production-intensive ones.
2010-2014
IMPLEMENT SMART LAND USE
“ “What constitutes ‘industrial’ use in the County of Los Angeles has changed dramatically over the
years. Industrial now typically refers to modern, cleaner and technically advanced sectors driving
our economy--not the ‘smokestack’ industries of yester year. – Bill Allen, President & CEO,
Los Angeles County Economic Development Corporation
www.LAEDC.org/StrategicPlan
This has led many cities and unincorporated areas to implement industrial land preservation policies and to make the protection of jobs-creating industrial land a key objective in relevant general, community and specific plans.
There has also been an uptick in the number permits for nonresidential construction projects between 2010 and 2014.
Although two data points certainly don’t represent a trend, between 2008 and 2012, a greater number of L.A. County communities placed a greater emphasis on protecting their industrially-zoned land bases, with a nearly one percentage point increase in land designated industrial within qualifying General Plans, when taken together.
2010-2014
IMPLEMENT SMART LAND USE
Even so, industrial vacancy rates remain prohibitively low in L.A. County.
Looking forward...Unfortunately, our region lost important economic development tools with the demise of redevelopment agencies in 2011 and the loss of enterprise zones in 2012. Since that time, many public entities are now actively looking for ways to better use their own (public sector) real estate portfolios to facilitate economic development priorities around key industries, such as bioscience and clean technology, as well as beginning to streamline certain entitlement and permitting processes to accommodate those goals. This is a promising development to watch and support going forward.
Source: 24Cushman and Wakefield; 25Southern California Association of Governments; and 26Construction Industry Research Board, California Homebuilding Foundation.
43.6% 2.0% 3.1% 51.3% 2008
44.8% 2.0% 3.9% 49.3% 2012
Residential Commercialand Services
Industrial Others
CHANGES IN PERCENTAGE OF GENERAL PLAN LAND USE TYPE25
$ $ $ $ $
$8,000
$7,000
$6,000
$5,000
$4,000
$3,000
$2,000
$1,000
$0
150%
100%
50%
0%
-50%
-100%2010 2011 2012 2013 2014
Valuation (in millions)
Annual % Change
NONRESIDENTIAL CONSTRUCTION PERMITS26
We have also seen a number of communities look to protect their employment spaces going forward.
OFFICE AND INDUSTRIAL VACANCY RATES24
5.2%
17.6%
2010 2011 2012 2013 2014
PERCENTAGE VACANT, QUARTERLY AVERAGES INDUSTRIALOFFICE
16.1%
3.4%
$ MILLIONS
PROGRESS REPORT: 2010-2014 L.A. County Strategic Plan for Economic Development
Goal 5
A strong and dynamic L.A. County economy is tied to our ability to move people, goods, information, water and energy in a secure, affordable, sustainable and efficient manner.
L.A. County has made incredible strides in infrastructure
development during the last five years. We approved
and delivered major projects at our twin ports to move
more than 15 million containers per year, while also
achieving record-breaking reductions in greenhouse
gases and other noxious emissions. We also dramatically
increased passenger and cargo traffic at our region’s
major international airport.
2010-2014
BUILD A 21ST CENTURY INFRASTRUCTURE
LAX VOLUME OF AIR TRAFFIC28
75
70
65
60
55
50
2.05
2.00
1.95
1.90
1.85
1.80
1.752010 2011 2012 2013 2014
Total passengers (in millions)
Air Cargo Million (in tons)
CHANGES IN CONTAINER THROUGHOUT VS. ELEMENTAL CARBON EMISSIONS29
1.0
0.9
0.8
0.7
0.6
0.5
2010 2011 2012 2013 2014
14.0TEUs 15.4TEUs14.1TEUs 14.6TEUs14.1TEUs
Emissions (M
icrogram/
Meter Cubed)
Container TEUs (Millions)
$3.5
$3.0
$2.5
$2.0
$1.5
$1.0
$0.5
$0 2010 2011 2012 2013 2014
Metro
LAX
Port of LB
Port of LA
FUNDS SPENT ON CAPITAL ACQUISITION AND CONSTRUCTION27
$ BILLIONS
www.LAEDC.org/StrategicPlan
We also passed a statewide $7.5 billion bond
proposition to subsidize a package of major state water
initiatives, and L.A. County utilities have quickly pursued
aggressive local and state renewables portfolio standards
for energy production and distribution, and we continue
to make significant headway towards future goals.
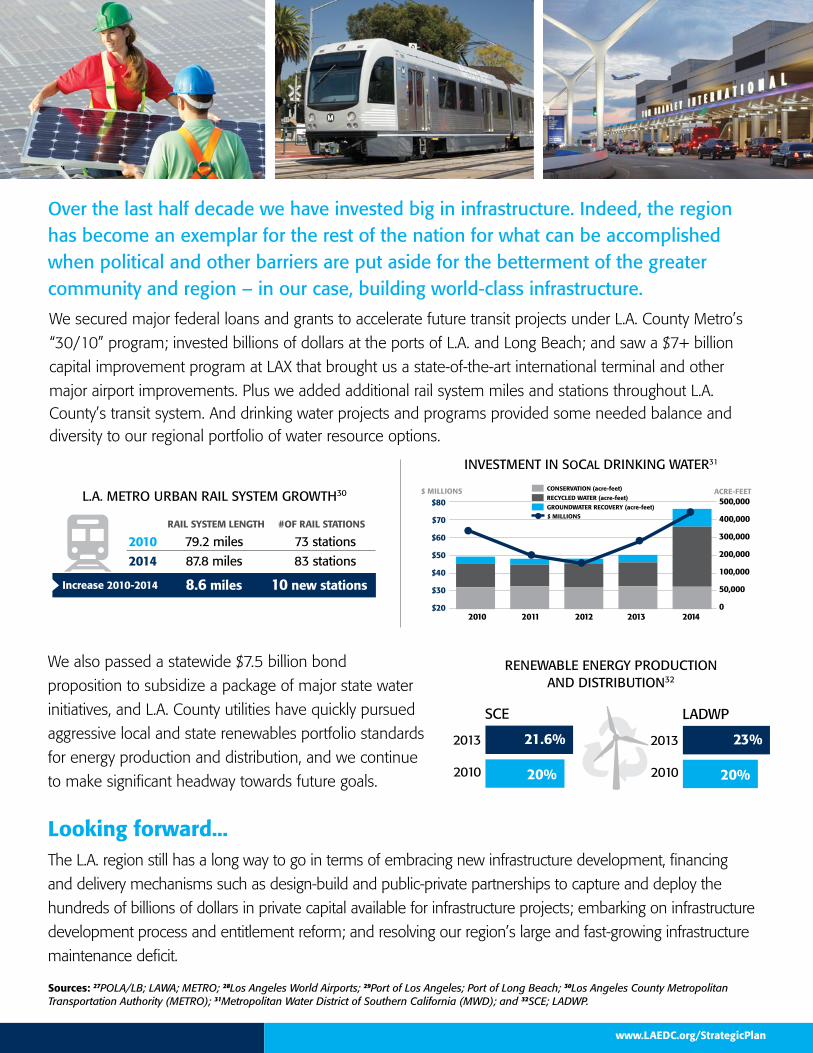
Over the last half decade we have invested big in infrastructure. Indeed, the region has become an exemplar for the rest of the nation for what can be accomplished when political and other barriers are put aside for the betterment of the greater community and region – in our case, building world-class infrastructure.
Looking forward... The L.A. region still has a long way to go in terms of embracing new infrastructure development, financing
and delivery mechanisms such as design-build and public-private partnerships to capture and deploy the
hundreds of billions of dollars in private capital available for infrastructure projects; embarking on infrastructure
development process and entitlement reform; and resolving our region’s large and fast-growing infrastructure
maintenance deficit.
Sources: 27POLA/LB; LAWA; METRO; 28Los Angeles World Airports; 29Port of Los Angeles; Port of Long Beach; 30Los Angeles County Metropolitan Transportation Authority (METRO); 31Metropolitan Water District of Southern California (MWD); and 32SCE; LADWP.
We secured major federal loans and grants to accelerate future transit projects under L.A. County Metro’s
“30/10” program; invested billions of dollars at the ports of L.A. and Long Beach; and saw a $7+ billion
capital improvement program at LAX that brought us a state-of-the-art international terminal and other
major airport improvements. Plus we added additional rail system miles and stations throughout L.A. County’s transit system. And drinking water projects and programs provided some needed balance and diversity to our regional portfolio of water resource options.
L.A. METRO URBAN RAIL SYSTEM GROWTH30
RAIL SYSTEM LENGTH #OF RAIL STATIONS
2010 79.2 miles 73 stations2014 87.8 miles 83 stations
8.6 miles 10 new stationsIncrease 2010-2014
RENEWABLE ENERGY PRODUCTION AND DISTRIBUTION32
SCE
20%
21.6%2013
2010
LADWP
20%
23%2013
2010
INVESTMENT IN SOCAL DRINKING WATER31
CONSERVATION (acre-feet)
RECYCLED WATER (acre-feet)
GROUNDWATER RECOVERY (acre-feet)
2010 2011 2012 2013 2014
$80
$70
$60
$50
$40
$30
$20
500,000
400,000
300,000
200,000
100,000
50,000
0
$ MILLIONS ACRE-FEET
$ MILLIONS
Acton • Agoura Hills • Agua Dulce • Alhambra • Alondra Park • Alpine • Altadena • Antelope Acres • Arcadia • Artesia • Athens Village • Avalon • Avocado Heights • Azusa • Baldwin Hills • Baldwin Park • Bandini • Bassett • Bell • Bell
Gardens • Bell�ower • Beverly Hills • Big Mountain Ridge • Big Pines • Bouquet Canyon • Bradbury • Burbank • Calabasas • Calabasas Highlands • Canyon Country • Carson • Castaic • Castaic Junction • Cerritos • Charter Oak •
Citrus • City Terrace • Claremont • Commerce • Compton • Cornell • Covina • Crystalaire • Cudahy • Culver City • Deer Lake Highlands • Del Aire • Del Sur • Desert View Highlands • Diamond Bar • Downey • Duarte • East Azusa
• East Compton • East Irwindale • East La Mirada • East Los Angeles • East Pasadena • East Rancho Dominguez • East San Gabriel • East Whitter • El Camino Village • El Dorado • El Monte • El Segundo • Elizabeth Lake •
Fairmont • Fair Oaks Ranch • Fernwood • Firestone • Florence-Graham • Franklin Canyon • Forest Park • Gardena • Glendale • Glendora • Glenview • Gorman • Green Valley • Hacienda Heights • Harbor Gateway •
Hawaiian Gardens • Hawthorne • Hermosa Beach • Hidden Hills • Hi Vista • Huntington Park • Industry • Inglewood • Irwindale • Juniper Hills • Kagel Canyon • Kinneola Mesa • La Canada-Flintridge • La
Crescenta • La Habra Heights • La Mirada • La Puente • La Rambla • La Verne • Ladera Heights • Lake Hughes • Lake Los Angeles • Lakeview • Lakewood • Lancaster • Lang • Las Virgenes • Lawndale •
Lennox • Leona Valley • Littlerock • Llano • Lomita • Long Beach • Longview • Los Angeles • Lynwood • Malibu • Malibu Bowl • Malibu Highlands • Malibu Hills • Malibu Lake • Malibu Vista • Manhattan
Beach • Marina del Rey • May�ower Village • Maywood • Mint Canyon • Monrovia • Monte Nido • Montebello • Monterey Park • Montrose • Neenach • Newhall • North Claremont • North El Monte
• Norwalk • Oat Mountain • Oban • Palmdale • Palos Verdes Estates • Paramount • Pasadena • Pearblossom • Pico • Pico Rivera • Pinetree • Placerita Canyon • Pomona • Quartz Hill • Rancho Dominguez • Rancho Palos Verdes • Redman • Redondo Beach • Rolling Hills • Rolling Hills
Estates • Roosevelt • Rosemead • Rosewood • Rowland Heights • San Dimas • San Fernando • San Gabriel • San Marino • San Pasqual • Sandberg • Santa Clarita • Santa Catalina Island • Santa Fe
Springs • Santa Monica • Saugus • Seminole Hot Springs • Sierra Madre • Signal Hill • Sleepy Valley • Soledad • South El Monte • South Gate • South Pasadena • South San Gabriel • South San Jose Hills • South
Whittier • Stevenson Ranch • Sulpher Springs • Sunland-Sylmar-Tujunga • Sunset Acres • Sunset Mesa • Sun Village • Sylvia Park • Temple City • Three Points • Trifuno Canyon • Topanga • Topanga Park • Torrance • Twin Lakes •
Universal City • Valencia • Val Verde • Valinda • Valyermo • Vasquez Rocks • Vernon • View Park • Vincent • Walnut • Walnut Park • West Arcadia • West Athens •
West Athens • West Carson • West Chatsworth • West Compton • West Covina • West Hollywood • West Pomona • West Puente
Valley • West Rancho Dominguez-Victoria • West Whittier-Los Nietos • West�eld •
Westlake Village • Westmont • Whittier • Whittier Narrows • Willowbrook • Wilsona
Gardens • Windsor Hills • Wrightwood
PROGRESS REPORT: 2010-2014 L.A. County Strategic Plan for Economic Development
LOS ANGELES COUNTY
“For cultural variety and sheer glitter...L.A. outshines them all. It has stunning weather that New York and London just can't compete with, the amazing beaches to show it off, world-class art, movie history, an endless parade of famous attractions, an improving crime rate and a certain well-known sign in the hills. After years of languishing, [Los Angeles] has top spot in the brand firmament. – The Guardian (May 2014)
“
JOIN THE CONVERSATION 2016-2020 L.A. County Strategic Plan for Economic Development
Share your thoughts with us about these important topics, and tell us what should be included in the next L.A. County Strategic Plan for Economic Development (2016-2020) using TWITTER: #LAStratPlan.
There will be a number of public input sessions held in the different sub-regions of L.A. County: Antelope Valley; Central L.A.; Gateway Cities; San Fernando Valley; San Gabriel Valley; Santa Clarita Valley; South Bay Cities; and Westside Cities, during mid-2015. As well as separate convening sessions focused on the next Strategic Plan’s key themes:
• Employing Cross-Cutting Strategies to Improve Educational Outcomes at All Levels, from early childhood on
• Strengthening our County’s Leading Traded Industry Clusters
• Removing Barriers to Critical Infrastructure Development, Financing and Delivery
• Increasing our Global Connectedness to increase our exports and attract jobs-creating investment
• Hastening Innovation, Convergence and Recombination across, between and within our
fast-emerging industry sectors
• Building More Livable and Sustainable Communities
Please attend a session and provide your input. To find out more information, please go to: www.LAEDC.org.
About LAEDCThe Los Angeles County Economic Development Corporation (LAEDC) is a private, non-profit 501c3 with a public benefit mission, and provides collaborative and strategic economic development leadership to promote a globally competitive, prosperous and growing L.A. County economy to improve the health and wellbeing of our residents and communities and enable those residents to meet their basic human need for a job. We achieve this through objective economic research and analysis, strategic assistance to government and business, and targeted public policy. Our efforts are guided and supported by the expertise and counsel of our business, government and education members and partners. Since 1996, the LAEDC’s Business Assistance team has helped to directly retain or attract over 200,000 annual jobs in Los Angeles County.
Contact Us:213-622-4300 [email protected] www.LAEDC.org/StrategicPlan