progress report rew00§ library ^collection. iftec …
TRANSCRIPT

™irni!ffi^EBCY s«™s
<& I 0RNVPROGRESS REPORT
-A.L REW00§LIBRARY^COLLECTION.
NLa2863 44Sb 031,0376 t
IftEC RESEARCH AND OEVELDPMEHT REPORT
OAK
CHEMISTRY DIVISION
QUARTERLY PROGRESS REPORT
FOR
PERIOD ENDING JUNE 30,1949
•BURY
ARTOU T , D i RECTOR
. ASSOCIATE DIRECTOR!
I8TANT D IRECTOR
01- • •- « 5k J •
RIDGE NATIONAL LABOtfATOIOPERATED BY
CARBIDE AND CARBON CHEMICALS CORPORATION
OPERATED BY
AND CARBON CHEMICALS CORPC
FOR THE
ATOMIC ENERGY COMMISSION
POST OFFICE BOX P
OAK RIDGE. TENNESSEE
V£
*ZA

OAK
Contract No. W-7405, eng 26
CHEMISTRY DIVISION
QUARTERLY PROGRESS REPORT
for Period Ending June 30, I9H9
ORNL 28 6
This document consists of
236 pages.
Copy $ of 93, Series A.
Is sued:
VJfcsMMlMt (
twoaMM* « i
i
J. A„ Swartout, DirectorE. Boyd, E„ H. Taylor, Associate Directors
M„ T„ Kelley, Assistant Director
£ j; it
P £ l<: (
l> jp< I
E *-P
V. •<it
*
Date I..„.d,§£P 141949
RIDGE NATIONAL LABORATORYOperated by
Carbide and Carbon Chemicals Corporationfor the
Atomic Energy Commission
- -fo«t Office Box P
Oak Ridge, Tennessee
3 44Sb 03t037fl
ORNL 286Progress Report
OAK RIDGE NATIONAL LABORATORY INTERNAL DISTRIBUTION
1. 0. T. Felbeck (C&CCC)2-3. 706 A Library
4. 706 B Library5. Biology. Library6. Health Physics Library
7-8. Training School Library9-12. Central Files
13. J. A. Swartout14'. J. H. Gillette
15. A. Hollaender16. J. H. Frye, Jr.17. E. J. Murphy18. M. D. Peterson19. C. N. Rucker
20. W. D. Lavers
21. A. M. Weinberg22. J. S. Felton
23. G. E. Boyd24. R„ W. Stoughton25. J. A. Lane
26. G. W. Parker
27. C. J. Borkowski28. M. A. Bredig29. G. H. Jenks
30. K. z. Morgan31. K. A. Kraus
32. H. A. Levy33. R. Livingston34. L. T. Newman
35. C. H. Secoy36. P. F. Thomason
37. C P. Hochanadel
38. 0. K. Neville39. M. T. Kelley40. W. H. Baldwin41. F. C. VonderLage42. A. R. Brosi
43. A. H. Snell44. S. A. Reynolds45. Central Files (Off-Plant^46. R. N. Lyons
OAK RIDGE NATIONAL LABORATORY EXTERNAL DISTRIBUTION
47»-54). Argonne National Laboratory55>57>-. Atomic Energy Commission, Washington58-61). Brookhaven National Laboratory62r63. General Electric, Schenectady64-65. General Electric, Richland66-69. Los Alamos
70-72. New York Directed Operations73. Patent Branch, Washington
74-88. Technical Information Branch, ORE89-92. University of California, Radiation Laboratory
93. Mound Laboratory
ABSTRACT
TABLE OF CONTENTS
&
NUCLEAR AND CHEMICAL PROPERTIES OF THE HEAVY ELEMENTS n
I. Solution Chemistry ,p
Behavior of Negatively Charged Metal Complexes on 12Anion Exchange Resins
The Uranium (IV)-(V)-(VI) System 32
Spectrophotometry of the U(VI)-Chloride System 41
Special Instrumentation 42
II* Phase Rule Studies a™
The System UOa-UOaSO^-HjO 43
Application of Kinetic Theory to the Critical Curvefor Aqueous Solutions of 1-1 Electrolytes
46
NUCLEAR AND CHIMICAL PROPERTIES OF ELEMENTS IN THE FISSION 47PRODUCT REGION
Characterization of Cs136 43
Preliminary Report on the Isolation and Characteri- 53zation of Long-Lived I128"
The Absorption Spectrum of Element 61 59
Search for Mo93 ' 68
Short-Lived Technetium Activities in U231' Fission 69
The Radionuclides of Tin 70
Hard Gamma Emitters in Fission 71
The Fundamental Chemistry of Ruthenium 84'
GENERAL NUCLEAR CHEMISTRY 94
Nuclear Chemical Studies of the Rare Earths 95
Production of Spectrochemically Pure Rare Earths 103for Research Purposes
Counting Yields of Low Energy Beta Emitters 104
RADIO-ORGANIC CHEMISTRY 106
Summary 107
The Synthesis of Low Molecular Weight Intermediates 108Containing C14•
The Synthesis of High Molecular Weight Intermediates 118Containing C14 Ring-Labeled Benzoic Acid and Intermediates
CHEMISTRY OF SEPARATIONS PROCESSES 120
I. Volatility Studies 121
II. Solvent-Extraction Principles and Applications 121
Study of Thorium Hydrolysis by TTA-Benzene Extraction 121
Separation of Hf and Zr 122
III. Ion-Exchange 131
Separation of Anions of the Fifth, Sixth and Seventh Groups 131
IV. Fission Product Separations 133
RaLa Process 133
Separation of Fission Product Rare Earths 138
Separation of Zr-Cb from F. P. Mixtures 146
PHYSICAL CHEMISTRY AND CHEMICAL PHYSICS 166
Spectra of the Heavy Elements and Rare Earths in Crystals 167and Solutions
Experiments With Molecular Beams 169
Calorimetry of Radioactivity 171
Microwave Spectroscopy 175

RADIATION CHEMISTRY 185
Decomposition of Aqueous Solutions of Fissionable 186Material
General 186
PHYSICAL MEASUREMENTS AND INSTRUMENTATION 187
I. E lectron and Optical Microscopy, Electron Diffraction 188
II. Instrument Research and Deve lopment 191
Beta Proportional Counters 191
A Four-Cycle Logarithmic Voltmeter 205
Coincidence Circuit for Use with Beta Proportional 206
Counters
ANALYTICAL CHEMISTRY 209
Ionic Analyses—Research and Development 210
Radiochemical Analyses—Research and Development 216
Spectrochemical Analyses—Research and Development 232
Analytical Service 235
A B STRACT
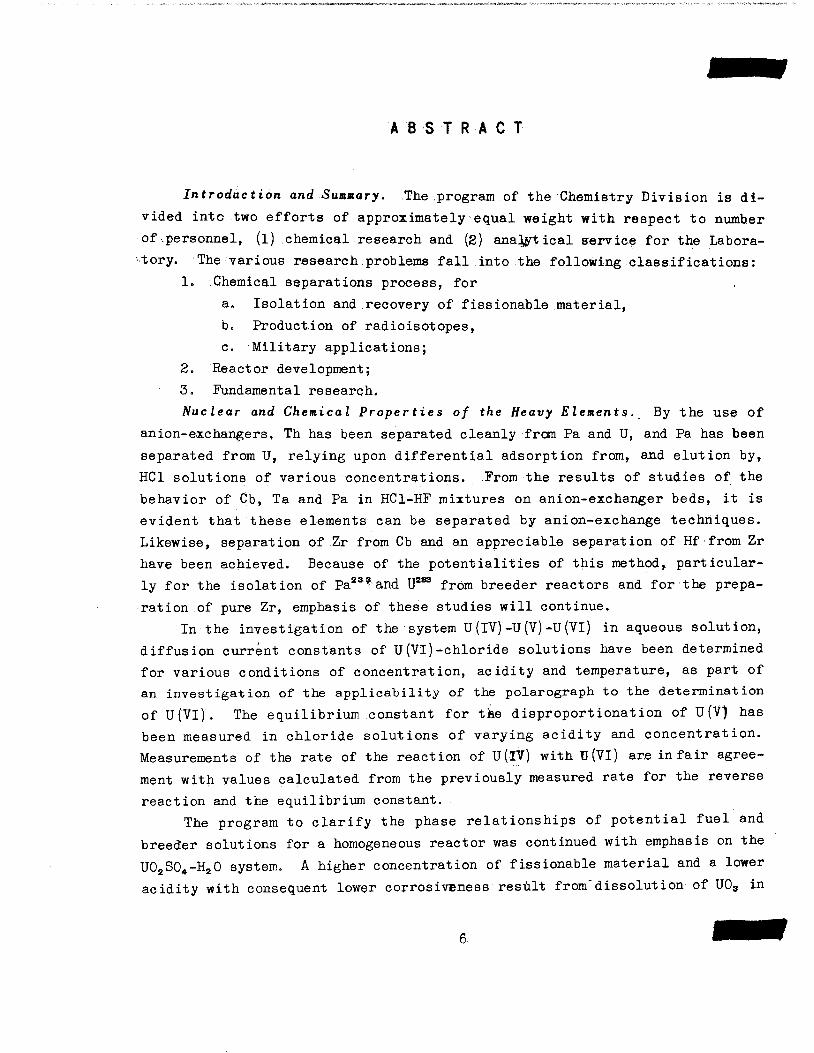
Introduction and Summary. The program of the Chemistry Division is di
vided into two efforts of approximately equal weight with respect to number
of personnel, (l) chemical research and (2) analytical service for the Labora
tory. The various research problems fall into the following classifications:
1. Chemical separations process, for
a. Isolation and recovery of fissionable material,
b. Production of radioisotopes,
c. Military applications;
2. Reactor development;
3. Fundamental research.
Nuclear and Chemical Properties of the Heavy Elements. By the use of
anion-exchangers, Th has been separated cleanly from Pa and U, and Pa has been
separated from U, relying upon differential adsorption from, and elution by,
HC1 solutions of various concentrations. From the results of studies of; the
behavior of Cb, Ta and Pa in HC1-HF mixtures on anion-exchanger beds, it is
evident that these elements can be separated by anion-exchange techniques.
Likewise, separation of Zr from Cb and an appreciable separation of Hf from Zr
have been achieved. Because of the potentialities of this method, particular
ly for the isolation of Pa233and U233 from breeder reactors and for the prepa
ration of pure Zr, emphasis of these studies will continue.
In the investigation of the system U(lV)-U(V)-U(VI) in aqueous solution,
diffusion current constants of U(VI)-chloride solutions have been determined
for various conditions of concentration, acidity and temperature, as part of
an investigation of the applicability of the polarograph to the determination
of U(VI). The equilibrium constant for the disproportionation of U(V) hasbeen measured in chloride solutions of varying acidity and concentration.
Measurements of the rate of the reaction of U(iV) with U(VI) are in fair agree
ment with values calculated from the previously measured rate for the reverse
reaction and the equilibrium constant.
The program to clarify the phase relationships of potential fuel andbreeder solutions for a homogeneous reactor was continued with emphasis on the
U02S04-H20 system. A higher concentration of fissionable material and a loweracidity with consequent lower corrosivEness;result from"dissdlution of U0a in
6.

the U02S04 solution- Four points were determined along the solubility curve
of U03 in the system, U03-U02S04-B^0 at 25° C
Nuclear and Chemical Properties of Elements in the Fission Product Region.
As a by-product of the preparation of large amounts of Xe for measurement of
its cross section as a function of neutron energy, sufficient quantities of
Cs*35 have become available to permit measurement of the half-life, 3.0 ± 0.3 x
10e y.Preliminary characterization of I128 indicates a half-life of 2-4 * 107 y,
radiations consisting of 100-130 kev electrons and a gamma or X ray of 28-32
kev, and a thermal neutron absorption cross section of about 15 barns„
Results of a search for 6.7 h Ho93 formed by neutron irradiation have in-
dicated that if it exists, the cross section for its formation from Mo by
neutron capture is less than 10 microbarns„
As a result of neutron bombardments of isotopically enriched Sn isotopes,
the 30-33 m activity previously observed in Sn has been assigned to mass 113.
In the systematic investigation of hard gamma emitters among the fission
products, I134 has been shown to have a half-life of 50.8 + 1.4-m, a hard /3-rayof 3„5-4%2 Mev and a softer /S-ray of 1.5-1.75. Mev, in addition to the hard
gamma (above 2,2 Mev) previously reported. On the basis of a comparison of theabsorption coefficient of the hard gamma of I135 with absorption coefficientsmeasured for gammas of known energy in the absorber rack placed over the heavywaters photoneutron fission chamber, the energy of the I135 gamma has been determined to be 2,4 Mev„
The intricate remotely-controlled apparatus installed in the hot-laboratory
specifically for the Xe cross section problem has proved to have wide application. In addition to the original purpose it has served to prepare largeamounts of fission iodine or decay products of the iodine for (l) the characterization of Cs135, (2) the study of hard gamma emitters, (3) measurement of nuclearproperties by microwave techniques, and (4) a recently initiated co-operativeeffort with the Y-12 Laboratory to measure the nuclear spins of the Xe isotopes
by spectrographs methods.The measurement of the absorption spectra of the chloride and nitrate of
element 61 in aqueous solution has been completed. The absorption bands arein the same position and of the same magnitude for the two salts, resemble thoseof neodymium in intensity and number but are distinctly separable by at least8 m/i„

General Nuclear Chemistry. In the program to clarify the nuclear chemistry of the rare earths, the beta ray spectra of Y80 and Y81, the beta ray energyof HoMe, the nature of the 12 m activity of Nd, and the origin of the Ho activityin irradiated Dy have been established.
The counting yields of a number of low energy beta emitters have been determined by comparison of the counting rates observed in a beta proportionalcounter with the absolute disintegration rates.
Radio-Organic Chemistry. New methods have been developed for the preparation of formaldehyde - C14 and acetic acid - 2 - C14. The stockpiling ofC labeled compounds for distribution, as well as for use in the research
program, continued with addition of formaldehyde - C14, carboxyl - C14 sodiumacetate, sodium formate - C14, and methanol - C14. As a result of a recentmove to new laboratories in a remodeled building in the Y-12 Area, space and
facilities are available to permit initiation of production of compounds forwhich procedures were developed during the past year.
Chemistry of Separation Processes. In preparation for a study of thefundamental properties of the metallic fluorides of concern to separationproblems, a laboratory is being equipped with apparatus essential for researchwith fluoride systems.
In connection with the proposed TTA-solvent extraction method for separat
ing Hf from Zr, the extraction of Hf from HCl and HNOa solutions is being in
vestigated. It has been found that, (l) the extractable species are not identi
cal from the two media, (2) more than one species are extractable from H^l
solution, (3) the acid dependence over the range, 0.5-3.5 M, is^about 3 inboth cases and (4) the TTA dependence is 3.0 in the case of HCl and 3.7 in the
case of HNO3 solutions.
The absorption process, utilizing silica gel, for the extraction of fission
Zr and Cb from the waste raffinate of the first cycle of the Redox Process
continues to appear promising. It is anticipated that testing of the process
on a full Hanford activity level in apparatus now being installed in the hot-
laboratory will be completed by September, 1949. In addition to research to
clarify the effects of process variables, methods for concentrating the product
after elution from the adsorbent and, also, alternative methods for extraction
from both the fiedox raffinate and original dissolver solutions are being de
veloped.
In a co-operative program with the Technical and Operation Divisions, to
improve the RaLa p'rocess, details of the Chemistry are being studied includ-

ing (1) the distribution of fission products in the lead sulfate precipitationand carbonate metathesis steps, and (2) methods for purification of theelectrolyzed product.
In connection with a study of the separation of anions by ion-exchange,CI-, Br" and I" have been separated by elution with Na2COs solution from acolumn of anion-exchanger.
Physical Chemistry andChemical Physics. Work on low-temperature spectroscopy of crystals and solutions of heavy elements and rare earths has been
concluded and the principal results will appear shortly. A summary of solventsfluid at -196° C appears in this report.
The first results of the co-operative program with Duke University havebeen the determination for I129 of the nuclear spin, nuclear magnetic momentand ratio of nuclear quadrupole moment to that of I127. These are, respectively:7/2, 2.74 ± 0.14 nuclear magnetons and 0.7353.
A calorimeter has been designed and built to operate isothermally at thetemperature of liquid helium. It is intended for the measurement of easily
absorbable nuclear radiations (beta particles).
Radiation Chemistry. The 2 Mev Van de Graaff generator has been assembled
by members of the Physics, Instrument and Chemistry Divisions and will be in
operation after drying out.
An apparatus has been built for measuring continuously the pressure (to
5000 lb/in2) over solutions in the pile.
Instruments. Further studyhas been made ofthe beta proportional counter,
directed toward establishment of optimum gas composition and improvement fn the
associated amplifier.
A coincidence circuit has been developed and built for use with beta pro
portional counters.
Analytical Chemistry. New analytical procedures which have been developed
to meet the requirements of pilot-plant processes include (l) a micro-volumetric
method for uranium Hsing an automatic titrator, (2) a polarographic method for
routine uranium analyses, and (3) a polarographic method for determination of
micro amounts of iodine.
Research on radiochemical analytical procedures which are required for
radioisotope production and for pilot-plant processes is necessarily broad in
scope. Included during this period were investigations of (1) the decay scheme
of Ba140, (2) the decay and radiations of CI38, (3) the standardization of
counting techniques entailing the accurate calibration of routinely used
counters;, measurement of gamma counting efficiency, and preparation of alpha
counting standards, (4) measurement of activation cross sections, and the per
formance ofactivation analyses, and {5) development and improvement in analyti
cal methods for radiozirconium, plutonium, the transuranic elements and rare
gas activities.
Improvements have also been effected in the application of spectrochemi
cal methods to the analysis of process solutions.
10

NUCLEAR AND CHEMICAL PROPERTIES
OF THE HEAVY ELEMENTS
- 11 -

I. SOLUTION CHEMISTRY
BEHAVIOR OF NEGATIVELY CHARGED METAL COMPLEXESON ANION EXCHANGE RESINS
K. A. Kraus and G. E. Moore
1. Introduction. In the previous quarterly report some initial anion ex
change studies, pertaining to Pa(V), were described using the anion exchange resin
Dowex A-l. These studies have been continued and extended to a number of other
metal ions. In this report some results, partly preliminary, on the behavior
of Cb, Ta, Pa, Zr, Hf, Th, and Fe in HCl and HC1-HF solutions will be given.
2» Experimental Procedure. (a) Resin: The resin used was Dowex A-l, a
quaternary amine polymer. Mesh size was 200-230 as obtained by wet screening.
(b) Columns and column operation: The adsorption columns were constructed
of "Transflex"' tubing, with cross-sectional area 0.022& cm2,, as determined byweighing a column of. water of known length. The .eluent in most cases, partic
ularly for HF solution, was contained in. 50 ml "Bakelite"' burettes, and. the
height of the liquid column, occasionally adjusted to maintain approximately
the desired flow rate. In general, it. was. not attempted to maintain exactly
constant flow rates.. Instead., the volume of eluent which, had passed was de
termined from the burette readings.' at frequent intervals.
In most cases the ion (or ions.) under, investigation were added in a small
volume to a column which had previously been equilibrated with the desired
acid mixturei, In general, it was attempted to have the added solution of
approximately the same compositionasthe solution in the column and the eluent.
In a few cases the additions were carried out. with the column liquid at a
composition to cause strong adsorption, and the material was then eluted by
changing the composition of the eluent.
(c) Tracers: All experiments were carried out. with radioisotopes of the var
ious elements to permit the use of radiochemical techniques for analysis and
to avoid complications in the analysis of the column data which might arise
12

from non-linear adsorption isotherms, which could, be expe.cted at high concen
trations. In some experiments where the radioisotope was hot carrier-free and
of relatively low specific activity, such difficulties were encountered,
(1) Columbiums All experiments, were carried out with Cb96 [/3-emitter,Ti. = 35 d^1']- which was kindly furnished us by W„ H„ Baldwin and co-workerswho isolated it from fission product mixtures,,
(2) Tantalums The experiments were carried out with pile-ac±ivated tan-talum which contains Ta182 [Remitter, Ti - 117 d^]. The activation wascarried out with tantalum metal of high purity. It was dissolved in an HN03-HF
mixture (5 MHN0a, 18 MHF).
(3) Protactinium: All experiments were carried out with Pa833 [/3-emitter, Ti ~ 27,4 d^1'] prepared by neutron activation of thorium metal, Isolationof the tracer was achieved in one case by solvent extraction from an HCl solution
of the metal as described in ORNL 330, and in another case purification was
achieved by anion-exchange as described in Section 3,
(4J Zirconium: The earlier experiments were carried out with Zr"' [/3-emitter, Ti - 17.0 h^1'] prepared by short neutron irradiation of Zr metal ofhigh purity. The metal was dissolved in an HC1-HF mixture. In view of the
short half-life of this isotope the later experiments were carried out with
Zr96 [/3-emitter, T.1 = 65 d^1'] which was kindly furnished us by W„ H, Baldwinand co-workers who isolated it from fission product mixtures,
(5) Hafnium: All experiments were carried out with Hf181 [/3-emitter,T^ •- 46 d • '] prepared by neutron irradiation of spectrochemically pure Hf0C12.We are indebted to Mr. J, P. McBride for a sample of this irradiated hafnium
oxychloride. The material was dissolved in a mixture of 2 M HCl and 2 M HF,
(6/ Iron;; The experiments were carried out with (primarily) Fe59 [/3-emitter, Ii - 46 dj. We are indebted to the Operations Division for the sample oftracer.
(7) Uraniums The experiments were carried out with j]33"* [a-emitter ,T.1 = 1.6 * 106 y„ ^'3 which was kindly furnished us by D. C, Overholt of theTechnical Division.
(1)Information from "Table of Isotopes by G. T Seaborg and I Perlman, Rev, Modern Phys .20,585 (1948),
13
(d) Analytical procedures: The data were collected using essentially twomethods of analysis. Using a continuous recording system the activity of theeffluent of the column was monitored. Positive characterization of the bandswas effected through radiochemical assays. In addition, direct scanning of thecolumn was usedto locate the bands and determine the rate with which they moved down the column on elution,
(1) Continuous recording of activity of effluent: The activity of theeffluent was recorded on a Brown Electronic strip-chart recorder: by passing thesolutions through a thin-window flow-cellwhich was placed near, a G-M tube. Theelectronic circuit contained an integrating device and the recorder was of thelogarithmic type. W The equipment was similar to:that'developed at ORNL anddescribed by Ketelle and Boyd. &>
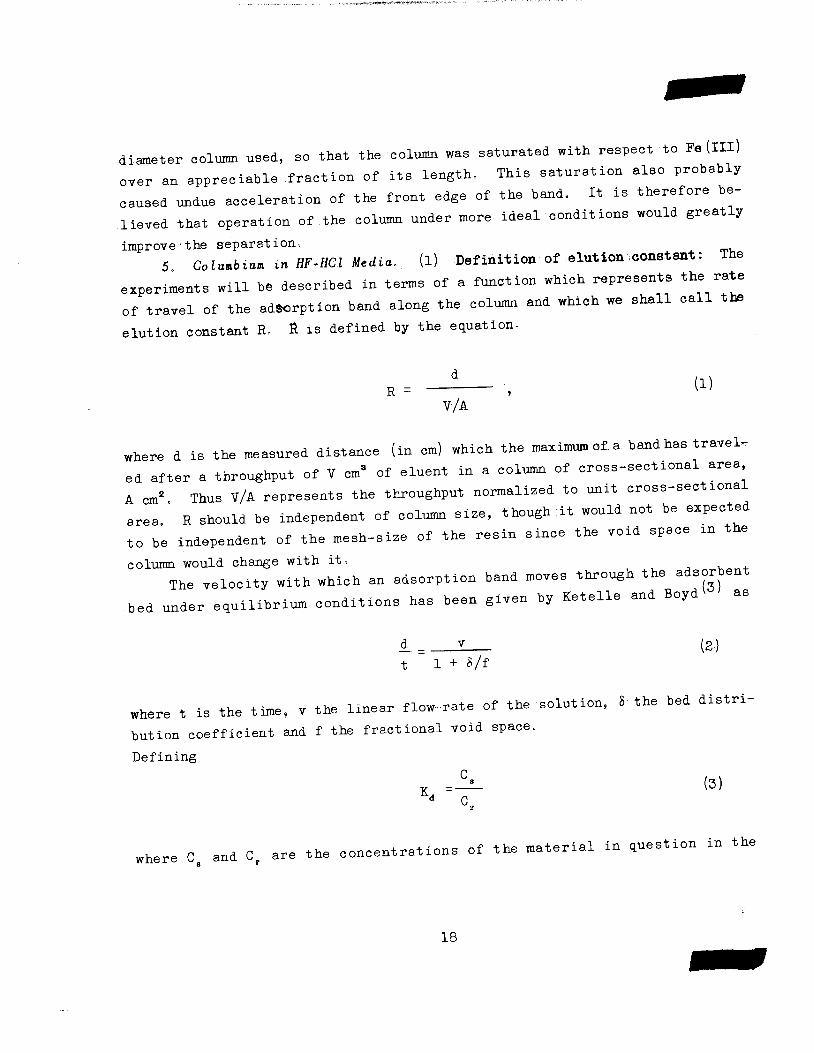
(2-) Direct scanning of column: In order to obtain pore directly theelution rate of the element under a specified set of conditions, the positionof the adsorption bands was obtained through scanning with a G-M tube. Forthis purpose a G-M tube was mounted on a cathetometer stand. Collimation wasachieved with a | inch lead shield containing a narrow slot, which was placedin front of the G-M tube. The tube was connected to a standard G-M scalercircuit. The shape and position of the bands; were: obtained from the countingrate as a function of column distance. Some typical results for Cb(V) can beseen in Fig. 1,
The determination of elution rates by this method offers a number ofadvantages over the method of continuous monitoring of the- effluent. If apreviously identified, pure activity is used, the elution rate can be determined rapidly and with relatively high precision, since the bands, in general,are quite sharp, particularly if they move slowly. In the latter case a precision of better than 10% appears to be obtainable with the band moving onlythrough less than 2 cm of column. Thus;, considerable savings in time can beachieved particularly for substances whose elution rates are unknown at thebeginning of the experiment and ,for which it is therefore difficult to predict
Theelectric.l circuit was prepared for us by F. W. Manning of the Instrument Division<2>i0RNL •"-*• '"* "• «J •*••». "anning 01 tHe Instrument Division of
/ 3 \
B, H. Ketelle and 0. E. Boyd, J Am Chem, Soc. 69,2800 (1947),
14

12
<
<r 8
COQC
<r
FIG. I
TYPICAL SERIES OF SCANNING CURVES
/O • \ R(CALCULATED):(I)-(n):O.I68\ I V (I)-(HI):0.I64\Q 4 \ (n)-(m):o.i64
O
>T / JO< I D V
f \
95Cb IN 6M HCI-0.5M HF
AVERAGE FLOWRATE : 0.25m!cm"2 MIN"V l0|~ ^CK BURETTE READINGS AT PEAK: (I) 20.69
(11)21.43(111)24.68
'-<?
/ \
o
0 5 10 15 20
DISTANCE (cm)
NOT CLASSIFIEDDWG 7557
what size column would give sufficient precision for the experiments. Using
the scanning technique it is thus feasible to select a column of standard
lengthy long enough to permit satisfactory measurements for rapidly moving
bands and still complete experiments with slowly moving bands in a reasonable
period of time. In addition, the method appears to furnish a promising check
of adsorption theories, particularly in so far as changes of band character
istics with elution rate or distance are concerned; Unfortunately, however,
the method is somewhat limited in its application since alpha^emrtters cannot be
used and since the wall-thickness of the' column places serious restrictions on
the use of weak beta emitters,,
3. Separation of Th(IV), Pa(V) and U(VI), The results pertaining tothis
separation in HCl solutions have been reported in ORNL 550 (April, 1949), Itmay be repeated here that this separation can be carried out in strong HCl,
The separation of Th from Pa and U is particularly effective since under con
ditions where Th rapidly breaks through the column, neither Pa nor U move
appreciably. Separation of Pa and U was effected through selective elution
with HCl,
Since this report was issued, a sample of PaJi*s tracer was completely separated from ca, 1 g of pile-bombarded thorium using a 6 cm column (0,051 cmcross section) by adsorbing the Pa in 9 M HCl,, washing with 9 MHCl andeluting
with 3 M HCl, Since under these conditions and after prolonged washing the Pa
was still in a narrow band,, even shorter columns could have been used satis
factorily.
Using' qualitative considerations the formulas. PaCle lor a basic chloride
complex of charge -3) and U02Clg (or U0aCl8""4} were tentatively suggestedfor the adsorbed negative complexes,
4, Separation of Pa(V) and Fe (III) This separation was found to be
surprisingly difficult in HCl solutions., although only one set of conditions
has been investigated at this time.
The separation was attempted in 3,8 MHCl, using a 14,5. em column (0,051cm2 cross section), and the results are shown in Fig,, 2,
It can be seen that Pa(v) is eluted first under these conditions. The
elution band of Fe(lll) in this experiment was highly unsymmetrical showing a
very prolonged "tail"'. This distortion is believed to be, at least in part,
due to the fact that the amount of Fe(III) used was very large for the small
16.

oo
or
ID
r- 0=
o
0
0 10
DWG
FIG. 2
SEPARATION OF Fe(III) AND Pa(2) BY ANION EXCHANGEIN 3.8 M HCl
GRAPH TRANSPOSED FROM SHIP CHARTRECORD-BACKGROUND NOT SUBTRACTED
FLOWRATE i ca 0.2 cm M!NDOWEX-I,COLUMN LENGTH: 15 cm
15 20TIME (HOURS)
30 35 40
diameter column used, so that the column was saturated with respect to Fe (ill)over an appreciable fraction of its length. This saturation also probablycaused undue acceleration of the front edge of the band. It is therefore believed that operation of the column under more ideal conditions would greatlyimprove the separation,
5 Columbia* in HF-BCl Media., (1) Definition of elution constant: Theexperiments will be described in terms of afunction which represents the rateof travel of the adsorption band along the column and which we shall call theelution constant R. R is defined by the equation.
R(1)
V-/A
where d is the measured distance (in cm) which the maximum of. a band has travel,ed after a throughput of Vcm3 of eluent in a column of cross-sectional areaAcm2 Thus V/A represents the throughput normalized to unit cross-sectionalarea Rshould be independent of column size, though it would not be expectedto be independent of the mesh-size of the resin since the void space m thecolumn would change with it.
The velocity with which an adsorption band moves through the adsorbentbed under equilibrium conditions has been given by Ketelle and Boyd as
(2)t 1 + S/f
where t is the time, v the linear flow-rate of the solution, 8 the bed distribution coefficient and f the fractional void space.
Defining
rr =-^- (3)K<» C
where C and Cr are the concentrations of the material in question in the
18

solution and resin respectively [e.g., in the units (moles/cc of solution) and(moles/g oven-dried resin)], The bed distribution coefficient 8 can be ex-
(5)pressed as v '
8 = -L- (4)
where p is the bed density (g oven-dried resin/cc bed).It can readily be shown that d/tv is equal to Rf, since v = v'/fa (where
v' is the volume of eluent entering the column per unit time) and since tv' = V.Thus
d _ _dfA _ dfA ._tv tv' V
Combining equations (2) and (5) it is found that
Rf (5)
R --i— (6)f + 8
For values of 8 » f equation (6) reduces to
»=T=T«< (7)(b) Elution constant of Cb(V)s The elution constant R of Cb(v) was determinedfor two series of Hf-HCl solutions, In series (a) the concentration of HF was
maintained at 0.5 Mand the concentration of HCl varied (from 0.2 to 9.0 M)and in series (b) the concentration of HCl was maintained at 9.0 M and the
concentration of HF varied (from 0,004 to 0,5 M),The data are summarized in Tables I and II and Figs, 3 and 4.
It can be seen from Table I that the elution constant of Cb in 0.5 MHF
first increases rapidly with HCl concentration, passes through a maximum near 3MHCl and decreases sharply above 6 MHCl, In addition it can be seen from
Fig. 3 that the increase in R below 3 MHCl is approximately linear and ofapproximately unit slope. Since according to equation (7) the elution constantis directly proportional to the distribution coefficient K,, the data imply a
19

TABLE I
Elution constant of Cb as a function of
HCl MOLARITY
0-2
0 5
3 0
6 0
9-0
0013
o,oso<b)0-042^>
0,073
0 . 187
0 174
0 144
0 159
0. 071
0- 076
0- 074
HCl mcentmation .in 0,5 M HF
METHOD^'* •
M
S
M
S
if
s
s
AVERAGE FLOW- HATE
(ml Bin"1,cm"2\
Oi*5
0 18
0 19
0.29
} 0. 26
} 0- 25
} 0-18
0- 18
b, ^£.r„^^ ».-• The data obtained
mfete.. enl wtlun thr bmi, the value Of R Is only approx-
(ffi). Zir-GbHf band as in (b).
TABLE II
Elution constant of Cb as a function of HF concentration in 9.0M HCl
HF MOLARITY
0 s 0-071
0 076
0-0 74
0- 1 0 26
002 0.019
0. 004 0 0033
20
AVERAGE FLOW-RATE
(ml min * cm"2)
} 0- 18
0- 18
0. 19
0- 19
0- 18

.00
a:
t-
<I-
§ o.io
h-z>_iLU
0.010.
NOT CLASSIFIEDDWG 7559
FIG. 3
ELUTION CONSTANT OF Cb(V) AS FUNCTIONOF HCl CONCENTRATION IN 0.5 MHF
SLOPE
0.0

.000
0.100
cr
r-
•z.oo
zo
^-n
uj 0.010
0.001
FIG. 4
ELUTION CONSTANT OF Cb(V) AS FUNCTIONOF HF CONCENTRATION IN 9.0 M HCl
0.001-I 1 I I I I 111
0.010J I I
0.100
M HF
22
NOT CLASSIFIEDDWG. 7560
J I I I I II.000

linear decrease of K, with increasing HCl concentration. This rate of changeof K with HCl concentration is surprisingly small since it represents thecombined effect of the increasing elution power of the solvent with increasingCI" concentration and of the change in concentration of the adsorbable speciesdue to the concomitant decrease in fluoride (F~) concentration (through theequilibrium HF + H20 < I H30+ + F")„
To illustrate the solvent effect alone, one can consider the simple casewhere the metal complex (A"n) is completely formed and is distributed betweenthe solvent and resin according to the equilibrium
n RC1 + A"n : * R A + n CI" (8)
for which the mass action expression
(R.A)(C1-)B = r (9)(RCl)n(A"n) d
applies. For tracer solutions the simplification Kd (RCl)n =K* can be madeand hence
Kd = afCl-]-, (10)
where a = l/K* is a proportionality constant. Thus, barring an increase inaverage negative charge of the complexes with increasing HCl concentration theobserved unit slope of the plot of log Kd vs log [HCl] implies that the adsorbed ion has and maintains a charge of minus one. This suggests that the sum ofF" and CI" ions coordinated to the Cb(V) is six (i.e., CbX6-) or that the adsorbed species is an acid with one or more protons (e.g., HCbX7 , H2CbX8 ,where X represents either F" or CI"), Unfortunately, however, an increase incharge with increasing HCl concentration cannot be entirely eliminated (thoughit is improbable as discussed below) in spite of the fact that adecompositionof the fluoride complex with increasing HCl concentration would be expected.For each fluoride ion lost from the complex, more than one chloride ion couldbecome attached or the replacement of a coordinated fluoride ion by a chlorideion might be accompanied by the loss of aproton from an acid complex of thetype described or through a hydrolytic reaction.
25

In this connection it is of interest that on going to very high HCl con
centrations, R decreases, and in this range a minimum increase of two in
negative charge on the complex seems to be occurring.
The results for HF solutions of varying strength (and constant 9,0 MHCl),
as shown in Fig, 4, are equally surprising Here the elution power of the
solvent remains constant and the concentration of the complexing agents (HF)
changes. Following the curve to lower HF concentrations it appears to be
composed of a linear branch \k) of unit slope where R increases with decreas
ing HF concentration The curve then passes through amaximum (near 0,1 III HF),
The maximum is followed by a branch (B) where R rapidly decreases with de
creasing HF concentration. The curve does not have a constant slope, but it
might be composed (in the limits) of two lines of slope one and two as indi
cated in Fig., 4,
Branch "A" appears to be "normal"-, i.e. , the average negative change of
the complexes decreases with decreasing concentration of the complexing agent.
However, the behavior in branch "B'v is surprising since here the average
negative change of the complexes increases with decreasing concentration of
the complexing agent, This implies either that fluoride ions are replaced by
more than an equal number of chloride ions or that some of the fluoride ions
which are replaced by chloride ions also carry protons away with them. Again,
as above, this could occur because the complexes are complex acids or because
complicating hydrolytic effects occur The latter are hard to imagine however,
in view of the already rather high negative change of the complexes which leaves
little coordination space for waters of hydration which could undergo hydrolysis,
6 Tantalum in HF HCl Mixtures This study of tantalum has only recently
been started and data are available only for a 4 x 10"° U HF-9,0 M HCl solu
tion. It was found that under these conditions tantalum moves extremely slow
ly, the elution constant R being less than 0.0001, This value is approximately
a factor of 30 smaller than the corresponding value of R for columbium (R =
0,0035; and approximately 900 times smaller than the corresponding value for
protactinium ^R = 0-09),
A study of R under other conditions is under way. However, it appears
quite obvious that the separation of the triad,, columbium, tantalum and pro
tactinium, is quite feasible with anion-exchange resins,
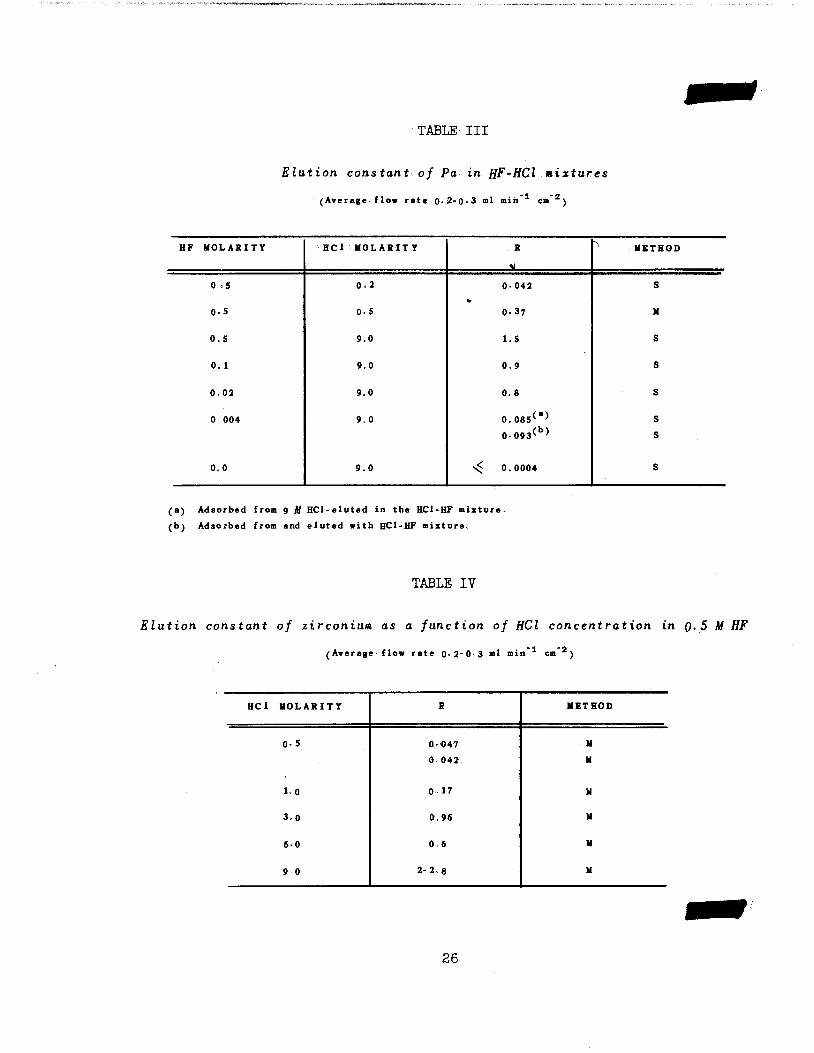
7, Protactinium in HFHC1 Mixtures,, For 0,5 M HF solutions the elution
constant for Pa was found to increase rapidly with Increasing HCl concentration
24

as shown in Table III. The slope of the log R - log [HCl] curve appears to bebetween 2 and 3 at low HCl concentrations. In the mixture 0.5 A/HF-9.0 M HCl,
R is very large, and approaches the theoretical limit. In contrast to this,Pa was found to elute only very slowly in 9 MHCl (not containing HF). **'
The correspondingly small value of R for 9.0K HCl has now also been con
firmed by the scanning method where R^ 0.0004 was found.
At constant 9.0* HCl, R decreases only slowly with decreasing HF con
centration down to ca. 0.01 Af HF, Below this HF concentration, R appears to
decrease rapidly, possibly with the square of the HF concentration althoughthe data are too limited to establish the slope conclusively. At the rather
lowHF concentration of 0.004 M in 9 MHCl (where the concentration of F~ isprobably considerably less than 10"* M) R is still at least 200 times largerthan in pure HCl.
This very large influence of a small amount of HF on the elution behaviorof Pa in 9.0 MHCl is very perplexing, particularly since the HF causes an increase in the elution constant (i.e., a decrease in average charge). As discussed earlier the reverse might be expected since HF is the stronger complexing agent. Since a similar effect was found for Cb and Zr, however, rt appearsthat this is a reasonably general phenomenon.
In order to investigate if this effect is due to a non-reversibilityphenomenon, Pa was put onto a column which had previously been equilibratedwith 9.0 MHCl. After sufficient column volumes had been passed through toprove that adsorption was very strong and r^ 0.0004, elution with a mixtureof 9.0 Af HC1-0.0O4 MHF was started. The Pa under these conditions showed R =0.087, in close agreement with the value R = 0.095, which was found when thePa was both adsorbed from and eluted with the HCl-HF mixture. This experimentthus gave no indication of irreversible complex formation.
It is also unlikely that the phenomenon is due to hydrolytic colloidformation in the HCl solutions since it had previously been shown^> that Paelutes readily if it is adsorbed from 9 MHCl and eluted with HCl of lowerconcentration, where colloid formation would be expected to be more important.
8. Zirconium in HF-HCl Mixtures. The elution constant of Zr(IV) as afunction of HCl concentration (at 0.5 MHF) are shown in Table IV and Fig. 5,
(4)K. A. Kraus, G. E. Moore, ORNL 329, April 1949,
25
TABLE' III
Elution constant of Pa in HF-HCl mixtures
(Average flow rate 0-2-0-3 ml min cm* )
HF MOLARITY HCl MOLARITY R "' METHOD
0 *5 0.2
w
0-042 S
0.5 0-5 0.37 M
0.5 9.0 l.S S
0. 1 9.0 0.9 s
0.02 9.0 0.8 s
0. 004 9.0 0.085(a)0-093(b^
s
s
0.0 9.0 < 0.0004 s
(a) Adsorbed from 9 M HCl-eluted in the HCl'HF mixture,
(b) Adsorbed from and eluted with HCl-HF mixture.
TABLE IV
Elution constant of zirconium as a function of HCl concentration in 0.5 M HF
(Average flow rate 0-2-0.3 ml min cm 2)
HCl MOLARITY R METHOD
0.5 0-O47 M
0042 M
1.0 0-17 M
3.0 0.96 M
60 0.6 M
9 0 2-2.8 M
26

10.00
Z
zoo
zo
r-
_l
1.00
0.10
0.01
NOT CLASSIFIEDDWG. 7561
FIG. 5
ELUTION CONSTANTS OF Zr(IV) AND Cb(V) ASFUNCTION OF HCl CONCENTRATION IN 0.5 MHF
0.1010.00

It may be noticed that the elution constant increases rapidly with increasingHCl concentration except for the point at 6,0 MHCl, which may be in error.It should be pointed out that the errors in estimating R become very largewhen R is of the order of unity and thus approaches its theoretical limit,which is probably of the order of 3 if the fractional void space is 0,3,
When R is large, errors result from the following causes: (l) the distances travelled by the band per minute is so large, as to almost preclude itsmeasurement by scanning, (2) If the tracer is added from a solution which isnot exactly of the same composition as the eluent, the measurement will bewith respect to the solvent of the tracer rather than the eluent, since thereis not sufficient time for replacement of the solvent by the eluent, (3) errors in the estimation of the volume of the connecting tubings can becomeserious if the monitoring method is used.
The plot of the data in Fig, 5 indicates that at low HCl concentration Rvaries with the square of the HCl concentration (slope = ca„ 2),
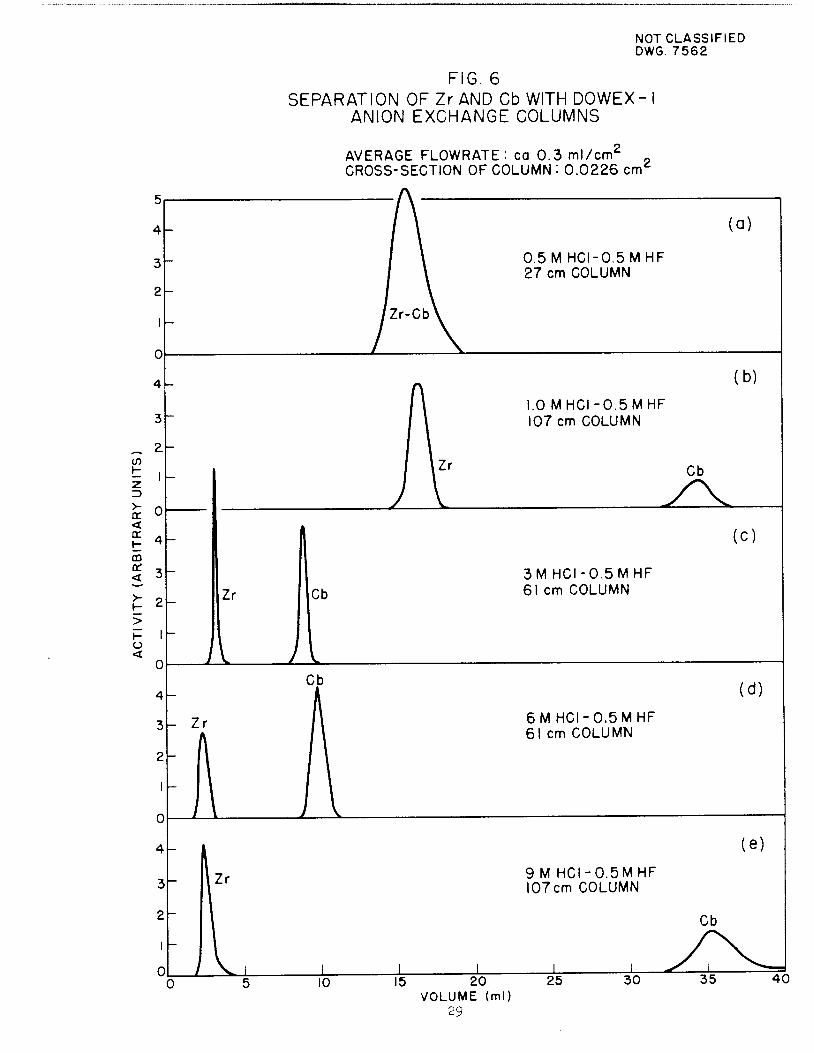
9„ Separation of Zirconium and Columbium,, The essential features of thisseparation in HF-HCl mixtures can be deduced from the data given in Parts 5and 8 and from Fig. 5, It may be noticed from this figure that the change inthe specific elution constant of zirconium is different from that for columbium;the former changing with a second power HCl dependence and the latter with a
first power dependence. The two curves cross at ca, 0,5 MHCl, and in thisregion separation is difficult if not impossible- It may be pointed out thatby operating on either side of this cross-over point separations should bepossible, At the high acid side Zr should elute first, and at the low acidside Cb should elute first,
Considering only the region on the high acid side of the cross-over point,it can be seen that, as both elution constants increase, their ratio becomesincreasingly different from unity. Thus the separation of zirconium from
columbium becomes increasingly effective as the time necessary for elution ofthe slowest component decreases
Typical elution curves which illustrate the separation of Zr and Cb bythis method and which were obtained through continuous monitoring of the effluent are shown in Fig, 6
10 Attempted Separation of Zirconium and Hafnium, Only two experimentshave been carried out at this time. In both experiments only a singly elutionband was observed, although enrichment of Zr in the earlier fractions and Hf
28
4-
3"
2
0-
4
_ 2en
>-ac.<
CD
a:<
>-t-
<
0-
4-
3
2
I
0
4
3
2
I
0
4-
3
2
OL
Zr
NOT CLASSIFIEDDWG. 7562
FIG. 6
SEPARATION OF Zr AND Cb WITH DOWEX-ANION EXCHANGE COLUMNS
AVERAGE FLOWRATE: ca 0.3 ml/cnTCROSS-SECTION OF COLUMN : 0.0226 cm^
0.5 M HCI-0.5MHF27 cm COLUMN
1.0 MHCI-0.5MHF107 cm COLUMN
(a)
(b)
Cb
^^
10 15 20
VOLUME (ml)29
3M HCI-0.5MHF61 cm COLUMN
6MHCI-0.5MHF61 cm COLUMN
9 M HCI-0.5MHF107 cm COLUMN
25 30
(C)
(d)
(e)
35 40

amature of 0ar;°^ "" ^^^ ^ ~°^^ *»» the eluent wasIn he h *HF and 1.0 *HC1 and where the column length was 107 cm.colu^T tTnf 7eriment' W"h °-5 *HF"9-° *HC1 as eluent and a107 cmcomp" ^ ^ ^ ^^ ** "lrtl™^~ « *» *»
The fractions in the first experiment were analyzed for Hf through delayed coincidence counting, taking advantage of the fact that the daughter of Hf1-;? meta8table Tal81 ^ 20 A—e half-life. We are indebted to Mr. F. KMcGowan of the Physics Division for the use of his delayed coincidence circuitand for his assistance in using the instrument.
The results of the experiment are summarized in Table V, where the specificcoincidence rate is given for each fraction. Percent enrichment was not calculated for these fractions since in the cases of high specific coincidencerate the reproducibility appears to be sufficiently low to leave the specificcoincidence rate of pure Hf- indoubt. However, it is believed that fractions10 through 13 were practically pure Hf1- Similarly, of course, fractions 4through 6. were better than 90$ Zr8e.
The enrichment, which was demonstrated in this experiment was sufficientlyhigh to suggest that Zr and Hf can be separated practically completely with asomewhat longer column (e.g., 3-5 m). Even with such very long columns thetime necessary for aseparation still would not be excessive in view of thelarge value of Rof Zr and Hf which pertains under these conditions (R =ca0.17). However, it is believed that the separation can be improved by the useof different eluents, and corresponding experiments are now under way
U. Separation of Pa fro* Cb, Ta and Zr. (a) Errata*: In the previousquarterly report a separation of Cb and Zr from Pa at high HC1 concentrationwas erroneously reported. The tracer used at that time was not Zr86 and Cb86as stated, but primarily amixture of Ce1'* and Pr14\ The separation of Pareported is thus with reference to these elements.
(b) The separation of Pa from Ta was discussed briefly in Section 6„ It isexpected to be relatively simple in view of the large ratio of the elutionconstants of Pa and Ta.
(c) Since the elution constant for Pa is considerably larger than that for Cbunder all conditions studied, their separation in HF-HCl mixtures should bequite effective. Unfortunately no cross-over point has been found as yet andthus separations at this time can only be achieved by eluting Pa first andretaining Cb.
30

TABLE V
Separation of zirconium and hafnium in i,Q M HCI-Q.5 M HF
Celuara length-107 cmAverage flows-ate-0- 29 »i cm'2 Bin*1
FRACTION ¥0iLUME
ml
SPECIFIC ACTIVITY
(c/ain/A.)
COINCIDENCE
RATE
per 1000 counts/Bin.
4 2 20 16 8 0 08
S 0 40 290 0 7
6 0 32 S80 19
7 0 27 616 6 6
8 0. 31 609 12
9 0 29 510 17
10 0 31 321 „(•>
11 0.31 147 21
12 0.43 30 7 24
13 0.45 3,3 19C)
(a) RadioeheniifaJl analyses by S A.. Rieyraoldi did met shew ps-saeace oif Zir?6 Estimated purityof the Hf fs-actiona according to S. A Reynolds is better, than 90%
31

In view of the differences; in slope of. the log R - log THCl] curves (at0.5 MHF);, the- sfiparation of Pa and Cb is expected, tQ'gDPQre: rapidly and withgreater efficiency with incre.as'ing HCl concentration."' A aHJ&ber of separationshave been carried out and Fig'„ 7 i llustafet;e.s: a typical one.
(d) As can be seen from Sections 7 and 8, the separation of Pa and Zr shouldbe satisfactory in 0.5 MHF at most HCl concentrations. Under these conditionsPa would elute first. In Fig. 7 a typical separation is illustrated.
THE URANIUM MV)-(VMVI) SYSTEM
F:\ Nelson and K. A. Kraus
1. Introduction. During the last quarter the investigation of the kinetics
and of the equilibria in the U(TV)-(V)-(VI) system has been continued. Emphasishas been placed (a) on the determination of the diffusion constants of U(Vl)under a variety of conditions which were of interest to the study in general,
(b) on the equilibrium constants of the U(IV)-(V)-(Vl) system in chloride andperchlorate solutions as a function of ionic strength and (c) on the rate constants, particularly the Tate of reaction of
kj
2U(v) y ^ U(IV) + U(VI) • d)k2
At the same time the problem of the hydrolysis of U(lV) has been re-openedsince the acid constants at high ionic strength are still needed for the com
plete description of the system.
In general, the data are still fragmentary and will be reported here only
in their general outline.
2. Diffusion Current Constants of U(VI) Solutions. To investigate the
applicability of the polarographic analytical procedure for U(Vl), the diffusioncurrent constants of this ion in chloride solutions between 0.1 and 2 M ionic
strength have been determined and some of the data are- summarized in Table VI.Investigations of this type have previously been carried out by Kolthoff andHarris^5', and the results obtained here were in general agreement with theirs.
(S)I, M. Kolthoff and W, E. Harris, J, Am. Chem. Soc ., 68,1175 (1946).
32

FIG. 7
SEPARATION OF Pa FROM Zr, Hf AND Cb
0.5 MHCI - 0.5MHF
30cm COLUMN-0.0226 cm2 CROSS-SECTION-DOWEX-I ANION EXCHANGER
TRANSPOSED FROM STRIPCHART RECORD-BACKGROUND SUBTRACTED
110
VOLUME (ml)33
DWG. 7563

:TABLE VI
Diffusion current constants of I/Oa** in KCl-HCl solutions at 25.0 ± 0-1° C
Molarity of UO2CI2: 8 * lo~4—4-5 x lo'3
m2/3 tl/6 , 2 465 „g2/3 t"l/2.,t QS v (y„Ag/Ag CI in 0 1 Af KC1
KCl HClfX amp
<• rm sole
K<*>0 a 1
D cm* 11c
£=:
0.10 0,001 374 1516 0629 x lO6
0,10 0-003 3. 73 1514 0 626
0 09 001 3-74 L519 0630
0.09 0.011 3.79 1.538 0.646
0,09 0,34 3.90 1.582 0.685
0 09 0,53 4.22 1. 713 0.802
0,49 0 003 3.78 1.534 0.643
0.49 0,01 3.79 1.611 0.710
0,49 0 01 3.78<S> 1.533 0.643
1,00 0.003 4.03 1. 635 0.731
1.00 0.003 3.82<S> 1.548 0.654
0.99 0.01 3.83 1.555 0.660
0 99 0,01 3.83<S> 1.555 0.660
1,97 0.003 3.89 1.578 0.681
1..97 0.003 3.88 1.574 0.676
(a) K -" diffusion cuinrent constant ~ I»uo2++]»2/3 t1'6
(Sv Suppresses- added (2 x 10 % thymol)
34'

Thus our data confirm that at high acidities the diffusion current constant ofU(Vl) increases very rapidly. This effect has been attributed to the dispro-portionation of U(V) at the dropping mercury electrode.
At low acidity (e.g., pH 2-3) and at low concentrations of U(Vl) (of theorder of 10~3 M) the polarographic waves are usually very smooth and do notshow any troublesome maxima (using 0.1 to 0.5 MKC1 as supporting electrolyte).The addition of thymol (2 * 10~* %) as a maximum suppressor does not markedlychange the diffusion current constant.
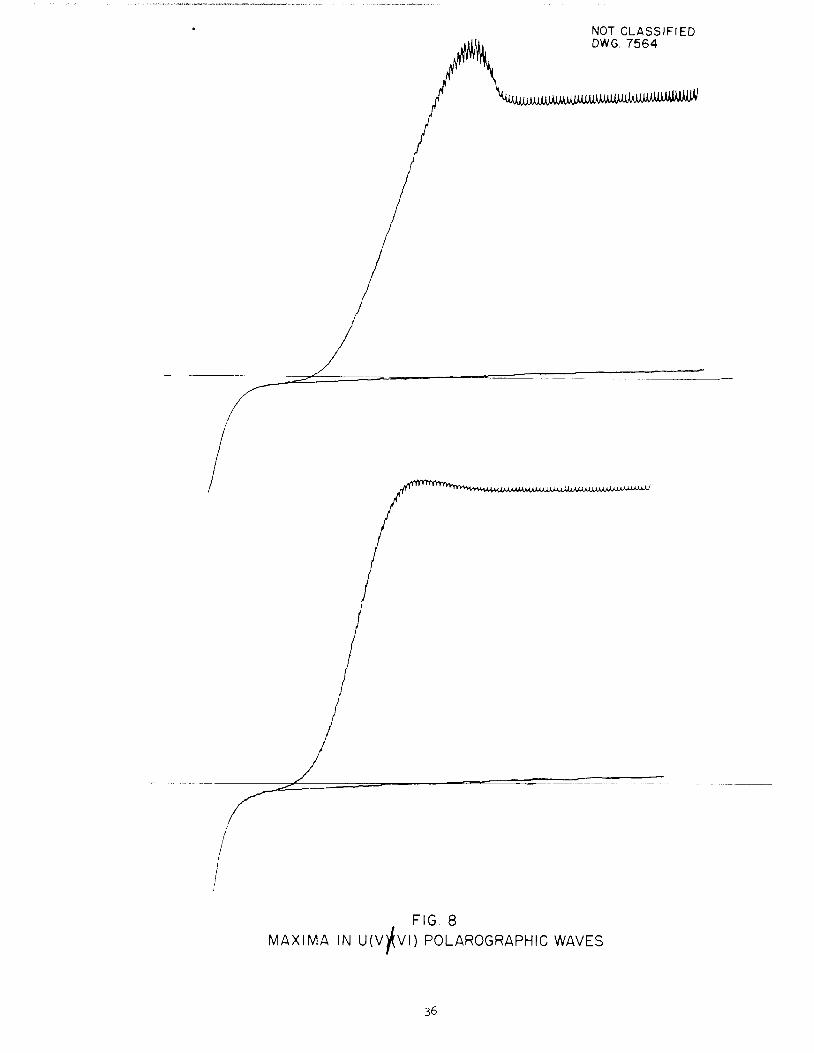
Under other conditions [particularly ..at higher acidity pr higher con
centration of U'(VI)] two types of. maxima can be found. Some maxima show extremely pronounced current, increases'near the half-wave region and others showonly a slight maximum or no maximum at all at the half*w.ay region, but showabnormal limiting current slopes. Examples of these two types of maxima canbe found in Fig. 8. Maxima of the second type are. generally observed at thehigher ionic strengths. Addition of 4 x 10"4 %thymol as suppressor tends tolower the limiting current but does not always remove the small maxima orabnormal slope in the limiting current region. Maxima of the first type whenoccurring at low ionic strength are readily removed by the addition of thymol(2 x 10"'4 %) and then yield normal appearing polarographic waves with diffusionconstants comparable to those occurring under conditions where maxima are not
generally observed,
As can be seen from Table VI the diffusion current constants are reason
ably constant at low chloride concentrations but rise slowly (after the maximumhas been suppressed) with increasing chloride concentration. It appearsreasonable to assume that this rise in the diffusion current constant of U(Vl)with increasing chloride concentration is due to chloride complexing of U(Vl).However, although it is known that such complexing occurs with U(VI), thisexplanation is not necessarily correct, and the increase in the diffusioncurrent constant at high chloride concentration may be due to change in the
medium.
No attempts have been made to obtain the change in the diffusion currentconstants of U(V) with ionic strength or with chloride concentration. It haspreviously been found ^ that at ionic strength 0.1 the diffusion currentconstants of U(v) and U(Vl) are approximately equal and it appears reasonable
(6)K. A, Kraus, G. L Johnson and F, Nelson, ORNL 188, (December 1948).
35
NOT CLASSIFIEDDWG. 7564
FIG. 8
MAXIMA IN U(V)(vi) POLAROGRAPHIC WAVES
36

>**^^«IS5^fe»*^flpW«iw»iW».<tta!«»ft»nw_<
that the diffusion current constant of U(v) is actually independent of chlorideconcentration. This would be particularly true if the observed increase in thediffusion current constant of u(Vl) is actually due to chloride complexing ofU(VI) since such complexing would not be expected with U(V), Since the effectis small for U(VI), such an assumption could probably only cause an error ofless than 3%.
To summarize, the following diffusion current constants for U(v) andU(Vl)in chloride solutions have been assumed.'
U(V) : 1..52 {p. = 0.1 - 2.0)
U(VI): 1.52 (M = 0.1), 1.52 (/x - 0.5), 1.55 (fj. = 1,0), 1.58 (M = 2.0).
3. Effect of Temperature on the Diffusion Current Constant of U(VI) inChloride Solutions. The change in diffusion current constants of Tj(Vl) withtemperature was measured for 0.5K KCl-HCl mixtures from 10° C to 47° C for
calibration purposes. The experimental results are given in Table VII. The
dropping mercury electrode had a value of m2/3t1/6= 2.465 mg2/3 sec~1/2 at0.5 volts [vs silver/silver chloride in 0.1 MKCl) at 25° C„ The temperaturecoefficient near 25° was found to be approximately 1.3% per °C with slightlylower values at lower temperatures and somewhat higher values, at higher temperatures.
No determination of the change in diffusion current constant of u(v) has
been carried out, and in all calculations it was assumed that its temperaturecoefficient is equal to that of u(Vl)„
4. Equilibrium Constants in the U(IV)~(V)-(VI) System in Chloride Solutions, As described in OENL 189y under suitable conditions the U(lV)-(v)-(Vl)
system can be in equilibrium or steady state with respect to the monomeric
species of U(IV)5 U(V) ana U(Vl)., Further studies of this equilibrium havebeen carried out and the equilibrium constants for reaction (]_) have beendetermined under a variety of conditions. The equilibrium mixtures were pre
pared by dissolution of UCL6 in KCl solutions, by addition of U(lV) solutions
to U(Vl) solutions and by dissolution of UC14 in solutions of U(Vl). Theresults of the experiments are summarized in Table VIII. It may be seen that
the equilibrium constant K ., calculated according to equation 1, varies
appreciably with acidity, as would be expected, and in addition changes markedly
with the chloride concentration of the solutions. If it is assumed that the
37

•TABLE VII
Effect of temperature on the diffusion current constant ofU(VI) in HCl-KCl solutions
Molarity of UOaCla : 1 x 10"3-4„5 x lo*3
-^•.tV*-: 2.465 «g2/3 .„" 1/a at .„ ,. y(»* Ag/AgCl in o.l JTXC1) calibrated at25.0° C.
(No maximum suppreaaor added)
TEMPERATURE (°C) KCl HCl I j (/iamp/m mole)
10.0 0-49 0005 3-17
25 0049 0-003 3.78
45 Q049 0005 5-02
47,0 049 0003 5-09
38
ca
«3
I
BB
Ion
icS
tren
gt
hs
Ion
icS
tren
gth
0=
49
-0,5
1K
Cl-
HC
lIo
nic
Str
en
gtl
A1
Aa
A4
4
1
tqo
*1
97
-1
.9
7-
09
9•w
Na
C1
04
-H
C1
04
20
0
KC
l-H
Cl
w.
10
0.
11
KC
l-H
Cl
c CJ-
toO
Hs
Oft C
HC
l
8 0
IIH
I*
Ot
Cd
VI
H*
toto
O0
01
MM
W(f
lM
cn
*•H
»H
»
H*
O»
vj
c 9
to
O0
0O
«4
tn
cn
00
tOto
00to
H*
00O
tO
t00
00
04
»tn
to
Ot
tn
10
J>to
no
X 0
a
^1 (3 3
O.
Gu
|—•)
MA
O»
a:
«
CJ
J<0 0
r*
•—
ea
:J5
11
3a
*A U a n 0
CO
s+
M.
ua n
+•«
u c*»
*•
*
0*
MIO
O
tn
00
Cn
O
IO tn
0
tfi
01tn
tnot
ot
tn»_
•
Ot
H*
VO
Oto
O00
w<•
••to
Ht
00O
th*
V0
Ca
H*
CA
tncn
toto
Ot
01
tn
4*
*J
*-J
00
e X H»
O
to
to «•+
B 3
3U
/-v
a'*
*—
"'
CO
CL
OM
+<
o\^
l
('
•-+
,rf
>.
t—H
»%
O0
1s tt
91O
l*
uO
iH
»to
*<»
»W
t-
00
oo
cn
-H*
»«1
-J
-4
*4
G
D 0
H>
cn
u 01
10
00
tnU
to
4*.
Oto
00
*H
*O
U00
*•O
Hi
00tn
h»
,0
tncn
h>0
(O»
o«
«tn
k»
0o
oO
ttn
Xre
-m
h»
0*<
h*
*•d
A A
h»
to
o»
C*>
to
to to
10
to
H»
Wtn
tn4>
cato
toh>
H»
O4>
4>to
h»a
1 MA
S>0
Oki
cn
>*
<*
hvJ>
mh
>i^h
>o
01tn
to
>-v
i^
*<
».^•*
v1
*9rf
O4>
«00
totn
h*O
tA
<to
too
t^1
0c:
t?d
Ba
0tn
0*
3 A
1!IE
a
a^
§3
Q.
o cn
0-
0*
0-
O*
to
hi
toK
>to
toto
toto
10<
«>1
0
4> tn
Co
M H
©w
"*
•\*
*w
«O
tn^-
0tn
»_»
4>v,
to0
0u
^*
(It
VI
00
4k.
h>
XII
CO
»-*
0n
•*
-''
11
S
0
00
ca
«-*
.«1 3
*A
a 0 01
ae
00
0101
01
G O H»
01
a 0 ••*
0)
GG
OO
H*
H*
01O
t
GG
GG
0n
nn
Ha
H*
H*
H>
a*
01cn
O+ to
3 O»1 A
3a
aa
to a«
wm
n•»
«A
0O
Oa
»(0
»B
»»
'O
'O
««
H*
H>
0O
33
r—
11
tt ft
58 a n
ft
W0
0O
tan
rf-
^-
*-
Ha
0I—
H»
N-
»•
CC
1+h>
*>j*
i>»
»*.
*♦
<♦
CA
0
»--*
'*
'ir
***
*H
"°*
**
*•*
H»
1*
rf
H*
M*
H«
*•»
Cc
5w
"''♦on
H«
H-
Ha
H*
W W •0 >
a O0
0 30
(an
00
(a O
33
0O
3H
.3
3Q
03
0C
»G
OG
GC
I""
"»-
33
WG
OO
33
»m
OO
+A
CO
+
O B 0 a
ec
*♦
r*
00
33
c ft
0 3
0 H»
n 0 B r*
O *••
tt O C r*
00
<«
•<
<-<
^o
——
M9
MH
tM
f»G
Gw
v^
v^
s^
•*i
^»n
y-N
1Q
1''0
0<
<H
^W
Wp
«jH
.i-
WV
^>k^
MH
-H
-H
>rt
-rt
-
2-5
O>
cr>
«•r*
H»
H*
OO
CC
rt-
r*-
GG
***
H-
<^N
/^
0O
<<
B0
> H M O 2
+ <
O c OH
*H
«II-
V-'
H>
H>
H-
90
OW
W•
iu
«»
0A
0>
WM
t-*
CO
33
OO
om
o0
0D
aH
«H
a|—
Q•«
•H
>|_
.H
>3
On
0H
aH
c*
-e
ec
•—C
»»
rf
rf
rf
r*«<
0O
H-
(ft
H«
H*
H-
tt
tt
OO
V•-
*-
00
00
00
Ha
—*
CC
8h
.9
33
3C
B*
~—
**
r»
r»-
c•
*»
*rf
1H
*H
-r»
-
00
H-
1—
H-
00
'-
33
O 33
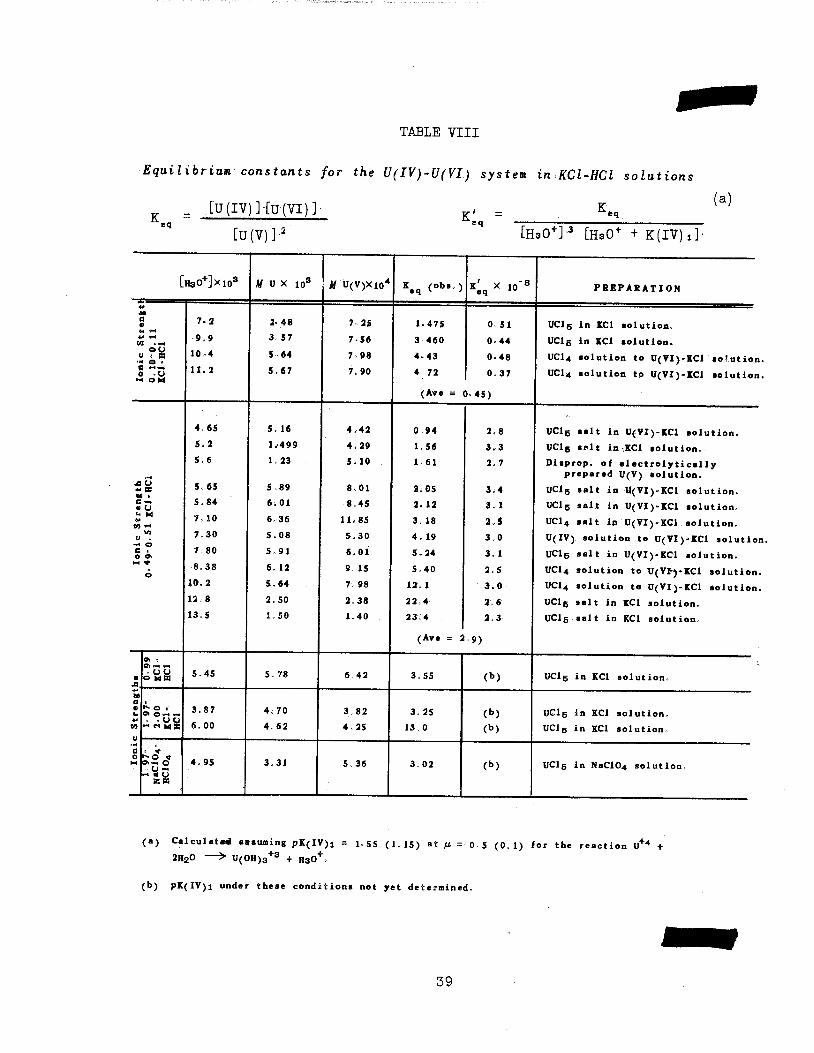
3

equilibrium invokes the species U*\ UOH*3, DO,*-, and U02**, the (acid indpendent) equilibrium constant K'eq for the reaction
4H30+ + 2U02+ ; » U0a ++ + U*4 + 6H20
becomes
Kx' = e q
" " LH30']-8 {[H30+] •+ Kdv),} (3)
It may be noticed that equation (3) contains the acid constant Kdv), of U<for the reaction
U*4 < » U0H+3 + H30"
(2)
(4)
Tnia acid constant has been determined by spectrophotometric methods^) for 0 1and 0.5. Mchloride solutions [PK(lV)1 =1.55 and I.15 for /x = 0 5 and 0 1respectively]. No determinations of this acid constant at higher chlorideconcentrations have been carried out and the acid independent constant K'can therefore not yet be calculated for these solutions. Experiments are nowunderway to determine K(iv)± under these conditions.
The acid independent equilibrium constant K'eq is approximately 2.9 * 108in the acid range studied (ca. 5 x 10- to x x 10- M). The data do nQt showany sxgnificant trend with acidity and it can therefore be assumed thatequations (2,) and (3.) apply and that the value of the acid constant of K(lV)is correct. At ionic strength ca. 0.1, the equilibrium constant K> was foundto be ca. 0.45 * 10 , again also apparently acid independent. Experiments arenow under way to study the equilibrium constants in perforate solutions tohelp estimate the influence of chloride complexing of U(lV) and U(Vl) on theequilibrium.
5. The Reaction of U(IV) mith U(VI). Previously, and particularly inthe last quarterly report, a number of data have been presented on the rate ofdisproportionate of u(V). The studies have now been extended to the rate ofreaction of U(lV) with U(Vl). Conditions of equal concentrations of U(lV) andU(VI), as well as excess of either U(lV) and U(Vl) have been studied. In(7)
K. A, Kraus, F. Nelson, AECD-1888 (April 1948).
40

general it was found that the directly determined rate constants were in goodagreement with those calculated from the equilibrium constants (K. ) and thedisproportionation rate constant.
In general, the experimental procedure was to add either solid UC14 or areasonably concentrated solution of UC14 in 0.5 MHCl to oxygen-free U(Vl)solutions of the desired initial PE and to follow the rate of formation ofU(V) polographically. Some experiments have also been repeated on the dissolution of UC16 in either acid or u(Vl) solution, since UC16 can serve as aconvenient supply of a U(lV)-U(Vl) mixture(8). In each case the reactionrates were also followed with a glass-electrode calomel electrode assembly.However, the data have not yet been completely tabulated. In those caseswhere calculations have been completed, the assumptions of the species previously suggested have been further confirmed. A typical set of data is asfollows:
The initial slope of a plot of log [u(lV)]/[U(Vl)]- vs time permits theapproximate calculation of the rate constants k2. A 5.27 * 10-a MU(Vl) solution of ionic strength 0.5 (KCl-HCl) was made 1.47 x 10~3 Min UC1B. From theplot of log [U(lV)]/[U(Vl)J vs t, k2 = 0.45.8 (moles/l)"1 sec^was found at anHCl concentration of 5,1 * 10"3 M. Using the Keq =2.12, determined for steadystate conditions, the disproportionation constant kx - k2Ke = 0.97 (moles/l)"1sec"1 was found. This is in fair agreement with the value 1.05. (moles/i)"1sec"1 found by extrapolation of the data presented in the previous quarterlyreport. It is of interest to note that even at this low acid concentration,the mechanism proposed in the previous paper still applies.
SPECTROPHOTOMETRY OF THE U(VO-CHL0RIDE SYSTEM
G. W. Smith and K, A. Kraus
Spectrophotometry of U(Vl) in chloride solutions is now under way withthe objective of determining the association constants of some of the U(Vl)-chloride complexes. The spectrophotometric work is almost complete, but thedata have not yet been completely tabulated and analyzed. It is; expected thata completion report will be issued in the near future.
K, A0 Kraus and F, Nelson, ORNL 189, December 1948.
41

SPECIAL INSTRUMENTATION
Precision Alpha-Counting of Liquid Samples (K. A. Kraus and H. H Miller)Work on this problemhas been concluded and aprogress report is in preparation ,
Precision of pR Measurements with Glass-Electrodes and a Vibrating ReedElectrometer (K. A: Kraus and R.W„ Holmberg). Work regarding the evaluationof the "routine^ precision of the glass electrode-calomel electrode vibratingreed assembly, which was described in the previous' quarterly report, has beencontinued and is practically complete. Areport on this work.is in preparationand therefore no discussion of this problem and the later results will begiven here. Suffice it to say, that it was found possible to decrease furtherthe standard deviation of aseries of determinations of voltage differencesfor acid pairs. At present, standard deviations of the order of 0,015 mv canbe obtained for such voltage differences with determinations extending overseveral days.
42

II. PHASE RULE STUDIES
THE SYSTEM U03-U02S04-H20
C. //„ Secoy
A phase study of the three-^component system U0s-U02S04-H20 was started
during the past quarter but has' not progressed very far. One Bet of data has
been obtained at 25° C for solutions dilute with respect to the sulfate.
The two main problems in the selection of a fluid system for a homogeneous
reactor are the corrosion problem and the. bubble problem. There is a possi
bility that corrosion effects might be decreased in the uranyl sulfate system
by adding U03 to the solution since this shifts the pE of the solution to
higher values. The effect of the excess U03 on the radiation bubbling of the
solution is not known but might possibly be in the beneficial direction. For
these reasons a study of the solubility of U03 in solutions of varying U02S04
concentration and at temperatures varying from room temperature to perhaps
300° C was initiated.
The experimental procedure for the lower temperatures has been to equi
librate a solution of known U02S04 content with an excess of solid U03 in a
temperature bath. The liquid and the wet residue were then analyzed for U02
and 804". At the same time the density and pE of the original U02S04 solution
and of the U03-saturated solution were determined.
At this time only four samples at 25° have been completed. The analytical
data, pH, and density measurements for these are given in Tables IX, X, and
XI, The last column in Table X gives the ratio of the grams of uranium per
liter in the final solution to that in the initial solution. It is evident
from these figures, if the data are not in error, that something must happen
at a concentration between that of the second and third samples. The analysis
of the wet residues indicates that a solid phase transition must occur in this
interval. Figure 9 shows the plot of the solubility and the extrapolation
to determine the composition of the solid phases. For samples 1 and 2, the
solid phase is unquestionably U03°2H20„ For samples 3 and 4, the solid
phase has a mole ratio of 5 and 6 moles U03 to one of U02S04„ This ratio and
the amount of H20 in the solid cannot be fixed with certainty until several
additional points are obtained. The break in the solubility curve at the
43

TABLE IX
Initial U0$>S04 solutions
WEIGHT PERCENT
of U02S04g U/L pH P
1-060 6 96 2 89 1. 010
2 045 13-54 2 67 1-018
4- 135 27 93 2.39 1 039
6-528 44-99 2. 17 1 060
TABLE X
Solutions saturated with U0S
PERCENT of V03 g U/L pH Pg U/L FINAL
g U/L INITIAL
1 385 11.68 4 07 I 0133 1.68
2- 779 23 78 4 02 1 0284 1- 76
4. 20S 36. S3 3 80 1.0448 1,31
6, 783 60 68 3 .61 1.0750 1,35
TABLE XI
Wet residue;
PERCENT ©if SO3 PERCENT OF U03
0. 127 33 07
0. 242 27- 08
1-383 20 39
1,813 21-94
44'

-*r
VJ1
UO^
U03-2H20
U02S04
U02S04 - 3H20
FIG. 9
SOLUTION SATURATEDWITH U02S04
?vv>-
H20
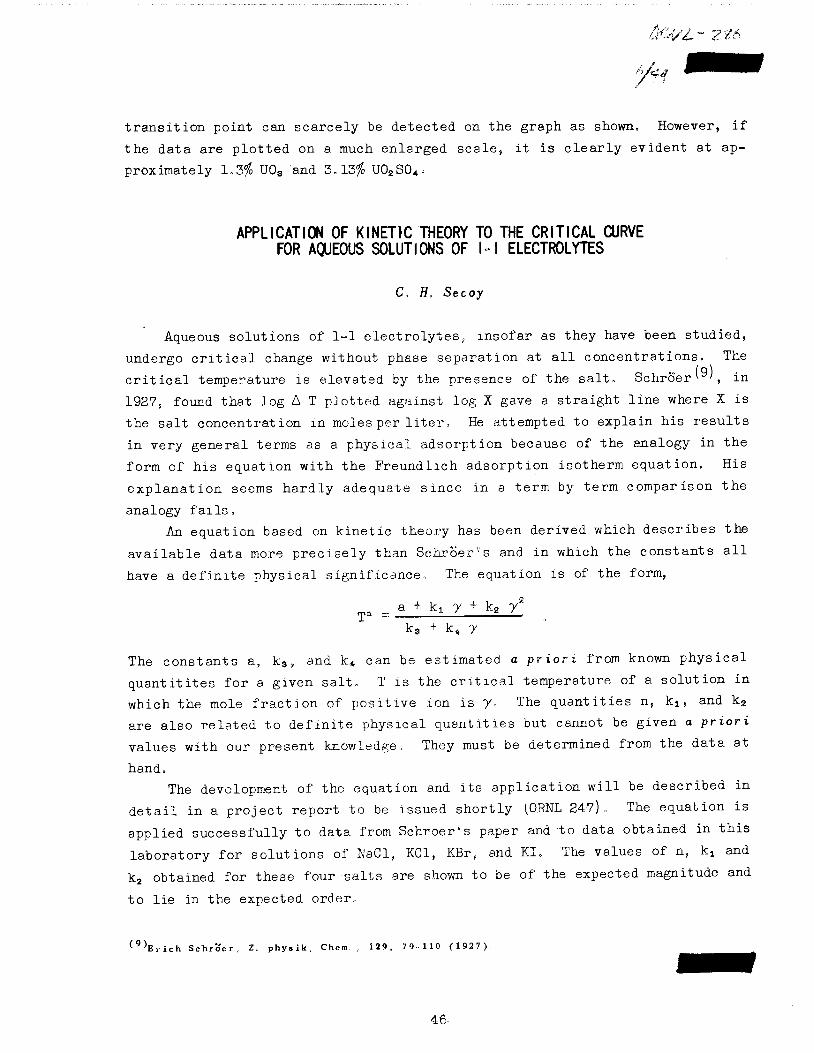
transition point can scarcely be detected on the graph as shown. However, if
the data are plotted on a much enlarged scale, it is clearly evident at ap
proximately 1.3$ U03 and 3.13$ U02S04o
APPLICATION OF KINETIC THEORY TO THE CRITICAL CURVEFOR AQUEOUS SOLUTIONS OF I-I ELECTROLYTES
C. #„ Secoy
Aqueous solutions of 1-1 electrolytes, insofar as they have been studied,
undergo critical change without phase separation at all concentrations. The
critical temperature is elevated by the presence of the salt. Schroer^ ', in1927, found that log A T plotted against log X gave a straight line where X is
the salt concentration in moles per liter. He attempted to explain his results
in very general terms as a physical adsorption because of the analogy in the
form of his equation with the Freundlich adsorption isotherm equation. His
explanation seems hardly adequate since in a term by term comparison the
analogy fails.
An equation based on kinetic theory has been derived which describes the
available data more precisely than Sc.hroeres and in which the constants all
have a definite physical significance. The equation is of the form,
_ a + kt y + k2 y2k3 + k4 y
The constants a, k3, and k4 can be estimated, a priori from known physical
quantitites for a given salt. T is the critical temperature of a solution inwhich the mole fraction of positive ion is y. The quantities n, ki, and k2
are also related to definite physical quantities but cannot be given a priorivalues with our present knowledge, They must be determined from the data at
hand.
The development of the equation and its application will be described in
detail in a project report to be issued shortly (ORNL 247). The equation isapplied successfully to data from Schroer's paper and to data obtained in thislaboratory for solutions of NaCI, KCl, KBr, and KI. The values of n, k± andk2 obtained for these four salts are shown to be of the expected magnitude and
to lie in the expected order,
'''Erich Schroer, Z. physik, Chem , 129, 79-110 (1927)
46-

NUCLEAR AND CHEMICAL PROPERTIES OF ELEMENTS
IN THE FISSION PRODUCT REGION
47

CHARACTERIZATION OF Cs135.
H, Zeldes, A0 R, Brosi, G„ B\ Parker,
G. Af, Herbert and G, E, Creek
Inasmuch as the large quantities ofXeiSe prepared for cross-section measure
ments (ORNL 336) were retained in closed containers,, it seemed feasible to iso
late and characterize the long-lived Csi-Se daughter,,. Accordingly, preparations
were made about a year ago to uncap, discharge and wash the highly radioactive
containers by remote control and also to remove safely the high level iodine
activities so that the Cs containing materials might be handled easily.
The closed containers, referred to as wafers in the Xe135 cross-section
work, contained about 10 mg iodine in the form of Pdl2 from which the Xe135 grewand decayed. In order to be certain that all the Cs was recovereds the solid
Pdl2 was pushed from its capillary holder and the holder then washed with
aqueous KH3+ H202, which is a good solvent for Pdl2. The washing procedure
introduced several milligrams of metal ions from the metal wafer and also vari
able amounts of silicone stopcock grease. After the first few relatively low
level runs, it was learned that in addition to the CsiS6 activity, which is the
only possible Cs activity from this source, there were present several million
disintegrations of a variety of other activities, possibly arising from the
daughters of short-lived gaseous activities or spray in the iodine separation
process. The presence of this activity which was thousands of times more in
tense than the Csjae activity, together with the large mass of material with
which the mass (<1Q fig) of Csise was associated, made it almost imperative to
use carrier Cs to isolate the Cs"se activity,
Csa,sr activity was isolated with carrier from six Xe runs. The procedure
was to uncap the wafer, push its contents into a glass container into whichaqua regia was added and then to evaporate dry to remove iodine. The wafer
capillary was then washed with aqueous NHa ± H202 which was also carefullyevaporated dry. The residue was then dissolved in aqua regia and evaporateddry again. The two residues,, which were relatively inactive, were dissolved in6 N HNO, and transferred to a volumetric flask to which Cs carrier was also
added. The Cs was isolated as CsC104, It was felt that no other activity wascarried along, as successive precipitations didnot alter the specific activity.
48

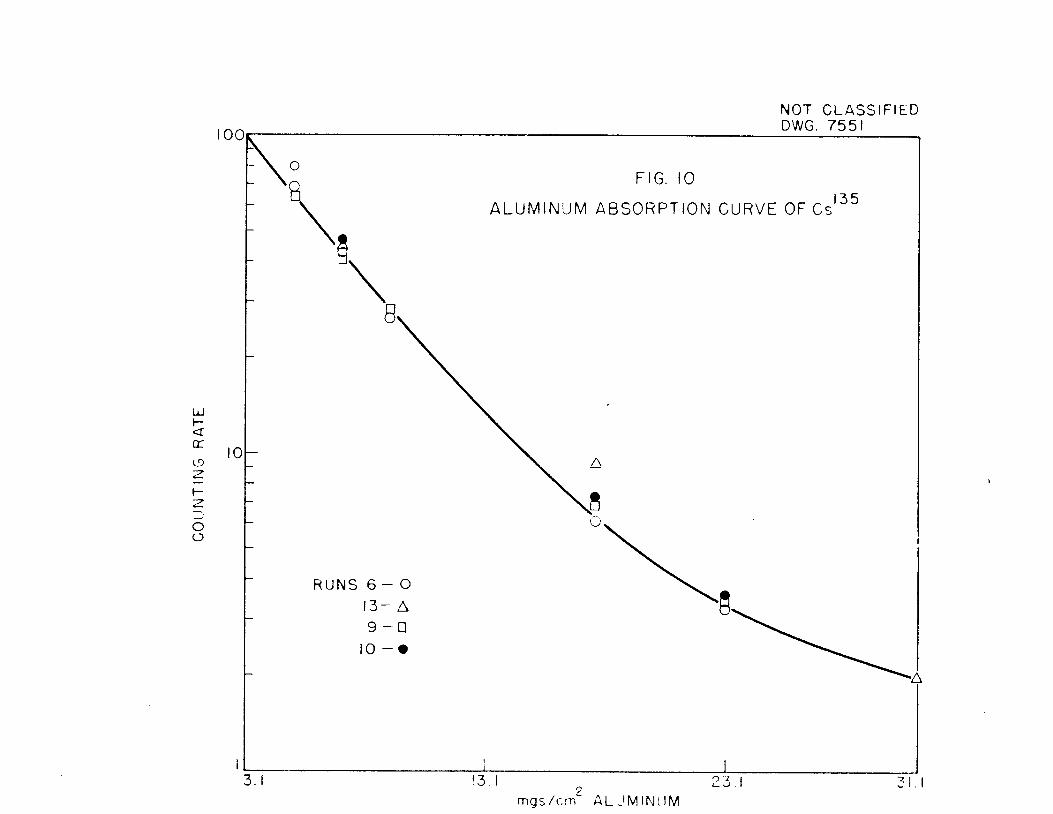
Also, similar absorption curves were always obtained,
Al absorption curves for four of the experiments at 30% geometry with a
mica end window (3.1 mg) tube are shown in Fig„ 10. The beta energy is about
0.19 Mev. No gamma or X-ray radiation was detected when a G-M counter and an
argon and methane-filled counter were used.
The number ofCs135 atoms wasknown from the Xe1SB assays in the cross-section
work.
The half-life ofCs"SE was established by determining (gravimetrically) the
recovery of Cs carrier and by absolute beta counting the fraction recovered.
The half-life so determined is 2,95 ± 0.3 * 10e years.
The absolute beta counting was done with a slide chamber proportional
counter. The samples were mounted on 4 mil Pt discs. The counting efficiency
of this arrangement (assuming no self-absorption) is reported elsewhere in
this report and turned out to be 65%o
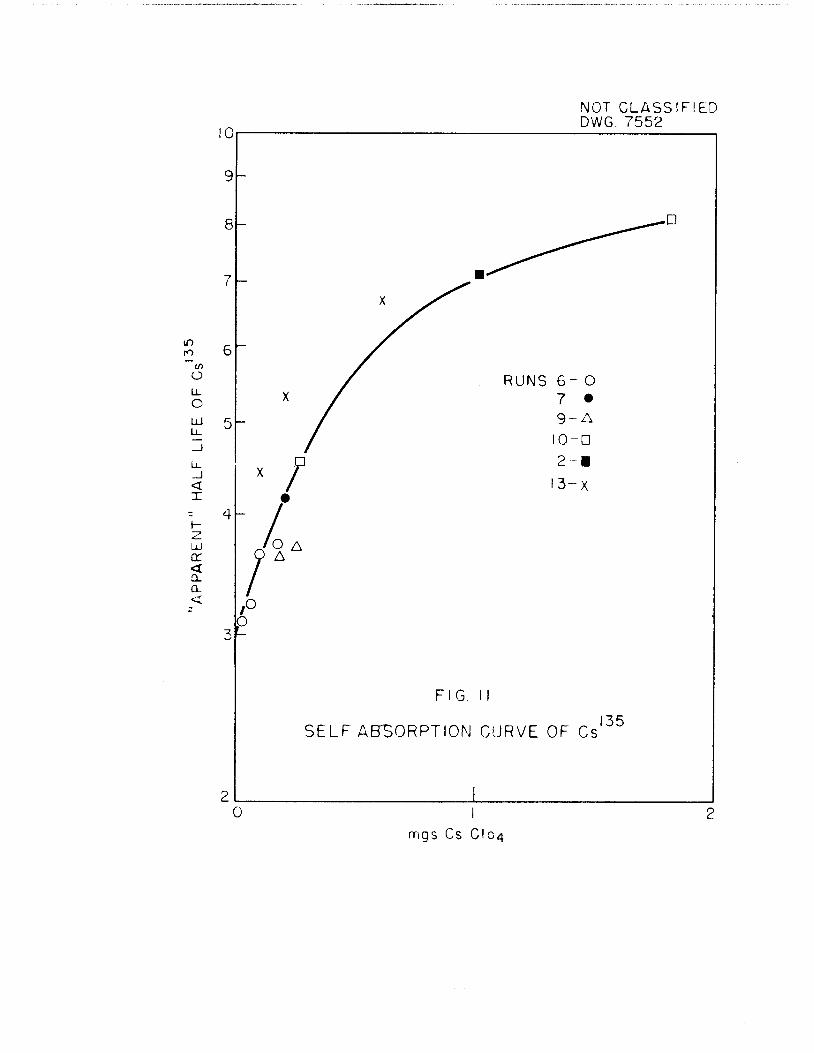
The major source of error in the half-life determination is probably the
uncertainty in the large self-absorption correction to the counting rate be
cause of the relatively large mass of CsC104. To make this correction, counts
were made for a range of masses of counting samples. In order to get a suf
ficient number of points, and at the lowest, attainable masses of CsC104, most
of the CsCl04' samples obtained from individual runs were divided into fractionsby aliquoting methods. From each of the resulting counting rates the Cs recovery data and the Xe assay values, and "apparent" value of the half-life ofCslss was computed and plotted versus the mass of the sample counted, The"apparent" half-lives thus computed are uncorrected for self-absorption. Thiscorrection goes to zero at zero mass, and hence the "apparent" half-life atzero mass is the correct one. This plot is shown in Fig, 11, and a summary of
the data in Table I, In Table I, (DC3'"") means the "apparent" disintegrationrate of Csiss for the entire run, that is, with no self-absorption correction.
DP36 gives at time zero the d/m of the parent I188 as determined from the assayin the XeiS8 cross-section work.
Recently, N. Sugarman [ Phys, Rev, IS, 1473 (1949)] has reported 0.21 Mevfor the maximum beta energy and 2.1 ± 0,7 * ioe years for the half-life ofCs196, The value for the half-life reported here and that reported by Sugarmanfall within the error assignments. However, we believe that the errors in ourhalf-life measurements are considerably smaller than those obtained by Sugarman.
49
UJ
<
(.0
2
OO
3.1
RUNS 6- O
13- A
9-D
10 -•
NOT CLASSIFIED
DWG. 7551
FIG. 10
ALUMINUM ABSORPTION CURVE OF Cs'
o -t, 31.1
mgs/cm ALUMINUM
If)
ro
O
O
<X
UJ
cr<Q.
a.
<
10
9
8
3-
L°^
O
FIG. M
NOT CLASSIFIEDDWG. 7552
RUNS 6-O
7- •
9-A
I0-D
2-1
13-x
SELF ABSORPTION CURVE OF Cs35
0
mgs Cs CIC4

TABLE I
Summary of data for half-life of Cs136
RUN 2 6 7 9 10 13
Fraction of
run measured0 80 090 084 0-80 0-80 0.50
Wt. of C*
carrier (mg) 2 15 1,5 1.5 2 2
Wt. of C3CIO4counted (mg)
(1) 2.935 0.1048 0.208 0,261 1.815 2,109
(2> 1.185 0 180 0.189 0.272 0.608
(3) 0.0360 0.213
(4) 0.0720 0.1055
prop. Counton Pt (c/m)
(1) 121 101 171 207 208 489
(2) 73 170 154 56 130
(3) 41 57.5
(4) 79 34
Cs136D (c/m)
(1) 275 4290 3970 4020 772 2490
(2) 418 4250 4120 1385 2300
(3) 5120 2900
(4) 4910 34 70
j 136Do (d/m) 391 x 1012 2.08 x 101S . 2- 17 x 101S 1 96 x 1013 8-25 x 1012 2-02 x 1013
ApparentCs136
(i) li08 x SO7 3.69 x 10⁶ 4. 16 x 106 3.71 x 10⁸ 8.11 x 10e 6,18 X 10⁸
(2) 7.1 x 10⁶ 3.72 X 10⁸ 3.62 x 10⁸ 4.53 x 10⁸ 6.68 x 10⁶
(3) 3.09 x 10⁸ 5.30 x 10*
(4) 3.22 x 10⁶ 4.43 x 10°
52

PRELIMINARY REPORT ON THE ISOLATION! AND
CHARACTERIZATION OF LONG-LIVED I129
G, W. Parker, G, E. Creek, G. M. Herbert
P. M. Lantz, and W. J, Martin
Introduction. Previous investigations of the long-lived fission-produced
iodine have resulted in the proposals of lower limits of 108 y for the half-
life of IM9 v-Us> 12; o jj0 prior report, however, has claimed observation of the
radiations,,
The existence of an isotope of mass 129 in old fission iodine has been
assured by the identification of the parent isotopes of Sb and Te in the
fission chain\^l, by the complete absence of the daughter Xe in the fissiongases\*'9 and by Katcoff"sw identification of the neutron absorption product,
the 12,6 hr I130 in samples of fission iodine isolated by Seiler„ HGEejaeeearfeljs
Leader and Sullivan upon the examination of the residue from the decay, after
one year of cooling, of a fission source of 40 curies of 8 day Iial, found a
remaining activity of only about 30 counts per minute. Since this small count
ing rate indicated a half-life in excess of 10s years which would require that
the isotope occur to an appreciable extent in nature, it was necessary for
them to conclude that even this small amount of radioactivity was due to an
impurity. They also concluded that any beta radiation due to radioisotope
Ii28 must either be very soft (less than 0.1 Mev) or is not observable. The
fact that Leader and Sullivan were not able to characterize beta radiation of
much less than 0„1 Mev is significant.
The upper limit of the natural occurrence of I129 was first shown to be
less than 25 parts per million(6), and has more recently been lowered to onepart per million^7', Katcoff and Boyd have each reported a trace of 12 houractivity as a result of neutron bombardment of natural iodine. This, it is
proposed, may be the known I130 (8)„ "Katcoff estimated that this limit of
(1) O, R. Leader and W„ H. Sullivan, Report (H) CN-3466, Jan., 1946s PPR Vol. 9B 7.36 (1946).
<St) Seller, J. A., Report CN=fl998 (1946).
(3) The Plutonium Project, "Nuclei Formed in Fission.'. J. Am. Chem. Soc. 68, 2411-S442 (1946).(4) Arroi, W„ J„ Chackett, and S„ Epstein, CRC297 (1947).
(5) Katcoff, S., Phys, Rev, 7i, 826 (1947).
(6) Nier, A.O.C Phys. Rev. 52., 93.7 (1937).
(7) Boyd, G„ E„, Private Communication.
(8) Livengood and Seaborg, Phys. Rev. 54, 775 (1938).
53

observed activity, if it resulted from neutron capture in 108 y I128, indicatedthe possible natural existence of the isotope to the extent of about 0.3 parts
per million in order to be consistent with his determination of an approximate
cross-section value of 8 barns for I129 in samples of fission iodine.
Summary. Characterization of the radiations, half-life and neutron cross
section of I128 has been attempted and preliminary data are reported. Iodine in
milligram quantities has been obtained nearly isotopically pure by threeseparate processes. From one source, I181 masked the soft radiations of the129. The other samples showed a consistent amount of an electron of 100-130
Kev and a gamma or X-ray of 28-32 K.ev. The half-life is estimated at 2^4 * 107years. The neutron absorption cross section was observed to be of the order of15 barns in agreement with published work.
Experimental. The most abundant source of the longer-lived fission iodineisotopes has been found in the strong nitric acid condensate from waste gasesfrom pilot plant dissolver operations. An efficient chemical recovery fromthese condensates has been made by means of large scale distillations withH202 into dilute alkaline sulfate. Unfortunately, however in the iodine fromthe existing by-product sources it was found that a very small content of 8 dayI131 was sufficient to mask differences in the absorption curves which might be
attributable to I129.Therefore, it was necessary to make special dissolvings of long-irradiated,
long-cooled metal from which tjie off-gases, N02, I2, etc., were scrubbed out inalkali. From two of these dissolvings about 2 milligrams of total iodine werefinally extracted. For these samples absorption curves were obtained and decay observed. Again, however, the iodine contained small amounts of 8 dayactivity, but with time the initial portion of the absorption curve indicatedan increasing amount of a 100-120 Kev radiation corresponding to a very lowspecific activity in the total amount of iodine.
A second series of dissolvings was undertaken, avoiding the use of thealkaline scrubber into which it was assumed that locally contaminated aircontaining I131 was being drawn. In this case, the metal was dissolved inhydrochloric acid and after the oxidation of UC14 with H202 and the addition ofFe2(S04-),, iodine was distilled into S02-solution. In the new absorptioncurves of the iodine obtained, it was immediately observed that none of theradiations of 8 day iodine was present.
54
Radiation and Half-Life of Long-Lived Iodine. In order to establish the
energy of the radiation and to arrive at a preliminary value for a half-life,
on the assumption that the radiations observed were indeed from I129 small
disks of silver foil were weighed and coated with Agl by simply shaking the
silver in contact with a moist CC14 extract containing an amount of iodine
previously determined polarographically(9).Plates of Agl made in this way were counted with a minimum of self-
absorption. As a further check on the mass, it was convenient to remove the
Agl by washing with 10% NH4OH and to re-weigh the plate and obtain a value for
the difference.
The range of the soft electron in aluminum has been roughly estimated at
15 to 22 milligrams corresponding to 100-135 K.ev (Fig. 12). The proportion of
the gamma fits reasonably to a 1:1 ratio with the beta assuming a counting
efficiency of about 2% in the 90% argon-10% methane mixture used in the pro
portional counter'10). The half-thickness of the gamma in aluminum (600-700mg) corresponds to an energy of 28-33 Kev (Fig. 13). Since this value is
quite close to the energy of the iodine X-ray, more work will be expended in
verifying its association with the iodine and the beta and also in further
determining its identity. Samples are being prepared for study of the beta
spectrum on the scintillation counter by P.. R. Bell of the Physics Division.
The specific activity in the pure samples has been estimated at 1-2
disintegrations/second/microgram of 129. Since precise spectrometric data are
not yet available, we have assumed 75% isotopic abundance from microwave data
furnished by Livingston. The half-life corresponding to the above activity is
about 2-4" x 107 years. The inconsistency with a longer half-life proposed asa lower limit is ascribed to the former limitation in counting radiation below
0.1 Mev.
The thermal neutron absorption cross section has been roughly determined
to be approximately 15 barns in agreement with Katcoff within a factor of two.
Further work should give a more reliable figure.
(9) Thomason, P. F., and Davenport, W. T., Private Communication.
(10) Winsberg, L. , Lecture No. 10, Treatment of Experimental Data - Radiations, AECD 2047. 1948.
55

Chemical-Procedure for Fission Iodine. An outline of one of the chemi
cal extractions.and the purification procedures for the iodine is given .asffillbws s
Source
UCI4 Slurry
UOsCla
Distillate
CCI4 Extract
NaHSOa Extract
Distillate
CCl^ Extract
Ag-AgI Disk
MgrAgI
Uranium metal (long-irradiated) cooled three years.Dissolve in glass using minimum of cone. HCl.
Add Fe2(S04)3 to about 10 mole percent of the uranium. Oxidize barely to U02C12 by careful addition of10% H202 (disappearance of green color).
Add same amount of•Fe2(SO4)s after the endpoint of theoxidation. Distill strongly for several hours witnsufficient reflux condenser to give a minimum volumeof-distillate,, Keep, distillate saturated with S02.Add small amount of NaOH,
Boil out excess S02, Extract iodine into CCI4 withaddition of HaNOa and HNOs, Wash CCI4 layer withH2O.
Reduce with NaHSOs and extract into small volume H20,Repeat oxidation-reduction cycle.
Add solution to small glass still. Add "few drops ofKM1O4 to permanent color. Make about 6^ N- in H2SO4.Add H3PO3 solution and heat- until free of Mn02 color.Distill about one-third of aqueous volume into N'aHSOssolution.
Repeat the NaN02 oxidation and CCl4; extraction.with H2O, Separate CCI4 layer.
Wash
Clean a 1 cm silver plate in dilute HNOa. Wash andweigh and drop into an aliquot of the CC14 extract.Shake occasionally until iodine color has been, dissipated.
Wash and d-Ey* Weigh for-mass of- iodine-collected.Cover and mount for count ing,-r;fi - -. - .
Place, in warm 10% NH4OH sufficient ,to complexAgl, Remove and reweigh disk or collect Agl onweighed filter after acidification with HN03or by boiling out excess'WH3,
56

500
0
NOT CLASSIFIED
DWG 7315
FIG. 12
2-4 X I07 y IODINE 129 FROM FISSIONABSORPTION CURVE, BETA PROPORTIONAL COUNTER
ALUMINUM FOILS50% GEOMETRY
CURVE FOR ~0.6mg I 129
10 20 30 40 50 60THICKNESS OF ABSORBER ADDED (mg/cm2 OF ALUMINUM)
70
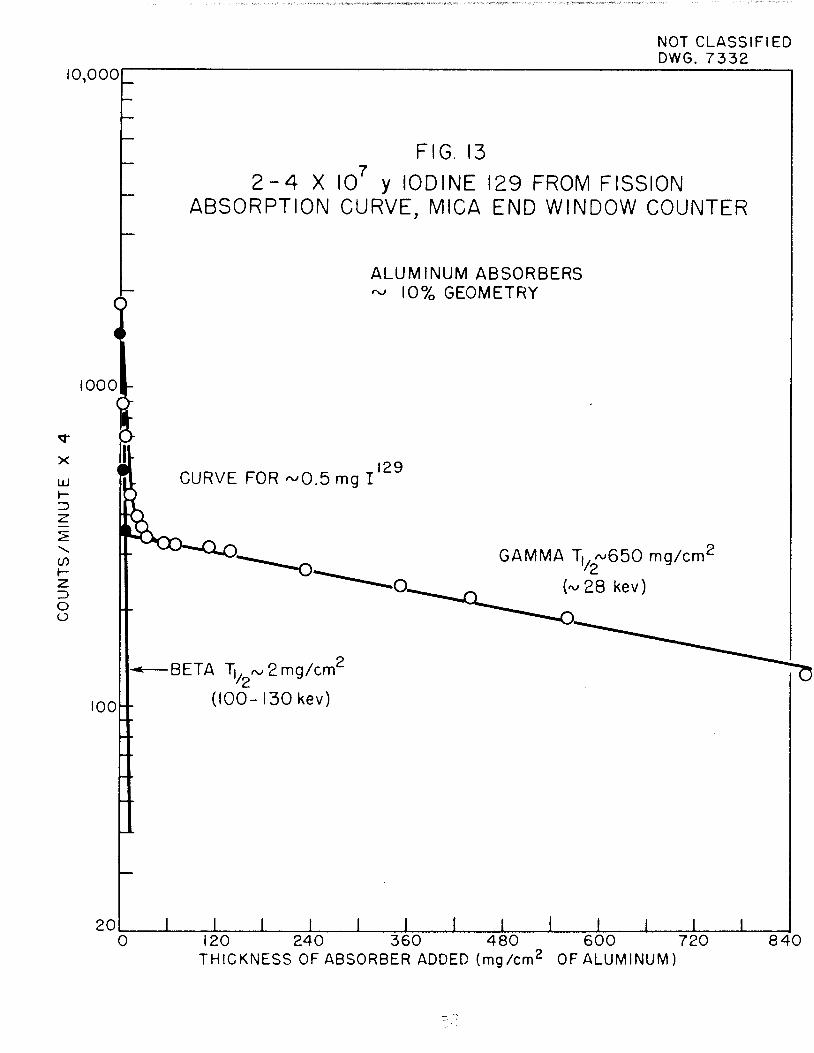
io,ooor~
x
UJ
r-
cnt-
Z>
Oo
1000
100
200
NOT CLASSIFIEDDWG. 7332
FIG. 13
2-4 X I07 y IODINE 129 FROM FISSIONABSORPTION CURVE, MICA END WINDOW COUNTER
ALUMINUM ABSORBERS
~ 10% GEOMETRY
CURVE FOR ~0.5 mg I129
•BETA Tt/ ^2mg/cm'(100-130 kev)
GAMMA Tt//v650 mg/cm2(~28 kev)
120 240 360 480 600 720
THICKNESS OFABSORBER ADDED (mg/cm2 OFALUMINUM)840

THE ABSORPTION SPECTRUM OF ELEMENT 61*
G. W. Parker, P. M. Lantz
I. Introduction. Since the isolation of milligrams I11) of the element 61in chemically pure state is now almost routinely performed in this laboratory,advantage has been taken of the opportunity to investigate some of the properties of the synthetic element. Among the investigations conducted was a studyof the absorption of light in the visible spectrum as ordinarily done with therare earth elements by means of the quartz spectrophotometer.
In the fission products of uranium resulting in the chain reacting pilethe 4- year isotope 147 of element 61 has been shown to occur with ayield ofabout 2,5%(12^ Sources of mixed fission products sufficient to yield milligrams of element 61 have been isolated and the rare earth elements individuallyseparated by ion-exchange methods to produce the first recognizable quantitiesof the substance of atomic number 61, While the 4- year half-life of theisotope is sufficient to permit freedom in time for handling and experimentation,in order to make investigations involving milligrams of mass it was necessaryto work with curies of radioactivity,
J, A, Marinsky and L. E. Glendenin reported in 1945 the isolation andradiochemical identification of the synthetic rare earth element 61 in theuranium fission products. Later Winsberg^) estimated its half-life throughobserved decay to be 3,7 years which would indicate its specific activity tobe approximately 0,8 curies per milligram.
Improvements in separation techniques having made available milligramquantities of this element, determination of its specific activity (approximately Q*6 curies per milligram) by weighing and absolute beta counting wasperformed during the course of this absorption study.
j, i n *,;ic ln\ Ufl+prial- Prior to this absorption study,2. Experimental Details. \a.) Maxerisu.. rilul• j-v, -p~-~™ ~-p fR-nn. waq used bv L. E. Burkhart, W. F. Peed,the same sample m the form of (61}013 was usea uy
2160, May 27. 1949.
(12) J. A. M.rin.ky and L. K. Glendenin. J. A.. Che- Soc. 69. 2781 (1947).(13) j. A. Seller, and L. Winsberg. PPR Vol. 9B. 7.54.2 (1946).
59

and E, J. Spitzer^14) (Oak Ridge Electromagnetic Plant) to record the K and Lemission lines of the X-ray spectrum of element 61. About 3 mg of the sampleof 61 was recovered from the X-ray tube and was tested for purity(15-) beforespectrophotometric study was made, by comparing copper-spark spectrograms, withthe known lines of the other rare earths and those characterized at this laboratory for element 61^16^ Part of this sample was used by C. Feldman^17) (thislaboratory) to look for "Illinium" lines reported by Harris, Hopkins, andYntema(18).
The results of the spectrographic purity test are given in Table II.In preparation for absorption study, the portion of the sample remaining
after applying the spectrographic test above was analyzed for gross betaactivity by absolute beta counting techniques^19) and was found to be 822 mcIt was then converted to the (61)(Cl), and was transferred in 0.2 ml of 0.1 NHCl solution to a calibrated semi-micro quartz cell 2.5 mm x 10 mm (10 mmlength of light-path)„
After the study was completed the 61 was converted to the oxalate andweighed. Then the oxalate was ignited to the oxide and reweighed.
The 61 (calculated as 0,926 mg of the element) obtained as the oxide wasthen found to be 551 mc. On the basis of this weight-activity ratio appliedto the original 822 mc the molarity (0.0472) of the solution employed in theabsorption band study of the chloride was calculated.
(b) Apparatus: For this investigation aBeckmanSpectrophotometer Model LDwas employed using a special RCA C7032 photo-tube for measurements below 625millimicrons and an RCA Type 919 cesium oxide photo-tube formeasurements above625 millimicrons, Adefining slot 1 x 2 -, punched from a piece of 0.004' in.steel shim stock, was inserted on the light source side of the cell, beingheld in place with tape. The defining slot was necessary to diminish thestandard 3 * 6- mm light beam so that it would fall within the limits of thesmall cross section ofthe solution exposed. Before securing the defining slot
1949, to be published.
(15) Private Communication from M. Murray, Oak Ridge National Laboratory. April. 1949.(16) D. Timma. 'The Spark Lines of Element 6l\ AEC Report, MonC166. (to be published).(17) C. Feldman, "Note on the A*cSpectrum of Element ,1*. to be published (work completed
April 6, 1949).
* „ ... R S Hookins; T. Am. Chem. Soc. 48, 1585 (1926). L. F. Yntema. J.flSI J. A. Harris and B. o. HopKins, j. «•".
Am. Chem. Soc.-'**, 1598 (1926).
(19) P. M. Lantz andG. W. Parker, to be published.
60

TABLE II
Impurities found in element 61 (20-30 micrograms)
(Analyzed by the copper sparkmethod on a Jarre!1 -Ash gratingspectit® graph)
ELEMENT DEGREE OF IMPURITY ELEMENTS NOT FOUND
Al Trace Ag As , Au, B Be, B
Ca Strong Cd, Ce, Co Dy Er, Em,
Cir Moderate Ga, Gd, Ho K La, Li,
Fe Faint Trace LU;, Mn, Mo Nd Ni, Pi,
Mg Moderate Rb, Sb, Si Sm Sn, Sr,
tf« Trace Ta;, Ti, Tm. V, Zn
Pb Veiry Weak
pt presence Questionable
TABLE III
Principal absorption bands of element 61
WAVE LENGTH
459.5 ± 0.. S
493 ±0-5
548 ±05
629 0 ±1,0
568 i 0 2
685 ±0-2
702- 7 ±0-3
737.2 ± 0 2
785- 0 ±0-2
810-0 ±01
MOLAR EXTINCTION
COEFFICIENT
(£ x 103)
61
0 7
1 • 2
2-3
0- 5
2 3
1-3
1-6
1-9
1- 1
0-6
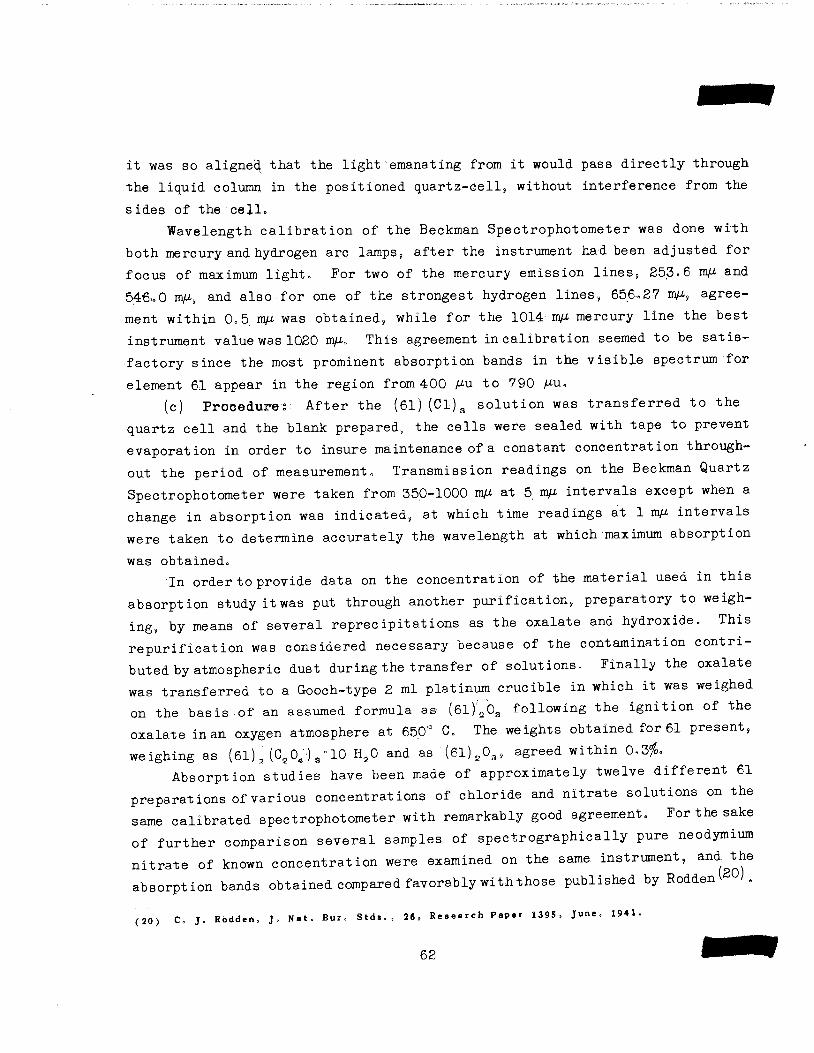
it was so aligned that the light emanating from it would pass directly through
the liquid column in the positioned quartz-cell, without interference from the
sides of the cell.
Wavelength calibration of the Beckman Spectrophotometer was done with
both mercury and hydrogen arc lamps, after the instrument had been adjusted for
focus of maximum light. For two of the mercury emission lines, 253.6 rap and
546.0 mp, and also for one of the strongest hydrogen lines, 656.27 mp, agree
ment within 0.5. rap was obtained, while for the 10141 rap mercury line the bestinstrument value was 1020 rap. This agreement in calibration seemed to be satis
factory since the most prominent absorption bands in the visible spectrum for
element 61 appear in the region from 400 pu to 790 pu.(c) Procedure; After the (6l).(Cl)a solution was transferred to the
quartz cell and the blank prepared, the cells were sealed with tape to preventevaporation in order to insure maintenance of a constant concentration throughout the period of measurement. Transmission readings on the Beckman QuartzSpectrophotometer were taken from 350-1000 rap at 5 rap intervals except when achange in absorption was indicated, at which time readings at 1 rap intervalswere taken to determine accurately the wavelength at which maximum absorption
was obtained.
In order to provide data on the concentration of the material used in thisabsorption study it was put through another purification, preparatory to weighing, by means of several reprecipitations as the oxalate and hydroxide. Thisrepurification was considered necessary because of the contamination contributed by atmospheric dust during the transfer of solutions. Finally the oxalatewas transferred to a Gooch-type 2 ml platinum crucible in which it was weighedon the basis of an assumed formula as (6l)'a0a following the ignition of theoxalate in an oxygen atmosphere at 650° C. The weights obtained for 61 present,weighing as (61) a(C204-) 9" 10 H20 and as (6l)a08, agreed within 0,3%.
Absorption studies have been made of approximately twelve different 61preparations of various concentrations of chloride and nitrate solutions on thesame calibrated spectrophotometer with remarkably good agreement. For the sakeof further comparison several samples of spectrographically pure neodymiumnitrate of known concentration were examined on the same instrument, and theabsorption bands obtained compared favorably with those published by Rodden^2 ).(20) C J. Rodden. J. Nat. Bur. Stds.. 26. Re search Paper 1395. June, 1941.
62

In order to show more clearly the weak, as well as the more prominent absorptionbands, a molar extinction coefficient plot was made in the manner according toBrode^ ' (Fig, 17), For a comparison of the bands of absorption of Nd(NO )and (61) (N0a) a relative to their position and intensities,, reference is madeto Fig, 16,
3. Experimental Results. Absorption data obtained in studies of both the
(6l)Cla and (61)(N0a)3 seem to indicate that they possess the same absorptioncharacteristics in solution, Figs, 14 and 15,
It is interesting to note in Fig, 17 that the major bands of absorption of
element 61 are approximately the same in number and have the same general
location in the visible spectrum as those of its rare earth neighbor, neodymium.However, by referring to Fig, 16, it is evident that the closest any of the
prominent bands for neodymium approach those of element 61 is of the order of
8 rap which is considerably outside the limits of experimental error. The maxi
mum deviation observed in the location of the ten major absorption bends was
less than 1,0 raps
Table III summarizes the positions and relative intensifies of the ten
major bands observed. Bands 5.48,5 ± 0,5. rap, 568,2 ± 0,2 mu, and 737.2 ± 0.2 rap
due to their greater intensity could conceivably be used for the purpose of
identification of very low concentrations of element 61 solutions.
No investigation was made to determine whether thgmolar extinction coeffi
cients changed with concentration.
The very weak band appearing at 402,5 ± 0,5 rap isassumed to be contributed
by the stable samarium isotope 147 resulting from beta decay of 4,0 yr element
61, This particular spectral band is reported by Yntema^2' as being the most
prominent of the samarium bands. The remaining spectral bands of samarium,
however, do not appear in concentrations of element 61 which are three to four
times as high as is illustrated in Fig, 17, Due to the fact that measurement
of absorption in solution does not distinguish between two adjacent absorption
bands separated by only a few Angstroms, comparison with the absorption by the
crystals will be undertaken soon. It is hoped that this would also establish
whether this weak band at 402,5 ± 0,5 rap belongs to samarium or to element 61.
(21) W. R. Brode, "Chemical Spectroscopy', John Wiley, New York, Second Edition (1943).
(22) Lo F. Yntema, J. Am. Chem, Soc. 48 , 1598 (1926),
63

(71
o
tncn
<
r-
4*
70 -
60
50
40
30
20
10
350
FIG. 14
SPECTRAL-TRANSMITTANCY CURVE OF 0.0472 MOLAR SOLUTION (6I)CI3
SEMI-MICRO QUARTZ CELLS EMPLOYED 2.5 x 10mm
LIGHT BEAM REDUCED BY I x 2mm DEFINING SLOT
SPECTROPHOTOMETER WAVE'LENGTH CALIBRATIONSPECTRAL LINES INSTRUMENT VALUES
Hg - 253.6 m/i 253.6 m^t546.07 m/i. 545.9 m/x
H - 656.27 m/x 656.0 tt\ll
BECKMAN SPECTROPHOTOMETER MODEL-LD
1 I 1 1 1390 430 470 510 550 590 630 670 710 750 790
WAVE LENGTH-MILLIMICRONS
830 870 910
NOT CLASSIFIEDDWG. 7207
950 990 1030

100
40 -
30
20
10
350
cPQib
I
NOT CLASSIFIEDDWG. 7206
FIG. 15
SPECTRAL-TRANSMITTANCY CURVE OF 0.0472
MOLAR SOLUTION (6I)(N03)3
SEMI-MICRO CELLS EMPLOYED 2.5 x 10mm.
LIGHT BEAM REDUCED BY I x 2 mm DEFINING SLOT.
SPECTROPHOTOMETER WAVE LENGTH CALIBRATION
SPECTRAL LINES INSTRUMENT VALUES
Hg - 253.6 m/x 253.6m/x546.07mLt 546.0m/x
1014.0 tufi I020.0mttH - 656.27m/x 656.30mti.
BECKMAN SPECTROPHOTOMETER MODEL-LD
1390 430 470 510 550 590 630 670 710 750
WAVELENGTH - MILLIMICRONS
790 830 870 910 950 990 1030

(J)
<a:
100
40
30
20
10
_L
a rs
NOT CLASSIFIEDDWG. 7208
FIG. \6
-SPECTRAL-TRANSMITTANCY CURVE FOR
-SPECTRAL-TRANSMITTANCY CURVE FOR: 0.0476 MOLAR SOLUTION (6I)(N03)3:0.0742 MOLAR SOLUTION (Nd)(N03)3
I
SEMI-MICRO QUARTZ CELLS EMPLOYED 2.5 x 10mmLIGHT BEAM REDUCED BY I x 2 mm DEFINING SLOT
SPECTROPHOTOMETER WAVE LENGTH CALIBRATIONSPECTRAL LINES INSTRUMENT VALUES
Hg - 253.6 m/x 253.6 m^.546.07 m/x 546.0 mla
H - 656 27mii 656.3mtx
BECKMAN SPECTROPHOTOMETER MODEL-LD
350 390 430 470 510 550 590 630 670 710 750 790 830WAVE LENGTH -MILLIMICRONS
±870 910
_L950 990 1030
2.5 x 10
2.0 -
\
0.5 -
*u U_L
NOT CLASSIFIEDDWG. 7205
FIG. 17
MOLECULAR EXTINCTION CURVE FOR 0.0472MOLAR SOLUTION (6I)CI3
SEMI-MICRO QUARTZ CELLS EMPLOYED 2 5 x 10mm
LIGHT BEAM REDUCED BY I x 2 mm DEFINING SLOT
SPECTROPHOTOMETER WAVE LENGTH CALIBRATION
SPECTRAL LINES
Hg- 253.6 mp546.07 mp656.27n)p
INSTRUMENT VALUES
253.6m^.545.9 mp
656.0mp
BECKMAN SPECTROPHOTOMETER MODEL-LD
_L I _L I0.0 _L __j>o—0-L0-
350 390 430 470 510 550 590 630 670 710 750 790 830 870 910 950 990 1030 1070WAVE LENGTH-MILLIMICRONS
It was observed that the crystalline salts, chloride and nitrate, of
element 61 displayed different colorings. This introduced the question of
whether in solution these salts would have the same optical absorption charac
teristics; however., when this test was made,, it was noted that the coloring of
the solutions was visibly the same, i.e., pink or rose. This fact was later
indicated by the failure to find any apparent difference in the two spectra.
Other chemical forms of element 61, such as the hydroxide, oxalate and
oxide all appear pink or rose.
It was of interest to compare the results of this study of the synthetic
element with those reported in 192g on natural material by B„ S„ Hopkins,et al^18)„ Harris and Hopkins concluded that the most probable bands were inthe positions 5816 A and 5123 A„ A description of the methods used by Hopkins,et al,s in studying absorption is not given in the papers cited. The absorption data presented here were obtained with the element in solution and in thatform the presence of th«^e lines is not indicated,
k. Summary. [•*) The absorption bands of element 61 in the visiblespectrum are observed to resemble those of neodymium, both in number and inintensity but are distinctly separable from the neodymium bands by at least 8
rap.
(b) The absorption bands of element 61 are in the same position and of thesame magnitude for both the chloride and nitrate solutions,,
(c) The most prominent absorption bands for a solution of element 61 areto be found in positions 493.5 ± 0,5. mp, 548.. 5 + 0.5 mp, 5.68,0 ± 0.2 *, 685,0± 0.1 rap, 702„7 + 0.3 rap. Til.2 ± 0.2 muy and. 785.,0 + 0.1 rap.
SEARCH FCR Mo^
G. E. Boyd and Q. V. Larson
Further attempts have ceen carried out during the pass, quarter to produceMo93 by neutron irradiation of enriched Mo92. It may be reported immediatelythat thus far no indication of the reported 6,7 hactivity attributed to Mo83has been obtained. It is of interest, however, that this period, reported tobe produced by Cb(d,2n), Cb(p,n) and Zr(a,n), is now regarded as an excited
68

state of Mo83 which decays with the emission of conversion electrons and a
1,6-Mev gamma ray„ [Kundu and Pool, Bull. Am, Phys. Soc, 24, (4) 31 April
28-30 •(1949)1» These characteristics are notably different from the 0,3 and
0,7 Mev /3+ particles previously reported by these authors, and may serve toexplain the failure of our attempts (ORNL 336., p»38) to find a Mo decay with
the emission of positively charged particles. In view of the newly purported
radiation characteristics of Mo93 several more neutron bombardments of Mo82,
without and with chemistry, were made and a ~? hour period was sought in the
decay of the gamma radiations measured through 5 g Pb/cm2. An entire 10 mg
Mo820 sample irradiated for seven hours gave a counting rate of only about
1500 c/m (sample at 10% geometry) under these conditions. The decay of thissample upon which no chemistry was done was resolvable into two periods: 17.1
hand 67 h, the counting rates being 1450 and 200 c/m at the end of bombardment.
A second bombardment of 17 h on a 10 mg aliquot of Mo8203 was made so asto enhance the indicated 17,1 h period and chemistry was performed. Only about
230 c/m were observed through 5 gm Pb/cm2 and this decayed with an approximate67 h half-life. It is concluded that either the 6.7 h Mo93 does not exist, or
that the cross section for its formation by slow neutron capture in Mo92 is
less than 10 ftb.
In order to investigate the possibility that Mo88 may possess a very long
half-life, 500 mg samples of Mo metal which had been irradiated in the ORNLpile for one year (Tc production bombardment #2) and had cooled for over 700days were purified chemically to remove the Tc, Re, W, Fe and Cb contaminantsknown to be present from earlier studies. An aluminum absorption curve has indicated Cb Ka X-rays in high relative abundance together with conversion
electrons and a small amount of gamma radiation. The age of the sample allows
a lower limit of >70 d to be set as the half-life. The study of this seeming
ly new long-lived Mo activity will continue,
SHORT-LIVED TECHNETIUM ACTIVITIES IN U235 FISSION
G. E. Boyd and 0. V. Larson
Work during the past quarter on the program of identifying some of theshort-lived, fission produced Tc isotopes has consisted mainly in the repeated
6 9

Wsipid isolation of a molybdenum fraction from 500 mg amounts of uranium
irradiated in the pile for several minutes followed by measurements of the
growth and decay of the radiations from these fractions through varying thick
nesses of Al and-or Pb„ No new Mo activities have been observed, although the
existence of an 11 rn Mo';102) [0. Hahn and F„ Strassmann, Naturwiss., 29, 285(1941) in U2se fission has been confirmed. The Tc102 daughter of this activitypossesses a half-life of <25 s and appears to decay with the emission of fl~
particles of about 1900 mg Al-cm2 range (e.g., about 3.7 Mev), The slightly
different half-lives of 17 m and 15 m were observed for the 14.6 m Mo10i and
14.0 m TcJ " activities, respectively. The radiation characteristics of these
latter nuclides appear to agree fairly well with those previously reported.
Further characterization of the energies of the radiations of both the 17 m
MoA %and its 15 m Tc*k0i daughter is intended, however.
From the experiments with Mo it is possible to state that those radionuclides
of mass >102 probably possess half-lives of <2 m. No periods in fission Mo
longer than 67 h have been observed.
THE RADIONUCLIDES OF TIN
C. M. Nelson and G. E. Boyd
A preliminary survey of the activities produced by the neutron irradiation
of the calutron enriched stable tin isotopes has now been completed using the
Snlx%2? Sni*029 and SnliB02 preparations. By means of a 30 minute irradiationof each of these enriched samples it has been possible to assign *the 30-33 m
period noted earlier in the bombardment of Sn'*"*602 and Sn"* ' 02 to mass 113,
An attempt was made to determine the energies of the radiations associated with
this period but the growth of a short-lived indium daughter activity into the
irradiated sample made difficult the interpretation of the gross absorption in
aluminum. Apparently the 30 m activity decays with charged particles of 1,2
Mev energy and possibly also by K-eapture since X-rays in the In~Sn region
were found in good yield. Evidently the 30 m Sniia is isomeric with the knownlong-lived period at mass 113. Approximately 80 days after irradiation the
same Sniis02 sample which gave the 30 m activity in maximum yield has ex
hibited an almost pure 120 day decay.
70

No chemical separations or purifications have been conducted with thesamples irradiated thus far. In all cases, the spectrochemical analyses fromthe Y-12 group (Keim, Weaver and co-workers) have indicated the enriched tinpreparations to be remarkably free from impurities. Immediately in the future,however, chemistry will be employed to determine if the as yet unassigned 80 m,3 h, 17 h, and 13-17 d periods belong to tin.
Two further incidental experiments have been conducted to determine ifthere were any highly energetic gamma radiations associated with the tinactivities. Approximately a 20 gm sample of ordinary (C.P. grade) Sn02 wasirradiated in the pile for 3 hours and then placed in the D20-photoneutronapparatus of Dr. M. H. Feldman, Since the (y,n) threshold for deuterium isknown to be 2.2 Mev, quantum radiations emitted by Sn of greater energy thanthis value should produce neutrons which will be counted. The observed neutroncounting rate, however, did not differ from the background for the apparatus.In a second trial, 50 gm of Sn02 was irradiated for one week and then measuredwith a negative result.
HARD GAMMA EMITTERS IN FISSION
H. A. Levy and M. H. Feldman
1 Radiation Characteristics of I™, The data on the decay of I1" throughthe various absorbers which were reported last quarter(23jhave been re-analyzedby least squares procedures. The background of 22-hour Iwas estimated fromthe graph and subtracted. The differences were then fitted to an exponentialwith both half-life and initial activity treated as unknowns and with individualmeasurements suitably weighted, taking account of the variance of the countsand the estimated variances of the subtracted background. Plotting the initialactivities against absorber thickness gives arevised absorption curve whichis not significantly different from that obtained by graphical methods and reported last quarter. Results of this analysis may be summarized as follows:
(a) There is ahard 0 component, the maximum energy of which lies between3.5 Mev and 4.2 Mev.' (b) There is asofter 0 component, the maximum energy of which lies between
1.5. and 1,75. Mev, depending on which of the limits is taken as the energy of
(23) Levy, H. A. and Feldman, M. H., ORNL 336, p. 46 et seq.
71

the harder component. Data taken on the /3-ray spectrometer, less reliable
because of low intensities and other uncertainties, indicate the energy to be
1,7 Mev.
(c) The half-life of this iodine nuclide has heretofore been taken as 54
minutes. Our data indicate a half-life of 5.0.8 minutes with a mean deviation,
from 10 curves, of ± 1.4 minutes. Our decay curves^3) indicate a completeabsence of 6,7 hr I and of 2,4 hr I, and it is assumed that the presence of
small quantities of these species gave previous determinaltions a slightly high
value,
2. Absorption Coefficients of Hard y Rays. In order to determine theenergies of hard y!s (above 2,2 Mev) such as the one found in i134(23)? it wasnecessary to construct an absorber rack over our heavy water tank. The shape
of the heavy water tank was changed as was the construction of the fission
chamber to obtain greater overall efficiency in counting (see Fig, 18 for
schematic representation of this apparatus). In a measurement, the sample is
lowered into the lead shield and absorbers, which may be 0.368 in, Al or 0,250
in. Pb sheets, are placed between the shield and the tank of heavy water.
Neutrons ejected from the deuterium nuclei by the y rays are counted by means
of the fissions they cause in a layer of U235 in the fission chamber. Thegeometry of the sample position is adjustable by means of the threaded exterior
of the lead shield which can be raised or lowered.
The advantage of this apparatus over an ordinary Geiger tube absorption
set-up is that there exists a threshold energy of 2.2 Mev for countable y's.Thus, degraded radiation softer than 2.2 Mev is not detected. This methodgives an opportunity to check theoretical absorption coefficients of variousmaterials for y energies above 2»2 Mev, Heitler's(24) calculated absorptioncoefficients as a function of y energy are plotted in Figs, 19-20, There is,of course, some uncertainty in the significance of the effective absorptioncoefficient we measure, because of the unusually large angle subtended by thedetector. In any case, however, these measurements serve as a calibration of
the method and apparatus.
The experiment has been carried out with Ga72, Na24, and Mnse as y sources;the gallium emitted two hard y's.
(a) Sodium? The absorption curves for this hard y emitter are given inFig, 21, The usual corrections, such as that for decay, were applied, and thedata were fitted to an exponential by a least squares procedure. The Al half
(24) Heitler, W„t The Quantum Theory of Radiation, Oxford Press, London, 1936.
72
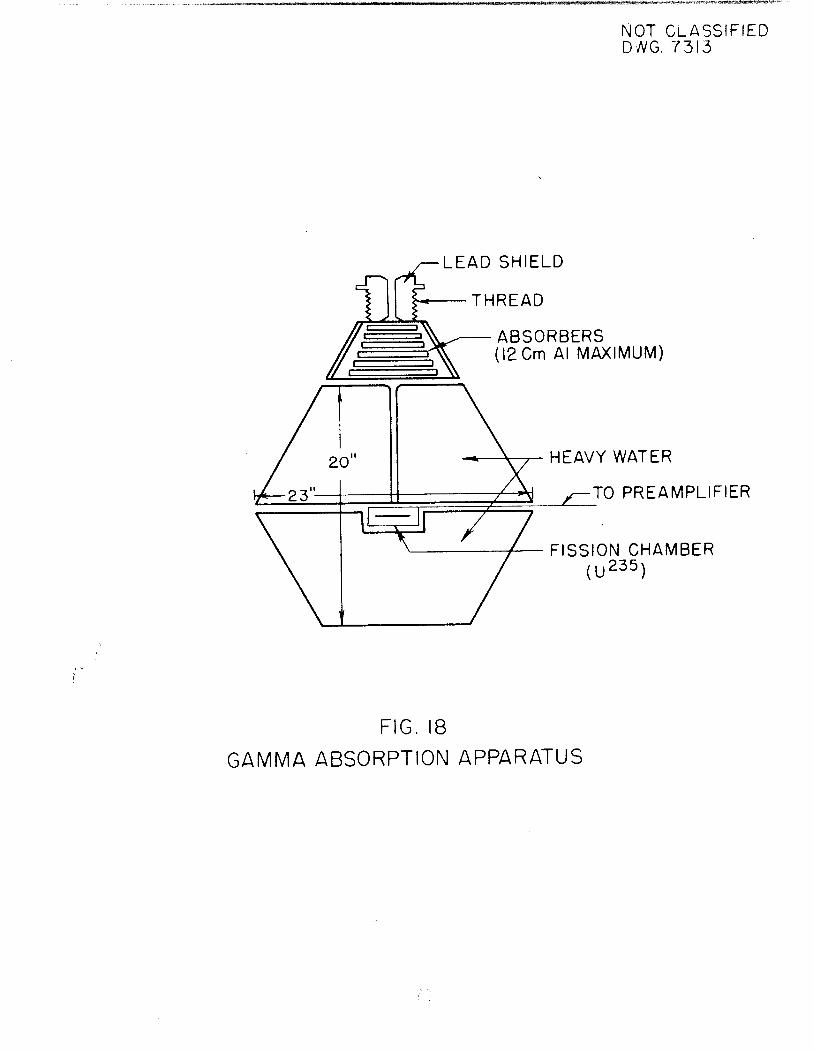
NOT CLASSIFIEDDWG. 7313
LEAD SHIELD
THREAD
ABSORBERS(12 Cm Al MAXIMUM)
HEAVY WATER
TO PREAMPLIFIER
FISSION CHAMBER(U235}
FIG. 18
GAMMA ABSORPTION APPARATUS

0.3
0.2-
r-
0.
0.5l ii i i i.0
NOT CLASSIFIEDDWG. 7321
ABSORPTION COEFFICIENT (r) PER CmFOR 7 OF VARIOUS ENERGIES IN ALUMINUM
(AFTER HEITLER)
hi/
m0c;
O THEORETICAL
A GALLIUM
o MANGANESE
Q SODIUM
I I10
J L100
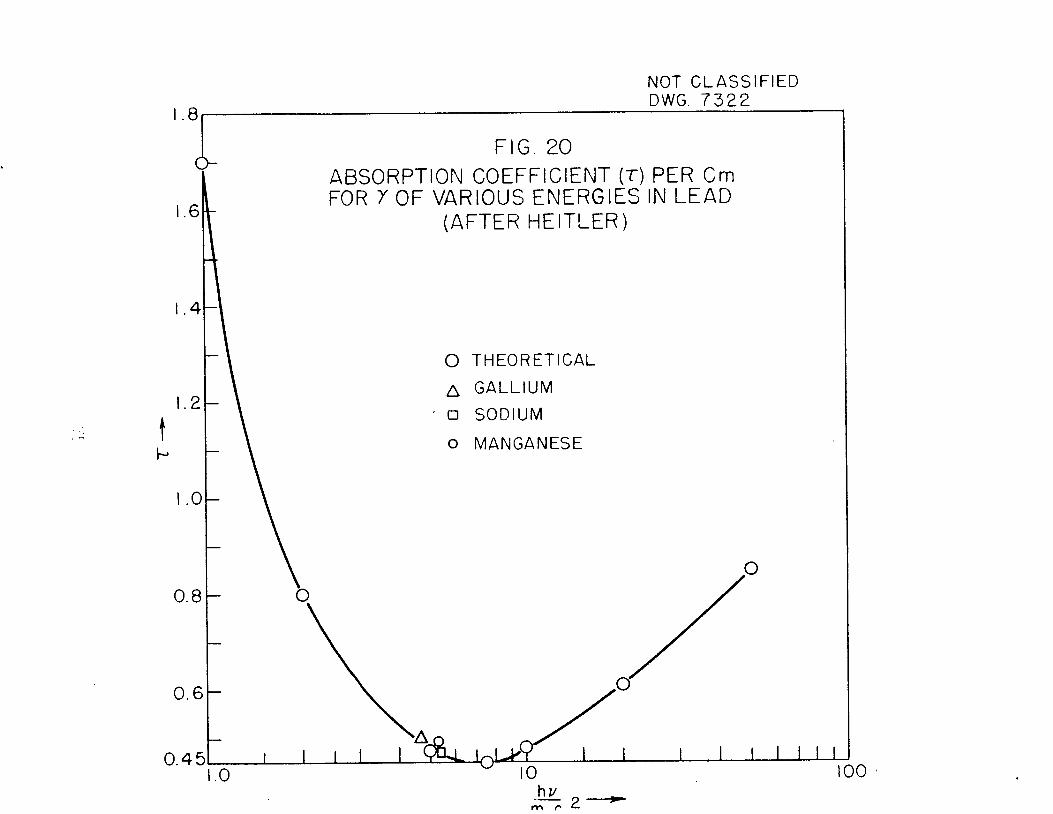
0.45
NOT CLASSIFIED
DWG. 7322
FIG. 20
ABSORPTION COEFFICIENT (T) PER CmFOR X OF VARIOUS ENERGIES IN LEAD
(AFTER HEITLER)
O THEORETICAL
A GALLIUM
a SODIUM
o MANGANESE
Al IqL>9'

010,000
1000
o
2000
DWG. 7oZ3
NUMBER OF ALUMINUM ABSORBERS2 3 4 5 6 7 8 9 10
-i 1 1 1 1 1 1 1 r
FIG. 21
ABSORPTION CURVES OF No24
1
ALUMINUM
2 3 4 5
NUMBER OF LEAD ABSORBERS —-
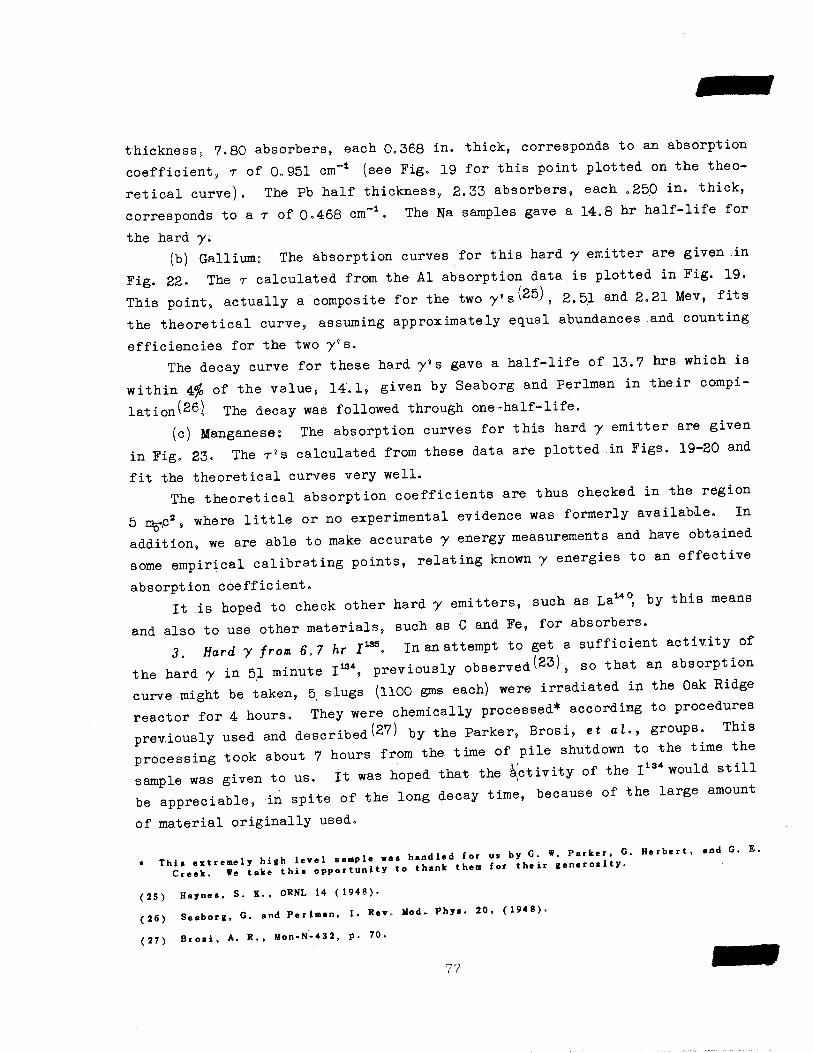
thickness, 7.80 absorbers, each 0.368 in. thick, corresponds to an absorptioncoefficient, r of 0.95.1 cm-1 (see Fig. 19 for this point plotted on the theoretical curve). The Pb half thickness, 2.33 absorbers, each .250 in. thick,corresponds to a r of 0.468 cm-1. The Na samples gave a 14.8 hr half-life forthe hard y.
(b) Gallium: The absorption curves for this hard y emitter are given inFig. 22. The t calculated from the Al absorption data is plotted in Fig. 19.This point, actually acomposite for the two y's^25-), 2.5.1 and 2.21 Mev, fitsthe theoretical curve, assuming approximately equal abundances and counting
efficiencies for the two y's.
The decay curve for these hard 7's gave a half-life of 13.7 hrs which iswithin 4$ of the value, 14.1, given by Seaborg and Perlman in their compilation^6) The decay was followed through one-half-life.
(c) Manganese: The absorption curves for this hard y emitter are givenin Fig. 23, The t's calculated from these data are plotted in Figs. 19-20 andfit the theoretical curves very well.
The theoretical absorption coefficients are thus checked in the region5m^c2, where little or no experimental evidence was formerly available. Inaddition, we are able to make accurate y energy measurements and have obtainedsome empirical calibrating points, relating known y energies to an effectiveabsorption coefficient.
It is hoped to check other hard y emitters, such as La140, by this meansand also to use other materials, such as C and Fe, for absorbers.
3 Hard y from 6.7 hr I135. In an attempt to get asufficient activity ofthe hard y in 51 minute l"\ previously observed(23), so that an absorptioncurve might be taken, 5slugs (1100 gms each) were irradiated in the Oak Ridgereactor for 4 hours. They were chemically processed* according to procedurespreviously used and described(27) by the Parker, Brosi, et al., groups. Thisprocessing took about 7hours from the time of pile shutdown to the time thesample was given to us. It was hoped that the activity of the I"< would stillbe appreciable, in spite of the long decay time, because of the large amountof material originally used.
(25) Haynes. S. K.. ORNL 14 (1948).
(26) Seaborg, G. and Perlman. I. Rev. Mod. Phys. 20, (1948).(27) Brosi. A. R., Mon-N-432, p. 70.
77

10,000
1000
o
2000
^'WS. 7324
NUMBER OF ALUMINUM ABSORBERS —3 4 5 6 7 8 9 10
FIG. 22
ABSORPTION CURVES OF Ga72
ALUMINUM
J I I L I I L I L2 3 4
NUMBER OF LEAD ABSORBERS-*
o
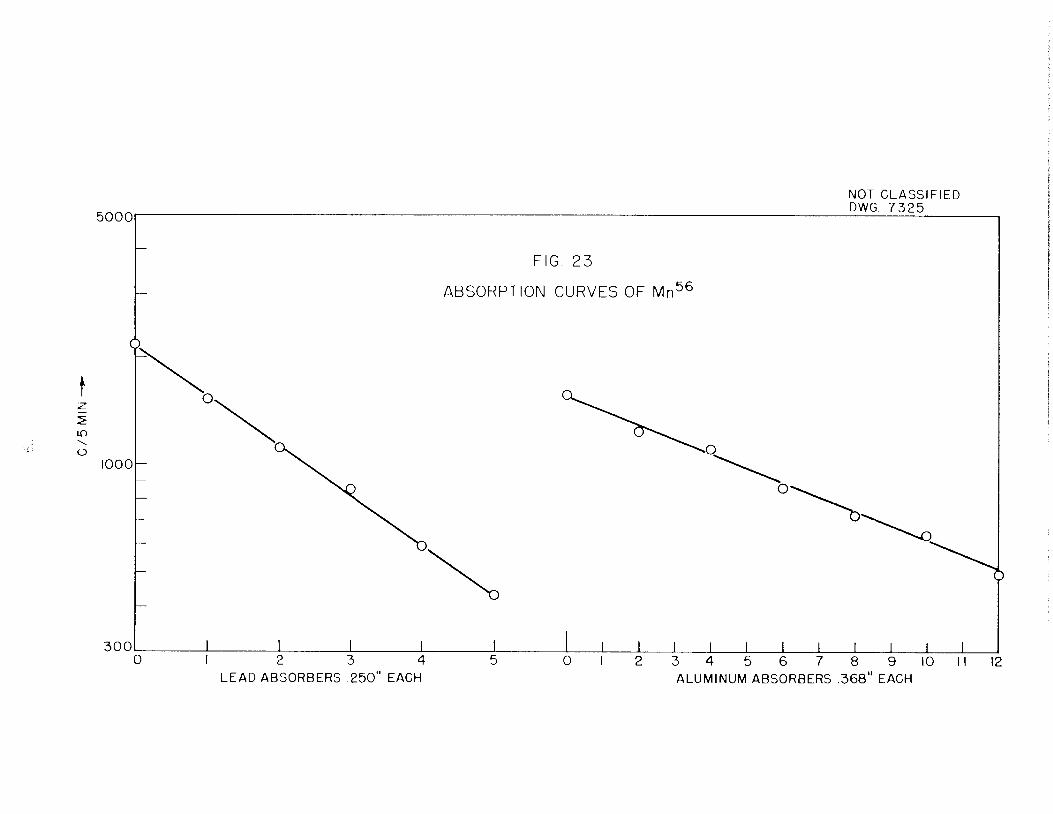
50oor
o
1000'
3000
J_ _L12 3 4
LEAD ABSORBERS 250" EACH
FIG. 23
ABSORPTION CURVES OF Mn56
_L _L _L J_
NOT CLASSIFIEDDWG 7325
_L0 34 56789 10
ALUMINUM ABSORBERS .368" EACH12

The sample, placed at the center of our tank (100$ geometry) gave 4000c/5 minutes. Absorption and decay curves were carried on simultaneously. Thedecay data taken with the sample at the center of the tank are given graphically in Fig. 24. It is immediately apparent that the activity is 6.7 hr
rather than 5.1 minute I. The maximum activity to be assigned to the 51 minute
I at the very beginning of the run was 500 c/5 min. This actually agrees very
well with the activities we had previously been able to obtain using smaller
quantities of uranium. Although the chemical procedures were different, the
yields were probably comparable, andthe yields in the present method are known
to be high. The 6.. 7 hr half-life was assigned to the basis of the decay at
center of tank, Fig. 24. The sample was also followed in a high pressure ion
chamber, calibrated by A. R. Brosi for 6.7 hr I, after the hard y measurements
were completed. This gave an estimate of the absolute disintegration rate so
that we could estimate the fraction of disintegrations giving a hard y. From
the disintegration rate of IUB in our sample at 5:18AM, 5/22/49, 9.9 milli-
curies, the observed hard y counting rate, 80 counts/5 minutes, and anestimated
counting efficiency as measured with a similarly calibrated sample of Na24
3.91 x 10~7 counts/hard y emitted**, we estimate the abundance of hard y1s in
I13s as 1.14$ of the disintegrations. This constant, 1.14$, is of value inelucidating the decay scheme of 6.7 hr I136.
In Fig. 25 are shown the measurements through the various absorbers. The
6.7 hr half-life was then superimposed on each set of points corresponding to
a particular absorber decay curve; these were all extrapolated to a zero time,
the initial amplitudes thus being determined. These initial amplitudes are
plotted as a function of absorber thickness in Fig. 26-. The half-thickness,
7.25 Al absorbers each 0.368 in. thick, corresponded to a 7 of 0.102 which, on
the theoretical curve (Fig. 19), corresponds to 2.4 Mev.
Previously observed 7's in I136 include 0.5.1 and 1.8 Mev. Of these, the
1.8 may be also a crossover 7. The 2.4 Mev 7 ray may correspond to a cross
over transition in competition with the two softer 7's in cascade.
** This value for the counting efficiency is higher than previously reported for our formerequipment by the factor 1560/1079 which represents the increased over-all countingefficiency of our improved equipment as given by standard Ra counts.
80
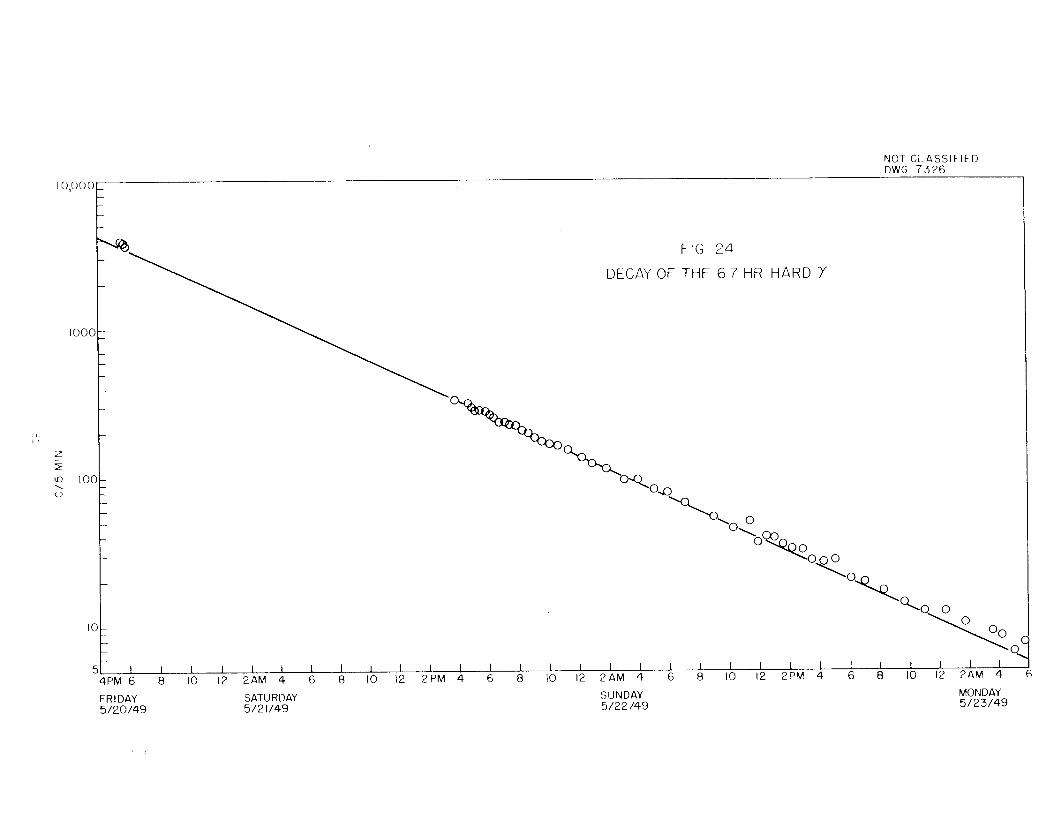
io,ooopr
^
1000
m 100
o
FIG 24
DECAY OF THE 6 7 HR HARD 7
•QnO
NOT CLASSIFIED
DWG 7326
^^ C> O
I i I I I L I L_ I L I L J L J L
4PM 6 8
FRIDAY
5/20/49
10 12 2AM 4 6 8 10 12 2 PM 4 6 8 10 12 2AM 4 6 8 10 12 2PM 4 68 10 12 2AM 4 6SATURDAY5/21/49
SUNDAY5/22/49
MONDAY5/23/49
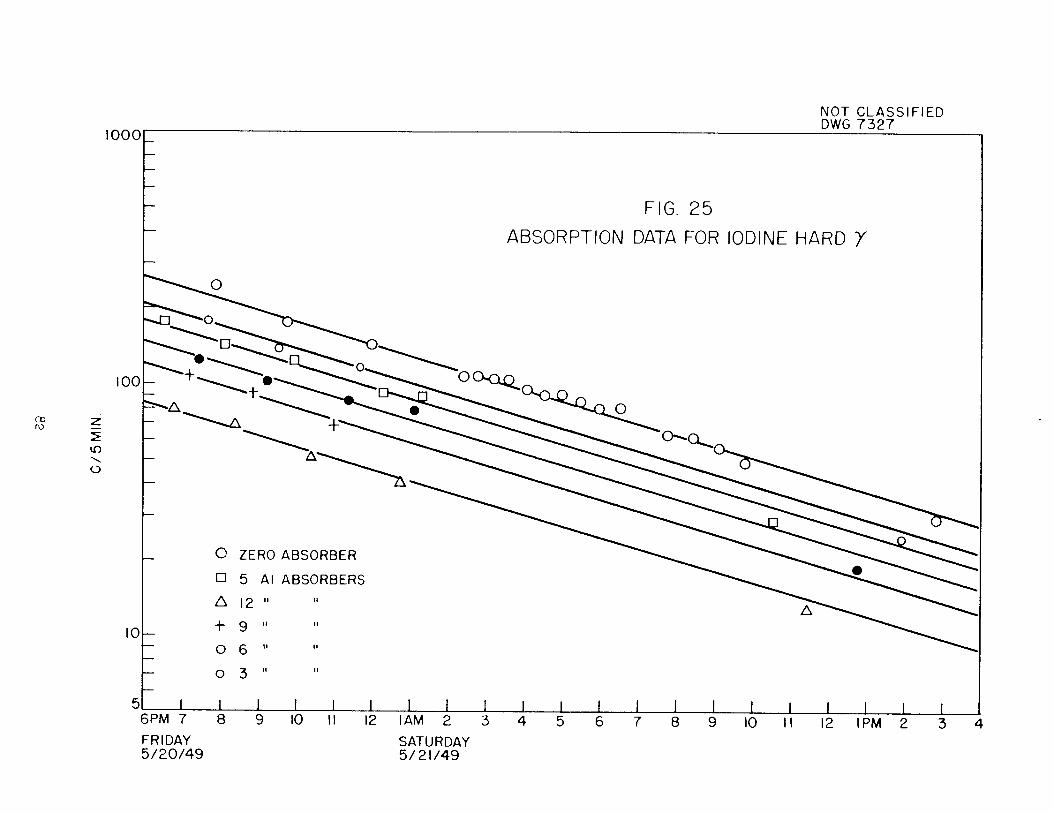
00IY>
1000
If)
o
_L6PM 7
FRIDAY5/20/49
O ZERO ABSORBER
• 5 Al ABSORBERS
A 12 " "
+ 9 "
O 6 "
O 3 "
8 10 12 1AM 2
SATURDAY5/21/49
NOT CLASSIFIEDDWG. 7327
FIG. 25
ABSORPTION DATA FOR IODINE HARD 7
8J_ I
10 II 12 IPM 2

IOOO
o
100-
500
NOT CLASSIFIEDDWG. 7228
FIG. 26
ALUMINUM ABSORPTION CURVEOF 6.7 HR 1135 HARD 7
14 5 6 7 8
NUMBER OFABSORBERS
10

THE FUNDAMENTAL CHEMISTRY OF RUTHENIUM
M. D, Si Iverman
1. Equilibrium Studies in the Upper Valence States. Work on systems of
the upper valence states of manganese which is reported in the literature has
been reviewed in an earlier report'28)o Previously reported qualitative inorganic and spectrophotometric tests indicated that an equilibrium, in complete
analogy with manganese, might exist for the following reaction;;
3K2Ru04 + 2H20 ZZT* 2KRuQ4 + Ru02 + 4K0H
Furthermore, preliminary polarographic data indicated that the couple Rii04°\Ru0&% KOH might be a reversible one. If the potential for this couple wereknown in addition to an equilibrium constant for the above reaction, then the
potential for the RuQ4 ", Ru02.. couple, which is almost certainly irreversible,could be calculated.
The above reaction was investigated approaching equilibrium from both
sides of the equation. The experimental data indicate that equilibrium was
not attained in the majority of cases. In the few instances where this possibility was present, the values obtained for the equilibrium constant differwidely., Because of the nature of the reaction the best available analyticalmethods were not sensitive enough to guarantee that in these few cases for
tuitous results were not obtained due to analytical errors.
(a) Experimental- Sodium ruthenate (Na2Ru04) solutions were prepared bydistilling ruthenium tetroxide into C02»free alkaline solutions. To thesesolutions,, water or perchloric acid was added, as the case might be, to adjustthe solution to the required pH and ionic strength. The solutions were putinto flasks- the latter sealed, and then placed in a thermostat at 25° C for5=? days. The flasks were opened in a C02-free atmosphere (dry box), thesolutions centrifuged to bring down any Ru02 and aliquots were taken foranalysis. An analysis for ruthenate and perruthenate was made in the following manner: An aliquot of the centrifuged reaction mixture was pipetted into acold solution of KI In 2 N HCl. Ruthenium was reduced to the (ill) state, and
(28) ORNL 65, Quairteiriy Report of the Chemistry Division, March, Apsrii, May, 1948.
84

the liberated iodine was titrated with 0.01 N sodium thiosulfate. Total
ruthenium was first determined by the thiourea method developed by DeFord^9).Later, this was supplemented by a spectrophotometric method in which all the
ruthenium was brought to the ruthenate (VI) state by pipetting aliquots of the
reaction mixture into 1 MNaOH. Readings were taken for Ru04= on the Beckman
spectrophotometer at 4650 A. This method first suggested as a possible analyti
cal tool in MohN-432 '30) was later developed by Marshall (31). Hydroxyl ionwas determined by using a pH meter with a high pH Beckman blue glass electrode
calibrated against standard buffers. It is estimated that the pH values
obtained were accurate to + 0.03 unit.
In attacking the reaction from the right side of the equation, solid
KRu04. and Ru02 were placed in C02-free alkaline solutions, the flasks sealedand then placed in a thermostat. Ru02 was prepared in a manner similar tothat employed by Schlesinger and Siems for Mn02 (32', and pure KRu04 was preparedas previously described(33>. The reaction mixtures were handled and analyzedin the manner described above.
The results are given in Tables IV and V. The following facts are note
worthy;
(l) When the reaction was attacked from the left hand side of the equation,analyses for total Ru by the thiourea method almost always showed more Rupresent in solution than was given by the iodimetric method. This could beaccounted for by the presence of colloidal Ru02 which was not completelycentrifuged out of the reaction mixture. TheRu02, when dissolved in the iodide-HC1 solution, would give a higher titer than that calculated on the basis ofthe solution containing only ruthenate and perruthenate.
(2) When the reaction was attacked from the right hand side of theequation, lower results for total Ru were obtained by the thiourea method thanthose calculated on the assumption that ruthenate and perruthenate were theonly species present in solution. This could only be accounted for if therewere a higher valence species of Ru present in solution, namely, Ru04. This
(29) DeFord, -The Chemistry of Ruthenium', Doctoral Thesis. University of Kansas, Lawrence,Kansas, June, 1948.
(30) MonN-432, Quarterly Report on the Chemistry Division, September, October, November, 1947.(31) K-392, Marshall and Rickard, 'Spectrophotometric Determination of Ruthenium*, March, 1949.
(32) Schlesinger and Siems, J. Am. Chem. Soc. 46, 1965 (1924).
(33) CNL-37, Quarterly Report of the Chemistry Division, December, 1947 and January, February.1948.
85

TABLE IV
Approach to equilibrium from left hand side of equation,
3K2Ru04 + 2H20 < > 2KRu04 + RuOa + 4K0H
pH
CONCENTRATIONS ALL IN MOLALITIES
PNaC104
SAMPLE
NUMBER
OH
Conc.
Total Ru
(Thiourea)If all Ru04~
(titerNa2S2C>3)
If all Ru04(titer
Na2S203)
K
(if any)
1 11- 00 1 01*10 3 161 *104 1 24X10"4 0 93 xio"4 7 xio"3 None
13 11-25 1 79*lO3 1 82 xio"4 143X10"4 108 *10"4 1- lxio"1 None
14 10, 60 3.26*10~4 2,72 *10*4 2.21X10"4 1.66 xio"4 l.lxlO*1 None
6 11.20 2.07x10" S 2 93 *10"4 2.07X10"4 1.55 xio"4 1.8X10*2 None
11 10.35 2, 26x10 "4 3.41 xio"4 4.48X10"4 3.38 xio"4 3.7*10"2 2.4X10 7
12 10., 90 • 8.00*10"4 2,58 *10"4 3.05*10"4 2.29 xio"4 3.7x10 2 6 1x10 10
3 11,1.0 6 35*10 3 1,47 xio"3 1.02X10³ 0.765xlor3 2.4xjO"2 None
4 It.IS 5.6?*i0''3' 1,4*. *10"3 0.98*10T3 0.735*10"3 2.4X10"2 None
5 12. 10 1.27*10"2 i-38xio"3 y0 89x10 ' 105X10"3 0. 785X10*3 1.8X10"2 7.9*10 5
9 iOVSg' »::««*»^4 .3'. S* XSfl" 3 4.38* J*"3 3.28 XJO"8 2 xlO"1 None
10 10.80 6;.35*10*4 3.-, 13 *10* 3 4.45*1*" 3 3.34 xio"3 2,6xl0"l None
8 11... 96 9.19*10 5. 08 xlO*8 6.77*10~3 5.08 xio'3 4.0X10*1 None
? 12 20 1.60*10"2 0 958x10 2 1,28*10'2 0.965X10"2 2. lxio"1 2 6*10*
« Two widely diffesrent analytical results on duplicate samples.
86

TABLE V
Approach to equilibrium from right hand side of equation,
3K2Ru04 + 2H20 < > 2KRu04 + Ru02 + 4K0H
P ~ 0. 15 C104
SAMPLE
NUMBERpH
OH"CONCENTRATION
TOTAL Ru
(Thiourea)
IF ALL Ru04=
titer ^
IF ALL Ru04
[a2S20s
K
5 9 55 358X10'6 0-70 *10"3 1-19X10*3 0-845X10'3 Nona
6 9 55 3S8xl0"S 0.775*10"3 1-23X10"3 0-965*10"3 None
1 10.05 1. 13xl0"4 0.732*10"3 1. 13xl0°3 0.920X10"3 None
2 10.20 1.60*10"4 0.811X10"3 1.28X10"3 0.828X10"3 None
3 10.48 3.04X10"4 0.828X10'3 1.23X10"3 0.890X10*3 None
4 10.50 3.19X10'4 0. 759X10"3 1.10*10"S 0.920X10"3 None
7 11.56 3.66X10"3 0.875X10"3 1.20X10*3 0.900X10"3 None
8 11.63 4.30X10"3 1.033X10"3 1.39X10"3 1.04:xlO"3 None
9 10.62 4.20X10*4 4. 15 XlO"4 6. 13X104 4.60 xio"4 None
10 10. 64 4.40X10"4 4.43 xio'4 5.94X10"4 4.45 xio"4 None
11 10.38 2.42X10⁴ 3.14 xio"3 5.55X10'3 4.16 *10'3 None
12 10.40 2.53X10"4 3.04 xio"3 5. 15X10'3 3.86 xio'3 None
87

belief that Ru04 was present in the reaction mixture was later verified by
spectrophotometric data.
(3) It is believed that considerably greater accuracy is required in
analyzing for total Ru. The thiourea method is not infallible and reproduci
bility is not always easily obtained. Furthermore, errors are additive in de
termining the concentration of ruthenate and perruthenate from a total Ru
analysis and one employing a change in valence state upon titration.
(4) The error in determining the hydrogen ion concentration by means of
pH measurements to ± 0.03 unit gives an error in the OH™ concentration of "j7^.
(5) The few values obtained for K show a considerable spread. They were
calculated from the mass action equation,
.... (Ru04")a (OH-rK. '-' ______________
(Ru04-)3
Concentrations were employed, and not activities. Activity coefficients
calculated by means of the approximate Debye-Huckel law, -log f - A 47Tgavevalues of f -- 0.637 for Ru04 = and 0H°, and f - 0.406 for Rup4" based on p -0.15. Raised to the appropriate powers, these values largely cancel out in the
mass action equation.
2. Spectrophotometry. Over a year ago the first spectrophotometric curve
for ruthenate Ion, Ru0,s, was published^30). The suggestion was offered thatthe 4650 A absorption peak might be useful as an analytical tool. Since then,
other workers[31) have Investigated and verified the use of this absorptionpeak as an analytical method for ruthenium. The molar extinction coefficient
of Ru04" has been found to be 1735. at 465. rap, in good agreement with theirvalue of 1739.
Although an earlier curve for Ru04 in H20 was published^30), Wehner andHlndmanl34) later published curves for Ru04 in water, 1 Mapd 6 Mperchloricacid. It has since been discovered that our earlier solution of Ru04 contained
impurities which affected the ratio of the peak heights at 3100 A and 3850 A,,a fact which these investigators had noted. They also showed that the molar
extinction coefficient for Ru04 in 1 Mand 6 MHC104 was not independent of
c oncent rat.ion.
Pure H„0 solutions of Ru04 were prepared and the spectrum re-determined.
(34; ANL-4215, Summary Report for July. August, September, 1948, Chemistry Division. SectionCI.
88

The ratio of the peak height at 3100 A to that at 385.0 A Is 3.12, In good agreement with the.ir value of 3.2. Furthermore, .in contrast, with the results
obtained in perchloric acid, aqueous solutions of Ru04 follow Beer?s Law in
the concentration range, 0.4' x 10°4 to 1 * 1Q~S M. The molar extinction co
efficients obtained are E_(3100 A$ - 2870 and Ea (385.0 A) ~ 920.All attempts to obtain a pure spectrum for perruthenate Ion, Ru04~ failed.
At first, this was difficult to explain. However, after completion of the
equilibrium tests described above, this enigma was easily solved, Perruthenate
.ion is unstable in solution,, so much so, in fact, that its life duration appears
to be of the order of minutes. Furthermore, the products which result from its
decomposition are dependent on the pH of the solution employed. Pure KRu04
has been prepared as previously described^33^ and its identity verified byanalysis and crystal structure. Therefore, it was possible to start with a
pure solid compound of the (VII) state. When this compound is dissolved in H20
'(it might be called sparingly soluble)., the perruthenate Ion decomposes accord
ing to either of the following reactions.;
'(1) 4Ru04™ + 2H20 —> 3Ru04 + RuOaNT + 40H
(2/ 2Ru04" yr _0H~- > 2Ru04=+£0_ + Ha0
Hence, the products of decomposition are dependent upon the pH of the dissolv
ing solution. A spectrophotometric plot of optical density versus wave length
is presented In Fig. 28 for solutions of varying pH. For solutions of pH >10?
reaction (l) proceeds rapidly, so that within a few minutes the solution
darkens perceptibly In color, and traces of solid Ru02 can be detected coming
out of solution. At pH'>I0 <^10.65 reaction (lj proceeds at a much slowerrate. The color of the solution darkens over a period of hours, and the Ru02
is present as a colloid. At pH>-10.65,, reaction (2) starts to appear, as
shown by tha slight hump in Curve No, 3 at 465.0 A. At pH >10.65 reaction (2)predominates over reaction-(1), and the color of the solution gradually turnsto orange, visual evidence of ruthenate ion. The rate of reaction (2) increases considerably with Increase fn pH, so that at pH ^11,3, the reaction
appears to take place In the drder of minutes. However, traces of Ru02 stillappear in the s.alution upon standing unless the pH is raised to -12, Eitherreaction (1) still -:*ake% jplSce to a slight extent until pH ~12, or as appearsmore likely, traces of Ru02 appear due to decomposition or reduction ofruthenate Ion. Close examination of the curves in Figs. 27-28 indicates that
89
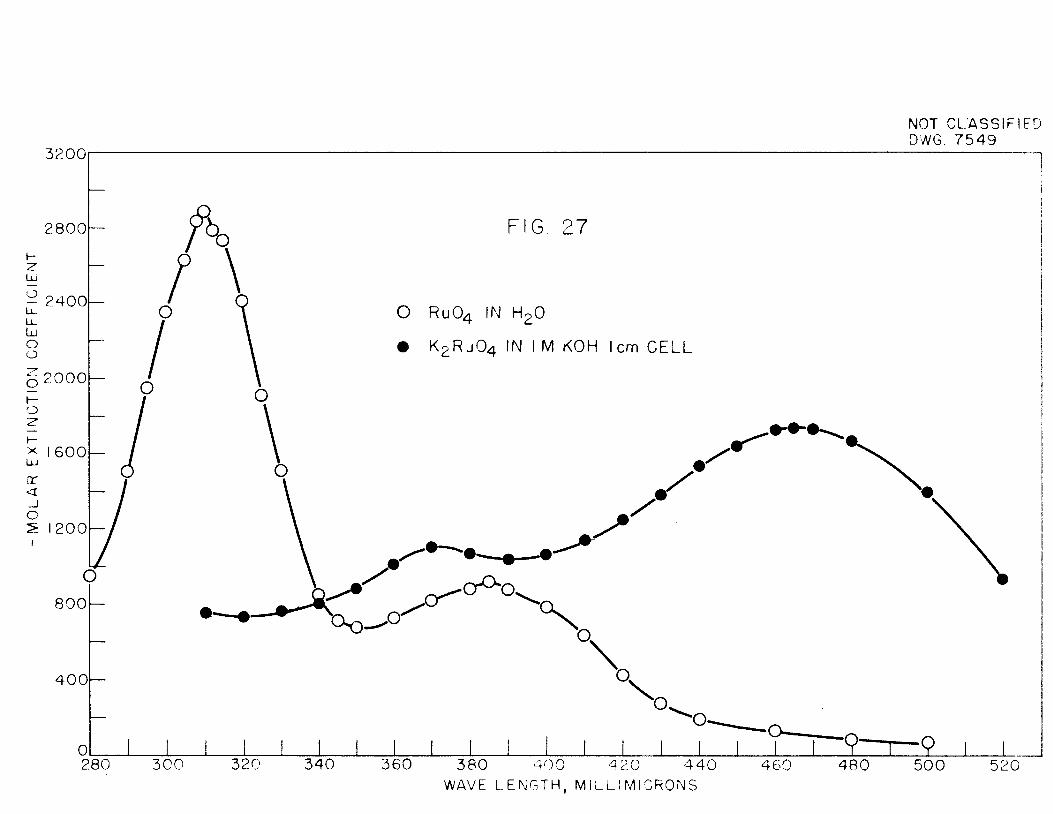
3200
2800
zLU
o2400
LL
u_
LUoo
o 2000
1-o
Z"
t—
X 1600UJ
or
<_)
o
3E 1200
800
400
0280 300 320 340
FIG. 27
O Ru04 IN H20
• K2Ru04 IN I M KOH Icm CELL
ys
y*
a°rx
•°\Q
\Q
\O,
*o-
360 380 400 420 440
WAVE LENGTH, MILLIMICRONS
NOT CLASSIFIEDDWG. 7549
•9^—o i460 480 500 520

3200
2800
zLU
5 2400
u_
LU
oo
2000
r-
O^o:
1600
SOLUTIONS OF KR11O4
RECORDING BECKMAN / I pH - 10.00n pH
m pH
10.35
10.65
STANDARD BECKMAN I • pH - 10.85SPECTROPHOTOMETER SQ pH - ||. | 5
r-
XLU
<r<_j
o 120Q
^XmJ800
400
0
290 300 320 340 360
FIG. 28
380 400 420 440 460WAVE _ENGTH, MILLIMICRONS
480
NOT CLASSIFIED
DWG. 7550
500 520
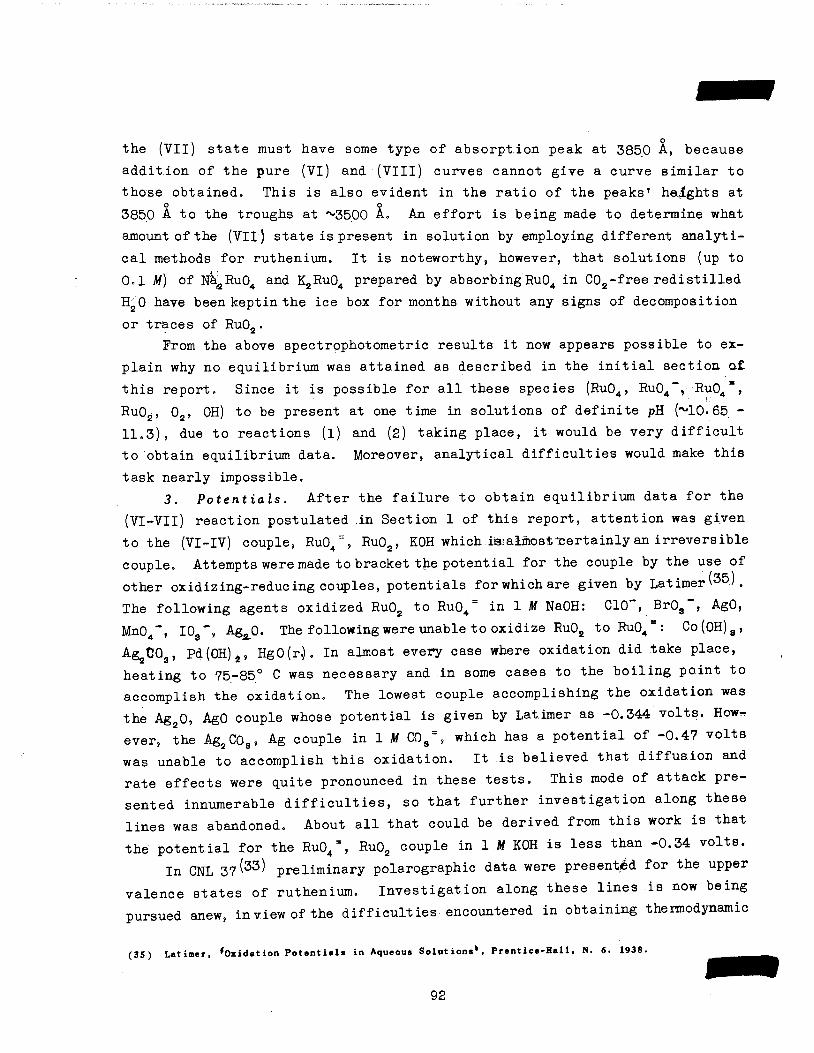
the (VII) state must have some type of absorption peak at 3850 A, because
addition of the pure (VI) and (VIII) curves cannot give a curve similar to
those obtained. This is also evident in the ratio of the peaks' heights ato o
3850 A to the troughs at ~3500 A. An effort is being made to determine what
amount of the (VII) state is present in solution by employing different analyti
cal methods for ruthenium. It is noteworthy, however, that solutions (up to
0.1 M) of NafflRu04 and K2Ru04 prepared by absorbing Ru04 in C02-free redistilled
H20 have been keptin the ice box for months without any signs of decomposition
or traces of Ru02.
From the above spectrophotometric results it now appears possible to ex
plain why no equilibrium was attained as described in the initial section af
this report. Since it is possible for all these species (Ru04, Ru04~, Ru04%Ru02, 02, OH) to be present at one time in solutions of definite pH (~10.65 -11.3), due to reactions (l) and (2) taking place, it would be very difficult
to obtain equilibrium data. Moreover, analytical difficulties would make this
task nearly impossible.
3. Potentials. After the failure to obtain equilibrium data for the
(VI-VII) reaction postulated in Section 1 of this report, attention was given
to the (VI-IV) couple, Ru04", Ru02, KOH which rssalmosticertainly an irreversiblecouple. Attempts were made to bracket the potential for the couple by the use of
other oxidizing-reducing couples, potentials forwhichare given by Latimerv35J.The following agents oxidized Ru02 to Ru04= in 1'Af NaOH: CIO", Br03", AgO,Mn04", I08", Ag^O. The following were unable to oxidize Ru02 toRu04=: Co(0H)3,AgCOa, pd(0H)2, HgO(r,). In almost every case where oxidation did take place,heating to 75-85° C was necessary and in some cases to the boiling point toaccomplish the oxidation. The lowest couple accomplishing the oxidation wasthe Ag20s AgO couple whose potential is given by Latimer as -0.344 volts. However, the Ag2C03, Ag couple in 1MC0a=, which has a potential of -0.47 voltswas unable to accomplish this oxidation. It is believed that diffusion andrate effects were quite pronounced in these tests. This mode of attack presented innumerable difficulties, so that further investigation along theselines was abandoned. About all that could be derived from this work is thatthe potential for the Ru04=, Ru02 couple in 1 Af KOH is less than -0.34 volts.
In CNL 37 (33) preliminary polarographic data were presented for the uppervalence states of ruthenium. Investigation along these lines is now beingpursued anew, inviewofthe difficulties encountered in obtaining thermodynamic
(35) Latimer, 'Oxidation Potentials in Aqueous Solutions*, Prentice-Hall, N. 6. 1938.
92
data from the work reported above. In earlier work, KCl was used as a back
ground electrolyte in solutions prepared for polarograms. However, consider
able difficulty was encountered when we attempted to use KCl in the present
work. Solutions decomposed fairly rapidly, apparently due to the presence of
Cl~„ Hence, CIO " was later used as a background electrolyte. Because the
potassium salt is not soluble enough in water to give low resistance bridges,NaClO .was employed. Actually a double bridge was employed; one of agar + KClran from the saturated calomel cell to the saturated NaC104 cell while the
second went from the saturated NaC104 cell to the cell containing Ru in saturatedNaClO solution. Resistances in almost all cases were thus kept below 6000
ohms.
Some preliminary data can be presented at this time. The (VII-VIIl)couple has been mainly investigated; oxidation waves starting with pure KRu04dissolved in solution give a value of ~+0.7 volt (polarographic convention).Three reduction waves for Ru04 dissolved in alkaline solution give values forthe (VII-VIJI) couple of 0,629 0, 63 and 0. 66 volts Furthermore, these reductionwaves show the reduction of Ru04 to Ru02 .in three distinct steps; the tetroxideto perruthenate (VIII-VII), the perruthenate to ruthenate (VII-VI), and thedouble electron jump (VIi-.IV) from ruthenate to tetravalent Ru in alkalinesolution, probably Ru02. Additional reduction waves for perruthenate andruthenate solutions Indicate that the value for the (VI-IV) potential lies~+0ol8 volts. These results are being checked further and the investigationis b^dng continued along these lines.
It Is hoped that one mope point can be cleared up, i.e., to what extentdoes Ru04 act as an acid in solution. pH measurements have indicated it to ^afairly*strong acid, in direct contrast to previous work by Yost and White I36)on perperosmle acid, which has a dissociation constant of -lO-12. It would beexpected that Ru04 should have an acid strength comparable to that of 0s04from the size of the ions and the similarity in their chemical behavior. Hence,oxidation of H20 at the glass electrode by Ru04 to give H+ ions may accountfor the low pH values obtained. This will be checked further to permit a conclusion as to whether polarographic waves involving Ru04 are to be based onthe molecule or an anion involving Ru(VIIl).
06) Yost and White, J. Am. Chem. Soc. SB, 81 (1928).
93

GENERAL NUCLEAR CHEMISTRY
94 -
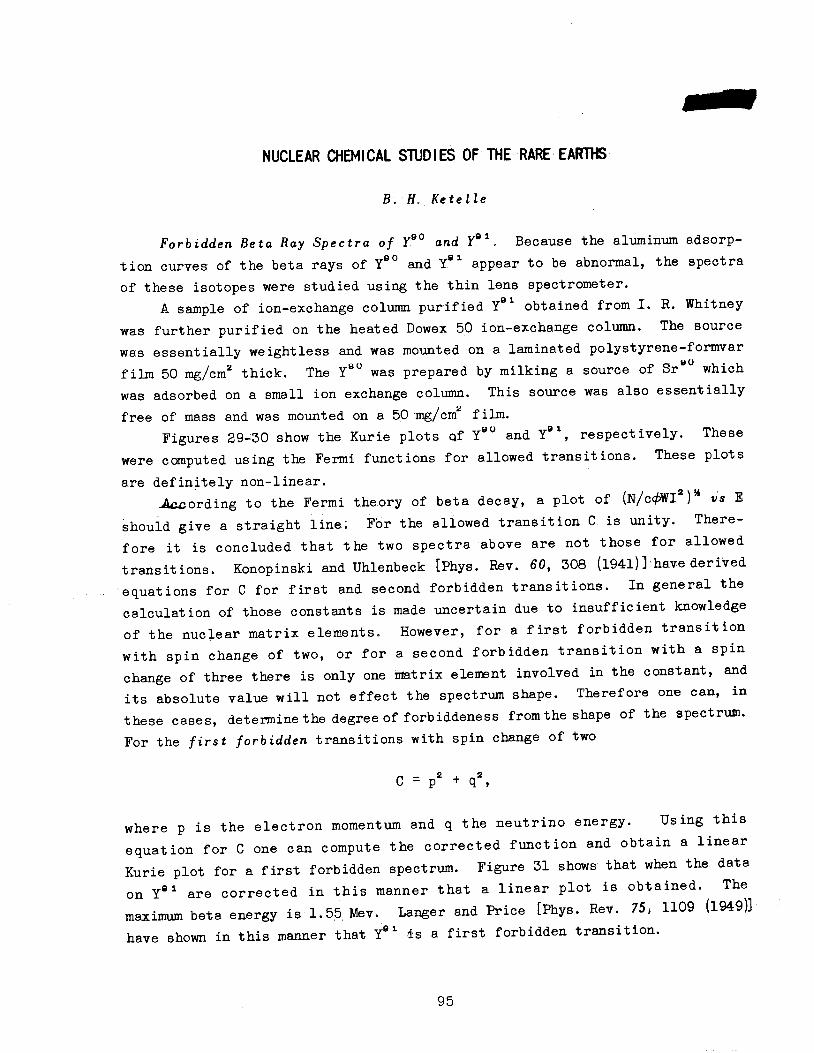
NUCLEAR CHEMICAL STUDIES OFTHE RARE EARTHS
B. H. Ketelle
Forbidden Beta Ray Spectra of Ye0 and YB1. Because the aluminum adsorption curves of the beta rays of Y90 and Y91 appear to be abnormal, the spectraof these isotopes were studied using the thin lens spectrometer.
A sample of ion-exchange column purified Y91 obtained from I. R. Whitneywas further purified on the heated Dowex 50 ion-exchange column. The sourcewas essentially weightless and was mounted on a laminated polystyrene-formvar
Q (J
film 50 mg/cm2 thick. The Ys0 was prepared by milking a source of Sr whichwas adsorbed on a small ion exchange column. This source was also essentially
free of mass and was mounted on a 50 mg/cm film.Figures 29-30 show the Kurie plots of Y90 and Y91, respectively. These
were computed using the Fermi functions for allowed transitions. These plotsare definitely non-linear.
-Uncording to the Fermi theory of beta decay, a plot of (N/c<£WIz) vs Eshould give a straight line; For the allowed transition C is unity. Therefore it is concluded that the two spectra above are not those for allowedtransitions. Konopinski and Uhlenbeck [Phys. Rev. 60, 308 (1941)] have derivedequations for C for first and second forbidden transitions. In general thecalculation of those constants is made uncertain due to insufficient knowledgeof the nuclear matrix elements. However, for a first forbidden transitionwith spin change of two, or for a second forbidden transition with a spinchange of three there is only one matrix element involved in the constant, andits absolute value will not effect the spectrum shape. Therefore one can, inthese cases, determine the degree of forbiddeness from the shape of the spectrum.For the first forbidden transitions with spin change of two
C = p2 + q2,
where p is the electron momentum and q the neutrino energy. Using thisequation for C one can compute the corrected function and obtain a linearKurie plot for a first forbidden spectrum. Figure 31 shows that when the dataon Y81 are corrected in this manner that a linear plot is obtained. Themaximum beta energy is 1.55. Mev. Langer and Price [Phys. Rev. 75, 1109 (1949)]have shown in this manner that Y91 is a first forbidden transition.
95
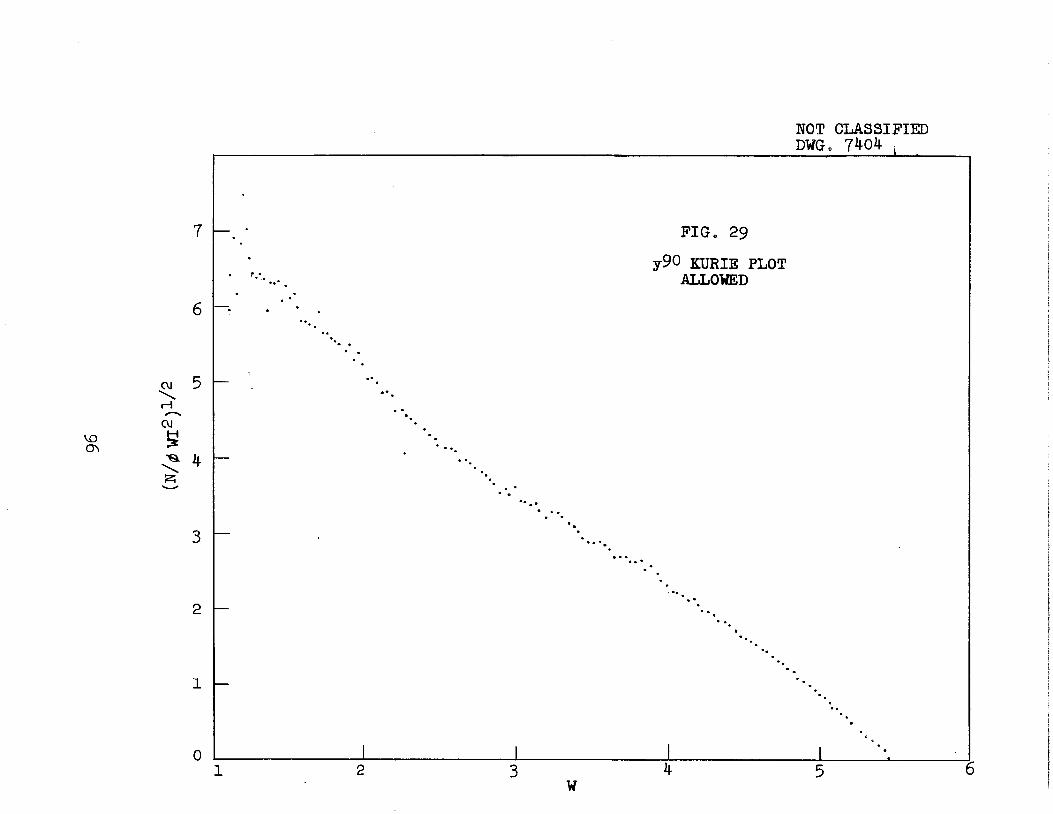
7
OJ
CM
\ 4
0
w
NOT CLASSIFIED
DWGo 7404 ,
FIG. 29
y90 kurie PLOTALLOWED

OJ
\H
3
0
W
NOT CLASSIFIED
DWG. 7405
FIG. 30
y91 KURIE PLOTALLOWED
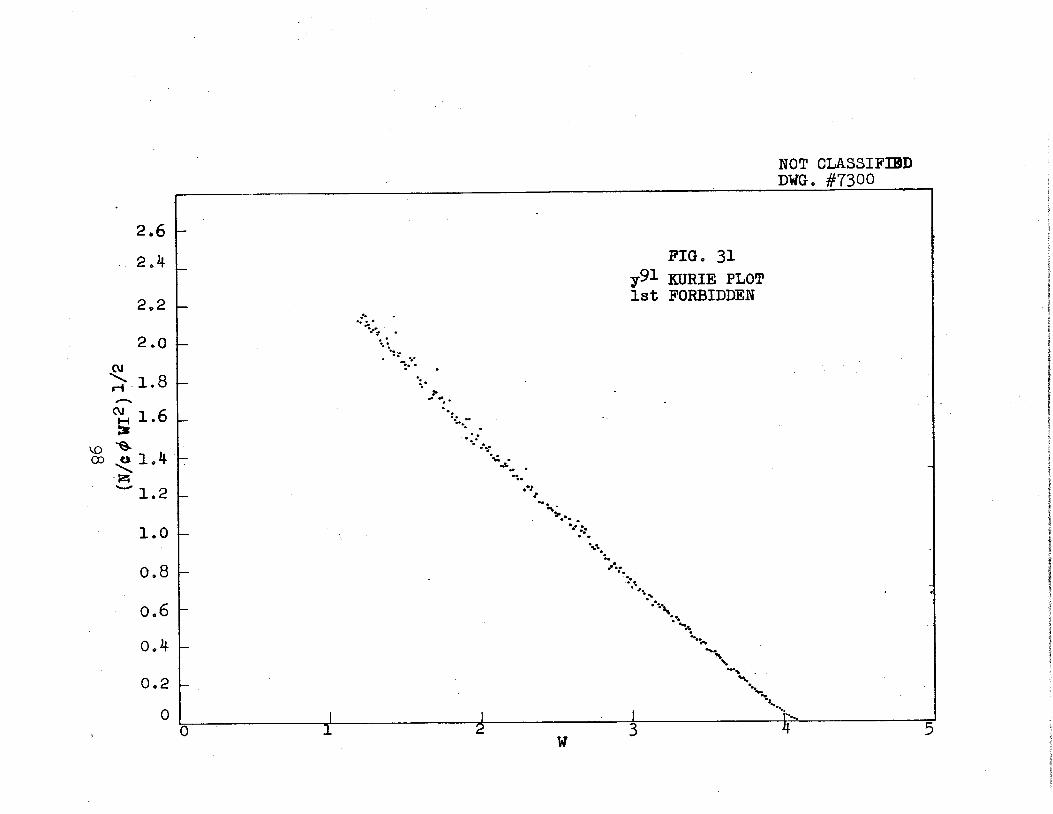
2.6
2.4
2.2
V*-' .
2.0"*:?
> 1.8*•• •
>
H 1«6
VO -S-oo o 1.4
"1.2-
Stt
•-. .
NOT CLASSIFIED
DWG, #7300
PIG. 31
y9i KURIE PLOT
1st FORBIDDEN
• •
s
« -
1.0 h
0.8
0.6
0.4
0.2
0
_•w
t

Although it is not known that the spin change in the decay of Y is two
the data were computed in the same manner and are plotted in Fig. 32. Again
a linear plot was obtained. The maximum energy is 2.28 Mev.
If the correction factors are computed for the second forbidden tran
sition with a spin change ofthree and the corresponding Kurie plot is construct
ed a straight line is not obtained. Thus from the shapes of the spectra one
concludes that beta disintegrations of Y80 and Y91 are first forbidden.According to the Fermi theory, the reciprocal half-life of a radioactive
nucleus is
21 f G'
3t I 2n InZ J
1 w
-1 si
2CFpWq^dW
where G is the Fermi constant, C the above mentioned correction term to the
Fermi function, p and W the electron's momentum and energy and q the neutrino
energy. Therefore, if the electron energy distribution curve is known and if
the constant C which contains the matrix elements can be computed, the half-
life which corresponds to the maximum energy observed can be computed. This
has been done both for Ye0 and Y8i. The values obtained are uncertain because
of lack of knowledge of the absolute value of the nuclear matrix elements.
However, the order of magnitude of the matrix element is determined by the
nuclear radius. In these calculations the radius function has been separated
out of the matrix element and a value for the radius of 0.004 Ay3 was used.G was taken to be 5 x 10~12. In Table I are summarized the values of the
product of the remaining part of the matrix element and the half-lives calcu
lated for first and second forbidden transitions.
TABLE I
Calculated half-lives of Y and Y
90Y
81Y
FIRST SECOND
A J = 2 A J = 3 OBSERVED
2,7 hrs . 3.8 x 10 hrs.. 62 hrs
0.7 d 3.8x10 d 57 d.
99

oo
H
1.7
1.6
1.5
1.4
1.3
1.2
1.1
B1'0^0.9
0.8
0.7
0.6
0.5
0.4
0.3
0.2
0ol
0
W
FIG. 32
Y9° KURIE PLOT1st FORBIDDEN
NOT CLASSIFIED
DWGo 7406
Let us assume that the matrix elements are of the order unity and compare thecalculated and observed half-lives. It appears that for Y80 the half-life obtained upon the assumption that the transition is first forbidden is in betteragreement with the observed half-life than is the value obtained if the transition is assumed to be a second forbidden transition. This agrees with theconclusion from the spectrum shape. However for Yei the observed half-lifefalls about midway between the two calculated half-lives so one can draw noconclusion.
Beta Disintegration Energy of Hoxae. Aluminum absorption curves of theactivity of 27.2 hr Ho180 indicate the maximum beta energy to be about 2 Mevand also indicate the presence of a soft gamma ray. A thin source was preparedfor the lens spectrometer and the spectrum was determined. A conversion lineline at 64 Kev was observed. If these are L electrons, the correspondingenergy of the gamma ray would be 73 Kev. The Kurie plot is a fairly straightline with an endpoint at 1.85 Mev. As this study was in progress Grant andHill reported [Nature 163, 524 (1949)] their observation of this same isotope.They find the maximum beta energy to be 1.88 ± 0.02 Mev and the gamma rayenergy to be 80.2 ±0.7 Kev.
A Study of the 12 min Activity Produced in Nd. An attempt to detect avery short-lived beta emitter which might be the parent of the 12 min activityobtained by (n y) on Nd has failed. It would appear that, if such a parentexists, it must have a half-life of less than 0.1 sec. Since it is not impossible that the 12 min activity is Nd and that the Pm daughter has a shorterhalf-life, it might be possible to make the assignment from the disintegrationenergy of the 12 min activity. The liquid drop model gives 2.36 Mev for Nd161and 1.43 Mev for Pm181. Coincidence counting has been done on the activity.The half-lives obtained from beta-gamma coincidences as well as from betadecay and gamma decay are in agreement. The best value appears to be 12 min.An aluminum absorption curve of the betas gives a maximum energy of 1.9 Mev.A Pb curve of the gammas indicates the presence of KX-rays and a 1 Mev gamma.However, the coincidence absorption curve indicates that the beta coincidentwith the X-rays and y-rays has an energy of only 1.5 Mev. There are gamma-gamma coincidences and the lead absorption curve of these indicates that thereare 1 Mev gammas coincident with about 50 Kev gammas or X-rays. These resultsare not inconsistent with the postulate that the 12 min activity is Nd andhas a 1.5 Mev /3 and two gammas in coincidence and that the daughter activityhas a 1.9 Mev beta and no gammas.
101

In order to analyze the curves for the 12 min activity it was necessary
to study the activities of the 1.6. hr activity of NdA*'9. The coincidencestudy indicates that this isotope decays by 1.4 Mev beta decay followed by a
0.5 Mev gamma.
Study of Dyxaa . The long-lived beta emitter in Dy mentioned in ORNL 336,
p. 53, has been studied using the ion exchange separations technique. Asample of Dy which had been irradiated in the pile for five months was adsorbed on the column and eluted under conditions which are known to give excellent
separation of the 27 hr Ho and 140 min Dy activities. The elution curve showed the presence of holmium activity and a high saddle between the holmium anddysprosium peaks. The dysprosium which was used was known to be extremely pure
so it was suspected that the 27 hr holmium activity which was identified in
the first peak from the column was formed during the irradiation by double
neutron capture. This activity could form byeither of two series of reactions"
140 mm <£ ' ora.
{2.) ^«" ________» Dy-" —^ > Dy"«_^L-^ Ho1"-^ > Eriee{C1 y y J 80 hrs. 27 hrs.
It was also observed that a sample of activity taken from the trailing edge of
the Dy peak showed growth. Therefore^ it seemed certain that at least part ofthe Ho activity observed had been formed according to Equation 2 This wouldalso explain the high saddle between the holmium and dysprosium peaks since
holmium would be forming In the column by decay of Dy1BO and would "bleed out"ahead of the dysprosium peak. As a further check upon this hypothesis., themajor part of the dysprosium peak was readsorbed on the column and a secondseparation of holmium and dysprosium was made. This separation gave a similarelution curve with the high saddle. Again the 27 hr holmium activity was
identified and it was possible to obtain aluminum absorption curves of thetailing edge of the dysprosium peak before very much holmium had grown intothe sample. In this way it has been established that DyiB6 decays with a 0.4Mev beta of half-life 80 hrs. (This is the same activity which was described
in ORNL 336 as an 85 hr beta decay with 2 Mev energy.) In that sample thehard beta of the holmium daughter masked the soft parent beta because the
102
measurements had not been made before an appreciable amount of holmium had
grown into the sample.From the ratio of 80 hr activity to 140 min activity'Mn a sample of
dysprosium which had undergone no chemical separation after irradiation, anapproximate value of the neutron cross section of. Dy186 was computed to be3600 barns.
Study of Dy(1S7 or 1$9K After the 80 hr activity had decayed out of theabove mentioned dysprosium samples-, there was a residual activity with a half-life of 120 ±20 days. This activity'decays by K capture. In' addition a preliminary study of the activity on the crystal spectrometer with P. R. Bellhas shown that there is an unconverted gamma ray of 144 Kev. Absorptioncurves indicate the presence of soft electrons which may be Auger electrons.
PRODUCTION OF SPECTROCHEMICALLY PURE RARE EARTHS FOR RESEARCH PURPOSES
D. H. Harris and G, E, Boyd
The inventory of spectrochemically pure rare earth preparations has beenadded to as a result of Lu, Tb, Sm, Nd, Pr, Ce and La separations completedduring the past quarter. At the present the amounts on hand are:
Sc203 0.150 g Gd203 15.000 g
Y203 7.05.0 Tb407 0.801
La203 8.457 Dy203 1.399
Ce02 7.851 Ho203 0.686.
Pre0n 6,395 Er203 6,262
Nd203 17.587 Tm203 0.649
Sm20s 146,0* Yb203 0.100
2,338** Lua03 0.131
Eu,0;2^3
*Crystallized, contains 0.1% Eu
**By ion-exchange column.
103

Currently a Ub-Lu and a Tb separation are in progress. The former is ex
pected to yield between 0.5 and 1,0 gm of pure Lu203; the latter has given
about 4-5 gm of pure Tb, but as yet the spectrochemical analysis of this material
has not been completed.
During the quarter now elapsed 31 samples of different spectrochemically
pure rare earths were shipped to seven AEC research groups.
COUNTING YIELDS OF LOW ENERGY BETA EMITTERS
J, C, Griess, A, R, Brosi., H. Zeldes
Several radioactive isotopes have recently been discovered at ORNL which
have long half-lives and very soft beta radiations. The radiations from these
isotopes have been detected in a slide chamber proportional counter in which
the source can be placed in the active region of the counter, The counting
yield (i.e., the fraction of the beta disintegrations counted) must be known
in order to determine the decay constants of these long lived activities, The
purpose of this work was to determine the counting yields of essentially
weightless samples5 mounted on "infinitely thick"1 platinum, as a function of
the maximum energy of the beta radiation. Counting yields were obtained by
dividing the beta counting rate observed in the proportional counter by the
absolute' disintegration rate determined from coincidence counting rates.
The soft beta emitters chosen were Rux , Cb and Co with maximum beta
energies of 0.03, 0.147 and 0.31 Mev, respectively, Co and Cb have well
known decay schemes with a single beta ray followed by gamma emission. Ru"1,
has a Rh daughter which decays by beta and gamma emission. It is possible to
determine the absolute disintegration rates of all of these isotopes by coin
cidence methods.
The Coeo sources were prepared by electroplating pile bombarded cobalt
onto platinum discs. Self absorption was shown to be negligible by the agree
ment in counting yields obtained with two sources which differed by a factor
of five in the mass of cobalt per square centimeter. The mass of the most
active source amounted to only a few micrograms per square centimeter.
104

The Cb86 sources were prepared by electrolytic decomposition of an oxalic
acid solution of carrier-free Cb96 activity. On reduction of the oxalic acid96concentration the Cb96 was adsorbed on the cell walls and hence on a platinum
disc at the bottom of the cell.
The Ru10a sources were prepared by electroplating from a Ru tracer
solution by the method described in ORNL 336. The mass of ruthenium in thesamples was of the order of 0.1 micrograms/cmz. By using sources with differentmasses of ruthenium, self absorption was shown to be negligible.
Although the voltage plateaus were slightly different with the different
radiations, the plateaus in all cases extended through 1750 volts. The counting yields at this voltage versus maximum beta energy are given in Table II.Agreement between different sources of the same radiation was within'the counting errors of about 2%. In using these data to determine disintegration ratesof other soft beta emitters, larger and uncertain errors could be expected
because of different energy distributions and because of.errors in" interpolation
between the energies given in the table.
TABLE II
Counting yields of low energy beta emitters
BETA EMITTERS MAXIMUM ENERGY COUNTING TIE
ioe
Ru 30 Kev 53.5%
95Cb 147 Kev 62. IX
Co 310 Kev 68. 8*
105

RADIO-ORGANIC CHEMISTRY
106

SUMMARY
A new procedure for the preparation of formaldehyde-C14 has been developed.Methanol-C14 is converted to methyl-C14 acetate with acetyl chloride, the
ester is chlorinated in the methyl group, and the resulting chloromethyl-C
acetate is hydrolyzed to formaldehyde~C14 in 60$ yields based on methanol-C14.Approximately 17 millicuries of high specific activity formaldehyde-C14 hasbeen prepared by this procedure.
A stock of approximately 300 millicuries of carboxyl-C14 sodium acetatehas been prepared according to the procedure described previously^1'.
A new method for the preparation of acetic acid-2-C 4 has been developed,but has not yet been applied to the production of active material. Methanol-C
is added to sulfur trioxide to give methyl sulfate esters. Treating these
with sodium cyanide at elevated temperatures gives acetonitrile which yields
sodium acetate-2-C14 on alkaline hydrolysis. Yields ranging to 80$ based onmethanol have been obtained with inactive material.
An apparatus has been designed and built for the large-scale production ofsodium formate-C14 following procedures previously described^2'. The averageradiochemical yield of sodium formate-C14 from barium carbonate-C14 was 66_obased on unrecovered carbonate. Using this apparatus, a stock of 129 milli
curies sodium formate-C14 of high specific activity has been accumulated.The synthesis of ring-labeled benzoic acid and its intermediates according
to procedures tentatively put forth earlier^3' has begun employing activematerials.
A total of about 140 millicuries of high-activity methanol-C14 has beenproduced by the lithium aluminum hydride reduction of C1402.
(1) ORNL-229. Progress Report, September, October, November, 1948, pp. 47-8.ORNL-336, Progress Report, December, 1948, January, February, 1949, pp. 64-5.
(2) ORNL-336, Progress Report, December, 1948, January, February, 1949, p. 63.
(3) Ibid., pp. 68-73.
iop
THE SYNTHESIS OF LOW MOLECULAR WEIGHT INTERMEDIATES
CONTAINING C14
1. Formaldehyde-C14. (A. R. Jones and W. J. Skraba). (a) Discussion:
The preparation of this intermediate has been accomplished by an adaptation of
the method of Henry (4) and of Michael (5.) to the vacuum line. According to thisprocedure, methyl acetate is chlorinated at room temperature or below to
chloromethyl acetate. This compound yields formaldehyde on hydrolysis. The
yields average about 60$ of aqueous product contaminated with hydrogen chlorideand acetic acid. The acids areneutralized, and the formaldehyde-water mixture
is distilled off.
In efforts to improve the yields, methyl trichloroacetate, methyl tosy-
late, methyl benzoate, and methyl chlorocarbonate were substituted^for methylacetate in the chlorination and hydrolysis. The yields of formaldehyde were
uniformly poor.
The preparation of hexamethylenetetramine from the hydrolysis solution
was unsatisfactory.
'(b) Experimental: (l) Methyl-C14 Acetate - Methanol-C14 , 10.4 mmoles(2.05 microcuries/mmole) and acetyl chloride, 10.4 mmoles, (b.p., 50p'"C)wereintroduced to a vacuum line, and distilled to the liquid nitrogen-cooled nipple
of a one-liter reaction bulb. The vessel was closed from the manifold, and the
reagents were warmed to 40-50° C for forty-five minutes. The bulk was thencooled to -80° C and evacuated to 10~4 mm to remove a part of the hydrogen
chloride evolved during the reaction.
(2) Chloromethyl-C14 Acetate - Commercial chlorine gas was purified byfreezing with liquid nitrogen and pumping off non-condensible contaminants. A1400-ml aliquot of chlorine at 27° C and 12.9 cm mercury pressure (9.6 mmoles)was added to the product of the above reaction frozen down in liquid nitrogen.(The mercury in the manometer used to determine the chlorine pressure wasprotected from the action of the chlorine by a layer of sulfuric acid.) Thebulb was isolated from the manifold, and the frozen reactants were allowed towarm to room temperature. Disappearance of the chlorine color began at lowtemperatures. The contents of the bulb were recondensed and allowed to return
(4) L. Henry, Ber., 6, 739 (1873).
(5) A. Michael, Am. Chem. J., 1, 418 (1879).
108

to room temperature several, times to insure thorough mixing. When all traces
of color had disappeared, the bulb was cooled to -80,?) C and evacuated to 10*4,mm mercury pressure to remove part of the hydrogen chloride.
(3) Formaldehyde-C1*.- The crude chloromethyl acetate was distilled into
a 24-ml bulb equipped with a 4-mm straight-bore stopcock and containing 3 ml
of distilled water. The spring-loaded stopcock was closed, and the bulb was
immersed in boiling water for thirty minutes. The cooled solution was trans
ferred toa small pear-shaped flask made slightly basic with potassium hydroxide
pellets, and then slightly acidic with acetic acid. To the flask was added
5 ml of commercial formalin solution containing approximately 60 mmoles of
formaldehyde. The mixture was distilled to dryness at normal pressure. The
distillate weighed 9.027 gm.
From a 75 k aliquot weighing 78 mg was obtained 159 mg of the dimedon
derivative of formaldehyde, indicating a 65.5$ yield based on the initial
methanol. The activity of 25,5 mg sample was 0.018 microcurles determined by
dry combustion and ion current measurement on the resulting C'^'Og by means ofa dynamic condenser electrometer. The specific activity of the formaldehydewas 2.07 microcuries/mmoles as compared with 2,05 microcuries/mmole for themethanol. The cause of the discrepancy here is not known at present.
By the above procedures, 17 millicuries of formaldehyde-C'-* of 0.210
millicurles/mmole specific activity has been produced.3. Acetic Acid-i-C~" (D. N. Hess). Approximately 300 millicuries of
acetic acidrl-C14 was prepared according to the procedure previously described.4, Acetic Ac id-2^^. (a) Diseus'sionu Methanol reacts with sulfur tri-
oxide to give mixtures of methyl sulfate and methyl, hydrogen sulfate*.6', whichon treatment with sodium cyanide yield acetonitrile^7*. The acetonitrile may behydrolyzed In the presence of either alkali or acid to acetic acid. Withmethanol-C14, acetic acid-2-Ci4 would be the product. The series of reactionswith Inactive materials has resulted In yields of about eighty per cent based
on methanol.
A similar scheme employing phosphorus pentoxide in place of sulfur tri-oxide was not successful due to the formation of considerable methyl ether,(b) Experimentalr (l) Methyl Sulfate and Methyl Hydrogen. Sulfate - Sulfur trioxide, prepared by heating a mixture of fuming sulfuric acid and phosphorus pentoxide under vacuum, was distilled through two traps containing phos-
(6) Guyot aasd Simon, Campt. rend,, 169, 655 (1919),
(7) Dumas et al, Compt. rend., 25, 473.
109

phorus pentoxide into a small vessel into which was then distilled an equivalent
quantity of methanol (about 10 mmoles). The liquid nitrogen bath was replaced
by one at a temperature of 0° CW. The reaction was allowed to proceed with
stirring (magnetic bar) for thirty minutes. At the end of this time, themixture was frozen with liquid nitrogen and the flask was removed from the line.
A combination condenser and dropping funnel was fitted to the flask; the
apparatus was closed from the air9 and the flask was again immersed in liquid
nitrogen. A two-fold excess of 10-molar sodium cyanide solution was added,
the liquid nitrogen bath was replaced by a 0" C bath, and stirring was begun
when the mixture became fluid. After thirty minutes, the flask was returned
to the vacuum line, frozen, evacuated, and the water and acetonitrile were
distilled to another flask. A nine-fold excess of 10-molar potassium hydroxide
solution was added, and the mixture was refluxed for fifteen hours. The major
part of the water was removed by distillation at atmospheric pressure, and the
last traces were removed by heating under high vacuum. Acetic acid was obtained
by adding 100% phosphoric acid to the dry residue, and distilling the product
to a liquid nitrogen-cooled trap 'under high vacuum. The distillation required
about twelve hours. The acetic acid, obtained inup to eighty per cent yields,
had the following constants: b.p. 115% n^3 1.3708s literature values:; b.p.
116°, n|s 1,3705-5« Formic Acid. (J. G. Burr and H. E. Heller). (a) Discussion; Infor
mation has been obtained on the mechanism of the reaction between carbon dioxide
and lithium borohydrlde to yield formic acid. Complex reactions of an obscure
nature prevent, a complete elucidation of the mechanism. The reaction has been
used in the high-level production of sodium formate-Ci4. The method is superior
to others'^-' in that it does not require the use of elevated temperatures or
pressures.
Methanol-C14 In 13% yields was identified among the products of the tracer
runs but formaldehyde could not be detected. Elevation of the reaction tempera
ture from 0' to 80c C did not increase the yield, but reduced the absorption
of carbon dioxide. At =80c C the reaction did not take place. Diethyl carbitol
as solvent increased the absorption of carbon dioxide, but lowered the yield of
formic acid. The reaction did not take place in tripropylamine solution.
During the reaction, a variable amount of boron was converted to diborane which
(8) The reaction becomes violent at temperatures much above 0 C,
(9) Calvin, He ide Ibe sr ge rf, Reld, Toibert, and Yankwich, '''Isotopic Carbon", John Wiley andSons, Ins., New York (1949), p. 64,
110

appeared in the barium hydroxide traps as boric acid, and a solid precipitated
which, when isolated in an inert atmosphere, contained 0.73 mols of boron per
mol of formate, and which evolved hydrogen when moistened.
The methanol formed was not produced by the action.of lithium borohydride
on formate since lithium formate was not reduced by lithium borohydride alone
or in the presence of methanol. Although sodium trimethoxyborohydride willreduce carbon dioxide to formic acidt10), the corresponding lithium compoundcould not be an intermediate here since a solution of lithium borohydride
containing two mols of methanol per mol of borohydride absorbed carbon dioxide
very poorly and converted it to formate in very poor yield.
The reduction of carbon dioxide to formate with the simultaneous production
of diborane probably occurs by the process represented by equation (l), theproduction of methanol by the competitive process represented by equation (2).This is analogous to the reduction of carbon dioxide to methanol by lithiumaluminum hydride (1:L) . However, the variable ratio of diborane to formate,and the anomalous composition of the solid formed in this reaction make it
evident that complex secondary processes must take place.
(1) LiBH4 t C02 —> LiOOCH + ^B2He
(2) 3LiBH4 t 4C02—• LiB(0CH_ )♦' + 2LiB02
During exploratory and tracer runs, simple apparatus such as flasks,burettes, and stillheads found in any laboratory sufficed to carry out thereactions. However, for high-level work the apparatus shown in Fig. 33 wasdevised so that all operations might be carried out without exposing the activematerial to the external atmosphere.
(b) Experimental^ (l) Tracer Experiments - After dissolving lithium borohydride (12) in ethyl ether, and decanting from the considerable solid residue,the solution was stored in a closed system, and assayed by evaporating, a
sample under water pump vacuum at 100% and measuring the evolved hydrogenfrom dilute acid decomposition of the residue.
(2) Sodium Formate-C1* - In a typical run, carbon dioxide obtained from• \ (13)10 mmoles of barium carbonate (containing 51 microcuries of activity) was
(10) Irving Sheft, M. S. Dissertation, The University of Chicago, March, 1944.
(11) Nystrom, Yanko, and Brown, J. Am. Chem. Soc, 70, 441 (1948).
(12} Lithium borohydride must be handled in a dry box, preferably in an inert atmosphere,as some samples of the solid are spontaneously inflammable in moist air.
(13) Radioactivities were determined by ion current measurements of C02 orvolatile organic vapors using a dynamic condenser electrometer.
Ill

Key to Figure 33
A. Nitrogen tank,
B„ Pressure-reducing valve.
C. Pressure reservoir for actuating burettes.
D. Stopcock with notches filed in the core for fine adjustment of gas flowthrough the system.
E. Flowmeter
F. Mercury-filled pressure release for burette system.
G. CO2 generator.
H.' Trap for water vapor.
I. Three-way stopcock.
J K ..•<.•= J.1K1. pressure-actuated burettes for adding reagents to the reactionsystem without exposing the mixtures to the air.
Lo Reaction vessel,
M. Tip of gas-introduction line.
N". Magnetically operated tungsten wire plunger for clearing M of precipitatedsolids.
Oi, O2. Internal condensers.
P. Three-way stopcock.
Q. Reaction vessel.
R. Pressure manifold for burettes.
S. Outlet manifold for burettes.
Ti 00..T10. Stopcocks for controlling filling and emptying of the burettes.
U. Three-way stopcock connecting outlet mainfold to the air or to vacuum.
V, Three-way stopcock connecting the entire reaction system to the air orto high vacuum.
112
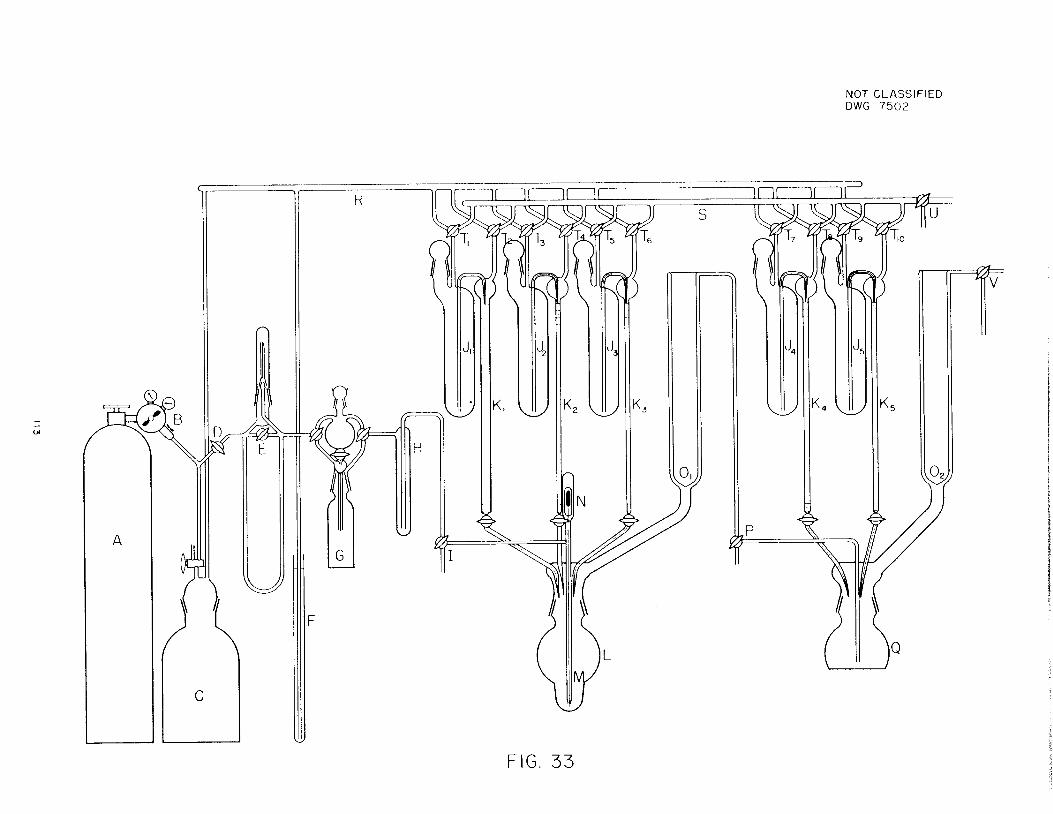
FIG. 33
NOT CLASSIFIED
DWG 7502

dried by passage through a trap at -80" and a second trap filled with Dr.Ierlte,
then swept by nitrogen into 27 ml of 0.037 Mlithium borohydride-ether solution
(10 mmoles) maintained at 0'"' C„ Passage of the exit gases through saturatedbarium hydroxide led to the recovery of 0.2154' g (1,09 mmolesj of Isotopicbarium carbonate containing 5.6 microcuries of activity. During the reaction,
volatilized ether was returned to the solution by a cold finge^ filled with
dry ice (Fig. 33). A heavy powdery precipitate formed in the reaction solution.The reaction solution was hydrolyzed with 6 ml of water, and the ether was
then removed .in a strong stream of nitrogen. This ether contained 2-3% of the
initial radioactivity.
During exploratory runs the aqueous solution obtained at this point wassubjected to qualitative tests. Formic acid was Identified as the S-benzyl-thiuronium salt, and by the mercuric chloride reaction-, methanol was detectedby the Eegrine test^14% formaldehyde was shown absent by the Eegrlne test andby the dlmedon test. The formate content was also determined by boiling theaqueous solution to remove volatile organic substances, and oxidizing withalkaline permanganate --^J „
In the experiments with Isotopic carbon dioxide, the aqueous solutionobtained was acidified with 1.5 ml of 85% phosphoric acid, High vacuum distillation gave a product containing, by titration with NaOH, 63 mmoles .71%) offormic acid; the phosphomolybdate test revealed the presence of a trace ofphosphate, and turmeric proved the absence of borate. The radiochemical yieldwas determined by adding 0.50 g of .inactive sodium formate to an aliquot ofthe neutralized distillate,, and preparing the S-benzyithiouronium salt. Assayof this derivative gave a radiochemical yield for sodium formate-C14 of 6.1mmoles,- .'69% of CO... reacted). The remaining formate solution was distilled todryness m high vacuum at room temperature.
To the distillate, 3,00 ml (74,2 mmolesj of inactive methanol was added,and the solution was very slowly distilled through aWidmer column (an exploratory dead run under identical conditions gave methanol with arefractiveindex at 28" of 1.3247). Two small samples of methanol were withdrawn fromthe'column. Radiochemical assay of these samples proved the presence of 1,1mmoles of methanol-C^ in the distillate (13$ of CQ2) reacted.
(i4) E„ E«g«i«, MI««h«. Acta, 2^ 329 (1937).» ' ., - „„j >j!> w BottteE. Editor, Van Nosiframd Co.,(1S) Newer Methods of Vol «_e t r ic Anny.u, 2nd Edit,., W. Bottge,,
New Yoirk •( 1938) , P . 58.
114
(3) Formation, of Diborane - The alkaline hydrolysis solution from thereaction of 5,0 mmoles of inactive carbon dioxide with 4.9 mmoles of lithium
borohydride was evaporated carefully to dryness (overheating at this pointcaused extensive conversion to oxalate), and the residue was dissolved in water.
The solution was made strongly acid, boiled, and then titrated in the presence
of glycerine for boric acid. A total of 3.3 mmoles of boric acid was found.The formate produced in this reaction was 2.2 mmoles as determined by permanganate titration. The solution in the carbon absorption traps at the endof the reaction train (Fig. 33) was similarly found to contain 1.6 mmolesof boric acid. The amount of boric acid in the bubblers was always less than
the amount of formate produced in the reaction, hut there, was no simple relation
ship. From a dry ice-cooled trap containing anhydrous ethereal trimethylamineinserted in the system before the barium hydroxide bubblers, a solid compoundcould be recovered which gave a white crystalline sublimate melting at 92-95°
(Lit(16) for trimethylamine borine; 94-95°).(4) Apparatus and Procedure for High^-Level Production of Sodium Formate-
C14 -
Ti. ^The -apparatus is shown in Fig. 33 (not to scale) .A magnetic stirring-bar was placed in the lower vessel of G and the re
quired amount of BaCO^ was weighed in. The solid was covered with water, adrop of octyl alcohol was added to prevent foaming during the decomposition,and the vessel was placed in position on the generator. The upper vessel ofGwas filled with 30% HC104 and capped. A dry-ice filled Dewar was placedaround H, and two Ba(0H)2 bubblers filled with 100 ml of half-saturated Ba(0H)2each were connected in series to the external outlet of P. Reservoir C wasfilled with nitrogen from A to provide pressure to actuate the system ofburettes J^ . . . .J6Ke; the stopcocks on Gwere adjusted so that bothchambers of Gwould be washed with gas, and the entire system from G through H,I, L, internal condenser 0,, P, and the Ba(0H)2 bubblers was rinsed withnitrogen for thirty minutes.
The gas flow was reduced to about 10 cc/min, LiBH4-ether reagent wasadded from burette J.K., 0, was filled with dry ice, and the stopcock at thebottom of the upper chamber of Gwas adjusted to give two drops of HC104 perminute to the lower chamber of G. The gas flow through Gwas adjusted to passthrough the lower chamber only, and vessel, V, was immersed in an ice-water
(16) Burg and Schlesinger, J. A*. Chem. Soc. 59. 780 (1937).
115
bath. The C02-generation and subsequent sweeping required about an hour and ahalf for a 10~mmole run. After about the first half hour C02 began to show upin the first Ba(0H)2 bubbler as precipitated BaC03, but none was found in thesecond bubbler until after the addition of a few ml of water from burette J2K2to decompose the reaction mixture in L. From time to time during the reductionand decomposition, it was necessary to clear tip M of precipitated material byagitating plunger N with a small magnet. When the violent reaction resultingfrom addition of water had subsided, the dry-ice remaining in 0r; was removedby a stream of air, the Ba(0H)2 bubblers were disconnected from p and replacedby a hose leading to the main vent of the California hood in which the apparatuswas built, and the ether was evaporated from the mixture by increasing the gasflow through the system to several hundred cc/min„ .
When the ether had evaporated, concentrated HsP04 was added from buretteJ3K3 causing a further violent evolution of gas. When this had subsided, stopcock I was closed to vessel L, L and Q were connected through P; L was frozendown in liquid nitrogen, and stopcock V was opened to the high vacuum system;Q was immersed in liquid nitrogen, and when a good vacuum was obtained, L wasallowed to warm so that distillation of the mixture of water and formic acid
to Q occurred. In the final stages of the distillation, L was warmed verystrongly with a smoky flame to drive over the last traces of acid.
When the distillation was complete, Q was allowed to warm and the systemwas open to the air. Q was momentarily removed and a drop of phenolphthalein
indicator was added. The formic acid was then titrated with 5 N NaOH from
burette J4K«. The slightly basic titration mixture was set aside for com
bination with the products from other runs.
The results obtained with this apparatus are summarized in Table 1. A
total of 11.8962 g of isotopic barium carbonate, containing an estimated 203
millicuries of Cx , was processed as above in five runs. From these runs, the
recovered barium carbonate weighed 1.9469 g (9,84' mmoles, 16.3%), and contained
an estimated 32 millicuries of C i By titration, the total amount of formic
acid produced was 33.4 mmoles (66% based on the reacted carbon dioxide). Theneutralized formate solutions (containing a slight excess of alkali) were com-
bined and vacuum distilled almost to dryness. The residue was taken up in
distilled water, centrifuged, and made up to 100.0 ml. From this solution,
two 100 ^ samples were taken, and each pipetted into a solution of 2.000 g
(29.4- mmoles) of sodium formate in 10 ml of water. The S-benzylthiuronium
116.

RUNBaCOg
DECOMPOSED
( mo 1e s )
C02 REDUCED TO ACID<a) C02 RECOVERED^1*) C02 LOST
mmoles percent mmoles percent mmoles percent
1 9.42<C'd> ... ... ... ... ... ...
2 9.51<d> 4 34 45 7 3, 79 39,9 136 14 4
3 io.oo(d) 5-47 54. 7 3- 64 36-4 0. 89 8.9
4,,(d)
5.94 59.4 3.06 30.6 1.00 10.0
5 .,(«>) 5.72 57.2 1. 79 17.9 2.49 24.9
6 10. 87 4. 18 38.4 1.51 13.9 5. 18 52.3<e>
7 10.00 5.84 58.4 2.87 28.7 1. 29 12.9
8 12.81 7.96 62.2 1.33 10.4 3.52 27.4
9 15.82 9.55 60.3 2.36 14.9 3. 91 24.8
10 10.00 5.72 57.2 1.77 17. 7 2.51 25- 1
(a) Determined by titration with standard NaOH solution.
(b) Determined by weighing the BaCOg precipitated in the after bubblers.
(C) Bubble tip M (Fig. 33) plugged during this run. As a result of this, the plunger N was added to the apparatus toallow clearing of the plugged tip without opening the apparatus.
(d) These runs were testing experiments for the apparatus, and were carried out with inactive BaCOg.
(e) The BaCOg used in this run foamed badly on contact with the HCIO4, and much CO_ was lost when the apparatus wasdismantled for cleaning.
03c
asBT
o
o.
o3
T
re
a.cn
o
3
O
8
o
a
a
I
salts were then prepared and recrystallized from ethanol. Duplicate assays ofeach sample of the salts showed an average specific activity of 0.0206 micron-
curies per mg. This corresponds to a total yield of 129 ± 2 millicuries of
sodium formate (75% based on reacted carbon dioxide activity). Crystallizationof the derivatives was socarried out as to produce a considerable fractionation
should more than one acidic species be presents however, assay of the crudederivative led to the same result, within experimental error,,, as assay of the
recrystallized salt. If radioactive species other than formate were present
in the solution, direct assay of the solution should give a higher value than
assay through a formate derivative; both types of assay, however, gave the samevalue,within experimental error.
5. Production of C~^Hs0H (R. G. Mansfield). A total of 139,9' milli
curies of methanol was produced by LiAlH4 reduction of C02.
THE SYNTHESIS OF HIGH MOLECULAR WEIGHT INTERMEDIATES CONTAINING
C14 RING-LABELED BENZOIC ACID AND INTERMEDIATES
C, J. Collins
Following the procedure outlined previously^'^ , the snythesis of vitaminK labeled in the 8-positi.on with C'""" has been carried through to 2-methyl-naphthalene-8-C*"* „ The carbonation of y-(p-tolyl)-propylmagnesium bromide hasbeen effected using 30 mmoles of carbon dioxide containing 1.6,2 millicuries of
C^Og" The efficiency of this reaction was 85.5% based on carbon dioxide un-recovered. The product consisted of 2.62 grams of y-(p-tolyl)-butyric acid
containing 7,85, millicuries of C'4 . A 1,34 gram (4,0 millicuries) quantity ofthis acid was converted to 2-methyInaphthalene-C''""'„ The product weighed 0,57
grams, representing a 54% chemical yield.
The apparatus for carbonation of the Grignard reagent shown in Fig. 34' is
a modification of the one shown previously^"'.
(17) ORNL 336» Progress Report, Dec, 1948, January, February,, 1949, pp, 68-73.
(18) Ibid., Fig, 2, p „ 71.
118

CO
FIG. 34
GRIGNARD CARBONATION APPARATUS
N01 CLASSIFIEDDWG. 75 51
CHEMISTRY OF
SEPARATIONS PROCESSES
120

'.I.. VOLATILITY STUDIES
. A. Agron, E. G. Bohlmann
Equipment is being set up to study the properties of a number of metallic
fluorides. It is anticipated that a number of different structural materials
will be tried for the construction of laboratory-scale vacuum lines for this
study.
II.. SOLVENT-EXTRACTION PRINCIPLES AND APPLICATIONS
STUDY OF THORIUM HYDROLYSIS BY TTA-BENZENE EXTRACTION
¥/. C. Waggener, R, ¥!. Stoughton
The hydrogen ion dependence of the expression (R)b [(HT)/(H+)]4 at a constant ionic strength of 0.5 is being studied in the pH range 0,3 - 3,7 using
Th234 tracer in the presence of about 10"7 Mnatural thorium, [(R)b representsthe disttrihut ion ratio of thorium between aqueous and benzene phases, and
(HT)/(H+) represents the ratio of activities of TTA and hydrogen ion in benzeneand aqueous phases respectively.] This expression should remain constant with
increasing pH until the fraction of Th(lV) hydrolyzed becomes appreciable.a
It was desirable for counting the phases to maintain the ratio (R)b nearunitys necessitating dilutions of the benzene phase from 10-1 to 10~4 MTTAwith decreasing acidities of aqueous phase. Thorium was introduced initially
into 0.25 M benzene-TTA, and aliquots taken for dilutions over the range.
Preliminary results indicated that the expression (R)b [(HT)/(H+)]4 begins to increase rapidly between a pH of 1 and 2. This agrees with recent
work of E. Zebroski and W. H, AlterW using a similar TTA extraction method,but indicates a much larger value for the first hydrolysis constant than the
value of 2.5 x 10"4 obtained by John Casper(2) by method of direct titration.
(1) E. Zebroski, W. H. Alter, KAPL-134,3; 182,10 (1949).
(2) John Casper, Dissertation, Johns Hopkins (1941).'
121

However, results by the extraction method appear questionable in view of
a tendency observed for thorium activity in benzene TTA to adsorb or precipi
tate from the solution with increasing dilution.
Disparity between calculated and observed specific activity for dilutionsof 0=25 Mbenzene TTA ranged from &f-> at 100-fold (2,5 * 10"3 M) to 13$ to 94$at 2000-fold dilution (1.25 * 10"4 M). The activity absorbed was partiallyelutable with benzene (27% in a single experiment), and entirely so with concentrated nitric acid. Material balances calculated after elution with acid
were good*
Studies still in progress indicate that this disparity increases with (l)increasing time, (2) increasing relative surface area, and (3) decreasing TTAconcentration, but is essentially independent of the concentration of natural
thorium between 10~a M and 10"9 M.Reducing the concentration of water from its solubility in benzene (about
0.03 M) to 10~e Mhad no recognizable effect.It does not seem likely that ThT4 is the adsorbing species. Present work
is aimed to establish whether adsorption of thorium is due to hydrolysis ofThT4 or its reaction with an unknown impurity present either in the TTA orbenzene.
SEPARATION OF Hf AND Zr
J P. MzBride, R, W. St ought, r.-n
1. Introduction. The extraction of Hf and Zr with a benzene-TTA (thenoyltrifluoroacetone) solution from an aqueous acidic solution containing a non-complexing anion may be represented by an equation of the form
M(0H)4+J!n to mHTB < »MT^+nH; + (4-n) H.0
where HT represents TTA and the subscripts indicate the phases in which thevarious species appear (i.e., A-aqueous; B-benzene). Corresponding to theabove equation the following equilibrium constant is formulated;
•+ \ n
K =(MT )B (H+)
(I)[M(0H)-4„J (HT).
122

where (H+) and (HT) are the hydrogen ion and TTA activities and where [M(0H)° ]represents the activity, of the aqueous metallic species (assuming a s.ingle
species), n its charge, and m the number of T anions associated with each M
species in the benzene phase. When the activity coefficients of MT and
M(0H)4on remain constant the expression becomes,;
(2),(HT)B
where DR,^.^ refers to the distribution ratio of the metal ion, (organic
over aqueous). If more than one species were present in either phase, the
above equation would? .of course, have to be modified.
Data have been reported which indicate that the extraction of Zr from 2 M
HCI04 may be represented by the equation
M(0H;A >' 4 HTB -. MT4B + 3H^ -r H20l3^
Work at this laboratory indicates that the same equation also holds to a close
approximation for the extraction of Hf from 0,5 M HN03, • '
A recent report from Knolls laboratory postulates a third power acid de
pendence but a second power TTA dependence for Hf extraction from dilute HN0S
(up to 1 M) which increases to approximately fourth power as the acid.ity of
the aqueous phase increases,1^-1The experiments reported below have been done to determine the acid and
TTA dependence for the extraction of Hf from HCl solutions,
2. Experimental a The TTA solutions were prepared with thiophene-free
benzene using a TTA sample of better than 99,5% purity, obtained from M.
Calvin of the University of California,
A stock solution of Hf tracer in 10 M HCl was prepared by dissolving 47.8
mg of pile-irradiated hafnium, as hafnium oxychloride. in concentrated HCl and
diluting to a final volume of 25 ml.
The experiments on acid dependence were performed by equilibrating ali
quot s of a 0.0200 M TTA solution containing Hf trace-" with equal volumes of
acid solutions prepared by diluting concentrated acid to the required strength.
In the first series NaCl was added to give a constant ionic strength of 4.0S
while the second series was run at varying ionic strength, without, adding
NaCl. The 0.0200 M TTA solution was made by equilibrating a 0,0205 M TTA so
lution withanequal volume of 0,5 M HCl containing 50 microliters of the stock
(3) R. E. Connict, W. H. McVey, UCRL 101, Mairch 1948.
(4) J. P. McBiide, ORNL 3<)3.
(5) B. E. Dealing, J. F. Fiagg, D, C. MeCairty, KAPL-i80 =
123

Hf tracer solution. On the basis of DR{B/a> of 40 for TTA the resulting TTA-benzene solution should have been 0.0200 M.
The experiments on TTA dependence for the extraction of Hf from 0.5, 1.0,
and 3.0 M HCl were run using aliquots of a stock 0.015 M TTA benzene solution
containing Hf tracer, diluting to the required TTA molarity with dilute TTA-
benzene solutions and equilibrating with equal volumes of acid solutions of
the required strength. The 0.015 M TTA solution containing tracer was pre
pared as above by equilibrating 12.5 ml of a 0.01,!33# M TTA-benzene solution
with an equal volume of 0.5 M HCl containing 250 microliters of the stock
tracer solution. The solution was diluted with benzene or a 0.0825 M TTA-
benzene solution to give the required TTA molarities.
All equilibrations were made at room temperature, 250-31° C, and for
approximately 2-g- hours. Hf analyses were made by mounting samples of each
phase on glass plates in the usual manner and counting without inserting an
absorber between the plate and the G-M tube. The ratio of the activity in the
benzene phase to that in the aqueous is, of course, equal to the distribution
ratio. Where the presence of NaCl would interfere with the Hf counting in the
aqueous phase an aliquot of the phase was extracted with an equal volume of
benzene containing a large excess of TTA over that estimated for complete ex
traction and an aliquot of the resulting benzene phase counted.
3. Dependence of Hf Extraction on HCl Molarity at Constant TTA Concen
tration. As indicated in the introduction the distribution ratios (benzene
over aqueous) for the extraction of a metal ion may be represented by
K(HT)BnDR,„,^ •= B (-)l(B/A) - . +.„
assuming a single species in each phase and that the activity coefficients re
main constant; m. and n have the aforementioned significance. Taking the log
of both sides one obtains
log DR(B/A) » log K+m log (HT)B -n log (H+).
Hence if one obtains the DR,i... at constant TTA concentration as a function(B/ A)
of acid concentration a plot of log ER(B/A) vs log (H+) should give a straightline with a slope n equal to the charge on the aqueous metallic species.
Figure 35 illustrates the data obtained on equilibrating aliquots of a
124

10.or
i.o-
<
CD
rr
o
o.i
0.01
0.001-0.4 -0.2
i^.s^Wj&^Ms^^wss**^!^^^^ '
\'QT G_m5u'ZUQ. Toll
FIG. 35
DEPENDENCE OF Hf EXTRACTIONON HCl MOLARITY AT CONSTANT
IONIC STRENGTH
SLOPE = 4.0-
\\
\1
0.0 0.2LOG HCl
0.4 0.6 08
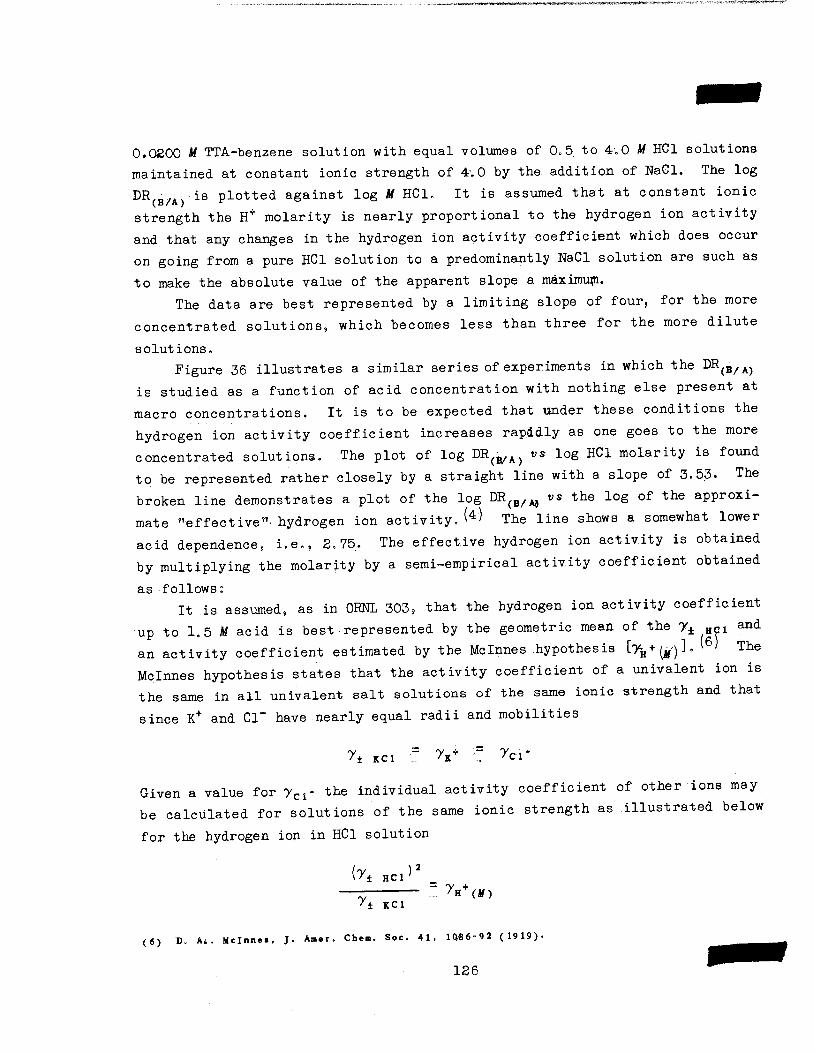
0.0800 M TTA-benzene solution with equal volumes of 0.5. to 4.0 MHCl solutions
maintained at constant ionic strength of 4.0 by the addition of NaCl. The log
DR •,.. is plotted against log MHCl. It is assumed that at constant ionic(B/A )
strength the H+ molarity is nearly proportional to the hydrogen ion activityand that any changes in the hydrogen ion activity coefficient which does occuron going from a pure HCl solution to a predominantly NaCl solution are such asto make the absolute value of the apparent slope a maximufli.
The data are best represented by a limiting slope of four, for the moreconcentrated solutions, which becomes less than three for the more dilute
solutions.
Figure 36 illustrates a similar series of experiments in which the DR(B/A)is studied as a function of acid concentration with nothing else present at
macro concentrations. It is to be expected that under these conditions the
hydrogen ion activity coefficient increases rapddly as one goes to the moreconcentrated solutions. The plot of log DR(B/A) vs log HCl molarity is foundto be represented rather closely by a straight line with a slope of 3.53. Thebroken line demonstrates a plot of the log DR(B/A? vs the log of the approximate "effective"- hydrogen ion activity. (4') The line shows a somewhat loweracid dependence, i.e., 2,75. The effective hydrogen ion activity is obtainedby multiplying the molarity by a semi-empirical activity coefficient obtainedas follows:
It is assumed, as in ORNL 303, that the hydrogen ion activity coefficientup to 1.5 Macid is best represented by the geometric mean of the ?± hci andan activity coefficient estimated by the Mclnnes hypothesis [7fc+(M)T TneMclnnes hypothesis states that the activity coefficient of a univalent ion isthe same in all univalent salt solutions of the same ionic strength and that
since K+ and CI" have nearly equal radii and mobilities
y± kci = 7** = ?ci*
Given a value for ycl- the individual activity coefficient of other ions maybe calculated for solutions of the same ionic strength as illustrated belowfor the hydrogen ion in HCl solution
(?± HCl'— '•- 7H+(tf)
y± kci
(6) D. A*. Mclnnei, J. Amer. Chem. Soc. 41, 10*6-92 (1919).
126
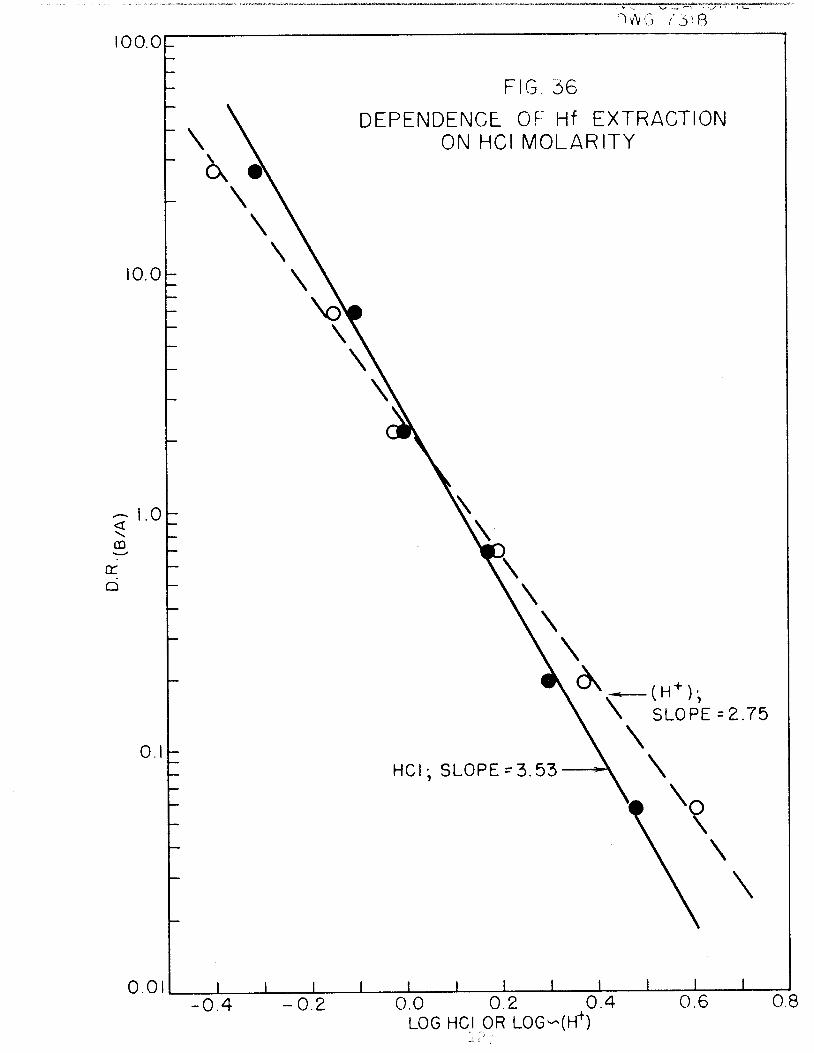
loo.or
10.0
<
CD
a:
d
1.0-
0.1
0.0 J L
0.4 -0.2
^vVG. Y31S
FIG. 36
DEPENDENCE OF Hf EXTRACTIONON HCl MOLARITY
\ SLOPE =2.T5
HCl: SLOPE-3.53
0.0 0.2 0.4LOG HCl OR LOG-tH4)
^\
\
J L0.6 0.8
It is here assumed that the true y. ^ may thenbe approximated by the expression
7 H* '.. ^±HC1 ^H-Wjf)
Given y ., a molar activity coefficient fc„* may be calculated fromH
fc Ja - my^iuH"
where m and M are the molality and corresponding molarity.
In the case of Hf extraction from HN0a., the hydrogen ion activity coef
ficients seemed to be well approximated by such calculations up to 1,5 M HNOa.
For the more concentrated solutions it was possible to make an empirical
correction for changes in the activity coefficients of all aqueous species in
volved in the TTA extraction in terms of an "effective"- hydrogen ion activity
coefficient (fc„+'). Since the activity coefficients calculated for the HCl
solution were nearly the same as those calculated for the HN0S solutions it
was felt that theeffective hydrogen ion activity coefficients in the extraction
of Hf from the more concentrated HCl solutions could be best approximated by
the use of the "effective" activity coefficients- obtained in ORNL 303 and
given in the last column of Table I,
4. Dependence of Hf Extraction on TTA Activity. Figure 37 illustrates
the data obtained for Hf extractions from 0,5 1.0 and 3.0 1 HCl as a function
of TTA concentration. Log DR,,B/A; is plotted against log TTA activity. TheTTA activities were obtained by the use of the activity coefficients of King
and Reas ^ after correcting the TTA concentration for solubility in the
aqueous phase, assuming a distribution ratio ;benzene o--er aqueous) of 40.The data for all acid concentrations show a slope of 3 at the higher TTA
concentrations. At the lower TTA concentration the TTA dependence at 0.5 and
1.0 MHCl seems to be between 1 and 2. The data for the 3 MHCl solutions do
not go low enough in TTA to show the lower TTA dependence.
The dotted line in Fig. 37 illustrate the data obtained for 0.5, 1.0,
and 3.0 MHN03 over the same range of TTA concentrat ions and reported in ORNL-303.- The distribution data are quite similar at the higher TTA concentrations
with a small difference in TTA dependence, i.e. 3,7 m extraction from media
HN0s compared with 3.0 in HCl media. However, the hydrochloric acid systemshows a.striking increase in distribution ratios at the lower concentrations.
XT) E. L. King, W. H. Real, BC-69.
128

en
d
1000
00
FIG. 37
DEPENDENCE OF Hf EXTRACTIONFROM 0.5,1.0 AND 3.0 M HCl
ON TTA ACTIVITY
I 0.5 M HCl
n 1.0 M HClm 3.0 M HC
LOG (TTA)

TABLE I
Effective hydrogen ion activity coefficients for TTA-Hf-HCl extractions
HNOg HCl
u ^±HNOs^H+'MOLARITY fcH+ ^±HC1?H+)* MOLARITY fcH+ «H+
0.5
1.0
2.0
3.0
4.0
0-814
0- 933
It 240
1.765
2.67
0.492
0.970
1.876
2.749
3.564
0.827
0 962
1,322
1.926
2.997
0.812
0-930
1.336
1.990
3.07
0.494
0.981
1.924
2.829
3.706
0.824
0.951
1.389
2.110
3.310
0.824
0.951
(1.206)
(1.365)
(1.460)
130

5. Discussion. Examination of the Hf distribution data obtained with
the HCl and HN03 system leads one to conclude that,
(1) the extracted species are not identical in the two cases;(2) more than one species, one or more of which may contain Cl9 are
extracted from HCl solution;
(3) the acid dependence over the range, 0-5 to 3.5 Ml: is close to 3 inboth cases, and
(4) the TTA dependence at higher TTA concentrations is 3,0 in the case
of HCl and 3.7 in the ease of HN0a.
Efforts .to obtain direct chemical evidence for an extractable CI complex
are as yet inconclusive. Trace Clss has been obtained for this purpose. It
can be stated that there is no detectable extraction of Hf or CI into benzene
inthe absence of TTA. In two experiments in which dead macro Hf was extracted
with TTA from 0,77 MHCl containing tracer Clsa, a chlorine concentration of
10" M was detected in the organic phase. The approximate Hf concentration
found in a similar run in which tracer Hf but no Cls8 was used was about 10~s
Mo Work will be continued to establish definitely the existence of a chloride
extractable species and to determine the formula.
During the course of the chloride work several experiments were run at
the lower TTA concentrations in which stock tracer was added directly to 0.73
JLHCl and extracted. The TTA dependence over the region 0.004' to 0.015 M was
found to be 2„26s but the distribution ratios were lower by a factor of 10,
indicating that much of the Hf in the 10 M HCl stock solution was not in the
monomerie state. As in the case of the HN0@ systems9 it is felt that the
distribution data obtained when the tracer is initially in the benzene phase
more correctly represent the true distribution data for monomerie Hf.
IIIo I0N°EXCHANGE
SEPARATION OF ANIONS OF THE FIFTH, SIXTH AND SEVENTH GROUPS
R, W. Aiteberry and G. J?» Boyd
The recent availability of high capacity, fast-, strong base synthetic
organic exchangers has enormously enlarged the potentialities of the ion ex
change separations technique9 and, in view of this and other developments, it
131

may be asserted that it is now possible to separate every element of the periodictable giving an ion in solution from every other such element. The work duringthe past quarter has been devoted to a systematic demonstration of these possibilities for the anions formed by the fifth, sixth and seventh groups of theperiodic table. An account of a preliminary study of the separation of thehalides, Cl~, Br", and I" can be given.
Firstly, measurements were made of the equilibrium distributions of these
halide ions in NaOH solutions of varying concentrations in order to determine
the extent of the differences of their "exchange potentials". Three new com
mercially procurable anion exchangers, Amberlite IRA-400(8) and Dowex A-1 andA-2 ^y' were employed. The exchanging groups in these materials are reported tobe quaternary amine groups and this has been borne out by pH titrations made on
the "OH"- or.hydroxyl forms which show them to act like strong bases. A com
parison of the selectivity of each of these exchangers, using the hydroxide-
chloride equilibrium distribution measurements showed the IRA-400 and A-1 to
be quite similar, whereas the A-2 showed anappreciably lower affinity for CI".
A comparison of the "exchange potentials"- of CI", Br" and I" in NaOH solutions
with IRA-400 and in Na2C03 solutions with A-1 has revealed the sequence to be
I" > Br" > Cl"„ The potential of I" ion was quite high as illustrated by Kd
values of 980 and 460 in 1 JV.'NaOU and 1 N Na2C03, respectively.The ratios of the Kd values in 1 # TJa2C03 for Dowex A~l were: CI" •: Br" :
I" = 22 : 68 : 460, or, 1 : 3.1 : 20.9. Accordingly, the chromatographic
separation of these halides should be achievable readily using a 1 N Na2C03
elutriant. Two ion-exchange columns, each approximately 1 cm2 x 10 cm of 200-
300 mesh IRA-400 and A-1, respectively, were set up, and break-through curves
for the uptake of 37 m CI38 from 1 MNa2C03 were measured. The concentration
history of chlorine activity issuing from the column (i.e., C/C0 against time
of flow or volume) gave a typical "S" shape curve, although there was some
asymmetry about the mid-point. An estimate of the number of theoretical
plates using the formula^:
f J, "\ 2mid.
w
Fc/c = 0-5.
FC/t = 0.5 - Fc/c- .078 J
(8) Resinous Products Division, Rohm and Haas Company, Philadelphia, Pa.
(9) Dow Chemical Company, Midland, Mich.
132

gave 250 for the IRA-400 column and 230 for the A-1 column. A value of K of15 computed from the number of "free volumes"- at the mid-point'of the breakthrough curve agreed satisfactorily with the value of 18 observed in shakingexperiments. Next, a 1 cm2 x 15.5 Cm 170/200 mesh Dowex A-1 bed was preparedin the carbonate form by washing with 6 1 of 1 MNa2C03 and 3 I of distilledH20. The top two cm of exchanger was removed from this bed,, equilibrated witha tracer mixture containing 37 m CI88, 34 h Br83 and 8 d Ii3\ and thenplaced back on top of the bed. The elution was conducted using 1 MNa'„ CO. . Areasonably good chromatographic separation of the Cl~v Br" and I~ was obtained,the peaks coming out at 12.3, 45.2 and 567 "free column volumes", respectively-,with a 100-fold decrease in each activity between successive peaks and troughs.Finally, a separation of CI" and Br" was conducted by means of a frontalanalysis. Here, a mixture of 38 mCl38 and 34' h Br8S in 1 MNaflC0, was pouredcontinuously through the anion exchanger. The step-wise character of the concentration or activity history of the effluent indicated a good separation.
IV-. FISSION PRODUCT SEPARATIONS
RaLa PROCESS
FF, //. 'Baldwin^ C. £. Higgins
As a result of renewed interest in the RaLa process, research has been
initiated in the Technical and Chemistry Divisions, which is directed toward
two objectives, (1) improvement in the quality and yield of the product fromthe existing process, and (2/ a longer range development of a more efficientprocess which will consistently give a quantitative yield of satisfactory product in a safer manner than is now possible- Current research in the ChemistryDivision is concerned with elucidation of details of the chemical steps of thepresent process. This knowledge is considered to be essential for the proposed
5.-10 fold increase in scale of the process. Although much of the chemistry ofthis process has been summarized in MonN-330. many phases of the process werenot studied in the relatively brief period in which the process was developed.
133

1. Summary. The distribution of fission products in the lead sulfate
carrying out carbonate metathesis steps of the RaLa process was investigated
in laboratory experiments. Relatively small amounts of activity (0.03% of
gross beta and gross gamma) were observed in the off gases. At the completion
of the metathesis step the product was contaminated with relatively large
amounts of the original Sr beta activity (73% and 39% in two experiments) and
total rare earth activity (41% and 26%). After separation of the activities
on an ion-exchange column, recognizable quantities of Y, Nd, Pr and Ce were de^-
tected.
A change in the order of the purification steps, from two nitrate and two
chloride precipitations to one nitrate, two chloride and one nitrate preci
pitations was shown tobe operable and to give good separation from contaminat
ing Fe, Ni, Cr and Pb„
2. Fission Products Carried through Sulfate Precipitation and CarbonateMetathesis. Concern over the handling of large quantities of radioactive
uranium slugs after a short cooling time (irradiated uranium to supply 10,000
to 20,000 curies of barium after cooling for less than one day) lead to inquiry into the identity of the fission products which would accompany the pro
duct through the sulfate precipitation and the metathesis steps. Two laboratory
experiments were made to study the distribution of fission products.
(a) Experimental Conditions,, The sulfate precipitation was made in such amanner that the slurry containing the lead sulfate was of the following com
position; 0.93 MUNH plus sufficient "dissolver solution"- from Bldg. 706-D toprovide tracer fission product activities, 0.5. MHN03, 3.4 ME^SO^ and 0.3 gPb(ll)/1 as nitrate. The solution, containing all substances except H2S04,was heated to 90° C after which the necessary volume of 18 M. HjjSO^was added
dropwise over a 30 minute period. Heating was continued at 90° C for one hour;then the slurry was allowed to cool and settle. The cake was first washed with3MILjSOv [150 ml/g Pb(ll)], then four times with distilled water [15.0 ml/gPb(ll)].
The sulfate cake was converted to the carbonate by heating at 90° C for15 min. with 4MK2C03 [24 ml/g Pb(ll) used in the sulfate precipitation], diluting with distilled water to 0.5 MK2 C03 , heating for 30 minutes longer,cooling, settling and decanting the supernatant. The metathesis step was repeated and the cake was dissolved in 0.5. MHN03 and diluted to a convenientvolume for analysis,
134

Test Run "A" was made on a 50 ml scale during the sulfate precipitation
using as tracer on ml of "dissolver solution" IMA from 706-D, Run 30- During
the sulfate precipitation the gases above the vessel were sucked through 10 ml
of 1 : 1 mixture of ethanol and water which was 2 M in NaOH. This solution
will be referred to as the "off gases".
Test Run "B" was made on a one liter scale containing one ml of dissolver
solution which was obtained from a later dissolving. The only departure from
the general conditions was the use of aerosol (1 g/1) in the first water wash
of the sulfate cake.
Radiochemical analyses of solutions from Runs "A" and "B" are summarized
in Table II. The product from Run "B" was examined further, employing ion-ex
change to fractionate the contaminating fission product activities.
The solution (50 ml at pH 1) was passed through an IR-100 resin packed
column (70 mm high 12 mm i.d.) to absorb the activity. The bed was then washedwith 0.1 MHCl. The activity passing through the column was labeled ^notabsorbed" and when examined radiochemically six weeks later was found to con
tain Ba-La, and Sr-Y (Table III).
The resin was washed with 3 MHCl; the aluate was evaporated just to dry
ness, taken up in several 0.1 ml1 portions of 0-1 MHCl, transferred to thetop of a resin column (6 mm i.d. 110 cm, packed with 200-300 mesh Dowex 5.0)and washed with citric acid buffered as shown in Table III.
The elements Y, Nd, Pr and Ce were separated from the column. Judging
from these results (table JOSty it is to be expected that the Ce wirtihldng-livedisotopes might be an undesirable contaminant of the product (L. B. Emlet rto C.N. Rucker, April 19, 1949 "Report on the Los Alamos RaLa Meeting April 13 and
14> 1949").The inability of the column to separate La, Ba and Sr may be associated
with the presence of weighable quantities of Pb in the solution which was passed
through the column.
3. Purification of the Electrolyzed Product. It was requested by theOperations Division that modifications in the purification steps be tested ona laboratory scale before inclusion in a regular plant run. Concentration ofthe product from electrolysis by the precipitation of BaC03 was tested as areplacement for the evaporation step currently employed. The order of the product precipitation steps was changed to permit the final evaporation fandtshippingof barium nitrate (the new order of treatment included one nitrate, two chloride,
135
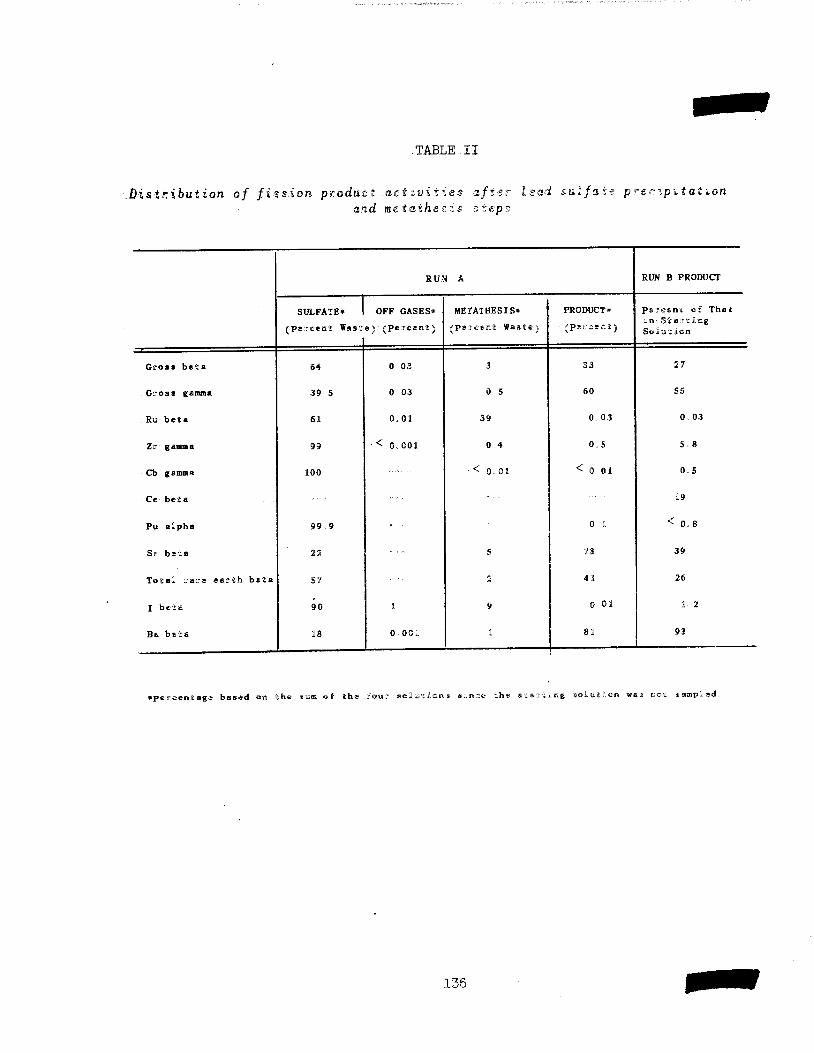
TABLE II
Distribution of fission product .activities after lead sulfate precipitationand me tathesis steps
Gross beta
Gross gamma
Ru beta
Zr gamma
Cb gamma
Ce beta
Pu alpha
Sr beta
Total rare earth beta
I beta
Ba beta
RUN A
SULFATE* I OFF GASES*
(Percent Waste) (Percent)
64
39 5
61
99
100
99 9
22
57
90
18
0 03
0 03
0 01
^ 0.. 001
1
0 •001
METATHESIS*
(pes-cent Waste)
3
0 S
39
0 4
< 0.01
PRODUCT*
(percent y
33
60
0 03
0,5
< 0.01
0 1
73
41
0 01
81
RUN B PRODUCT
percent of That
in- Start asug
Solutson
27
55
0. 03
5.8
0-5
19
< 0.8
39
26
1. 2
93
•percentage based on the sum of the four solutions since the starting sol«tion was not sampled
136-
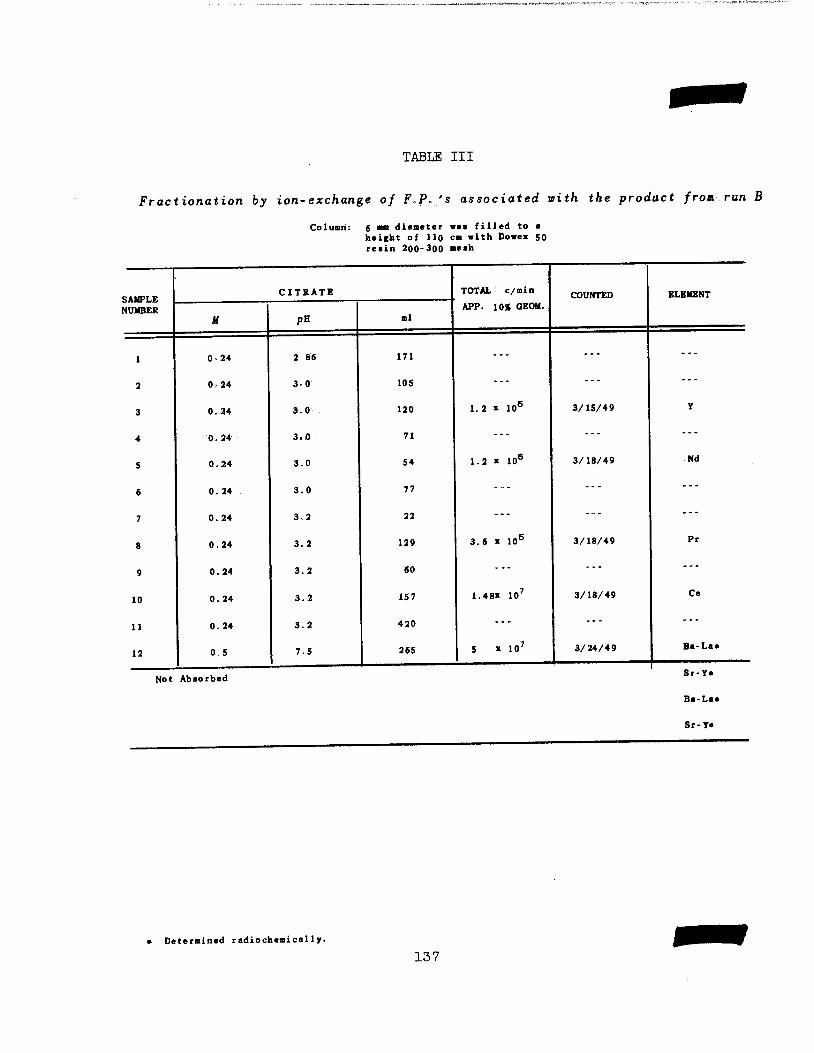
TABLE III
Fractionation by ion-exchange of F.P. 's associated with the product from run B
Column: 6 mm diameter was filled to aheight of llo cm with Dowex SOresin 200-300 mesh
SAMPLECITRATE TOTAL: c/min
APP. 10* OEOM.COUNTED ELEMENT
NUMBER
M pH ml
1 0-24 2 86 171... ...
...
2 024 3.0 105... ...
...
3 0.24 3.0 120 1.2 x 10⁶ 3/15/49 y
4 0.24 3.0 71... ...
...
5 0.24 3.0 54 1.2 x 10⁶ 3/18/49 Nd
6 0.24 3.0 77...
... ...
7 0.24 3.2 22... ... ...
8 0.24 3.2 129 3.6 x 10⁶ 3/18/49 Pr
9 0.24 3.2 60 ...... ...
10 0.24 3.2 157 1.48X 10⁷ 3/18/49 Ce
11 0.24 3.2 420...
......
12 0.5 7.5 265 5 x 10⁷ 3/24/49 Ba-La*
r-Y»
Ba-La*
Sr-Y*
Not Absorbed
Determined radiochemically.
137

and finally one nitrate precipitation instead of two nitrate and two chloride
precipitations which have long been used in the 706-D operation*)
(a) Experimental'Conditionso To one liter of solution containing 300 mg
Ba(H) (plus- tracer), 100 mg Pb(ll), 100 mg Fe(lII), 100 mg Cr(ll) and 100 mg
Ni (II) was added 145 ml of 4.8 M K2C0a- The mixture was agitated at room
temperature and then filtered through a sintered glass funnel 90 mm in diameter
and with a medium porosity„ This particular funnel came from the supply which
is used in the 706-D operation.
The precipitate was gelatinous and brown in color. Filtration required
over 90 minutes. This was considered to be slower than desired for production.
The precipitate was dissolved from the funnel with 500 ml of 1 M HN0s and
barium nitrate was precipitated by the addition of 2500 ml of 23 MHN03 . After
standing for three hours at room temperature the product was separated on the
same funnel which had been used before. The precipitate,, dissolved in 50 ml
distilled water, was treated with 500 ml of an HCi-ether mixture (five volumes
of 12 M HC1 and one volume diethyl ether),, agitated fo~ 5 minutes and filtered
on the same funnel. A second precipitation of barram chloride was made .in the
same manner as the first. The second barium nitrate precipitation was made by
dissolving the barium chloride .in 50 ml distilled water and adding 250 ml of
23 MHN0s, allowing to stand three hours and filtering as before. The pre
cipitate was dissolved in 50 ml distilled water for convenience in analysis.
(b; Discussion-of Results, The analytical summary (Table IV) indicates a.
relatively high loss of barium in the carbonate waste and in the second
chloride waste. Because of the slow rate of filtration and loss of product
the carbonate precipitation step seems less desirable than concentration by
evaporation at this time. No explanation is presently available for the higher
loss of product in the second chloride waste solution.
Decontamination from the inactive elements Fe, Cr<; Ni and Pb was sufficient
to meet specifications. No indication was observed that the processes would
not work well in the order named and has subsequently been used successfully in
the plant.
SEPARATION OF FISSION PRODUCT RAREfEfcRTflS
C„ E, Higgins and W, B„ Baldwin
i„ Introduction and Summary* The more efficient separation of fission
product activities attained by operating ion-exchange columns at elevated
138

TABLE IV
Purification of the product by carbonate,nitrate and chloride precipitation
RADIOCHEMICAL
SOLUTION Ba (Percent) Fe (mg) Ni (mg) Cr (mg) pb (mg)
Starting solution 100 100 100 100 100
Carbonate Waste 12-5
First Nitrate Waste 0-7
First Chloride Waste 4-3
Second Chloride
Waste10-7
Second Nitrate Waste 0-3
Nitrate Product 66 6 0 8 Not detectable Not detectable 1-85
Material Balance 95-1
139

temperatures has been repeatedly demonstrated in the laboratory. However,there is reason to believe that the remote operation of columns (which would
be required for the separation of very high levels of fission activities) attemperatures near the boiling point of water would be difficult. For example,troubles in operation resulting from bubbles formed in the bed by radiationdecomposition of solutions have been experienced in the laboratory. Therefore, ion-exchange characteristics at temperatures between 25J and 100° C havebeen investigated. Distribution data have been obtained for Eu and Y betweenresin and citrate buffer solution at 75° C which are slightly better than those
obtained at 5.0° C.Because the specific separation of Eu and Sm from fission product mixtures
is hampered by the presence of Ys methods are being sought for the separationof Y, Eu and Sm as rapidly as possible. A rapid separation is desired to permit investigation of the short-lived Eu and Sm radioisotopes. Tests have beenmade which show that a preliminary separation of Eu and Y prior to separationby ion-exchange can be effected by a BaS04 precipitation from a solution ofMgSO "7^0. The Eu;Y ratio is improved by a factor of 10 for Eu(lll) and 13for Eu(ll).
2. Distribution Data. Distribution coefficients between unscreenedDowex 50 resin and 0.238 Mcitrate at a temperature of 75; C were obtained forEu and Y and are tabulated in Tables V and VI with a plot in Fig. 38. Thecurves essentially parallel those obtained at 50"' C with KD being greater at75; Cthan at 50° C for any given pH. The curves are somewhat more divergentat 75c C than at 50c C at the low and middle pH's but results are no better atthe higher pHs s.
3. Preliminary Separation by BaS04 Precipitation, From the literatureit was found that McCoy [j.A.C.S. 58 2279 (1936,1 had separated Eu from otherrare earths by reducing to Eu(ll) with zinc dust and precipitating with BaS04by adding BaCl2 to the hot MgS04 solution containing the Eu(Il) and rareearths, converting sulfates to chlorides and further purifying by repeatedpassage through a Jones reductor and precipitation of the sulfate.
It was hoped that a sizable increase in the Eu to Y ratio could be accomplished by a BaS04 precipitation prior to a column separation of these twoisotopes. Tests to find conditions for carrying of Eu and non-carrying of Ywere conducted as follows; one ml sample of each tracer were added to one ml
140

1000
100-
10
1.0-
0.2.90
NOT CLASSIFIEDDWG. 7312
FIG. 38
DISTRIBUTION OF Eu TRACER (2 x 10 ' M)AND y TRACER (~I0~8 M) BETWEEN DOWEX50 RESIN (AMMONIUM FORM) AND 0.238 M
CITRATE BUFFER
TEMP- 75°+ l°C
pH ADJUSTED WITH NH4OH
RESIN DIAMETER I0~75 MICRONS
3.00 3.10_!_
3.20
pH3.30
•7
3.40 5.50

to
. pH ' 3.02 3.18 3.32 3.4 0
Weight resin (gran) 0.1577 0-1615 0-6387 0.5993 2 8114 2-9993 4.7046 4-9255
Original buffer pH 3.04 3-04 3- 17 3- 17 3 33 3 33 350 3-50
pH after firstequilibration
3.03 3.02 3. 18 3.18 3.33 3.32 3.42 3.41
pH after secondequilibration
3.01 3.02 3.21 3. 17 3.34 3.31 3.40 3.38
KD—First equili-r -' • bration
110 140 29. 1 34.7 5.97 5. 79 1.60 1.60
K_—Second equili-° bration 108 116 26.0 34. 1 5.84 5.37 1.40 1.46
K_—Resin strip 101 123 27. 7 35.3 7.42 6.50 2.06 2. 26
Average 106 126 27.6 34. 7 6.41 5.89 1.69 1. 77
percent materialbalance
97 96 103 102 114 111 114 118
Average Eu K_ 1 L6 31- 2 6- 15 1. 73
• Distribution Coefficient
cts in resin/mass of resin
cts in solution/volume of solution
•• Beta Activity in Buffer (Original) = 18.200 c/m/ml at lo-g geometry and no absorber
I
??*M
H1*
H'
013
i»*
VI
Bm
M ©A» to
stitOB
o o ft.0 »**
a r* CoaM fit
<*-
«*
Wl A ۥ*.
© •" o-
to BB> «+
B MB0 ^ O
a © 3»-»•
o-B
"-4
o*** no w *-*BT • •-♦>
" • *•*.
fr~" o
© tj' a a
** 3m
B CoH-- r+
** O"e C Op i—
•»• mr*
• ^1
$ a. t/i
9s
H-
a. *o
(•*.
*— no
o
a.
SB
I
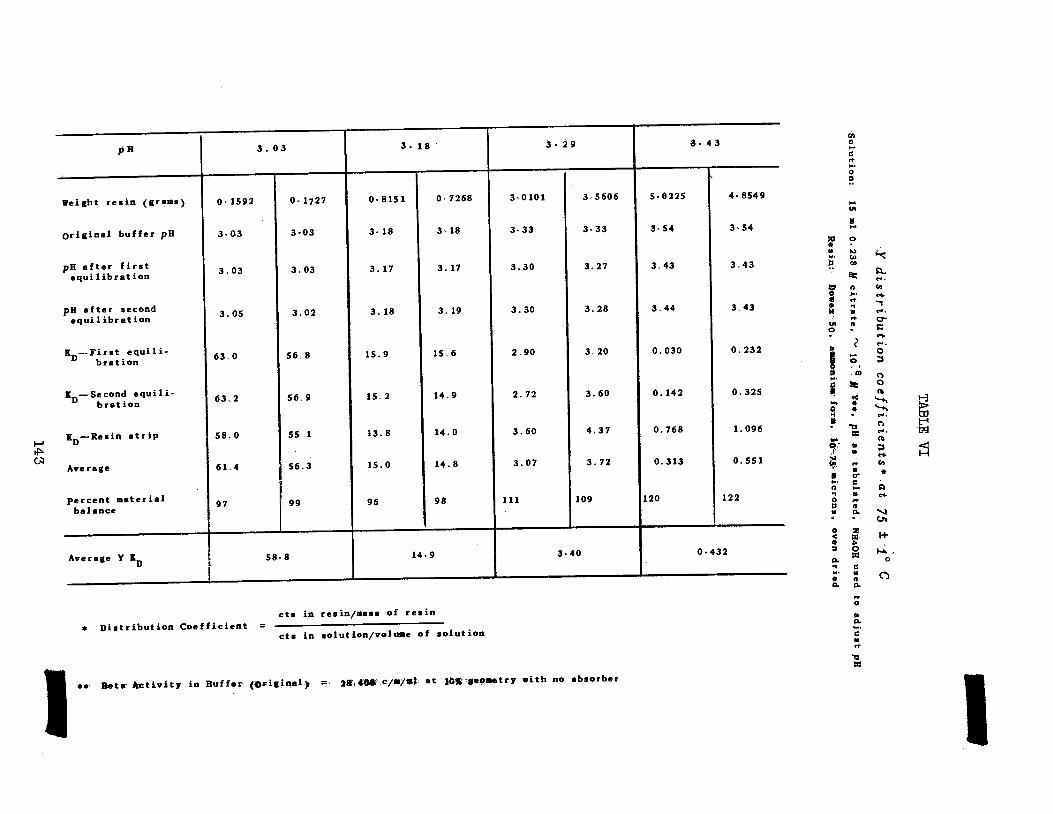
03
pH
Weight resin (grams)
Original buffer pH
3. 03 3.18
pH after firstequi1ibration
pH after secondequilibration
K_—First equili-bration
K —Second equili-bration
0-1592
3-03
3.03
3.05
63.0
63.2
0-1727
3 '03
3.03
3.02
56.8
56.9
55.1
56.3
99
0-8151
3- 18
3. 17
3. 18
15.9
15.2
13.8
15.0
96
0-7268
3- 18
3. 17
3. 19
15.6
14.9
14.0
14.8
98
K—Resin strip 58 0
Average 61 4
percent materialbalance
97
Average Y K 58-8 14-9
cts in resin/mass of resin• Distribution Coefficient
cts in solution/volume of solution
3-29 3- 43
30101 3-5606 50225 4 8549
3-33 3 33 3 54 3-54
3.30 3.27 3.43 3.43
3.30 3.28 3.44 3.43
2.90 3.20 0.030 0.232
2. 72
3.60
3.07
111
3.60
4.37
3.72
109
3-40
0. 142
0.768
0.313
120
0.325
1.096
0.551
122
0-432
I», Beta Activity in Buffer (oriSin«l>.> - 28E.40* c/m/.J at »« .eoawtry with no absorber
COo
B
a O CO>-•
•1 "1
M IB e-.
r* o-
© Bc+
t e-*.
O
| © 3
**•
s
CO
3S
no
n« *•*»0 • *-+.•n «-•-
9T3
O
aM* a
3
<A r+ CO•
B o-H* eo n*t a>0 **
s Itti O. V)
- - o»
0 Z< a H-<• *3
s t-».
CL*\ c
a
Iffed
I

quantities of various concentrations of MgS04'°7H20 and the mixtures were
heated to boiling. One ml BaCT2 [1 mg Ba{ll)/ml] was then added and again
heated to boiling. The sample was then centrifuged, the supernatant decanted,
and the activity in the BaSQ4 determined. Results are tabulated in Table VII.
The same ratios and general procedure were used in testing under reducing
conditionsj except that the 2 ml traeer-MgS04'°7H20 solutions were made 1 N in
H2S04 and were heated on the water bath at 100' C for an hour with ~0„5 g
amalgamated zinc with addition of water to keep the volume constant before
addition of BaCl2 „ These .results are tabulated in Table VIII. The con
centration of the MgS04"7H20 solution affects both the amount of activity
carried by the BaS04 and the final ratios of Eu to Y, At the lower concen
trations, oyer 80% of the Eu was carried and approximately 20% of the Y wasalso carried, changing the Eu to Y ratio by a factor of four. At. the higher
concentrations of MgS04°7H20 it was found that less activity was carried, but
the ratio was improved, the best ratio being found to be approximately 13
where a 400 mg MgS04"7BL,0/ml solution was used as described above under reduc
ing conditions. Although only 50% of the Eu carried under these conditions,
it was decided to use this step before final separation on the column s.ince
the less Y to be contended with the better the column separation should be.
4. Separation by Ion Exchange. A separation of Eu and Y was accomplishedby combining the preliminary separation using BaS04, after reduction of Eu, and
a subsequent separation of the Eu and Y in the BaS0«, by use of an ion-exchange
column.
A solution containing a 1 =1 ratio of Eu and Y :5„93 *' 10e o/m Eu and 6.05x 10⁶ c/m Y) was concentrated to two ml. Two ml 400 mg MgS04 n7H20/ml wasadded and the solution was made 1 N in Hj, SO,,;. This was heated at 100' C with~ one gram of amalgamated zinc, adding water to keep the volume constant, andtwo ml of 1 mg Ba/ml as BaClj. was added and the mixture heated for five minutes.The BaS04 was centrifuged and rinsed with five ml Hs.O a^d slurried away fromtoalgfflKE5r.tea zinc with three passes with water. The Eu and Y were leached fromthe precipitate with three two-ml passes with hot dilute nitric acid. Theseleaehings were concentrated to one ml and the pH was adjusted to a value ofone. The solutions were then passed through a resin column, consisting of a126 cm piece of flexible Tygon tubing (l.D. of 0.48 em; filled with unscreened,air dried Dowex 50 resin which had been equilibrated with pH 3.20, 5% citrate.This column had been coiled about a 5.00 ml mixing cylinder and the resin
144
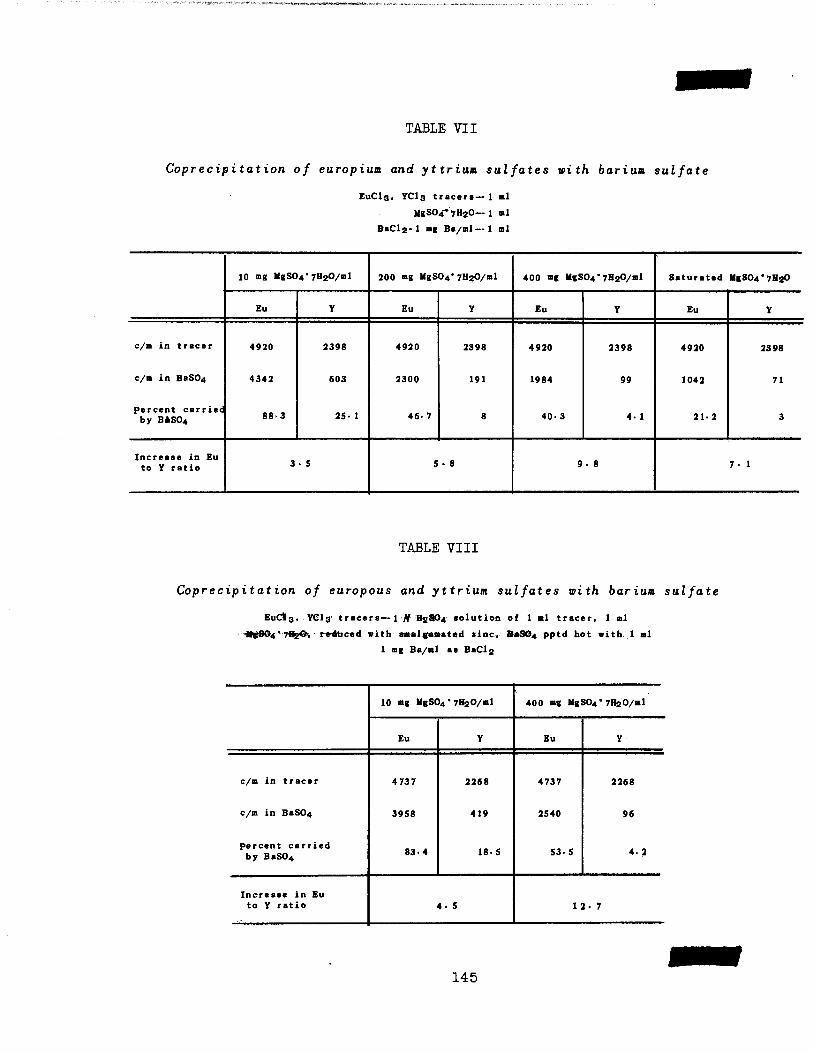
TABLE VII
Coprecipitation of europium and yttrium sulfates with barium sulfate
EuCls. YCls tracers—1 ml
MgS04* 7H2O— 1 ml
BaClo.- 1 mg Ba/ml—1 ml
10 mg MgS04*7H20/inl 200 mg ligS04* 7H2O/111I 400 mg MgS04*7H20/ml Saturated MgS04*7H20
Eu Y Eu Y Eu Y Eu Y
c/m in tracer
c/m in BaS04
percent carriedby BASO4
4920
4342
88 3
2398
603
25- 1
4920
2300
46- 7
2398
191
8
4920
1984
40-3
2398
99
4- 1
4920
1042
21-2
2398
71
3
Increase in Eu
to Y ratio3. 5 5. 8 9- 8 7- 1
TABLE VIII
Coprecipitation of europous and yttrium sulfates with barium sulfate
Eu&g, YClg tracers—1 M H2SQ4 solution of 1 ml tracer, 1 ml
I+KBO4*7%0, reduced with amalgamated zinc, BeS04 pptd hot with ,1 ml
1 mg Ba/ml as BaCl^
10 mg HgS04' 7H20/ml 400 mg MgS04'7H20/ml
Eu Y Eu Y
c/m in tracer
c/m in BaS04
percent carriedby BaS04
4737
3958
83-4
2268
419
18-5
4737
2540
53-5
2268
96
4-2
Increase in Eu
to Y ratio 4- 5 12. 7
145
portion submerged in a constant temperature bath at 50 C. The elutriant was
0.238 M citrate at pH 3.20, at which pH the KD5s for Eu and Y are 14 and 7S
respectively. A flow rate of 2.75 ml per hour was used. The column volume
was 12.0 ml.
Table IX shows the distribution of activity throughout the experiment and
Fig. 39 shows the elution curve with the Y coming off first and the Eu second.
No gamma activity was found in the Y fraction. A comparison of the beta to
gamma ratio for Eu at the start of the experiment and in Fraction 2 shows
Fraction 2 to be of the same composition as the initial Eu. Decay curves are
being followed for both fractions.
The percentage of Eu activity carried by the BaSO... was only24% instead of
the 50% indicated by the batch test. The resultant Eu to Y ratio increased by
a factor of only 5.3 instead of the expected 13. A check will be made to see
if the increased HC1 concentration resulting from concentrating the Eu and Y
solutions has caused this.
SEPARATION OF Zr=Cb FROM F Po MIXTURES
W. H. Baldwin, H. W. Kohn„ C. Ea Higgins
J. M. Ruth, A, W„ Smith and R. E. Wacker
i„ Introduction, In previous reports (ORNL 176, QRNL 229, and OHNL 336)
it has been shown that the fission products: Zr and Cb, can be separated from
Redox plant waste solutions and shouldbe available in relatively large quanti
ties for certain military applications. No data have been found which show
the processto be inoperable, but several.problems remain to be solved and data
must be obtained with high, levels of activity. It is planned to continue in
vestigations on this problem to permit issuance of a "feasibility report in
September, 1949.
•2, Summary. About 30 gallons ofthe (IAW) raffinate from the first Redox
cycle has been obtained from the Redox pilot plant and has been stored for use
in the testing of the proposed Zr-Cb separation process at high levels of
activity. Facilities in the hot cell are nearing completion and should soon
be 'ready for testing.
146
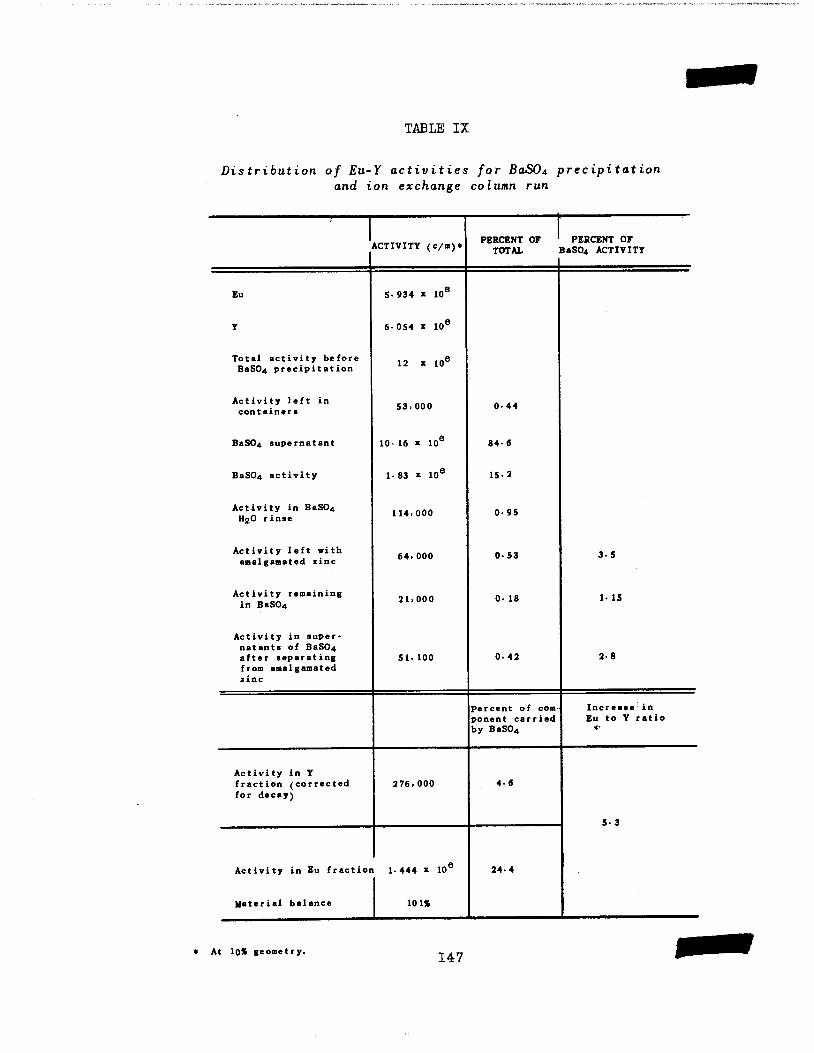
TABLE IX
Distribution of Eu-Y activities for BaSO* precipitationand ion exchange column run
ACTIVITY (c/m)*PERCENT OF '
TOTAL
PERCENT OF
BaS04 ACTIVITY
Eu 5- 934 x 10e
Y 6-054 x 10e
Total activity before 12 x 106BaS04 precipitation
Activity left incontainers
53.000 0-44
BaS04 supernatant 10- 16 x 106 84-6
BaS04 activity 1- 83 x 106 15-2
Activity in BaS04HqO rinse
114,000 0-95
Activity left withamalgamated zinc
64,000 0-53 3-5
Activity remainingin BaS04
21,000 0- 18 1-15
Activity in super-natants of BaS04after separating 51, 100 0-42 2-8
from amalgamatedzinc
percent of com Increase in
ponent carried Eu to Y ratio
by BaS04 *•
Activity in Yfraction (corrected 276,000 4-6
for decay)
5-3
Activity in Eu fraction 1-444 x 108 24-4
Material balance 101%
• At loX geometry.147

10
>- nrr 8
h-
FIG. 39
ELUTION CURVE FOR THE SEPARATION OF yAND Eu USING DOWEX 50 (10-75 MICRON
DIAMETER) AND 0.238 M CITRATE(pH 3.20)AT 50+ 0.5°C
COLUMN LENGTH = 493/4" =126.4 CmCOLUMN DIAMETER = 0.48 Cm
g COLUMN VOLUME =12.0 MiFLOW RATE = 2.75 Ml/Hr
2-
6 O O-Ol I I -I L_
0COLUMN VOLUMES
NOT CLASSIFIEDDWG. 7320

The acidity and the history of the IAW solutions determine how well theZr-Cb will be absorbed on silica gel directly. In those solutions of low
acidity (near pE 2), which are now preferred in the present pilot plantoperation, essentially no adsorption on silica gel was observed. However,after HN03 had been added to obtain an acidity of 0.3 feo 1 MHN03 adsorptionoccurred as anticipated.
Zr-Cb were absorbed from dissolver solution, but in those solutions which
were not oxidized before treatment, about 12 to 40% of the Pu present accompanied
the Zr-Cb.
Data obtained for the absorption of Zr-Cb at various ratios of silica gelto solution fitted a Freundlich isotherm within the limits of experimental
error.
Cb was removed somewhat less readily from silica gel than was Zr, heating
of the 0.4 Moxalic acid being required to elute all of the Cb. Equilibriumdistribution data indicate that HF and H3P04 remove Zr more efficiently than
Cb.
No method of preventing the absorption of Cr(Vl) on the silica gel hasyet been found. However, washing of the gel with dilute (0.1 MHN03) servedto remove enough dichromate so that the reduction of the eluting oxalic acidand consequent bubble formation were no longer problems.
The Zr-Cb can be concentrated with respect to the 0.4 Moxalic acid eluentby carrying on ferric hydroxide or zirconium hydroxide, formed by the additionof NaOH.
Separation of the Zr-Cb can be made using anion-exchange columns andddliliteacid solutions in which the Zr and Cb exist as anions. This is expected toprove useful as an analytical technique in the search for radiochemical impurities in the preparation.
3. Analysis of IAW Raffinate. Approximately 30 gallons of IAW wasteresulting from the Redox pilot plant treatment of Hanford slugs has been collected from runs 50R and 52R. This solution has been stored underground andwill be used for testing with the hot facilities which will soon be available.
The IAW solution has been analyzed and reported to contain about 0.5curies of Zr and 1 curie of Cb per liter. These radioactivities are somewhatlower than was expected from uranium irradiated at Hanford hut can probably beaccounted for by the fact that these slugs were irradiated in the areas oflower flux for a period of a year or longer and have cooled the order of 150
149

days*.
A request has been made of Hanford chemists to supply us with information
on the amounts of Zr and Cb found in Hanford dissolver solutions by analysis.
The recent LAW solutions from the pilot plant differ in composition from
those which were originally obtained. The solution which is now obtained by
the preferred method of operation of the Redox process is compared below with
the original solution.
ORIGINAL SOLOTION PREFERRED
HN0s 0-8M 0,1 MHNOa to 0,2 Af acid de=ficient by NaOH addition
AI(N0S)3 0.74'' M i-^5
Na2Cr207 0,06 M 0,06 M
A. Adsorption Studies, (&) Adsorption from Diaaol^ar Solution (UNH)uDissolver solutions (essentially uranyl nitrate with mixed fission products
obtained by dissolving irradiated uranium me+al in ni+rie acid; are considered
to be a more generally useful source o? the produc+s of Mission than are the
waste solutions. Early in the piutonium project these Bolu+ions were treated
with silica gel to obtain piutonium but it was observed that Zr and Cb were
also absorbed by the silica gel .'report's CN-601- CN-633 Cft-991-. CN-1373 and
others).
In a crude scouting test (Run 1.. Table X; 10 ml of 0. 2 MUEH solution,
containing 1 ml dissolve- solution (heels ^om 706-D special Run 32; and 0.2M in HN03, was passed through a column of £00 mesh -silica gal (Merck reagent grade) contained in a tube 12 mm i,&, and 70 ran high, The column was washedwith 25 ml of 0,1 Af HN03 and then eluted with 25 ml port ion3 of 0.4' Moxalicacid at a flow rate of about 10 ml per cm* per hour.
It should be pointed out that the original solution was not analyzed and
material balances could not be calculated for Test 1,
A second test (Run 23 Table XI, was made using 0.25 mi dissolver solutionin 5 ml of 0.2 MUNH solution in a manner similar +o Run 1 except that washingwas more exhaustive with 0,1 MHN03, Results are shown m Table X, Run 2.
* Priirate communication, H. K. Jackson
150

as
as
DM
TABLE X
Adsorption from UNH solution
Conditions:Feed = 0-2 Af HrJOs containing dissolver solution (see text)Wash = 0-1 M HN03Eluent = 0-4 M oxalic acidColumn = 12 mm diameter x 70 mm, 200 mesh silica gel
Flow rate = 10 ml/cm2/hr
SOLUTION
Filtrate
Wash (0. 1 M HN03)
Elution (0.4 Aloxalic acid)
Forerun
Wash (0-1 M HNO3)
Elution (0. 4 Moxalic acid)
VOLUME
(ml)
11
25
14
27
19
22
25
15
15 .
20
15
18
15
Material Balance
GROSS GAMMA
(Percent)
27
42
23
7.4
0.3
0. 1
0.03
Zr GAMMA
(Percent)
0-8
1-6
74
23
0.9
0.2
0.3
Cb GAMMA
(Percent)
0-6
0-4
74
23
1.5
0.6
0. 1
percentages based on the sum of the activities.
No detectable activity.
Pu ALPHA
(Percent)
5-8
82- 5
12
Not detectable
7.3 41. Q
0.0 22.4
0.0 11.8
56.6 41.3
31.3 0.8
0.8 0. 1
59 3. 1
2. 1 1.2
0.3 0.0
21.7 84.3
8.3 19.4
1.3 2.5
92.7 110.5 96.0 117.4
151

TABLE XT
Effect of acidity on adsorption of Zr-Cb
Conditions:
Solu*ion--5 ml IAW(52R), Kidmy as. jsdicaledAdsorbent—., loo mg siliaa gel (DavssoBjAgitation— tumbled end ovei: end at .24 ipm fen- 24 hours
HN03 CONCENTRATION
(Molarity)
GROSS GAMMA IN
SUPERNATANT
None added £00
0- 16 93 S
0-31 45
0-47 42 4
0-61 4: 0
0 -76 49 2
1 46 48 1
2- 1 SO 2
2 7 S3 4
TABLE XII
Adsorption with varied amounts of silica gel
Conditions
Solution 10 ml! of IAW iaom R«dox p.-.ioi pi ami Run 42Rma.de using 3q% H&n!l>i.id .r.-- l. &d^. aire-d metal and
70%'- Cl inton it /radiated atiif :m the ifted0 8 A/ HNO3 B-8 If Ai/N03)S and TJ. OS M NaoCfoO?..
Adsoi-bent-- Silica gel, weighs ma arid..casedAgitation'- -Tumbi ad «md o«*,7 end at 20 rpu Coir 24 hourrs
SOLUTION SILICA GEL (gm) GROSS BETA GROSS GAMMA Z GAMMA Cb GAMMA
IAW 42R None 9. 9 . 108<*> 2 I > 106 <8> 4 2 x 10⁵ <8> 9-3 x 10⁶ <8>
Supernatant 0 2 97-0% 40 2% 33 8% 19- 7%
" 0 4 92 4% 33 7% 24 5* S2 8%
•" 0- 6 97 0% 31 5% 19 4% 9 5%
0,8 9S,0% 30. 4% 18 2% 8.5%
1.0 96 6% 2 9 0% 16.5* 6. 7%
(a) Counts/min/ml at lo% geometry.
152
With exhaustive washing of the silica gel, piutonium still accompanied the
Zr-Cb. It is proposed to test these solutions further using UNH feed solutions
which have been oxidized with dichromate before contacting the silica gel and
to test the washing of absorbed piutonium from the silica gel with solutions
containing dichromate. It is anticipated that Pu(VI) will not be so readily
absorbed.
(b) History of IAW Raffinate. The solutions, originally used in scouting
tests during the search for an absorbent, contained 0.8 M HN03 in addition to
the other components. It was recognized that it might be desirable to use an
IAW solution, which was low in free HN03. The original tests made after the
neutralization of the free HN03 with NaOH revealed little difference in the
absorption of Zr-Cb by the silica gel. However, when the IAW from the pre
ferred Redox flow sheet runs was equilibrated in the laboratory, no measur<-
able amount of the gross gamma activity was absorbed from the solution in con
trast to the expected amount of about 50$. Tests were made with varied acidity
to study the effect of acid concentration on the adsorption by silica gel. An
optimum acidity was found near 0.3 MHN03 at which 59% of the gross gamma
activity was adsorbed in 16 hours (Table XI).
Batchwise equilibrations were made with 5. ml portions of IAW (52R) and 100
mg silica gel (Davison) inan end-over-end tumbler for 16 hours at about 20 rpm.
After settling, samples of the supernatant were diluted (25 microliters to 10ml) and the gross gamma activity was determined on the high pressure argon-
filled ionization chamber.
Rate studies were made at 0.31 MHN03 from which 8% of the gross gamma
activity was adsorbed by silica gel with a half-time of 6 minutes and the re
mainder with a half-time of 2.3 hours. At an acidity of 0.77 MHNOa 13.5% of
the gross gamma activity was adsorbed with a half-time of 3.8 hours. Theseresults indicate the probability of at least two mechanisms participating in
the adsorption of Zr-Cb on silica gel.
(c) Amount of Silica Gel. A test was made using different weights of silicagel (0.2 to 1.0 gm Davison 100 silica gel) in 10 ml of Redox pilot plant waste(IAW from 42R) by agitation in an end-over-end tumbler for 24' hours. At theend of this time the silica gel was allowed to settle and 100 microliter; ali^
quots diluted to 10 ml were submitted for analysis.
Analtyical results (Table XII) show that more gross gamma, Zr gamma andCb gamma were absorbed by more silica gel. No definite trend was detected in
153

the gross beta activity. A plot (not included here) of log of counts of
residual component against the log of counts adsorbed per gram of silica gel
show a straight line relationship within limits of experimental error for gross
gamma, Zr gamma and Cb gamma. This is interpreted to mean that the adsorption
follows the Freundlich relationship.
The silica gel from these tubes was transferred (but not quantitatively)
to a small glass column where it was washed first with 0.1 MHN03 (to remove
adhering IAW solution), then with 0.4 M oxalic acid at room temperature. Most
of the activity was found in the oxalic acid solution and this was found radio
chemically to be due to Zr and Cb. A small amount of activity remained on the
silica gel and this was put in solution by passing 1 MHF down the column thus
dissolving most of the silica gel. Radiochemical analysis showed this fraction
to be largely Cb, the ratio of Cb gamma to Zr gamma being 26 to 1, showing a
considerable concentration overthe original ratio of near unity. On the basis
of these data it is believed that a separation of Zr from Cb might be effected
by choosing the proper composition of oxalic acid solution used for elution.
(d) Batch Equilibration and Elution. Some additional information has been
obtained on batch tests with tracer activities which were reported in earlier
reports (Table XIII). Dilution of the feed with water (1:1) or reduction of
the dichromate with TL,0Z made little difference in the equilibrium absorption.
Reagent Mn02 adsorbed Zr and Cb effectively!
Elution with oxalic acid in batch tests confirmed previous data showing
its effectiveness. However, data mentioned elsewhere in this report indicate
the difficulty of removing Cb at room temperature and the desirability of
eluting at elevated temperatures.
Dilute HF and H3P04 removed Zr more effectively, then they removed Cb.However, HF serves a second purpose, that of dissolving the silica gel and
thereby removing the Cb.
(e) Adsorption of Cr(Vl) on Silica Gel. The adsorption of sodium dichromateand other waste solution components along with the zirconium and columbium on
the silica gel was of interest in the study of the silica geJL process. Experimental procedures have been worked out, and data-on the adsorption of Cr(Vl) bysilica gel from aqueous solution under varying conditions have been obtained.
(1) Experimental Methods: A suitable volume of solution and a weighedsample of silica gel were put into a glass tube of about seven inches overalllength, having a usable volume of about 40 ml. For all except three or four
154

M
OlOl
ADSORBE NT ADSORPTIOh1
jtion)
ELUTION
(Percent left in sol
Eluting Agent
percent of total e luted
Substance > G Gross Gamma Zr Gamma Cb Gamma Gross Gamma Zr Gamma Cb Gamma
Silica gel 0561 50 7 8 0.5 W HF 31 74 28
Silica gel 0- SS3 50 7 8 0.5 M HF 31 71 28
> > COSilica gel (a) 0.532 50 18 6 0.4 if H2C204 40 89 42
olut
bsorgita
Silica gel (a) 0.572 50""
6 0.4 M H2C2O4 40 99 42
ion-
benttion
Silica gel (b) 0.568 49 11 3 0.4 M H2C2O4 39 76 68 1
a O
* O 8 :>>-Silica gel (b) 0.550 49 2 4 0.4 M H2C2O4 40 67 71
1of
indiuili26
Co
O
Silica gel (c) 0.532 52 -- -- 0.4 M H2C2O4 21 45 52H- o- 0 000 1
"a0 b <t 0 *a 00 0- rt n VI * *- *+
Silica gel (c) 0.521 52 --0.4 M H2C2O4 25 38 52 oa ^ S: 0
no- z >2 "•• •< » *-o 3
p..
O
3t-1
Silica gel 0.580 50 5 8 0.4 M H2C2O4 37 69 61 to^a a
C *i O 0O3
M
Silica gel 0.536 50 6 8 0.4 M H2C2O4 37 64 73
S N> CO O0- O^ B•- -*i a u••• 03 13 08 M
00. *• 13 H.
a.
c
aHH
MnOo. (d) 0.869 49 6 3 0,5 M HF 16 72 2211 OK* M-3 ** n O *•••
a 0. 3 0
Mn02 (d) 0.887 49 1 2 0. 5 U HF 16""
witpian
-ove
3
Mn02 (d) 1. 120 49 12 2 0.5 M H3PO4 21 78 45
hIAWtRunr-end
Mn02 (d) 1.328 49 11 3 0.5 II HsP04 20-*» 00 **
0 so 1t 0
Fe203 (d) 0-400 71 59 12B
to
Fe203 (d) 0.400 71 -- 12 -- -- --
3-OB*
(A
I(a) Feed diluted with 1 part feed to 1 part H2O.
(b) H2O2 added to feed.
(c) NH4OH wash used between adsorption and elution in place of H20 wash.
(d) Reagent grade.
1

of the points plotted on the following graphs, a volume of 30 ml of solution
was measured out to which 10 g of silica gel was addedo
The tubes were made with standard ground glass joints in order that the
stoppers might be interchangeable with the filter tubes to be described below.
Either silicone grease or fluorothene grease was used to prevent leaking. The
sample tubes were placed in a tumbling mechanism which was built into a con
stant-temperature water bath.
Variation of the time allowed in the bath from 4' hours to about 64 hours
without any difference in results indicated that equilibrium was established
in all cases. It can be noted here that the abrasive action of the gel
particles on each other during agitation and the peptization of silica gel at
high pH both may result in small losses of gel, but these effects were not
found to be important in these experiments,, (Magnetic stirring was unsatis
factory because of grinding of the gel),
When the tubes were removed from the bath, the stopper was taken out of
each, and a tube with a ground glass joint at one end and a coarse glass
filter at the other end was inserted in place of the stopper* This filter
tube was sufficiently large to hold the contents of the other tube. This
appeared to be the easiest way of getting quantitative transfer of the gel to
the filter without using any wash other than the solution which is in equili
brium with the gel. In this way, the transfer was accomplished easily and
quickly, A solution sample was obtained by filtering or by decanting it from
the gel, after which the entire gel sample was centrifuged to remove the
adhering solution.
Sodium dichromate and chromic acid were observed to be quickly extracted
from the gel by hot water, A continuous drip extractor containing the gel
sample was connected by ground glass joints to a flask of boiling water at its
bottom end and to a small reflux condenser at its top end. The extraction was
usually completed within one to three hours.
The concentration of the solution phase was determined by titration of a
measured volume, and the concentration of the absorbed phase by titration of
the extract or of an aliquot. The iodine-thiosulfate method with starch in
dicator was used for all titrations. The pH's of the solution phases were
measured with a Beckman Model. G laboratory pH meters
(2) Materials Used, Davison PA 100 Refrigeration Grade Silica Gel was
used in all experiments. The moisture content of the material does not appear
156

to change ifthe metal can is kept closed. Samples have been kept for moisture
determination, but the results are not available yet. There should have been
little change. All other materials used were C.P. reagents.
(3) Effect of pH on:Adsorption: As shown in Fig. 40, changes in acid
concentration from pH = 2.5 to an acid content of 0.8 M HC1 had little if any
effect on the absorption. At a higher pH, corresponding to a change from
Cr207= to Cr04 =, a new line appeared to be established below the Cr207~'ab
sorption curve. The transition from one to the other varied with pH and con
centration. No particular importance is attached to the two low points, but
it should be pointed out that they occurred with solutions which were probably
too alkaline for good stability of the gel.
The data can be fitted by the Freundlich equation, giving:
log CG = 0.82 log Cs - log 0.43
for the low pH branch of the curve, where CG = moles of Cr207= per 1000 g ofgel, and Cs = molarity of Cr207= in solution. Here, the original weight of
gel directly from the container was used.
(4) Adsorption by Purified Gel: Boiling the gel with concentrated nitric
acid and washing with hot water had no effect on dichromate adsorption, as in
dicated in Fig. 41.
(5) Adsorption in the Presence of A1C1S*. In order to get a preliminary
idea of what effect Al(lll) in solution might have omthedichromateLadsorption,
the extent of adsorption from solutions containing 1 MA1C13 was determined.
Aluminum nitrate will be studied later (because of the necessity for changing
the analytical method in the presence of N03~). The curve obtained with A1C13
is shown in Fig. 42, and can be fitted by the Freunclich equation,
log CG •= 0.63 log Cs - log 0.5.3
(6) Variation of Adsorption with Temperature: At temperatures of 10°,25°, and 40° C no difference in the adsorption of dichromate was found. See
Fig. 43.
5. Treatment of 0.4 MOxalic Acid Solution Containing the Eluted Zr-Cb.It is-unlikely that a solution in0.4 Moxalic acid would be desirable for finalapplication of the product. Therefore, methods for concentrating the Zr-Cb arebeing investigated.
157
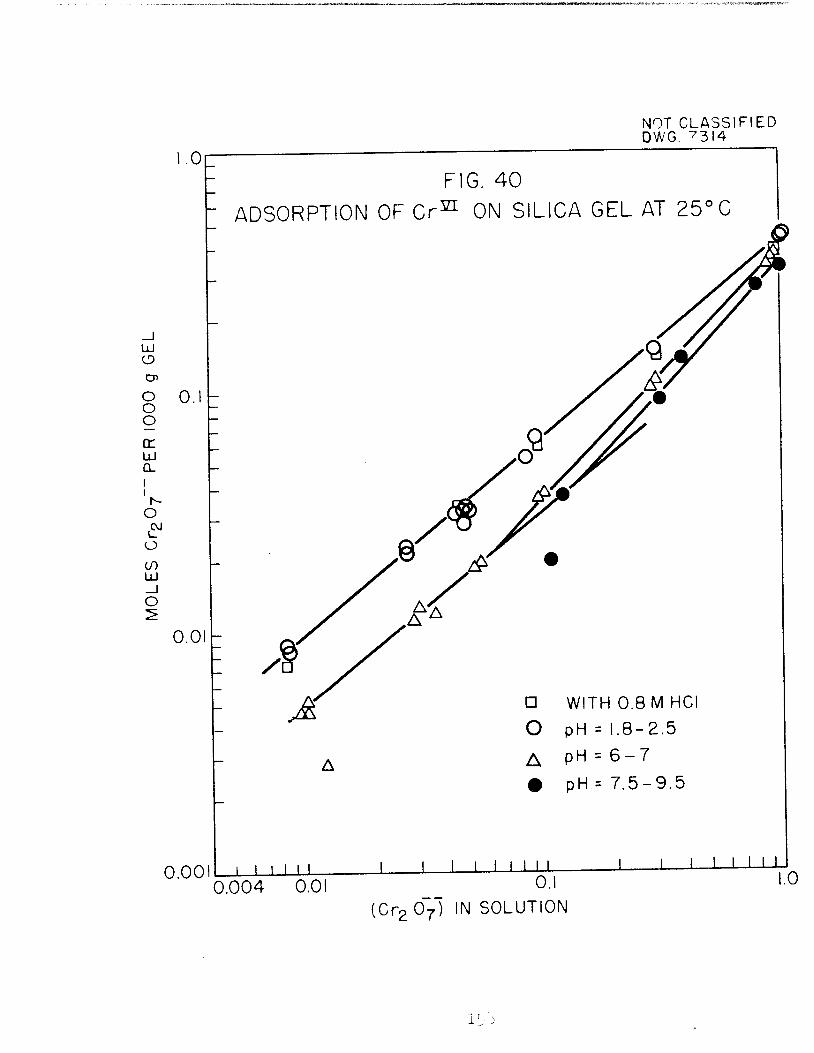
UJO
Ooo
crUJ
Q_
II
N-
OCvJ
o
if)UJ
_i
O
.0
0.
0.01
NOT CLASSIFIEDDWG. 7314
FIG. 40
ADSORPTION OF Crm ON SILICA GEL AT 25° C
• WITH 0.8 M HCI
O pH = 1.8-2.5
A pH = 6-7
• pH= 7.5-9.5
1±0.0010.004 0.01 0.1
(Cr207) IN SOLUTION
1 ; .'•'
.0

UJ
o
en
OOO
£TLU
Q_
O
o
enUJ
_J
O
Or
0.
0.0
NOT CLASSIFI
DWG. 7329
ED
FIG. 41
ADSORPTION OF Crm ON PURIFIEDSILICA GEL AT pH 1.8-2.0
P
//
/y
//
//
//
/'o
/4
/
//
/o
O GEL BOILED WITH HN03
UNPURIFIED GEL (TAKEN FROMFIG 40)
//
yO
I I I _l I L l I
0.004 0.01 0. .0
(Cr207) IN SOLUTION

UJ
o
o>
ooo
enUJQ_i
o
o
COUJ_J
o
OCT
0.
0.0
FIG. 42
EFFECT OF I M AICI3 ON ADSORPTIONOF Crm BY SILICA GEL
1 l 1 1 1 1 1
IN PRESENCE OF I M AIC
pH = 1.25-1.3
IN ABSENCE OF AICI3 ,TAKEN FROM FIG.4C
1 1 I I I I I I
0.003 001 0.1
(Cr2d7l IN SOLUTION
160
NOT CLASSIFIEDDWG. 7330
I 1 M I
.0

NOT CLASSIFIEDDWG. 7331
1.0
FIG. 43
Cr20 7 ADSORPTION AT oVARYING TEMPERATURES /
UJCD
cn /OOO y*£ 0J /UJ
Q_— /
i
Vo A
/o
u_— /
o •
/enUJ /_i
O — /•2 / O AT 40° C
/w
• AT 10° C
.01
E §y- /y
i i i 11 1 1 1
AT 25°
I I i l 1 1
C (TAKEN FROMFIG. 40)
i i I i 1 1 I 1
.005 .01 0.1 1.0
(Cr207" ) IN SOLUTION

It has been found possible to carry the gross gamma emitters from the
solution^ in a yield greater than 99%» on either ferric or zirconium hydroxide.
At present there appears to be no reason to limit the amount of carrier associ
ated with the product to less than 45 mg per curie. Radiochemical purity is a
matter for further consideration. Anion exchange resins using oxalic acid
systems offer a method for further purification of the Zr and Cb as well as for
the analytical estimation of the radiochemical purity,
(a) Carrying Zr-Cb on Precipitates, Ferric hydroxide [0,65 g Fe(ill)/liter],
formed in 0,4 M oxalic acid solution by the addition of solid sodium hydroxide
until a precipitate appeared, carried 99,6% of the gross gamma activity. The
precipitation of zirconium hydroxide by the addition of sodium hydroxide, fol
lowed by centrifugation and precipitation of a second portion by the addition
of zirconyl chloride carried more than 99,9% of the gross gamma activity
(Table XIV)„
(b) Anion Exchange Resin, K, A, Kraus and coworkers have separated Zr from
Cb (and other elements) by elution from an anion exchange resin (Dowex A-l)
with solution containing both HC1 and Hf at various concentrations. Advantage
is9 thus,, taken of the occurrence of these elements in the anionic form, Zr
and Cb were absorbed quantitatively from 0,4 M oxalic acid, and batchwise
equilibrations (Table XV) indicated the possibility of eluting Zr and Cb from
the resin with 1 M HC1 and 0,001 M oxalic acid.
On the basis of this information a separation of Zr from Cb was attempted,
A packed column about 6 mm inside diameter was filled to a height of 85, cm
with 80-200 mesh Dowex A-l resin. Ten ml of 0,4' M oxalic acid solution con
taining Zr-Cb tracers passed through the column with subsequent adsorption of
the activities at the top of the bed, A solution containing 1 M HC1 and 0,001
M oxalic acid was allowed to flow down through the bed at a rate of 0.45.
ml/em2/min„ The results of the elution are shown in Fig, 44- with Zr beingpresent in the first peaks and Cb in the last peak. The first band of activity
(Zr rich) appears to consist of four peaks of activity. These have not yet
been identified. It does appear that with further development it may be
possible to separate Zr and Cb by the use of anion exchangers and perhaps
obtain analytical information concerning the radiochemical purity of the
product,
6. Stability of Silica Gel to Radiation. Samples of silica gel have been
irradiated in the ORNL pile for periods up to an including 6 weeks. These
162
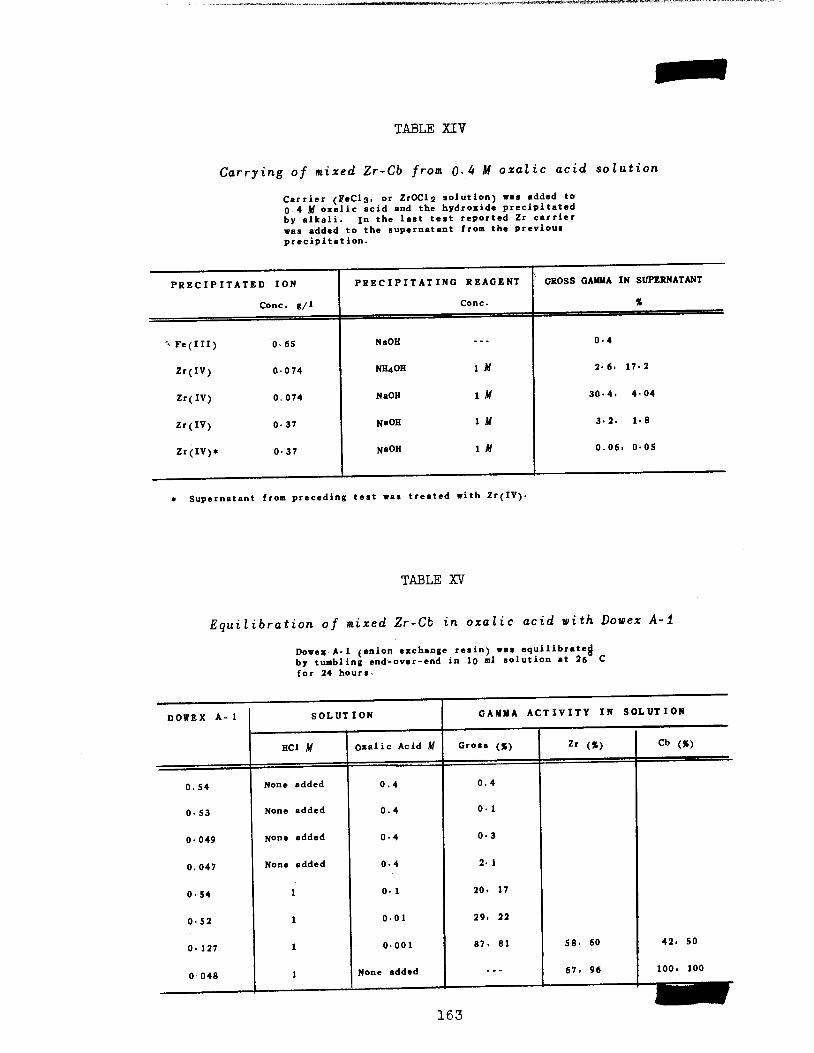
TABLE XIV
Carrying of mixed Zr-Cb from Q.k Moxalic acid solution
Carrier (FeCl3, or ZrOCl2 solution) was added to0-4 M oxalic acid and the hydroxide precipitatedby alkali. in the last test reported Zr carrierwas added to the supernatant from the previousprecipitation.
PRECIPITATED ION PRECIPITATING REAGENT GROSS GAMMA IN SUPERNATANT
Cone, g/1 Cone. X
'•> Fe(III) 065 NaOB ... 0-4
Zr(IV) 0-074 NH40H 1 M 2-6. 17-2
Zr(IV) 0.074 NaOH 1 M 30-4. 404
Zr(IV) 0-37 NaOH 1 U 3-2. 1-8
Zr(IV)* 0-37 NaOH 1 M 0.06. 0-05
» Supernatant from preceding test was treated with Zr(IV).
TABLE XV
Equilibration of mixed Zr-Cb in oxalic acid with Dowex A-1
Dowex A-1 (anion exchange resin) was equilibrated,by tumbling end-over-end in lo "1 solution at 26 Cfor 24 hours.
DOWEX A-1 SOLUTION GAMMA ACTIVITY IN SOLUTION
HC1 M Oxalic Acid M Gross (%) Zr (*) Cb (%)
0.54 None added 0.4 0.4
0-53 None added 0.4 0- 1
0-049 None added 0-4 0-3
0.047 None added 0-4 2- 1
0-54 1 0- 1 20. 17
0-52 1 0-01 29. 22
0. 127 1 0-001 87. 81 58. 60 42. 50
0-048 1 None added ... 67. 96 100. 100
163

100
Zr
80
60
5 40
20
00
FIG. 44
SEPARATION OF Zr AND Cb ON DOWEX A-l RESINELUTED WITH IM HCI AND 0.001 M OXALIC ACID
Cb
8 10 12
COLUMN VOLUMNS OF ELUTE
14
NOT CLASSIFIEDDWG. 7310
18 20

samples will be equilibrated with IAW to compare the distribution of gross
gamma, Zr and Cb.
A series of batchwise counter current equilibrations has been made using
four stages with full Hanford activity level IAW, The silica gel from these
tests should prove useful in detecting effects of radiation in solution on the
sorption capacities of the silica gel. In one such test a portion of the
silica gel had received the equivalent of 10 curie hours of radiation from the
absorbed activities without appreciable change in the equilibrium distribution
of the gross gamma activities. More analytical data are being obtained from
this test^,
7. Program, It is expected that by September the following additional
information will be available %
1, Analyses of Hanford dissolver solutions for Zr and Cb to show the
amounts which are available,
2, Adsorption studies on dissolver solutions after an oxidation treat
ment to minimize the contamination of Zr and Cb with Pu„
3, Capacity tests on silica gel, Vycor and anion exchange resins for
Zr and Cb,
4, Data on the stability of silica gel to irradiation,
5, Column studies to investigate the operability and reproducibility
of the process which will be proposed,
6., Scouting of methods for the separation of Zr-Cb from wastes exist
ing at Hanford from the present Pu separation process.
165

PHYSICAL CHEMISTRY AND
CHEMICAL PHYSICS
166

SPECTRA OF THE HEAVY ELEMENTS AND RARE EARTHS SN CRYSTALS AND SOLUTIONS
Simon Freed and C, J. HochanadeI
This work was discontinued at ORNL about the middle of May because of the
departure of Simon Freed, Communications on some of the work will appear in
forthcoming journal articles, while a number of miscellaneous observations
are summarized below.
The methods for preparing liquid solutions of salts at the boiling point
of nitrogen and for measuring the spectra have been described in previous ORNL
quarterly reports (ORNL 176 and ORNL 336), Solutions of the following rareearth salts were successfully prepared and the spectra measured at -196° C
and in most cases also at -79° C„
PrBr3-6H20 NdBr8-6H20 Nd (N03 )3-6H20 NdBr3
SmBr3-6H20 Sm(N03)3-6H20 EuBrs 6HS0
GdBr3 -6H20 TmBra-6H20 Eu(N0S)8 -6H2 0
TbBr3°6H20 was not sufficiently soluble at this temperature to be measurable
in a 25 cm optical path. Also, our preparations of anhydrous EuBr3 were very
dark in color and not sufficiently soluble to be measured. The solvent employ
ed in all of these solutions consisted of n-10% n-propyl alcohol and "-45%
each of propane and propylene, A solution of U02(N03}2 -n-H20 was made up ina solvent consisting of ~6$ di-n--propyl ether in an equal mixture of propaneand propylene. The spectrum at-196° C showed somewhat more and narrower bands
than at room temperature. Howevers there were probably a number of different
species in solution thereby preventing any pronounced sharpening.
In addition to these salts, several biologically important materials were
studied including /3-carotene, chlorophyll A and chlorophyll B, These materials
were dissolved in equal volumes of propane and propylene. The spectra at
-196° C differed from those at room temperature in the number, sharpness andrelative intensities of the bands. Also, at low temperatures the bands were
displaced toward long wave lengths.
At the start of this work it was necessary to make a rapid study of thebehavior of various mixtures of solvents at low temperatures. In Table I are
listed the mixtures studied. The relative viscosities were measured by compar-
167
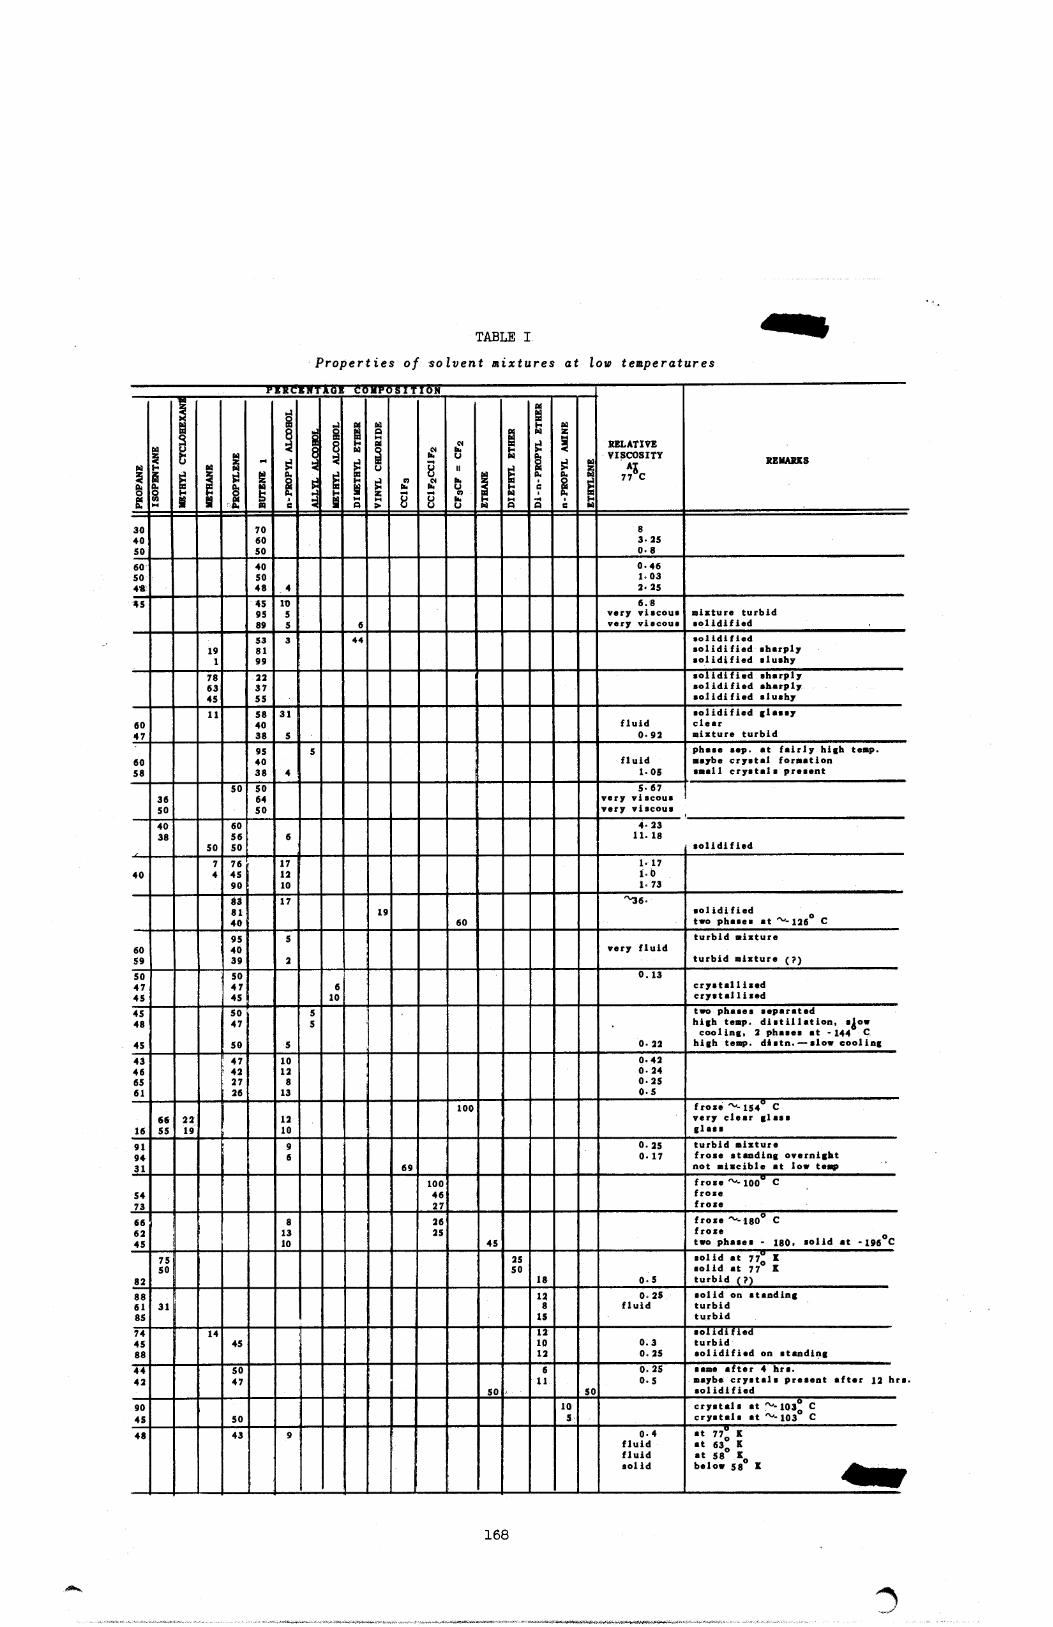
TABLE I
Properties of solvent mixtures at low temperatures
— fybwhtIgr eokT6si?i6N
RELATIVE
VISCOSITY
N
E
1-
&09M
a
S3
M
a
aS3
J
i8
53
ie
8
S3
§8
$J
aHH
sin
Sia
HaM
OS
u
532
>
1?
8
s
0
U
II
hUtotMU &
M
a
1a.
e
Q
w2
sip,
•
e U
REMARKS
30
40
SO
70
60
50
8
3-25
0-8
60
50
4*
40
50
48 .4
0-46
1.03
2-25
45 4595
89
10
5
5 6
6.8very viacouavery viscous
mixture turbid
solidified
19
1
53
81
99
3 44 solidified
solidified sharplysolidified slushy
78
63
45
22
37
55
solidified sharplysolidified sharplysolidified slushy
60
47
11 58
40
38
31
5
fluid
0-92
solidified glassyclear
mixture turbid
60
58
95
40
38 4
5fluid
1-05
phase sep. at fairly high temp-maybe crystal formationsmall crystals present
36
50
50 50
64
50
S-67very viscousvery viscous
'
40
38
50
60
56
50
6
4-23
11. 18
solidified
40
7
4
76
•«90
17
12
10
i-17
10
1-73
83
81
40
17
19
60
^36-solidified
two phases at ~-126 C
60
59
95
40
39
5
2
very fluidturbid mixture
turbid mixture (?)
50
47
45
50
47
45
6
10
0.13crystallisedcrystallised
45
48
45
50
47
50 5
5
5
0. 22
two phases separatedhigh temp, distillation, slowcooling, 2 phases at -144 Chigh temp, distn.— slow cooling
43
46
65
61
• 47
42
27
26
10
12
8
13
0.42
0-24
0-25
0-5
16
66
55
22
19
12
10
1100 frose ~-154° C
very clear glassglass
91
94
31
! 9
6
69
0.25
0. 17
turbid mixture
frose standing overnightnot mixcible at low temp
54
73
100
46
27
frose ~- loo" Cfrose
frose
66
62
45
8
13
10
26
25
45
frose ~-180° Cfrose
two phases - 180, solid at -196 C
82
7550
25
50
18 0.5
solid at 77° Ksolid at 77 Kturbid (?)
88
61
85
31ia,8
15
0-25
fluid
solid on standingturbid
turbid
74
45
88
14
45
ii10
12
0.3
0.25
solidified
turbid
solidified on standing
44
42
50
47
50
6
1150
0.25
0.5
same after 4 hrs.
maybe crystals present after 12 hrs.solidified
90
45 50
10
5
crystals at y- 103° Ccrystals at "^ 103 C
48 43 9 0-4
fluid
fluid
solid
at 77" Kat 630 Kat 58 KQbelow 58 K ^Im^gs^sjMm
168
0

ing the time to empty a small bulb through a fine capillary under a pressure
differential of one atmosphere of helium.
The mixtures which proved to be the most satisfactory at -196° C were:
(a) ~50% propane, ~50% propylene;
(b) ~10% n-propyl alcohol, ~45% propane, ""45% propylene;
(c) ~"6% di-n-propyl ether, ~44% propane, ""50% propylene.
In each of these the proportions of propane to propylene can vary over a wide
range with little change in viscosity. Solvent (b) was used for preparing
most of the solutions. It was found to remain fluid a few degrees below the
freezing point of nitrogen (-210° C)„
A liquid in glass thermometer was constructed from pyrex glass filled
with a mixture of equal volumes of propane and propylene. This thermometer
behaves very nicely down to at least -210° C or about 25° beyond the useful
range of the commercially available "pentane"- thermometers. The 4 mm I,D,
pyrex tubing used forthe thermometer bulb has satisfactorily withstood the "°10
atmosphere vapor pressure at room temperature,
EXPERIMENTS WITH MOLECULAR BEAMS
E, H. Taylor, P. J. P. Chastagner
The work of the quarter has been in two directions, development of a
neutronactivation method for measuring bromine, and simple, orienting experi
mentation with molecular beams. In addition, the construction in the shop of
the apparatus for scattering-react ion experiments has been practically finished.
The neutron-activation method for measuring bromine deposited from beam
experiments was previously reported to require a chemical separation of the
bromine, because of the high counting rate after irradiation of even the
supposedly best material for a collector foil, polystyrene It has been decided
to use a separation by volatilization in vacuo, since this appears likely to
be the most nearly quantitative type of separation. Preliminary experiments
169

have shown the essentials of a satisfactory procedure, and it remains only to
confirm the accuracy of the separation on known amounts of radio-bromine.
A typical experiment was as follows: A minute amount (probably less than
a microgram) of KBr was evaporated onto a short fibre of fused silica which
was then irradiated overnight in the pneumatic tube of the pile. After a few
hours cooling, the fibre was transferred to a silica tube connected to a glass
system which was then evacuated. Gaseous Br2 (roughly 10"e mole) was admitted
from an ampoule through a break-seal and allowed to exchange with the activat
ed sample. The exchange was carried out for 8 minutes at a temperature (obtain
ed by flaming) of roughly 600° C, as judged by the color of the silica tube.
The gaseous Br2 was then allowed to react witha film of K deposited previously
in vacuo on a glass disc. This was then removed and counted with a standard
end window G~M tube.
The first conclusion from this experiment is that Br2 gas does exchange
with KBr at a measurable (although yet unknown) rate at about 600° C, as shown
by the counting rate observed, 2600 c/m (fourth shelf, 2,4% geometry) 14 hours
after removal from the pile. Second, the separation appears quite clean, for
only three half-lives were observed inthe decay of the sample, two correspond
ing to the bromine activities of 4.4 and 34 hours, and one, showing no decay
apparently being the long-lived chlorine of half-life about 10e years. Since
no pains were taken to clean the fibre before irradiation, it appears that
extraneous activities (except halogens) are sharply eliminated by this method.
The exchange proceeds also at much lower temperatures, being appreciable in an
hour at about 300° C.
Potassium was not entirely satisfactory as a mount because the hydroxide
formed in air from the excess metal is hygroscopic. Calcium appears to be
better and has the further advantage of a much lower vapor pressure. Sliver
was tried but proved slow in reacting with the Br2,
Molecular beams have been produced in a glass-metal apparatus to learn
something of techniques and to test ovens and collectors. Zinc, K and KBr
have been used, and such details as oven temperatures and collector temperatures
studied in a preliminary way, using the visible spots produced after fairly
long collection to characterize the sharpness of the beam.
170

Details of possible interest include the facts that Zn and K are not
condensed at every collision with glass at room temperature, and that Zn at
least is rather mobile on glass at temperatures not far above room temperature.
CALORIMETRY OF RADIOACTIVITY
G, H„ Jenks, F„ H Sweeton
As stated in the previous quarterly report, this group has undertaken to
design and construct an extremely sensitive calorimeter to be used in the
study of easily absorbed nuclear radiations and also to be used to test the
feasibility of a calorimeter of similar design and sensitivity but containing
enough mass to absorb hard gamma radiations. The high sensitivity is to be
achieved, through the use of liquid helium.
Design and construction of this calorimeter have now been completed. The
assembly of the necessary auxiliary equipment such as Dewar flasks and liquid
helium transfer tubes has also been completed, No tests of the calorimeter
with liquid helium have as yet been made. However, to the extent possible
using liquid nitrogen,, the various parts of the calorimeter have been tested
and found to be satisfactory.
In principle and, in many respects, in design, the present calorimeter is
similar to the /3-calonmeter developed by Cannon and Jenks ^ ' - The /3-calori-meter operated at the temperature of liquid nitrogen and. used the rate of
vaporization of nitrogen,, under constant pressure, as a measure of the heat in
put. The calorimeter just completed, which will be called the He calorimeter,
is planned to operate in the same manner but with the liquid nitrogen replaced
with liquid helium.
Several factors tend to make a calorimeter of this type more sensitive
when liquid helium is used than when liquid nitrogen is used. The product of
the heat capacity of the calorimeter and its temperature fluctuation determines
the quantity of heat which can be stored in the calorimeter and not appear as
(1^C, V. Cannon and G. H. Jenks MonC-410, October 16 1947
171

a change in the volume of vapor. This factor in turn determines the length of
time required to carry out a rate observation and limits the sensitivity of
the calorimeter. Temperature fluctuation in the liquid in every case is deter
mined by the degree of control of vapor pressure' over the liquid, but dT/dP
for liquid helium is smaller than that for liquid nitrogen by a factor of about
ten. In addition and more important, the heat capacity of most substances at
4° K is 10 to 10 times less than at 77° K, An increased sensitivity of 10s
to 10 is then indicated for a calorimeter operating at. the lower temperature,
In order to achieve this increased sensitivity, variations inbackground gas
evolution from the calorimeter must be held to an amount which is negligibly
small compared to that caused by the heat input of the source. Also, it must
be possible to measure the rate of gas evolution from the calorimeter with
sufficient accuracy at the low heat inputs. Considerations of these two factors
have, to a large extent, determined the design of the calorimeter. An outline
of the design of the He calorimeter follows No drawings of the calorimeter
are included, but the report on the /3-calorimeter by Cannon and Jenks contains
a drawing of a calorimeter of the same general nature. The container in which
the heat source (resistance heater or radioactive sample) and a few ml of liquid
helium are to be placed in a closed copper cylinder having an I.D, of 11.4 mm
and an internal depth of 30.8 mm. The walls are about 1 mm thick. This con
tainer is suspended by means of a stainless steel tube (,025 in. 0,D,, ,019 in,
I,D„) within a larger copper cylinder. The small tube also serves as a connec
tion between the space in the inner cylinder and the pressure control and gas
measuring device which is outside the calorimeter and at room temperature.
Connections are provided so that the space between the two cylinders can be
highly evacuated or filled with helium gas for temperature equilibration pur
poses. For heater connections, two manganin wires, 003 in, in diameter, pass
from the outer cylinder into the inner one through platinum-soft glass seals.
The combination of the two copper cylinders will be called the calorimeter
flask.
The calorimeter flask is surrounded by a closed stainless steel Dewar type
flask which is to be filled with liquid helium. Provisions are made for con
trolling the pressure of vapor over the liquid in this flask. Surrounding the
172

stainless steel container is a glass Dewar flask which is to be filled with
liquid helium and which is open to the atmosphere. This flask in turn is
placed in another glass Dewar which is to contain liquid nitrogen.
Computations indicate that with above design the background heat input to
the calorimeter can be held to 10~8 cal/sec or less if the temperature of theliquid in the bath surrounding the calorimeter is within 5 x 10""* deg of the
calorimeter temperature. To maintain the bath and calorimeter temperatures
equal within the 5 x 10~4 deg, it is only necessary that the difference invapor pressures over the two liquids be less than 0.5 mm. This degree of
control of relative pressures is quite feasible with the pressure control
apparatus which has been developed for use with the calorimeter.
The question of measuring the rate of gas evolution (~0.4' cc/hr for a
heat input of 10" cal/sec) from the calorimeter remains to be discussed. The
problem in this case is that of leading the gas from liquid helium temperature
through the liquid-vapor interface and out toroom temperature in such a manner
that changes in temperature distribution along the tube conducting the gas
remain negligibly small. The device shown in Fig. 45 was constructed for that
purpose. It consists oftwo different lengths of heavy copper rod sealed with
in a silvered glass sleeve. The two rods and the glass sleeve are identified
in the drawing as A, B and D, respectively. A 25 mil stainless steel tube,
through which the gas from the calorimeter passes, is soldered along the length
of the two rods and projects beyond the copper at each end. The copper rod at
B' is soldered to the cap of the stainless steel Dewar, and the small tube at
this end connects with the calorimeter. The copper at A' is in contact with
air at room temperature, and the steel tube at A' joins the pressure control
apparatus.
In operation, liquid helium will cover the glass vacuum jacket to a point
near the break in the copper rod. The rod B will then be at liquid helium
temperature andthe rod A at room temperature. All of the temperature gradient
in the small tube should then occur along the 3 cm section at C and differences
in liquid level around the jacket should not effect the temperature gradient
appreciably.
In addition to the above apparatus, two new pressure control systems for
use with the He calorimeter have been assembled. However, the design of each
is similar to that of the pressure control apparatus used with the /3-calorim-
eter and will not be described here.
173

j I". -j ~'
C
D
B
s V
B'
FIG. 45

^^i~^&^gwmim^-f<*H*-•*•• •
MICROWAVE SPECTROSCOPY
Ralph Livingston
A cooperative program in microwave spectroscopy has been initiated be
tween the Laboratory and the Duke University Physics Department where Dr. Walter
Gordy has had an extensive microwave program under way for some time. He and
his co-workers are handling the microwave aspects of this new program with
the Laboratory, The ORNL Chemistry Division is handling the synthesis of need
ed radioactive compounds and assists in carrying out actual measurements at
ORNL, Microwave spectrometer development work is done at Duke,
This report will deal primarily with the chemistry aspects of the work
and to some extent with the actual setting up of equipment and the making of
measurements at ORNL. The purpose of the first studies undertaken is the
measurement of the nuclear spin, quadrupole moment and magnetic moment of
several iodine isotopes. The iodine measurements are made by observing the
spectra of a rotational energy transition of methyl iodide,
Chemistry. The initial specifications set on the methyl iodide synthesis
could only be formulated approximately since spectrometer development for the
study was at an early stage. The purity requirements likewise could not be
established definitely. However, taking into account the general availability
of radioactive iodine isotopes, and the degree to which spectrometer develop
ment could reasonably be pushed in a short time, it appeared that the first
work on I128 should be done on a level in the vicinity of 10 micrograms of
total iodine isotopes per experiment with this quantity reduced, if possible,for later experiments on shorter lived iodines. The methyl iodide should be
quite free of foreign gases to minimize pressure broadening effects on thespectral lines. The desired isotope should be present in at least 10% relativeabundance, and if possible much higher. The chemistry should also be easily
resolvable to remote control techniques.
The general chemical method considered was to react the iodine, as an
alkali iodide, with dimethyl sulfate or methyl p-toluenesulfonate (methyltosylate) so as to obtain methyl iodide requiring little or no subsequentpurification. Methyl tosylate was preferred to dimethyl sulfate because ofits reported lower vapor pressure and lesser toxicity. Work centered about
175

the organic part of the synthesis. It was believed that the inorganic part of
the synthesis could be developed after a suitable organic method was found.(? "*,)
Initial work was patterned after standard methods in the literature* »/
Two macro-scale experiments were carried out by dissolving 20 g potassium
iodide in 90 ml water, adding 22.4 g methyl tosylate and distilling off the
product methyl iodide. Considerable water also distilled over, and it was
immediately apparent that a non-volatile solvent was needed if the methyl
iodide was to be used without further purification.
All subsequent work was with butyl phthalate as the solvent. Methyl
tosylate was found miscible with butyl phthalate, but sodium iodide is in
soluble in butyl phthalate.
Three experiments were carried out on a one gram sodium iodide scale.
The apparatus consisted of a 200 ml round bottom flask sealed directly to the
bottom of a four bulb reflux condenser. A 19/38 standard taper joint at the
top of the reflux condenser was connected to a U-tube trap which could be
cooled in liquid nitrogen. The exhaust side of the trap was connected to a
mechanical vacuum pump and to a closed tube manometer.
In the first experiment one g sodium iodide was placed in the flask and
90 ml butyl phthalate poured over it. Two grams of methyl tosylate was added
and the system was evacuated to about one mm. The trap was cooled in liquid
nitrogen. The reaction mixture bubbled vigorously. After the initial bubbling
stopped, the reaction mixture was warmed, and the mixture allowed to bubble for
about one hour more. About 0.1 cc of product weighing 0.26 g was poured from
the trap. Its refractive index was 1.505 compared with the accepted value of
1.529 for methyl iodide. It appeared that methyl iodide was synthesized, but
considerable impurity was present, either from the reagents or from complicat
ing reactions. The residue in the reaction flask contained considerable-white
flocculent material, presumably sodium p-toluenesulfonate.
In the second experiment the butyl phthalate was first freed of volatile
matter by refluxing under vacuum for one hour. The experiment was carried out
with 1.0 g sodium iodide to which was added 50 g of butyl phthalate containing
2 g methyl tosylate. About 0.13 cc product weighing 0.35 gwas collected. Its
refractive index was 1.524' and the odor was like that of methyl'iodide. The
(2)Peacock and Memon, Quart. J. Indian Chem. Soc. 2, 240 (1925).
(3)Tipson, J. Org. Chem. 12, 133 (1947).
176.

wm!0t&m«fW>tm!m&mmm&t&;r.-
yield of product collected was 37%. In a third experiment lasting three hours,instead of one hour as previously a 58% yield of methyl iodide was collected
from the trap.
The procedure was next tried on a smaller scale. A new series of experiments was started using a microwave spectrometer, supplied by Dr. Gordy, as an
analytical tool. It operated in the 4 mm (75,000 Mc) region, and the J = 4-* 5transition of methyl iodide was observed. The energy was obtained by triplingfrom a K band klystron (2K33). The absorption cell was one meter of J bandguide (0.276-x 0.124 I.D.) having a volume of 22 cc. The optimum pressure ofmethyl iodide was about 10~2 mm. The wave guide cell was cooled in dry ice to
give greater sensitivity.
Four experiments were conducted. The general method was to prepare
reagents and set up all glassware needed for a single methyl iodide experimentThe microwave spectrometer was next put into operation and "peaked up"' usingcommercial methyl iodide. As soon as all equipment was operating correctly,the methyl iodide was pumped from the wave guide cell. The progress of thepumping could be followed by observing the spectral lines on the spectrometeroscilloscope. The experiment was then carried out and the synthesized methyliodide immediately transferred to the wave guide cell. The intent was to usesuccessively smaller quantities of sodium iodide in each experiment and stilltry to get good methyl iodide lines on the oscilloscope.
The glassware used was similar to that developed for radioactive experiments as shown in Fig. 46, The experiments were carried out on a high vacuumsystem. The reactor was the same 200 ml round bottom flask sealed to a fourbulb reflux condenser which was used in the previous macro-scale runs. A sidetube was sealed to the flask and to this was connected the ampoule of reagentsneeded for an experiment. The connection was first made with a standard taperjoint, but later the ampoule was sealed directly to the side tube. Reagentampoules, to be described more fully later, were made by attaching a break offseal to a 20 ml flask. The ampoule was loaded through a small side tube withthe solution of methyl p-toluensesulfonate in butyl phthalate, evacuated andthen sealed off. The ampoule was next provided with a magnetic break offplunger (iron nail sealed in glass tube) and connected to the reactor. Thedesired amount of sodium iodide, usually as an aqueous solution, was placed inthe bottom of the reactor vessel, and the unit was connected to the vacuumsystem and pumped on until all water was removed. A small deposit of dry
177

A M f •
*
\. I
' 1
t / ••
V
..K/T'OR
/ i
l.„,~
^pX
/ •/
': p '' "X
\ FC hAi »D NC
! SA UP I F
/X._ >~>rsr* t,Ai r i <v '- i,••"^ i v.'V */'' r L A a A
A f 1 •"--1
*• • a a kN
xK
..., ;,„t f. ^
IN Al.AS'~ xib^XX-AXX
XXAAX
W-\^X X\\\'X •
\
DflN-c tq KEEP PLUNGER IN '
MlV! r (...'U L L

sodium iodide was left on the bottom of the reactor flask. The synthesis was
carried out by breaking the seal on the ampoule and allowing the reagents to
flow over the sodium iodide deposits. The solution was flash boiled for
several minutes and the product transferred to the wave guide cell. To
facilitate measuring small quantities of sodium iodide a standard solution of
sodium iodide in water was made up to contain just 100 /xg iodine per ml.
In the first run 200 ,ug iodine as sodium iodide was used, The ampoule,in this case, was made from a 50 ml flask and contained 1.65 g methyl tosylatein 27.5 ml butyl phthalate. The product formed was led directly to the waveguide cell. A few very broad lines were seen with difficulty. The linessharpened and then disappeared when the cell was pumped on. The very badbroadening effect observed indicated the presence of considerable foreign gas.The butyl phthalate was freed of volatile impurity by refluxing under highvacuum for six hours, and a second experiment was carried out. In this secondrun 50 /xg iodine was used with an ampoule of reagents containing 1,3. g methyltosylate in 25 cc of the purified butyl phthalate, The vacuum line was alsomodified. Instead of taking the methyl iodide directly from the reactor andintroducing it to the wave guide cell, a small trap of about 25 ml volume wasincluded. The synthesized methyl iodide was first condensed in the trap, cooled in liquid nitrogen, the trap isolated from the reactor by a stopcock, andthen the trap warmed to dry ice or room temperature and opened to the waveguide cell. This procedure greatly improved the volume efficiency of themethyl iodide transfer and was used in all subsequent work. Methyl iodidehas an appreciable vapor pressure at dry ice temperature At first it wasfelt that warming the trap to dry ice instead of room temperature would holdback traces of less volatile materials. This was later found to be unnecessary. In this second run, methyl iodide lines were seen, but they were stillbadly "pressure broadened".
Both organic chemicals were vacuum distilled in all glass equipment.The pressure during the vacuum distillation was maintained well under 10" mm.Both materials distilled very smoothly. A solution of 3,20 g methyl tosylatein 100 ml butyl phthalate was made up and 15 ml of the solution used perampoule in subsequent runs. Prior to sealing the ampoules off on the highvacuum line, they are heated and the solution allowed to boil in order to
179

effect further degassing. In Run 3,50 pg iodine was used. The methyl iodidesynthesized gave good lines in the spectrometer. The quantity of methyl
iodide appeared slightly high for optimum line sharpness. In Run 4', 15 pgof iodine was used. The reaction mixture was flash boiled intermittently over
a four minute period in this run. It was found that in this period of time,
most of the methyl iodide comes off. The lines obtained were at optimum sharp*-
ness and were fully as good as lines from commercial methyl iodide. It was
estimated that two-thirds of the volume of the trap-wave guide cell system was
outside of the wave guide cell proper. Hence, if the trap and connecting tub
ing volumes could be made small compared to the wave guide cell, an experimenton a 5/jg scale might give equally good results on this analytical spectrometer.
Rather than go below a 15 pug level at this time, it was decided to set up forT129
running I
The final reactor developed for radioactive iodine experiments is shown
in Fig, 46a. The reactor is a 200 ml round bottom flask sealed to a three bulbreflux condenser. There are two side tubes from the flask. To one pf these
is sealed the ampoule of reagents. The other is used for introducing the solution of sodium iodide from a pipette. Once the iodide is.added, this side
tube is sealed off. The ampoule design is shown in Fig. 46b. The ampoule is
made from a 20 ml flask. To this flask is sealed the break off and a side tube
for filling and evacuating. The side tube is located so that when it seals toa vacuum system, prior to sealing off, the solution in the ampoule can be boiled by heating with a burner. The iron plunger is shown in place in Fig. 46-.It is actually put in place after the ampoule has been filled and sealed off.It is prevented from falling out by three small dents formed in the glass tube.
The Spin of I120. All equipment was rebuilt and the new spectrometerbrought from Duke University by Dr. Gordy. The equipment was set up in a largehood as shown in Plate I. Lead bricks were piled around the spectrometer andglassware, not for the I129, but for use in later runs with shorter livedactivities. The new spectrometer operated in the 6,75 mm region (45,000 Mc )and the J = 2-» 3 transition was worked with rather than the J = 4-* 5 in orderto give a simpler spectrum to analyze. This was expected to prove especially
180

•>1
81
helpful if the iodine spins involved proved to be high. The equipment shown
in Plate I includes the klystron power supply and saw tooth modulator in the
relay rack at the right, the detector high gain amplifier and oscilloscope,
and further to the left, the Pirani gauge and lead bricks which surround the
spectrometer proper. The vacuum system is at the rear of the hood to the left.
The wave guide cell was a coil of I band guide (0,i&0 in. x 0.086 in. I.D. )
about two meters long and immersed in dry ice. Its volume was about 20 cc.
Five runs were carried out. The fission produced I was isolated by
G. W. Parker and G„ Heberto The first sample used was an iodide solution
containing a considerable excess sodium sulfite and some excess sodium hydroxide.
Only two lines were seen on the oscilloscope with difficulty, and it was
apparent that considerable foreign gas was present. The chemical yield was
also low. This was checked roughly by following with a G-M probe the trace of
I1 %which was present in the original iodine sample. In the later work
samples of iodine in carbon tetrachloride were obtained. This was extracted
with very dilute sodium sulfite solution. After extraction the excess acid
was neutralized with sodium hydroxide. This source of sodium iodide contained
far less excess salt than the first sample used, and, as was hoped, the
chemical yield in later runs became high, The presence of foreign gases still
gave difficulty, but the situation was gradually improved by more thoroughly
pumping the dry salt residue in the reactor, preparatory to carrying out the
run, and by more thoroughly outgassing the ampoules of reagents used. Suffi
cient information was obtained from the first four runs to establish reason
ably well the spin and quadrapole moment. The chemistry worked perfectly in
the fifth run and gave complete confirmation of the moments.
The observed spin of I'129 was found to be 7/2. The quadrupole coupling^eQ(B2V/Br2), was -1422 tor which gives a ratio of quadrupole moments of Ii28to I127 of 0.7353, The actual value would be -0.43 x 1Q~24 cm2 using the microwave value for I12 • or -0,34 x 10""34 cm2 if the atomic spectra value for I124is used. More complete details are to appear in a letter to the Physical Review.
Magnetic Moment of I128, The magnetic moment was determined by observingthe Zeeman splitting of the hyperfine structure of methyl iodide. The spectro
meter was rebuilt using a coiled wave guide cell between the pole pieces of a
magnet. Details are shown in Plate II. The cell was coiled so that the magnet-
'ic field was perpendicular to the wide side of the guide or parallel to the E
182

>
>
183

vector of the radiation. This gave transitions with the AM,. = 0 selection rule
and eliminated AMF= ± 1 transitions. The cell was placed in a can that could
be filled with dry ice. It can be seen in Plate II. The reaction vessel with
ampoule can also be seen at the left side of the vacuum system. Two runs were
carried out with I . The chemistry worked ideally. About 10 /ig I2 was used
in the first run and 6.5 ftg in the second. I1"*7 was also run to give a checkon the method. A value of 2.74 nuclear magnetons was found for the i128
moment and is estimated to be within 5$. The sign of the moment cannot be
determined by the microwave method, but it most likely should be positive.
More complete details will appear in a letter in the Physical Review.
Present plans include a redetermination of the magnetic moment to an
accuracy, we hope, of 1%. Work is also underway on studies of the spectra of
Ix as methyl iodide.
184
RADIATION CHEMISTRY
185

DECOMPOSITION OF AQUEOUS SOLUTIONS OF FISSIONABLE MATERIAL
J. W. Boyle, E. H. Taylor
Apparatus has been completed and is being tested for the continuous
measurement of pressures up to 5000 lb/in.2 over solutions in the pile. Itconsists of a stainless steel bomb with removable liner (at present of Pt)connectedto a Statham Transducer which measures the pressure by the deformation
of a wire attached to a diaphragm, the deformation of the wire being followed
by measuring its electrical resistance.
This apparatus will be used to extend to higher pressures and temperatures
the work of E. Shapiro ^' on the decomposition of uranyl sulfate solutions inthe pile.
GENERAL
C J. Hochanadel, D. M. Richardson, E. H. Taylor
The 2 Mev Van de Graaff generator has been assembled and is expected to
be in operation as soon as the system has dried out enough to sustain thevoltage. The work of assembly has been done jointly by members of the PhysicsDivision, the Instrument Department and the Chemistry Division.
Consideration has been given to the design and construction of a calorim
eter for the measurement of energy absorbed from the electron beam, and measure
ments with this will probably precede the use of the beam in chemical studies.Irradiation of solids for studies of stored energy (J. A. Ghormley and H. A.
Levy) and experiments with aqueous solutions (C. J. Hochanadel) are planned asthe first chemical uses of the Van de Graaff machine.
(1)Monthly Progress Reports of the Chemistry Division, Clinton Laboratories, 1945-1946.
186

PHYSICAL MEASUREMENTS AND
INSTRUMENTATION
187
I. ELECTRON AND OPTICAL MICROSCOPY, ELECTRON DIFFRACTION
7\ E. Willmarth, F. D, McNeer, B, I.. Gary
1. Metallography* (a) Berylliumo* Metallographic examination of a ma
chined beryllium rod which corroded in air at room temperature was finished
and a report submitted (CF„ No, 49-3-207), The corrosion product was white
in color and amorphous by X-ray diffraction,, This material, although it could
not be definitely identified, is probably an amorphous' hydroxide formed by hy
drolysis of beryllium carbide present in the .sample,, Beryllium carbide is hy-
drolyzed by steam in approximately 24 hours to give a similar substance.
Another result of the examination of this specimen was the demonstration
of beryllium oxide in the beryllium grains and at the interfaces. The oxide*
identified by X-ray examination by M„ Bredig, occurred in the form of small
inclusions ^ to 3 microns in diameter and 3 to 7 microns in length™ The hex
agonal nature of these inclusions could be seen distinctly with the use of
polarized light at high magnification-
Other beryllium samples, recently submitted by the Technical Division,
are being examined™ One, used as a control in a series of corrosion tests
where extensive corrosion took place, appeared to contain an excessive amount
of beryllium carbide. Another, similar to the material reported on in report
No, 49-3-207, showed a high percentage of the oxide by X-ray and microscopic
examination. Some beryllium grains seemed to contain an abundance of oxide.
Both samples examined exhibited thermal checking, which appeared in some
instances to have taken place apparently at the cleavage planes of the beryl
lium grains rather than at grain boundaries. It is probable that this check
ing took place when sections were prepared on the cutoff wheel or during the
grinding operation,
(b) Corrosion of Beryllium, A large number of macrographs of beryllium,
before and after corrosion, have been done for the Corrosion Section of the
Technical Division,
(c) Assistance has been given the Solid State Section of the Physics Di
vision in the mounting;, polishing and etching of single crystals of copper and
copper-gold alloy,
(d) Additional samples of zirconium have been examined metallographically
in continuation of our studyof metallographic polishing and etching techniques
for this material,
188

2. Chemical Microscopy. (a) A number of samples of uranyl ammonium
phosphate submitted by W. K. Eister of the Technical Division have been ex
amined microscopically to determine crystallite size, size range, and struc
ture in connection with filtration problems.
(b) At the request of the New York office of the AEC a series of samplesof precalcined beryllium oxalate prepared by the Clifton Products Co. have
been examined microscopically to determine particle size and shape.
(c) Electron micrographs of pure chromic oxide, pure red iron oxide, hydrated yellow iron oxide, powdered quartz, hydrated chromic oxide, and mapico
red were made at the request of K-25 to determine particle size, size distri
bution, shape, and degree of aggregation.
(d) Slurry from the filter house has been examined for A. C. Jealous of
Technical Division to determine ultimate particle size.
(e) Electron micrographs of carbonyl iron (spherical) have been taken todetermine particle size and size range.
(f) Determination of particle size and shape of a silicon-aluminum alloy
was made for J. B. Ruch of the Technical Division.
3. Resinography. In cooperation with Dr. G. E. Boyd, work is being con
tinued on a study of the physical characteristics of various exchange resins.
This included several samples of resins (Dowex 50) which have been irradiated
in the pile.
4. Photography. A number of slides were made for members of the Chem
istry Division in connection with meetings and seminars which took place during
this period. Copies of graphs, and pictures previously taken were made on re
quests from various members of the Laboratory and K-25. Color photographs of
the nitride of element 61 were taken at low power. A number of enlargements
of line spectra were done. A series of photographs was taken for the Medical
Division. In addition, approximately 1000 prints were processed.
5. Particle Problem. Electron micrographs of fly ash spill and particles
on CWS filter removed from the pile filter house have been taken for J. Gost of
the Technical Division.
6. K-25. (a) During this period a large number of samples have been
submitted by K-25 in connection with their barrier program. This work con
sisted of both optical and electron microscopy. Because of the secret classi
fication of the material and work involved a report of this activity cannot be
given here. Reference is made to completed reports, C. F. Nos. 49-3-261, 49-
189
4-34, 49-4-83, and 49-4-230,
7. Evaporation of Metallic Films„ A considerable amount of time was
spent in connection with the research work of other laboratory personnel where
the evaporation of metallic films on various surfaces was required. These in
cluded the coating of mica sheets with gold, the coating of formvar films with
gold and silver, coating small bulbs with aluminum, coating plastic cones with
silica, coating Geiger counter part with zirconium, shadow casting polished
metal specimen of beryllium;, and making first surface mirrors with an aluminum
reflecting surface,
8* Research and Development» (a) Some time has been spent in studying
the evaporation of various metals on formvar films with our equipment to de
termine optimum conditions as to film thickness, age, distance, evaporation
time, and current intensity,
(b) A technique of shadow casting directly on metallographically polished
samples is being tried,
(c) Equipment for more efficient photographic reproduction of electron
diffraction patterns, a fixed focus negative reducer for lantern slide product
ion, and a tilting stage for stereo micrographs have been designed and built
during this period.
190
II. INSTRUMENT RESEARCH AND DEVELOPMENT
BETA PROPORTIONAL COUNTERS
C. J. BorkovsH, E. Fainte in
The rate of increase of gas amplification as the center wire voltage is
increased in a proportional counter is strongly dependent on the amount ofpolyatomic gas present in admixture with argon as shown in Fig. 47. The datawere taken with a 7 cm cathode diameter counter and one mil center wire. With
pure argon it is seen that gas amplifications over 1000 cannot be used. Admixture of 10$ methane with the argon gives stable gas amplification up to 10for beta counting. The usual gas amplification for beta counting is between
104 and 106. 50$ argon and 50$ methane will give voltage plateaus somewhatlonger than 10$ methane and 90$ argon but at an operating voltage which is a-
bout 500 volts higher.
Pure methane gives the longest plateaus but at operating voltages whichare 900 volts higher than the 10$ mixture. The higher operating voltages introduce high voltage leakage problems so that it is advisable to operate atvoltages below 2000 volts when using an amplifier with a 1 millivolt input
sensitivity.
In Table I are given the voltage plateaus using various percentages ofargon and methane in a permanently filled counter having a 7 cm cathode diameter and 1 mil center wire. The gas pressure was 1 atmosphere.
Figure 48 shows the effect of wire size and gas pressure on the threshold voltage and plateau of Eck-Krebs type counters. 40 cm pressure of CH4and a£ mil wire give an operating voltage of about 1600 volts, a comfortablylow operating voltage.
The design of a continuous flow type beta proportional chamber which willaccommodate two inch sample plates is shown in Fig. 49. An 0-ring gasket insures a gas tight seal between the slide and chamber.
This chamber is also being used as an alpha proportional counter with excellent results. Two inch sample plates can be used. A point alpha sourcemoved across any diameter on the sample holder shows less than 1$ change counting rate from center to edge.
A method suggested by W. C. Bradley to reduce the distribution of pulseheights out of abeta proportional counter was investigated and found to work
191

900 1500
DWG. 7523
FIG. 47
GAS AMPLIFICATIONFOR VARIOUS GASES
2100CENTER WIRE
2700VOLTAGE
3300192
3900
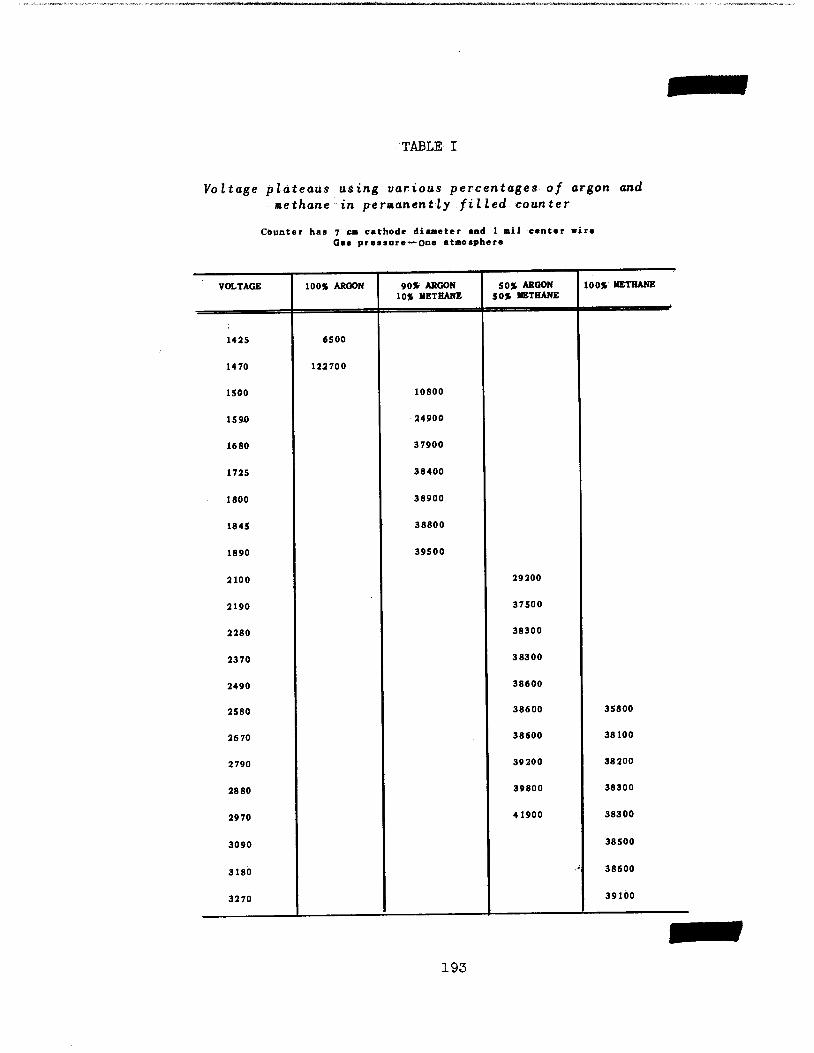
TABLE I
Voltage plateaus using various percentages of argon andmethane in permanently filled counter
Counter has 7 cm cathode diameter and 1 mil center wireGas pressure—One atmosphere
VOLTAGE 100* ARGON 90* ARGON
10* METHANE
5OK ARGON5OS METHANE
100% METHANE
1425 6500
1470 122700
1500 10800
1590 24900
1680 37900
1725 38400
1800 38900
1845 38800
1890 39500
2100 29200
2190 37500
2280 38300
2370 38300
2490 38600
2580 38600 35800
26 70 38600 38100
2790 39200 38 200
2880 39800 38300
2970 41900 38300
3090 38500
3180- 38600
3270 39100
193

160
140
120-
NOT CLASSIFIEDDWG. 7524
FIG. 48
EFFECT OF CENTER WIRE DIAMETER AND GASPRESSURE ON VOLTAGE PLATEAU
1800 2000 2200
CENTER WIRE VOLTAGE
194
2400 2600
O-OO
2800J I
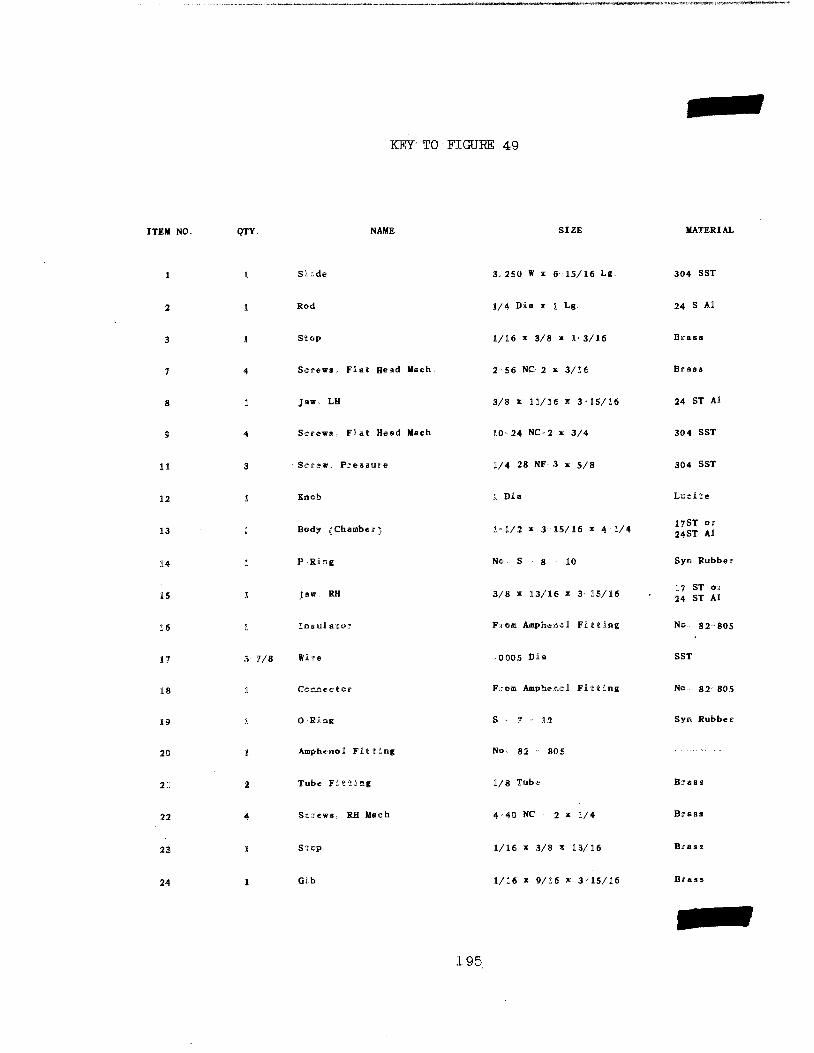
ITEM NO,
9
11
12
13
14
15
16
17
18
19
20
21
22
23
24
KEY TO FIGURE 49
QTY NAME
Slide
Rod
Stop
Screws, Flat Head Mach,
Jaw, LH
Screws. Flat Head Mach
Screw. Pressure
Knob
Body ^Chamber)
P Ring
Jaw RH
Ingaal at@r
3-7/8 Wire
Connector
0"King
Amphentol Fatting
Tube Fitting
Screws. RH Mach
Stop
Gib
195
SIZE
3.250 W x 6-15/16 Lg
1/4 Dia x i Lg.
1/16 x 3/8 x 1-3/16
2-56 NC-2 x 3/16
3/8 x 11/16 x 3-15/16
10-24 NC-2 x 3/4
1/4-28 NF-3 x 5/8
1 Dia
1-1/2 x 3 15/16 x 4 1/4
No S 8 - 10
3/8 x 13/16 x 3-15/16
From Amphsssoi Fitting
0005 Dia
From Amph®ss©i Fitting
S - 7 - 12
No 82 - 805
1/8 Tube
4-40 NC 2 x 1/4
1/16 x 3/8 x 13/16
1/16 x 9/16 x 3-15/16
MATERIAL
304 SST
24 S Al
Brass
Brass
24 ST Al
30 4 SST
304 SST
Lucite
17ST or
24ST Al
Syn Rubber
17 ST or
24 ST Al
No 82 805
SST
No 82 805
Syn Rubber
Brass
Brass
Bras s
Brass
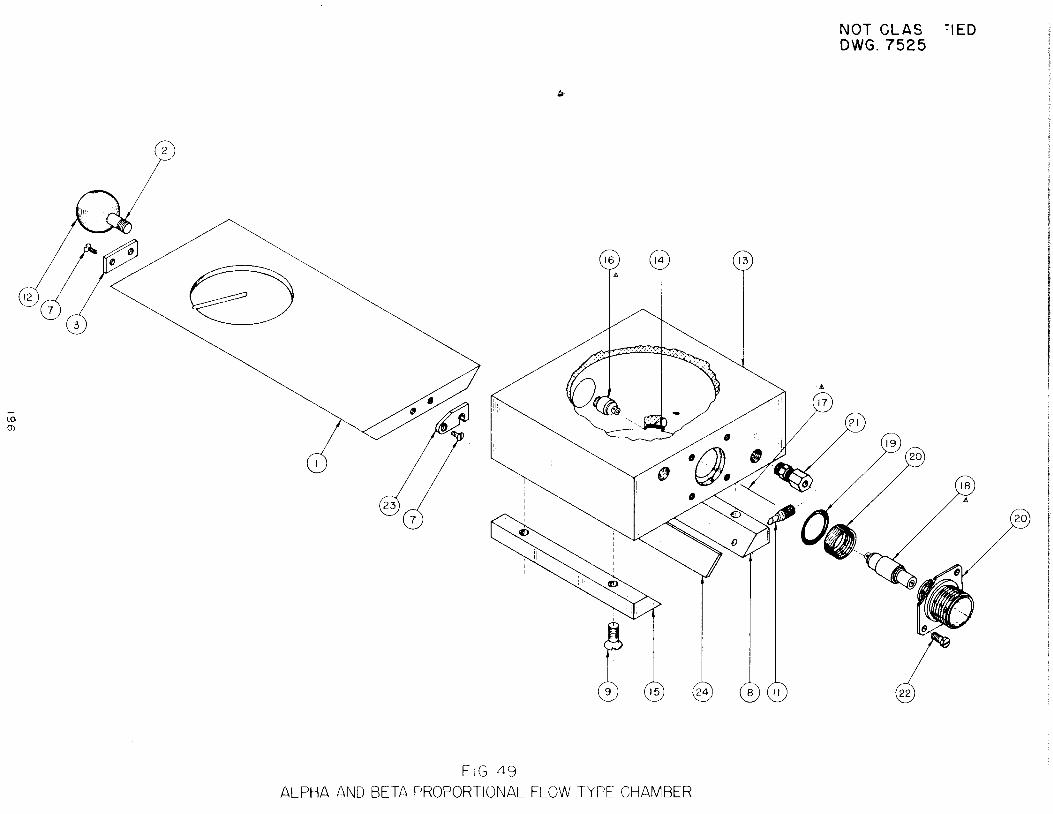
FIG 49
ALPHA AND BETA PROPORTIONAL FLOW TYPE CHAMBER
NOT CLAS rIEDDWG. 7525
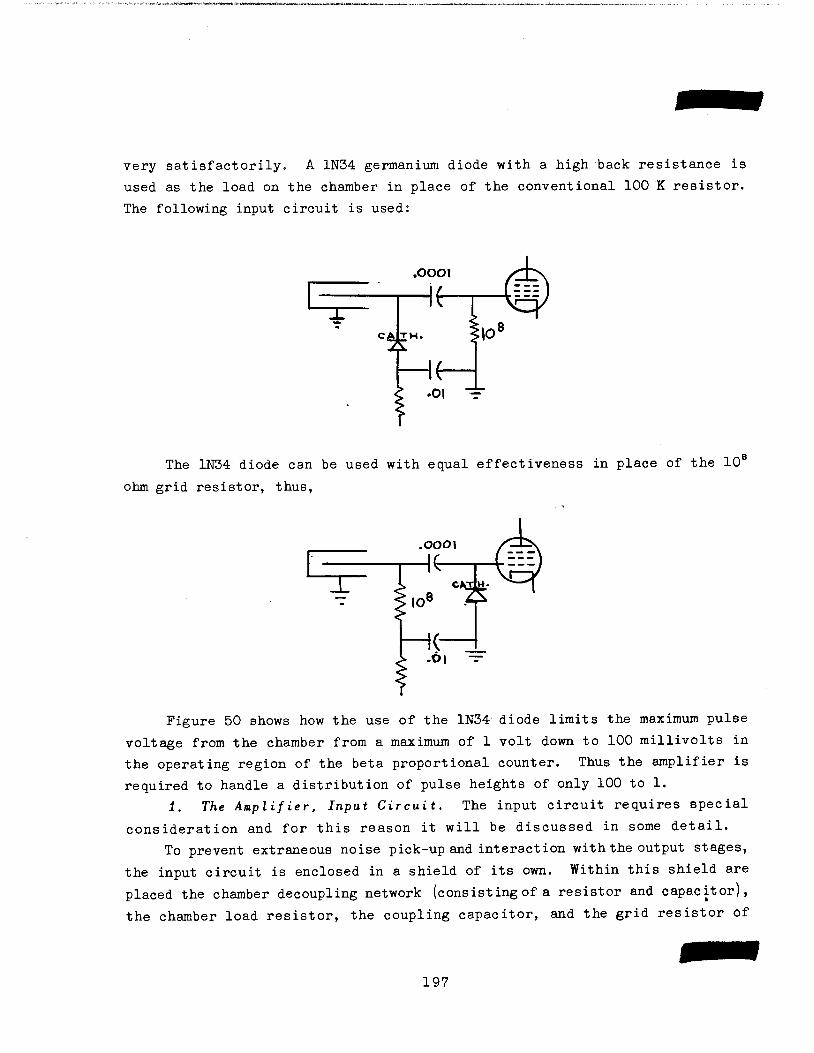
very satisfactorily. A 1N34 germanium diode with a high back resistance is
used as the load on the chamber in place of the conventional 100 K resistor.
The following input circuit is used:
The 1N34 diode can be used with equal effectiveness in place of the 10
ohm grid resistor, thus,
Figure 50 shows how the use of the 1N34 diode limits the maximum pulse
voltage from the chamber from a maximum of 1 volt down to 100 millivolts inthe operating region of the beta proportional counter. Thus the amplifier isrequired to handle a distribution of pulse heights of only 100 to 1.
1. The Amplifier, Input Circuit. The input circuit requires special
consideration and for this reason it will be discussed in some detail.
To prevent extraneous noise pick-up and interaction with the output stages,
the input circuit is enclosed in a shield of its own. Within this shield areplaced the chamber decoupling network (consisting of a resistor and capacitor),the chamber load resistor, the coupling capacitor, and the grid resistor of
197
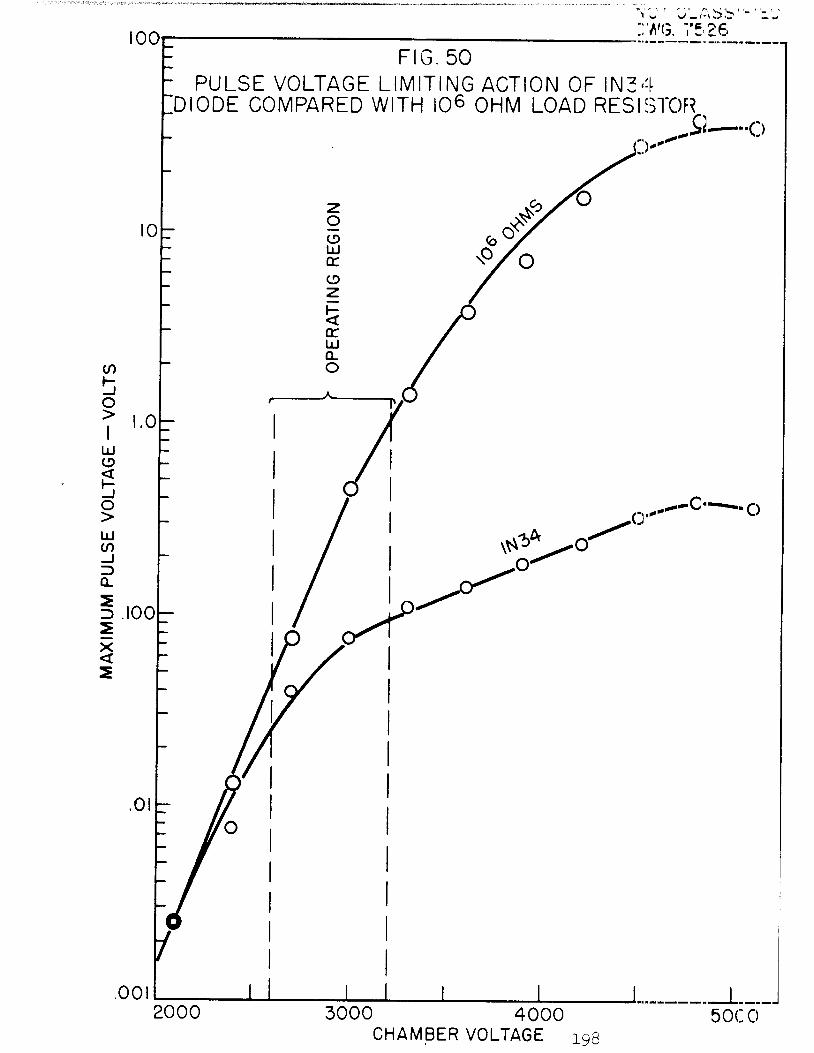
lOOt
; FIG.- PULSE VOLTAGE LIMITING ACTION OF IN34[DIODE COMPARED WITH 10^ OHM LOAD RESISTOR
50
2000 3000 4000CHAMBER VOLTAGE 198
Zm. 75 26
•O
^-C C)
5000

the first amplifier stage. For trouble-free operation, it is also desirable
to shield the decoupling network from the amplifier input„ The various coup
ling resistors are mounted in a manner which results in one end being shield
ed from the other, Grommets are provided for openings through which high volt
age leads pass. This is to reduce the possibility of corona.
The choice of coupling and decoupling capacitors is very important, since
surface leakage and corona losses in these two components will produce spuri
ous counts in the system. The most satisfactory units found to date are the
Centralab type 850 (ceramic) for use as the coupling capacitor,, and the
Plasticon Glassmike type ASG-30 for use as the decoupling capacitor.
In humid climates, it is necessary to treat the surfaces of these units
to further reduce their electrical leakage, ^ ^
The high-voltage and input connectors are also very important., Connectors
with teflon inserts specially designed for low electrical leakage (such as the
Amphenol 82-804 and 82-805) are by far the most satisfactory,.
The surfaces of all the components just described should never be touched
with the bare fingers. Gloves should be worn during installation,
2, Amplifier Requirements, The desirability of a long counting rate
plateau coupled with the continuous pulse height distribution of a beta, gamma,
or X-ray emitter makes it necessary for the amplifier to accept a wide range
of input signals without introducing spurious responses and without blocking,
A linear amplifier is unnecessary, The basic requirement is that the trigger
circuit be tripped once for every pulse which arises in the chamber.
The maximum sensitivity of the amplifier should be such that input cir
cuit noise is just below the counting threshold, For a good amplifier, this
is about 100 microvolts. In actual practice, threshold sensitivities up to
1,5 millivolts are acceptable.
The range of input signal acceptance should, be at least 300 to one before
spurious responses or blocking effects occur, A good amplifier will have an
acceptance range of 1000 to one. An amplifier with this range will have a
plateau length of at least fifteen percent of its threshold voltage, A range
of greater than 1000 to one will afford no improvement,, because the chamber
' ^The usual treatment is described in Methods for Reducing Insulator Noise and Leakage' byFloyd M Glass, ORNL 191

itself produces multiple pulses.
The rise time of the amplifier should be one microsecond or less. The
fall time should be approximately five to ten times the rise time. This fig
ure represents a reasonable compromise between gain, noise transmission, and
dead time.
The gain of the amplifier will normally be determined by the sensitivity
of the trigger circuit which follows it, since the input sensitivity is more
or less fixed. With a trigger circuit sensitivity of250 millivolts, an ampli
fier gain of 250 to 1000 is desirable.
3. Spurious Responses and Blocking. The output voltage of a chamber pro
duced by an ionizing event approximates a step function. When this signal
passes through an interstage coupling network, it is converted to a pulse of
ttheform \,&, (-t/RC) , where V0 is the height of the step appearing at the input
terminals of the coupling network, and RC is the time constant formed by the
coupling capacitor and plate load and grid-leak resistors.
When the signal passes through two such networks, the alternate charging
and discharging of the second capacitor causes the output voltage to cross the
baseline. This effect produces a pulse of opposite polarity to the initiating
pulse, and is known as an overshoot.'2' The magnitude of the overshoot is afunction of the ratio of time constants. For an overshoot of one percent, the
two time constants should differ by 100 to one.
Each additional network produces one more overshoot. Since even numbered
overshoots are of the same polarity as the original signal, they cannot be dis
criminated against, except on an amplitude basis. If they are large enough totrip the trigger pair, they result in spurious responses.
For a signal acceptance range of 1000 to one, it is necessary that the
second overshoot be no greater than 0.1 percent.
In an ordinary resistance coupled amplifier, a large voltage pulse at theinput will cause a tube near the output end of the: amplifier to be driven intothe positive grid region, causing it to draw grid current; when this occurs,the interstage coupling capacitor becomes charged quite rapidly. When thesignal disappears, the discharge of the coupling capacitor through the grid-leak causes the stage to be cut off, usually for a period considerably longer
(2)For complete discussion of overshoots and blocking, see Vacuum Tube Amplifiers, Section3.2 by Valley and Wallman.
200
than the duration of the initiating pulse. This effect is known as blocking,
and results in the loss of small signals which immediately follow a large one.
The effect is to cause a drop in the plateau at the higher chamber voltages.
Blocking effects can be reduced by causing the output stage to be driven
negatively, rather than positively.
The amplifier should consist of two or three stages, (A feedback pair is
considered as one stage). The signal is differentiated at the chamber with a
time constant of approximately one microsecond, and again at the coupling net
work between the amplifier output and trigger circuit input with a similar
time constant. All intermediate coupling networks have time constants at
least 300 times greater, (Differentiation at the chamber is accomplished by
using a low valued chamber load resistor. The time constant is the product
of this resistor and the input capacitance of the amplifier with the chamber
connected). Differentiation at the input prevents blocking effects due to
pulse pile-up at high counting rates, and differentiation at the output attenu
ates noise components arising from hum and microphones,
k, Trigger Circuits, The trigger circuit used with the counter should
be stable, have a sensitivity of about 0,25 volts, respond to one polarity
signal only, be capable of handling large signals without drawing grid current
or producing other undesired responses and should produce a pulse no wider
than the signal causing it, A Schmidt circuit is one type which has these
characteristics and has been used successfully,
5„ High Voltage Power Supply. The high voltage supply must be regulated,
but not to any great degree, A shunt type regulator using one type 6BG6. tube
(with the first and second grids tied together and used as the control grid)
provides ample regulation,
6. Low Voltage Supply, The low voltage supply must be well filtered,
but need not be regulated.
Using a chassis ground return in the heater circuit does not introduce un
desirable hum, Generally, it is desirable to shield the heater lead going to
the first amplifier stage.
In most units, it will be found necessary to provide the amplifier with
r,f, noise filters in both filament and plate leads to eliminate power line
interference, A well built unit will have a zero background count due to line
noise and high voltage leakage over a twenty-four hour period,
7, Scalars and Ratemeters, Scalars and ratemeters will not be discussed,
201
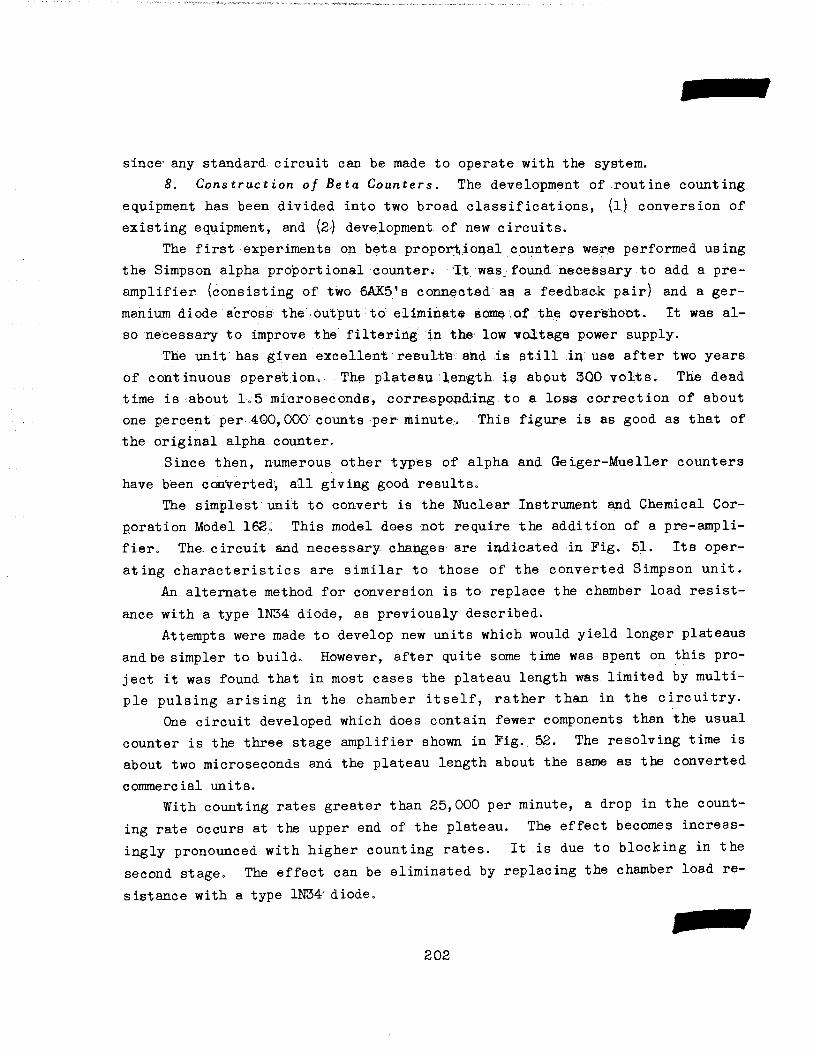
since any standard, circuit can be made to operate with the system.
8. Construction of Beta Counters. The development of routine counting
equipment has been divided into two broad classifications, (l) conversion of
existing equipment, and (2) development of new circuits.
The first experiments on beta proportional counters were performed using
the Simpson alpha proportional counter. It was.found necessary to add a pre
amplifier (consisting of two 6AK5's connected as a feedback pair) and a germanium diode across the output to eliminate some of the overshoot. It was al
so necessary to improve the filtering in the low voltage power supply.
The unit has given excellent result's; and is still in use after two years
of continuous operation. The plateau length, is about 3Q0 volts. The dead
time is about 1.5 microseconds, correspo'ndiing to a loss correction of about
one percent per 400,000 counts per minute-. This figure is as good as that of
the original alpha counter.
Since then, numerous other types of alpha and Geiger-Mueller counters
have been converted', all giving good results.
The simplest unit to convert is the Nuclear Instrument and Chemical Cor
poration Model 162. This model does not require the addition of a pre-ampli-
fier. The. circuit and necessary changes are indicated in Fig. 51. Its oper
ating characteristics are similar to those of the converted Simpson unit.
An alternate method for conversion is to replace the chamber load resist
ance with a type 1N34 diode, as previously described.
Attempts were made to develop new units which would yield longer plateaus
and be simpler to build. However, after quite some time was spent on this pro
ject it was found that in most cases the plateau length was limited by multi
ple pulsing arising in the chamber itself, rather than in the circuitry.
One circuit developed which does contain fewer components than the usual
counter is the three stage amplifier shown in Fig. 52. The resolving time is
about two microseconds and the plateau length about the same as the converted
commercial units.
With counting rates greater than 25,000 per minute, a drop in the count
ing rate occurs at the upper end of the plateau. The effect becomes increasingly pronounced with higher counting rates. It is due to blocking in thesecond stage. The effect can be eliminated by replacing the chamber load re
sistance with a type 1N34 diode.
202
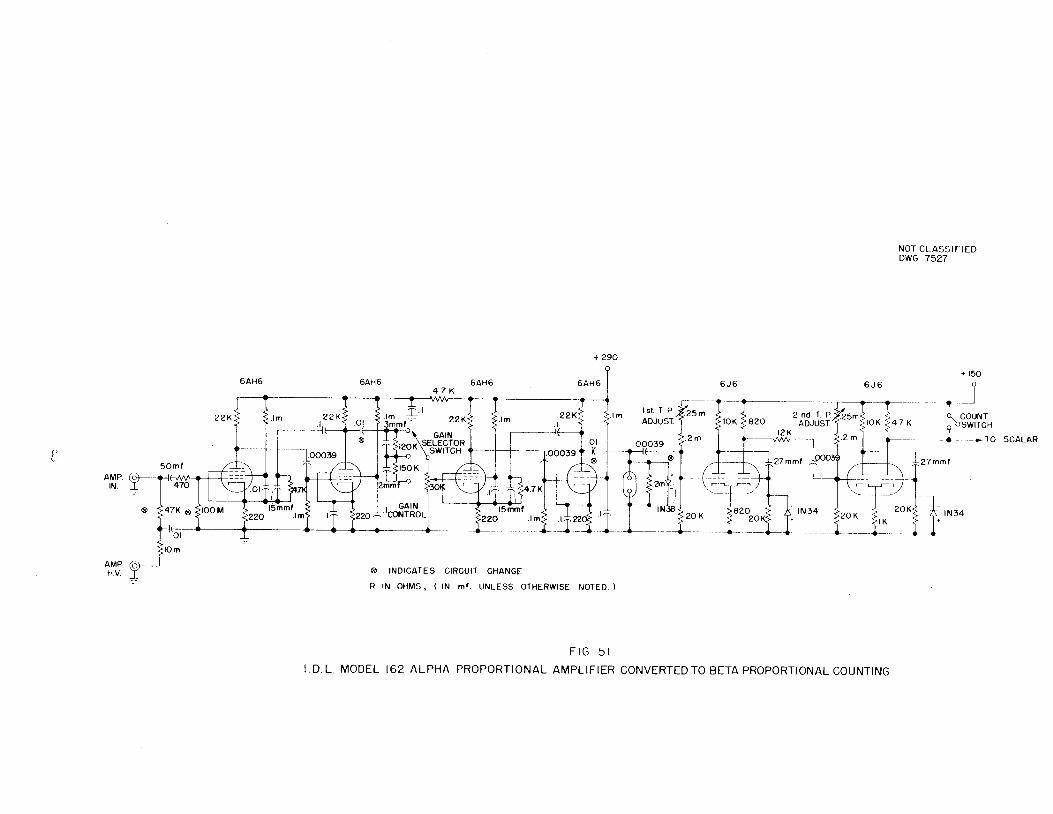
AMP. (o) ^hW-fIN. X
AMRW (6)-H.V. X
6AH6
NOT CLASSIFIEDDWG. 7527
+ 150
® INDICATES CIRCUIT CHANGE
R IN OHMS , ( IN mf. UNLESS OTHERWISE NOTED. )
K 182°20kI |+IN34 t*>K i'°«i 4IN3
FIG 51
D. L MODEL 162 ALPHA PROPORTIONAL AMPLIFIER CONVERTED TO BETA PROPORTIONAL COUNTING
TO SCALAR
o
6AK5
iOmf ;.lm ^22 K
1000
50 270
Hf-
iooc
He
+250
6AK5 27K 6AG5VVVNAA-
47K 6J6
>27K >22K *22K 1 68K |l0K |4.7K10
1000
Hf-
>47K
1.lm
A/W 1
100
27K
TIOmf
I£ ^<I0K .Imf
39K< 100m
.Imf
lOmf
470:>470 1 ?k
*27m_L ^180^,Mmf Mmf
J22K ADJUST
r..01 mf
>IOm
TO H.V.
39 K*
COUNT
SWITCH
R IN OHMS, C IN mmf UNLESS OTHERWISE NOTED
FIG. 52
THREE STAGE BETA PROPORTIONAL AMPLIFIER
NOT CLASSIFIEDDWG. 7528
6AG5
^ -TO SCALAR

It should be pointed out that a combination of blocking and multiple
pulsing can occur in such a way that exact cancellation.of the two effects
takes place. The result is a false plateau which may be twice as long as a
a normal plateau. This effect exists for a small rvange of counting rates only,
and care must be taken to ascertain that the sample used for standardizing the
system doe's riot lie .in this range.
All the counters placed in operation exhibit plateau lengths of fifteen
percent'of the plateau threshold. While this is adequate for all normal appli
cations, a longer plateau would be desirable for use by untrained personnel.
One method for doing this is to use an automatic gain control, which
causes a decrease in amplifier gain with an increase in chamber voltage. The
control voltage for the AGO system can be derived from the high voltage supply
and used for decreasing the screen voltage or increasing the grid bias on one
or more* of the amplifier tubes. A complete system using this method has not
been built, but a few experiments have indicated its feasibility.
A FOUR-CYCLE LOGARITHMIC VOLTMETER
C. J. Borkowski, E. Fairstein, B. Zemel
A four-cycle logarithmic voltmeter circuit has just entered the develop
ment stage. Preliminary tests have given encouraging results.
The intended use for the voltmeter is as an indicator for a ratemeter cir
cuit, although it will probably have other applications as well.
When used with a ratemeter, it will be possible to obtain decay curves
through a counting rate variation of four decades without switching ranges.
It will also provide a means of monitoring in situations where the counting
rate varies between wide limits. •
The advantage of this system over existing systems is that it is expected
to have the low zero drift and permanence of calibration normally associated
with a linear count-rate meter circuit. Its primary disadvantage is its rel
atively high cost.
A description of the apparatus is as follows: A one-cycle logarithmic
potentiometer capable of continuous rotation is mechanically linked to a switching mechanism which trips a micro-switch after each complete revolution. The
205

potentiometer can be turned through four revolutions. Three switches are re
quired. The switches change fixed shunt resistances across the potentiometer.
The potentiometer has a voltage applied to it from a 300 volt power supply.
The switching mechanism makes it possible to derive a voltage from the po
tentiometer which can vary continuously in a logarithmic manner between the
limits of .01 and 100 volts, except for the discontinuities in the immediate
neighborhood of the switching points.
This combination is part of a feedback system. The signal voltage (whichis any voltage we are interested in measuring) and the voltage derived fromthe potentiometer are both applied to a sensing element in such a way that the
sensing element sees no signal when the two voltages are equal. In this case,
the sensing element is a Brown Recorder amplifier whose output drives a servo
motor mechanically linked to the potentiometer. The system automatically
hunts the balance point, the angular position of which is a measure of the sig
nal voltage.
The potentiometer actually used in the test was a linear unit with nineequally spaced taps. Fixed shunting resistances of the proper values wereconnected between the taps to give an approximately logarithmic voltage dis
tribution. The maximum deviation from a true logarithmic distribution was
approximately one-half of one percent.
COINCIDENCE CIRCUIT FOR USE WITH BETA PROPORTIONAL COUNTERS
R. A. Dandl
There has been a need for a coincidence circuit to be used with beta proportional counters. The design considerations stressed in the circuits nowbeing made were stability and flexibility. Since the rise time of the conventional beta amplifiers is in the 0.25 to 0.5 ^-sec region, speed in the coincidence circuit was no problem. Stability was insured by taking two precautions other than the orthodox precautions usually taken. Since the pulsesfrom the beta counter trigger circuit are non-uniform in amplitude, to assureproper operation of the resolution time controlling triggers in the coincidence circuit, the pulses from the counter were used to cut off an amplifier
206
with a diode damped inductance in the plate. Secondly, the coincidence cir
cuit trigger pairs were made as fast as possible, consistent with obtaining
flat topped variable width pulses. The flat topped pulses are important in defining a resolution time and making the coincidence circuit proper non-critical.The coincidence circuit proper which consists of cathode follower driven diode
clamps is very satisfactory. Two gear coupled pots in E.C, circuits in thetriggers allow panel adjustment of the resolution time from 0.15 to 4.0 /a-sec.The usual resolving time is of the order of 0.5 /x-sec in order to avoid missingtrue coincidences resulting from delays due to small pulses triggering at time
"t"< (amplifier rise time) after a large coincident pulse. Several of thesecircuits are in operation and have proven satisfactory for their application.
Figure 53 shows a schematic of the circuit.
207

Or first frjcryer^—II-In &-rfe Cow't^r
/)// 6/IH6 3 on fi/ament supp/ywith oneside- grounded^ffemainmf tubes on suppty **-//* center top connected toUhC
FIG. 53COINCIDENCE CIRCUIT FOR BETA PROPORTIONAL COUNTER
NOT CLASSIFIEDDWG 7309

ANALYTICAL CHEMISTRY
209
IONIC ANALYSES—RESEARCH AND DEVELOPMENT
Summary. The major portion of the work has been directed toward the de
velopment of analytical methods for the various control groups. A new polaro-
graph has been installed in 205 Building for the Pilot Plant Control Group.
It will be used primarily for the determination of uranium in the 25 recoveryprocess streams.
The Precision Dow Recordomatic titrator is being adapted to a micro volu
metric uranium determination. The volumetric procedure will be used as a ref
eree method for the 25 process streams.
A polarographic method has been used for the determination of micro a-
mounts of iodine in radioactive solutions.
Service analyses included TJAP samples from K-25 and non-routine samples
from the radioisotope production group and the technical chemical development
group.
Automatic Titration of Microgram Quantities of Uranium (F. J. Miller, P.
F. Thomason). The Precision Dow Recordomatic titratorW has been adapted to
drive a Kirk micro burette by a simple gear arrangement. This enables one to
automatically titrate with volumes as small as 10 ^. It will be a decided ad
vantage for the analyses of the highly radioactive 25 process solutions.
Preliminary titrations by the ferric sulfate procedure^' of uranyl sulfate solutions, made from Bureau of Standards MS-ST U308 dissolved in sul
furic acid, have shown well defined breaks. However, the titration curve is
somewhat erratic, resulting in rather poor precision. This is thought to be
due to mechanical trouble in titrating such a small volume. The coupling of
the micro burette to the titrator is positive. However it was found that the
air space in the burette between the titrant and mercury caused a lag in the
titration. This was overcome by removing the mercury from the burette and
filling the entire burette with the titrant. As the chart travel of the re
corder is a measure of the volume of titrant added, it is not necessary to
read a meniscus on the centimeter scale of the burette. The burette plunger
was gold plated to prevent corrosion by the titrant.
(1) ORNL 336, pp. 110-112.
(2) Nessle. G. J., et al, Potentiointtric Titration of Uranium with Ferric Sulfate MDDC-1123.
210

The .titration cell assembly consists of an aluminum heating block with a
small hole for a. one ml beaker. The temperature of the block is automatically
maintained at 90° C by a Wheelco thermostat. The assembly is placed on a mag
netic stirrer and stirring is accomplished by a short piece of No. 22 iron
wire sealed in a small glass tube which will fit in the 1 ml beaker. A piece
of No. 18 platinum wire is used as the indicator electrode with a small salt
bridge connecting the No- 270 Beckman calomel electrode. The electrodes are
mounted in an inverted glass crystallizing dish which will fit over the cell
assembly. Carbon dioxide atmosphere is maintained in the cell during the ti
tration.
Twenty lambda of a 10 mg U/ml standard uranyl sulfate was pipetted into
the one ml beaker with a micro pipette, adding the rinsings to the beaker.
Ten lambda of concentrated H2S04 was added and the beaker placed into the as
sembly. Chromous sulfate was added until the recorder registered +400 mv on
the fit to ~j5 scale; usually 250 k of 0.1 N chromous sulfate was sufficient to
show an excess. The tip of the burette and the electrodes were inserted into
the solution and the titrator started. The titration curve was completed
in approximately five minutes.
The first jump in potential was in the order of 15Q millivolts and indi
cated the oxidation of the excess chromous ion. The second break, which was
less pronounced (approximately 50 mill.Iv0It.3_i indicated the completion of the
IT* oxidation to If6 by the "-O.l N ferric sulfate. The chart travel between
the two breaks Is a measure of the uranium present and can be calibrated in
terms of micrograms of uranium per Inch of chart travel...
Theoretically 200 k of uranium in the 20 k of solution will require 16-.3 ^of 0.1029 N Fe2(S04)s„ As the average chart travel was 5.6 inches for thistitration, 2.92 k of solution should be delivered per inch of chart travel by
this particular burette. Typical results of this titration are shown in TableI and a titration curve is shown in Fig. 54. While these results are encour
aging, the titrations of 250"7 of uranium show comparatively less chart travelthan with the 200 7 titrations. This could be due to non-uniformity of the
burette plunger. Work is continuing on the calibration of the device and theproblem of eliminating nitrates in the process samples. Very small amounts ofnitrate may be tolerated provided an excess of chromous sulfate can be obtained. However, due to the small volumes Involved, the volume of chromous
sulfate is limited to approximately 500 k„
211

TABLE I
Hero uranium titration with the recordomatic titrator
SAMPLE NUMBER URANIUM PRESENTCHART TRAVEL
BETWEEN BREAKS
MICROGRAMS OF U
PER INCH OF CHART
1 200 y 5 6 inches 35-7
2 200 y 5 g inches 35- 7
3 200 y 5* 6 if&ches 35- 7
4 250 y £.. 8 inches 36-5
S 250 y 6. 6 inches 37 8
6 250 y 6 7 inches 37 4
TABLE II
Diffusion •current versus uranium soncentration
MICROGRAMS OF DIFFUSION CURRENT MICROAMPS PER
u per: milliliter MICROAMP x 100 MICROGRAM OF U x 100
0.53 0.24 0.4S
1.S9 1 „SO • 0.94
2, 12 2, 19 1.03
5 3 6.42 1. 21
7,42 9.0 1.21
9.01 11. 1 1.23
10,07 13. 1 1.30
212

300 200
DWG. 7556
FIG. 54
TITRATION CURVE OF 200 MICROGRAMS OF URANIUM WITH 0.1029 Fe2(S04)3
-200 -300 •400 -500
MILLIVOLTS

Determination of Ferric and Ferrous Iron in a Mixture (F. J. Miller, P.F. Thomason). Mr. A. S. Kitzes of the Technical Division is making a study ofthe effect of high beta and gamma radiation on a ferrous iron solution. Herequested a method for the determination of both ferric and ferrous iron,preferably some continuous type of measurement. As the Kolthoff and Lingane(3)polarographic determination met this requirement, a simple manual polarographutilizing a Brown Electronik Recorder was installed and calibrated.
A stationary platinum microelectrode, 4 mm long and 0.5 mm in diameter,was sealed into the polarographic cell which consisted of a 2^ in. diameterplastic beaker with a sodium sulfate salt bridge connecting a saturated calomel electrode. Ten milliliters of solution was necessary to adequately coverthe bottom of the beaker. It was unnecessary to remove the dissolved oxygenfrom the solution as the entire current-voltage curve occurred at a potentialtso^positive that the reduction of oxygen did not interfere.
It was possible to determine simultaneously the ferrous and ferric iron
in a mixture of 0.001 Mferrous sulfate and 0.001 Mferric sulfate in a 0.5 Msulfuric acid solution by recording the cathodic-anodic wave from +1.0 volt to
0.0 volts with the half-wave of the ferric-ferrous system at approximately+0.53 volts. The Brown recorder was adjusted so that the current measured was
0.5 fia per centimeter of chart. This allowed the complete cathodic-anodic
wave of approximately 14 /xa to be recorded. The instrument was placed at thedisposal of Mr. Kitzes.
Polarography (W. H. Davenport, Jr.). (l) Aluminum. An investigationwas made of two methods of determining aluminum polarographically. One method
is based on the reduction of the aluminum ion in a BaCl2. or Th(Cl04)4 supporting electrolyte. The other is based on the reduction of one tautomer of the
dye Pontachrome Blue-Black. The amount of dye which is present in solutionin this form is directly proportional to the concentration of aluminum present.Neither of these methods seems to be very applicable to analytical purposes.They are subject to many interferences and a critical control of pH must bemaintained in both cases. Some use may be found for either or both procedures
in special solutions containing aluminum relatively free from interfering ions.
(2) Iodide. Neutral or slightly acid iodide solutions may be oxidizedto the iodate using Br2 water. After removal of excess bromine by boiling,the iodate concentration may be determined polarographically using a buffered
0.1 MKCl +0,1 Jf acetate supporting electrolyte suggested by Kolthoff and
(3) Kolthoff, I. M., and Lingane, J. J., Polarography, New York 1941 (pp. 169 and 276).
214

Orlemann. W The half-wave potential is -0.5 V. versus the saturated calomelelectrode. Reduction waves were obtained for solutions containing as little
as 0.127 7l/ml. These waves are not reliable. A more desirable concentration
range 1 y I/ml—5 y I/ml, was used to prepare a satisfactory calibration curve.
A solution of 5 y I/ml gave a diffusion current of approximately one micro
ampere.
Polarograph for Routine Uranium Control Analyses (M. T. Kelley, G. R.
Wilson, H. H. Miller). In the previous quarterly report (ORNL 336) a brief
description of a recording polarograph for uranium determination was given.
This instrument has been further modified by incorporating a high impedance pre
amplifier into the Brown recorder similar to that described by Rosenbaum and
Stanton.(5) The use of this preamplifier in place of the usual transformerinput to the Brown eliminated the effects of stray magnetic fields which some
times caused random shifts of the recorder pen. A second instrument of the
same design has been constructed and is now in use in the Pilot Plant Control
Laboratory.
The tests of the performance of this instrument have been even more prom
ising in the low concentration range than had been hoped. The diffusion cur
rents found for several concentrations in the range from 0.5 to 10 micrograms
of uranium per milliliter are as shown in Table II.
The surprising factor in these measurements is the apparent decrease indiffusion current per microgram of uranium below concentrations of 5 micro
grams per milliliter although the diffusion current curve is almost perfectlylinear from this point to 300 micrograms per milliliter. It has been concluded that although the use of the polarograph for determination of uranium in
the concentration range of 1 microgram per milliliter (4 * 10*6 M) is feasiblea better understanding of the decrease of diffusion current would be highlydesirable. To this end the present polarograph is being further modified so
that its most sensitive range will be of the order of 0.05 microampere forfull scale deflection with the result that sensitivity of the instrument willnot be a limiting factor in the measurements. Studies will also be made ofother ions in this concentration range to see if they show similar behavior.
Special Analytical Apparatus (H. L. Hemphill). The hydraulic pipettorhas been revised by replacing the rubber diaphragm with a teflon sealed pistoncontrol. This control features a combination coarse and fine adjustment that
(4) Kolthoff, I. M., and Lingane. J. J., Polarography, New York 1941 (pp. 319-320).
(5) Rosenbaum and Stanton, Anal. Chem. 19, 794 (1947).
215

will accurately pipette either milliliter or lambda volumes of solution.
A small portable electric, stirrer has been devised using a micro electricmotor which.is driven by two No. 935 flashlight cells that are contained in
the handle of the device. This compact stirrer will efficiently mix a smallvolume of liquid In a test tube or centrifuge cone and is particularly convenient when it is necessary to stir radioactive solutions.
RADIOCHEMICAL ANALYSES—RESEARCH AND DEVELOPMENT
I. Summary. Investigation of the decay scheme of Ba1*5 has disclosed
evidence for two previously unreported gamma rays. The half-life and mode of
decay of CI have been established. Significant work on beta and gamma counting efficiencies of standard counters has been finished. Radiochemical meth
ods for Pu? Am, (+Cm), and Zr are being devised. Activation-analysis methodsare under investigation, and certain activation cross sections have been de
termined,
2o Decay Scheme of Boi4° (W. 5. Lyon). The method of purification ofBa 4v! was given in the previous report, ^ The continuous beta spectrum isgiven in Fig, 55 and the Kurie Plot in Fig, 56- With a large source of Ba140
the spectrum of unconverted gamma rays was determined,, using uranium, gold,and columbium radiators. This information confirms the conversion-electron
peaks observed in the Kurie plot, That all observed radiations are due to
Ba"* has been shown by use of sources of different bombardment and coolingtimes, and by following decay of various portions of the specjtrum on the
spectrometer. Coincidence counting, employing a coincidence circuit with con
ventional Gr-M tubes, gave useless results because of too rapid growth of La1<0
gamma radiation. Use of proportional counters with a coincidence circuit will
make possible a reliable study of beta-gamma coincidences,
Ba"38 has been reported to have a 0,163 Mev gamma ray, ^' The close approximation in energy to the BaliiC gamma given above made an investigation seemdesirable, A source of Bai3B was prepared by irradiation of ~1„5 g of Ba(N0's)2in the ORNL reactor for two hours. This material was then mounted as a gamma
source in the spectrometer, A columbium radiator was used, and photoelectrons
of energy about 0,16 Mev were sought, A K photoelectron peak corresponding to
a gamma energy of 0,165 Mev was found. Repeated measurements indicated a half-
life for this gamma of ~70 minutes, essentially confirming the assignment toBaMS,
(6) Chemistry Division Quarterly Report, ORNL 336 (1949).
(7) L. R. Shepherd and J. M. Hili, Nature i62, 566 (1948).
216
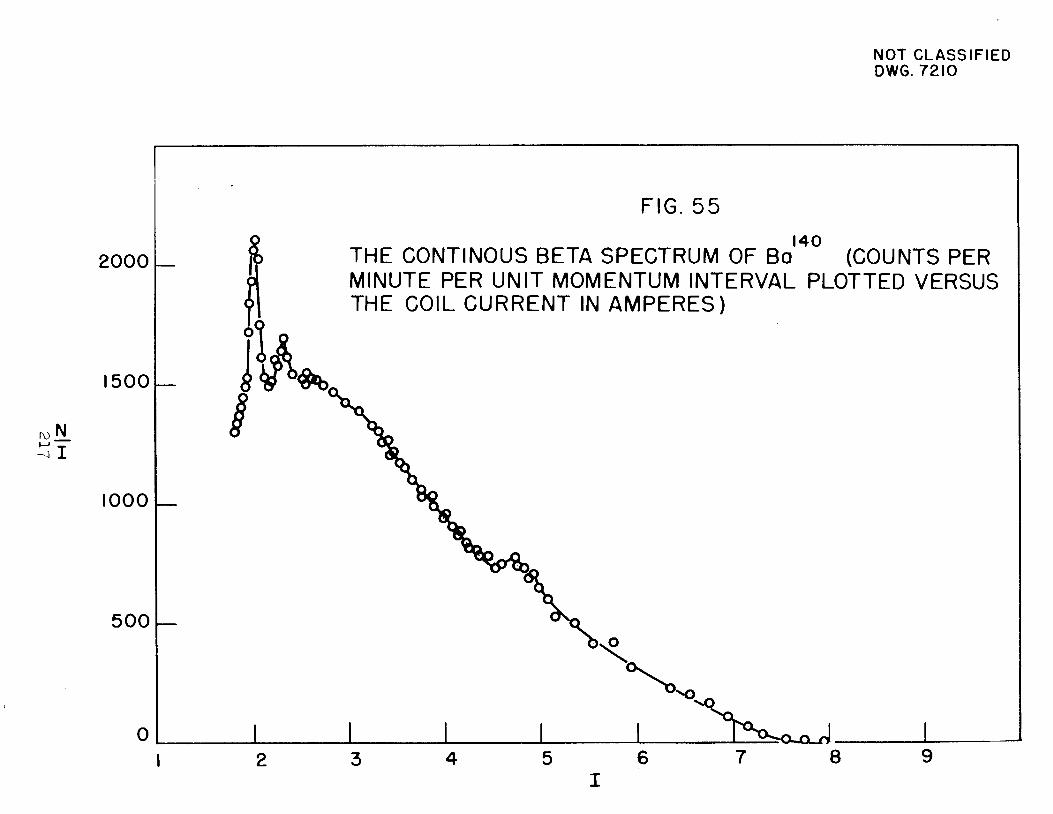
2000
1500
^1
1000
500
0
FIG. 55
140THE CONTINOUS BETA SPECTRUM OF Ba (COUNTS PERMINUTE PER UNIT MOMENTUM INTERVAL PLOTTED VERSUSTHE COIL CURRENT IN AMPERES)
8
NOT CLASSIFIEDDWG. 7210

ro
O0
FIG.56
NOT CI 3SIFIED
DWG. 7211
140KURIE PLOT OF THE BETA SPECTRUM OF Ba (KURIE PLOT,
3 VS ENERGY E, WHERE N IS THE NET COUNTING RATE,
F IS THE FERMI FUNCTION, AND I IS THE COIL CURRENT
IN AMPERES)
"%.
.0
3. Radioactivity of CI86 (S. A. Reynolds). Three samples of CI36 havebeen studied. Two were prepared by bombardment at Hanford and were purifiedby Mr. E. Beauchamp of the Operations Division. The third was purified fromKCl bombarded almost two years in the ORNL reactor. The purification consisted of AgCl precipitation, solution in ammonia, Fe(0H)3 "scavenging," reprecip-itation of AgCl by addition of HN0s, fusion with Na2C03, leaching the resulting NaCl with water, and distillation of HC1 from sulfuric acid. Aluminumabsorption curves on the conventional end window G-M counter show a maximumbeta energy of 0.73 Mev (by Feather analysis) (Fig. 5.7). This agrees rrough^ywith the results obtained by Overman, 0.66 Mev(8), and by Graham and Walke,0.64 Mev.(9) By use of the proportional beta counter and gamma chamber, K-capture and B+ emissions were shown to be absent. The half-life was calculated by two methods: (l) employment of the equation
T = 0.693 NT a ft/A,
where NT is the number of target atoms (CI86), a is the capture cross sectionper atom, f is neutron flux, t is time in seconds, and A is activity in disintegrations per second; and (2) from the equation
Tu = 0.693 N/A,
where N is the number of CI88 atoms. In case (l), the cross section was takento be 32.3 b, after Overman(8); fwas furnished by J. A. Cox (Operations) fortwo samples(1Q) and was determined by means of aCo monitor for the third; andA was determined by absolute beta counting. In the second case, the number ofCl*e atoms was calculated from data furnished by Dr. C. H. Townes (ColumbiaRadiation Laboratory) on the abundance of this isotope in one sample preparedby Mr. Beauchamp. dD Dr. Townes determined the abundance by amicrowavespectrometry technique. In both cases, the probable errors are unknown, butthe approximate agreement between the two methods is encouraging.
U Beta Geometries (V. A. Brooksbank, T. H. Hundley). In apreliminary'report(12) L„ R. Zumwalt published the observed percentage back-scattering ofRaE betas from silver as 52-53*. "It was indicated by Zumwalt and by J. W.Jones(l3) that the true figure should be 67-70%, corrected for absorption and{8) R. T. Overman. Reactivities Produced in N.utro, Radiation ., Chi.,!... MDOC-8S7 (1947),(9) Graham and Walke. Phys. Rev. 59. 109 (1941).(10) j. A. Cox. bombardment data furnished by Hanford Operations.(11) C. H. Townes. personal communication. March. 1949.(la) L. R. Zumwalt. Absoiute Beta Counting Using E„d-Window Geiger-Mueller Counter Tub...
MDDC-1346 (1947)
W. Jones and L. «. Zumwalt. personal communications. March. May. 1949.<(13) J-
219

TABLE III
140Energy values for Ba
y9 Max. 0- 990 ± 0-01 Mev
0-465 ± 0-02
7 0-160 ± 0-01
0-310 ± 0-01
0-535 ± 0-01
TABLE IV
Half-life of CI 36
From abundance
From bombardment data
3-6 x 10° yr
2-0 x 10s yr (average of three)
TABLE V
Comparison of counter geometries
COUNTER ZUMWALT GEOMETRIES NBS
Std. B(Percent)
G
(Percent)F
(Percent)3098 2093
1
5
6
10
7-8
7-3. 7-4
8-1. 8-2
7-2
8-2
7-6, 7.5
8-3
7-4
8-0
7-5
8-2
75
7-2
8-2
7-4
8-3
7-2
220

10,000
(/•>
r-
o
1000
100
~ tf'3. 7228
FIG. 57
CI36 ALUMINUM ABSORPTION CURVE
FEATHER RANGE = 263 Mg
E/3 = 0.73 Mev
0 12 30 48 66 84 102 120 138 156
Mg Al ABSORBER
74 192 210

scattering by air and the mica window* Applying the latter figure to data obtained using two National Bureau of Standards RaDEF standards, the geometriesof four counters were determined,, The geometries of these counters were also
determined by use of secondary RaDEF standards prepared by Zumwalt, The results are tabulated in Table V, It will be noted that the results agree with
in experimental error.In an experiment to check the back-scattering percentage given above, a
RaE preparation was made, and equal aliquots were mounted on 1 mil polystyrene,6. mil rhodium, and 4 mil platinum,. Counts were made on a standard G-M counter,keeping the surfaces of all mounts in the same plane,, A short absorption curvewas taken on each sample, and extrapolation was made to zero absorber as usual.Comparison of the extrapolated rates shows that the percentage back-scatteringfrom Rh is 67%, and that from Pt is 82%, in good agreement with Zumwalt!sobservations,, Rh was chosen for the experiment because of its proximity inatomic number to RL, which is used to coat the silver discs on which the RaDEFis mounted in the NBS standards, The following procedure was used in preparing the RaD and RaE used in the experiment S^Ten micrograms each of Pb and Biwere added to a RaCl2 solution, which was made about 40% in ammonium citrate.The solution was made alkaline to phenol red by addition of NH^OH, 0,3 g ofKCN was added, and the RaD (Pb) and RaE (Bi) were extracted together by shaking with a 0.003% diphenylthiocarbazone ("dithizone"') solution in chloroform.After washing, the Pb and Bi were stripped from the chloroform with 1.100 HN03,The PE of the aqueous solution was adjusted to about 3 (first Meta-CresolPurple end-point), and the Bi was extracted with dithizone. After washing, theBi was stripped with HN08, and, after allowing short-lived activities to decay,the RaE was used in the back-scattering experiment. Decay and absorptionstudies were made on the product, identifying it as pure RaE, To the aqueousphase from the Bi extraction were added NH40H and KCN, and Pb was extractedwith dithizone. The growth of RaE and RaF activities is being followed.
5. Gamma Counting Efficiency (W..S. Lyon) The gamma counting efficiencyof end-window counters (such as used in routine analytical work) defined as
counting rate= e
disintegration rate
(14) Sneli, Coios-imetiric Methods of Analysis, Sandell, Coloif ime tricDetermination of Traces ®l Metals, Reynolds, Routine Methods fair RadioisotopeAnalyg is {1948)•
222

has been determined for Au1B8 •, Cb96, Zr95, Couo, Sc*e, and Na . Disintegrationrates have been obtained by measurement on the 100% geometry ion chamber^ 5-' ,by absolute beta counting, and, in the case of Coe and Na24, by coincidencecounting. To obtain the gamma counting rates, the samples were mounted in the
standard manner for gross gamma measurement, i.e., on one-inch watch glasses
supported on scotch tape stretched across the bottom of l-l/l6> inch hole inthe center of an aluminum card which was placed in the second shelf of the
standard tube support. Betas were absorbed by the standard "sandwich."1 Theobserved counting rates were normalized to a radium gamma standard of the type
now in use in all analytical groups. A plot of the efficiency against gamma
ray energy is given in Fig. 58.
6. Counting Standards (W. A. Brooksbank, S. A. Reynold*). Alpha stand
ards containing Pu23B are being prepared for use by analytical groups requiring use of alpha counters. These will be "Krylon"' coated stainless steeldiscs. Standardization will be done by counting on all available proportional
alpha counters in analytical groups. High-level (~1 mc) beta sources will beprovided for checking beta sensitivity of alpha counters. These will containSra0 with its Ytt0 daughter. The sources will be used in daily checks of alpha
counters to indicate beginning of beta-sensitivity, with resultant inaccurate
counting of certain alpha samples.
At the suggestion of P. R. Bell (Physics), R. Luman (instruments), andothers, additional uranium (metal) normalizing standards (for beta counting)are being prepared. Standards of Co60 are also in preparation. Some of thestandards will be calibrated as secondary geometry standards by counting on
counters whose geometries have been determined by RaD and by coincidence counting. The standards will be made available to any project group desiring them.Requests have already been received from the ORNL Health Physics Division, andNEPA.
7. Activation Cross Sections (G. W. Leddicotte, S. A. Reynolds). To mon
itor neutron exposures, the Co-Mn-Al alloy prepared for R. T. Overman is used.The alloy contains 0.53% Co and 0.21% Mni16^ The cross sections are taken to
(17)be 33 b and 13.5 b, respectively. KJ~''
(15)J. W. Jones and R. T. Overman, Use and Calibration of a 100* Geometry Ion Chamber, MonC 399(1948).
(16)R. T. Overman et al., Descriptive Manual of Radioisotopes Produced by Neutron Bombardmentin the Clinton Pile, ORNL 4 (1948).
(17)J. W. Jones, et al., Activation Measurement of the C-Neutron Flux in the Clinton Reactor,MonC 398 (1948).
223

ro
O
X
2.6
2.4-
2.2
2.0
1.8
1.6-
UJ
> l.4ho
y 1.2oUJ
^ I o-
0.8
0.6
0.4-
0.2
0.0
NOT CLASSIFIED
DWG. 7555
FIG. 58
EFFICIENCY OF G M TUBE FOR 7 RAYS THRU 7SANDWICH (1900 mg/cm2 AI-2000 mg/cm2 Pb)
E Vs 7 ENERGY IN MEV
O OBSERVANCE POINTS
A CALCULATED
0.0 C.2 0.4 0.6 0.8 .0 !£ 1.4 1.6 1.8 2.0 2.2 2.4 2.6 2.8 3.07 ENERGY MEV

By bombarding enriched Ge70, the 11 d Ge71 K-capture activity was produced, as well as the 40 hr positron-emitting isomer. A conventional betacounter was calibrated for counting X rays in the Ga region by means of a Znsample, whose disintegration rate was determined by measuring its gamma activityon the ion chamber. The decay scheme assumed was that of Good and Peacock ',
showing 98.7% K-capture, with 1.14 Mev gamma accompanying 46% of the K-captureprocesses. The overall efficiency for second-shelf counting (about 8% geometry) was found to be 0.14%. The "observed"' counting rate on the Zn standardas well as the Ge was obtained by extrapolation of a Be absorption curve (aftersubtracting the gamma in the case of Zn). The cross section of Ge70 for production of 11 d Ge71, was found to be ~2.3 barns. It is believed that this resultis accurate within 40%. H. S. Pomerance has reported a value of 3.3 b, usingthe pile oscillator. ^19' The Ge X-ray activity was found to decay with ahalf-life of 11.6. d, in good agreement with earlier results. ^20' Decay of the inducedgamma activity of the Ge70 sample was followed on the gamma ion chamber. No 40hr period was noted. If the total gamma activity, most of which decayed with a14' hr period, was assumed to be Ge71, the cross section for production of thisisomer would be ~0.02 b. If the half-life of the Ge70 isomer is 40 hr, the crosssection for its production is surely less than 2 mb.
The cross section of Zr94 for production of the familiar 65 d Zrue activity was determined by bombarding samples of enriched ZrB402 in,"rabbits"' inthe pneumatic tube. Cobalt monitors were used. Activities were determined bymeans of the ion chamber, and corrections for Cb growth were made. Cadmiumratios were taken on the monitors as well as the samples so that thermal-neutron cross sections could be calculated. The thermal-neutron activation ineach case was taken to be the difference between the activity observed in thesample bombarded without shielding and the activity found when the sample wasinclosed in a cadmium cup during bombardment. The cross sect ion, for pileneutrons was found to be 0.074 ± 0.01 b, and the thermal cross section wasfound to be 0.060 + 0.01 b.
The cross section of Zr98 for production of 17 hr Zra' is being investigated. Apparently resonance capture is important in this case, for very low
(18)*. U. Good and W. C Peacock, Phys . Rev. 69, 680 (1946).
(19)H. S. Pomerance, personal communication, May 16, 1949.
^G. T. Seaborg<20>G. T. Seaborg and I. Perlman, Table of Isotopes, Rev. Mod. Phys. 20, 598 (1948).
225

cadmium ratios have been obtained in pneumatic tube bombardments.
8. Radioisotope Target Materials (G..W. Leddicotte, S. A. Reynolds). Determination of product yields for various radioisotope target materials andidentification and quantitative analysis for impurities have continued. Thematerials were especially prepared by Mallinckrodt Chemical Co., and were submitted for study by J. A. Cox of the Operations Department. Complete detailswill be given in a report to be published in the next quarter. The activitiesfound in the various materials after bombardment are given in Table VI.
9. Radiozirconium Procedures.
a. TTA Separation with Colorimetric Determination of Carrier Yield(R. H. Powe 11). (lpolorimetric Method..To¥125mtseparartxqxSfihinhe1aadIL mg Zrcarrier and an appropriate aliquot from the radiozirconium solution. Add 1 mgcone. HCl and shake to mix. (if original sample contains oxalic acid, it maybe destroyed by treatment at this point with 1ml of 5% KMntJ4\ followed by destruction of the excess KMn04 by hydroxylamine hydrochloride.) Add 5 ml of0.5 MTTA in xylene. Shake for ten minutes. Add 45 ml of xylene and mix byshaking. Withdraw and discard aqueous phase. Wash organic phase twice with10-15 ml 6. MHCl. Draw organic phase into a fresh separatory funnel containing1 ml of 0.221% NaF and 10 ml of 9 MHCl. Shake ten minutes. Withdraw theaqueous strip. Evaporate suitable aliquots for counting, and determine theyield of carrier by the following colorimetric method.
Ten ml volumetric flasks are used to contain colorimetric samples andblank. Into each flask, pipette solution containing 20 micrograms of Zr as"spike."' To blank add 0.05 ml of 0.221% NaF. To flasks for samples add 0.5 mlof aqueous strip (above). To blank add 0.5 ml 8.2 MHCl. To blank and samplesadd 0.5 ml 0.75 MNaOH. Fill each flask to mark with color-forming reagent(see notes). Mix contents of flasks and let stand for l£ hours. R̂ead trans-mittance of samples against blank on aspectrophotometer at 5300 A. Determineamount of Zr in unknowns by comparison with a standard curve.Notes Color-forming reagent: (a) sodium alizarin sulfonate, 1.25 mg/mlin95% ethanol, (b) 8.75 gH3B03 in 300 ml of isopropyl alcohol containing 0.5 mlcone HCl. For working reagent mix one part of (a) and nine parts of (b).This reagent has been found to be stable for at least 24 days. The separatoryfunnels are kept closed during shaking, rather than using air bubbling formixing, because it has been found that HF is lost during air agitation. The
226

TABLE VI
Activities induced in target materials
MATERIAL INDUCED ACTIVITIES
CaC03
AgN03
FejOs
A32O3
Cd(N0s)2
Ti02
Na2C03
Ca4B, 180 d B; P32. 14 d B; Sr8e, 55 d B
Ag110, 225 d B, y (K ?)
Fe59, 47 d B,y, Fe65, ^ yr K; P32! S36, 87 d B
As78, 26.8 hr B. Sb124, ~60 d B, y
Cs116, 2.3 d B. ; Cd116™, 43 d B, y, Cd117, ~3 hr Bi In*
TiS1, 72 d B, y. P32, Fe*. S36
Na24, 14-8 hr B, y; S35; Ca45; Sr89; Cs134, "^2 yr B, y
TABLE VII:
Yields of Zr carrier and tracer
RUNPERCENT CARRIER
RECOVERED
PERCENT TRACER
RECOVERED
1
2
3
88.9
56. 1
27.9
91-2
60.7
26.5
TABLE VIII
Comparison of fluozirconate and colorimetricmethods
RUN FLUOZIRCONATE COLORIMETRIC
1
2
4.71 x lo'2mc/ml
4-90 x 10"2
4.76 x 10"2 mc/ml
5- 17 x lo"2
227

fluoride concentration is critical in stripping and in the colorimetric
analysis. The percentage stripped has been found to be a function of the BC1concentration, the best strip occurring with highest acidity. Use of highacidity necessitates partial neutralization with NaOH, because of the pH-dependence of the color-formation step., The original aliquot taken foranalysis must have at least ten times the activity that is desirable for counting, because of the dilution involved. A Coleman spectrophotometer, Model 14,has been used for transmittance determinations. A Burrell Wrist Action
Shaker has been used for mixing.
(2) Evidence for Interchange. Occurrence of interchange between
tracer and carrier has been shown where oxalic acid was present (the case inmany radioisotope preparations), but uncomplexed solutions have not been tested. The data are given in Table VII.
(3) Comparison with Fluozirconate Method. Two comparisons havebeen made between the colorimetric method and the "'standard"1 fluozirconate
method. ^21^ Absolute beta counting was done on aliquot from the aqueous stripin the colorimetric run. In the fluozirconate analysis gamma counts were made,
and these were corrected to beta disintegrations by a suitable "factor"' forgamma efficiency. The results are summarized in Table VIII. The samples were"Zr-Cb mix"1 materials, The colorimetric method has not yet been tested ongeneral fission-product mixtures. The time required for four analyses, exclusive of time for color-development, is slightly over one hour. Thus inactual working time the colorimetric method is somewhat shorter than the fluozirconate method.
6., Simple TTA Separation without Carrier (F. L. Moore), Littledevelopment of this procedure has been done during the past quarter. TheGeneral Radiochemical Analysis Group made a number of runs using the method asgiven in the previous quarterly report. ^ Results are good in phosphate-freesolutions. On a typical sample 14 TTA analyses were performed averaging 2.54x 10⁸ cts/min/ml with an average deviation of 0.06. * 108 (2.4%); and 6- fluozirconate analyses, averaging 2.00 * 108, with an average deviation of 0,08x 10⁸ (4%). The latter is a typical deviation. The TTA analysis is higherthan the fluozirconate because of self-absorption of the beta particles in thelatter. Thus it is evident that in certain types of materials the TTA analysis
^21>D N Hume et al , » AManual of the Radiochemical Determination of Fi as i on Pr oduc t ActivitiesCN.2815 (1945)
228

for radiozirconium is at least as reproducible as the "standard"' method, and
gives more nearly absolute results.
10. Plutonium Analysis (F.L. Moore). The TTA analysis for total Pu^22',involving depolymerization with nitric acid, has given reasonably satisfactory
results on Redox, 23, and 25 process solutions. The 1AW samples in Redox have
been troublesome because of low Pu activity, presence of Am and Cm, high beta-
gamma activity, and considerable amounts of aluminum and chromium. A suggest
ion of K. A. Kraus that fluoride should be used to destroy the Pu(lV) polymer
was investigated and found to be satisfactory. Two methods were used: (l)usual precipitation of LaF3 carrying Pu, followed by dissolving the precipitate
in Ha'BOa-HNOs mixture and extracting with TTA-xylene, and (2) treatment withHF, followed by complexing of the fluoride with boric acid, and TTA extraction.
The first method was used only briefly because of the obvious advantages of
the second. The first method gave 95-100% Pu yields on synthetic polymer so
lutions containing 15% and 46% polymeric Pu(lV). The second method gave 90-100% extraction with two half-volume TTA-xylene passes after ten-minute treatment with HF in concentrations from 0.33 M to 2 M with solutions initially
containing 46-65% polymer. Most extractions were over 95% effective. Membersof C. L. Burros' group ran a number of LAW samples (Redox process) by the usual HN03-depolymerization method and by method (2) above. Typical results aregiven in Table IX. It is evident that good agreement was secured in most
analyses.
11. Americium and Curium Analyses.
a. TTA Extraction (F. L. Moore). On all analyses of LAW samples
from the Redox process results for total "Pu"' by LaF3 precipitation were observed to be higher than by TTA extraction, even though repeated depolymerization treatments were made. It was believed that appreciable quantities ofAm241 were present. This would carry on LaF3 but would not extract with TTAfrom 1 MHN03 solution, as will Pu(lV). It is known that Am and Cm will extract with TTA at a pH of about 4. A determination of percent extraction ofAm as a function of pH was made (Table X) , using equal volumes of aqueous and0.5 MTTA-xylene. A ten-minute mixing period was used. In the determinationof Am by TTA extraction on 1AW solution a complexing agent should be used toprevent precipitation of Al(OH)3 at the pH used. Tartaric acid (2.6%) wastried, but at pH 4.48 only 14-15% of the Am was extracted. A pH 5 buffer containing ammonium acetate and nitric acid was next used. In the absence of Al
(22)F. L. Moore and J. E. Hudgens , ORNL 153 (1948).
229

TABLE IX
Comparison of Pu method?: (TTA)
SAMPLE USUAL TTA METHOD (2)
I AW-A 2.97 X 204 4/m/ml 2.67 z 104 c/m/mil
3 '09 x SIO4 2-72 X 104
I-AW-B 8 6 XL S0S 9- I X 18S
7.8 X 10³. 7.0 X 1G3
III-AW A 2 9 X SO4 2.3 X 10⁴
IIIAW-B 6- 2 X SO3 §.5 X 103
5. S X wa 8.4 X I03
52R*1AW. 5 8 x- W 6. 1 X 10s
6.2 x :ios 6 0 X 10s
6. 7 a: 10S 5.7 X 10³
S4R lAW 200 2 3'00 x 10* 3 01 X 104
54R-1AW.400 1 2 92 X 104 2 87 X 104
S4R-1AW-500 2 3.44 X JO* 3 33 x 104
TABLE X
Extract ion of Am as a function of pH
Pm PERCENT EXTRACTION pH PERCENT EXTRACTION
Q. 23 0.0 3. 90 92.3
!•• 03 0 0 4.33 95 3
JUSS. 0 0 4.60 98.5
2.02 0 3 S.32 98.0
3. 10 43. 1 5.88 98.2
3.62 8S 0
230

overi of Am tracer was extracted, but when Al was present precipitation
took place immediately after extraction was begun.The alpha pulse analyzer is avaluable tool for determination of alpha
energy, which serves for characterization. The beta tolerance is so low, however, that such determination cannot be made on alpha fsom 1AW solutionsdirectly. Therefore, the alpha emitters' must be. decontaminated from betaactivity in apreliminary step'. After exhaustive extraction of Pu from aLAWsample at low PH, the pH was adjusted to 3.45 and the material was extractedwith ahalf-volume' of TTA. The organic phase was diluted with an equal volumeof xylene and stripped with 1/7 volume of 8Jf HNOa. The above, procedure servesto decontaminate from most fission products, but of course does not givequantitative yl«l* of Am or Cm. The extracted material was identified as60-65% Cm242 and -35% Am241 by pulse analysis by, E. Eairstein. This is magreement with aprediction made by K. A. Kraus. Thus it has been demonstratedthat considerable Am and Cm activity is present in UW samples, and the Pu(IV)polymer is not the source of difficulties in analysis. This was also shown bycomparison of two depolymerization procedures (see above).
b Precipitation (S. A. Reynolds). The method given below has beenfound useful in analysis for Am or Cm in the presence of Pu when little or nomaterials are present which interfere in the usual LaF3 analysis for Pu (e.g.^Al)Procedure Pipette a suitable sample into a 3- ml cone. Add 0.25 mg Lacarrier and three drops of cone. HN03. Add 0.4 ml of 1MNa2Cr207, dilute to2ml, and mix well by stirring with a platinum wire (usual Pu technique throughout) Heat to 90-95° C, and maintain at that temperature for fifteea mnutesCool to room temperature, and add three drops of cone. HF which has been treatedwith Na2Cr207 until an orange color persists. Digest ^e *™ Centrx-fuge five minutes. Remove supernatant, and wash twice with 0.5 Jf HF-0 5HN03, as in Pu analysis. Slurry and transfer as usual to a stainless_steel orplanum disc. Evaporate to dryness, flame gently, and count alphas ma pro-portional alpha-counter. . .,..*. „+„„ frnmNotes Asingle oxidation step as above gives a deeontammation factor fro.nlal * Of about 300. If MlY) polymer is present, OK), treatment may b«neelarv to destroy the polymeric material. Yields of Am in the absenoe ofinterferences are 97-100*. Brooksbank). Aliterature
12 Analysis for Bare Gas Act.».t.e. (*. A. Brooesoan Isearch for methods of analysing rare gases has been completed. It has been
231

decided that adequate separation of Kr and Xe activities can be obtained byadsorption on an desorption from charcoal under controlled conditions.
SPECTROCHEMICAL ANALYSES - RESEARCH AND DEVELOPMENT
Analytical Development
C„ Feldman M. Murray,. A, Estepp.. J Gillespie
1, Aqueous Solutions.. Procedures were worked out for spectrochemicalanalysis of the following samples by the porous cup method with the accuracyand precision estimated as i 2 3%.
(a) 5-100 ppm Al in a 25% Th solution (0. 005-0.100% Alreferred to Th )
(b) 0.5-15 ppm B in plant tissue (referred to wet weight)..(c) 0.1=20 ppm Ca in distilled water
(d) 0,01-0 1% Pb, 0 05-0 4% Sn5 0.005-0 100% Cu, and 0.002-0.030%Mn in Bi metal (run as 10% solution in HN0s).
(e) 1-20 ppm Al in 1 8% Th solution.2, Non-aqueous Solutions. xa) Al/Th ratios: A technique was developed
for analyzing 2% solutions of Th in diglycol dichloride and tributyl phosphateby the porous cup technique without any chemical treatment. Hexane-tributylphosphate mixtures could be safely run by the porous cup method only afterelimination of the hexane, or addition of tributyl phosphate to the mixture.By using aqueous standard solutionSl a curve was constructed for an Al/Th rangeof 6. x 10"6 to 9 x 10"* by weight in the organic substance,
3.. Analysis of Uranium Compounds for Impurities, (a) An attempt wasmade to regulate distillation of the AgCl in the carrier distillation methodfor the spectrochemical analysis of Us08 by surrounding the electrode containing the sample with a heated jacket. The carrier was volatilized, but thenecessary sensitivity for detection of traces was not achieved.
(b) Preliminary work was performed on the application of 1:4 tributyl phosphate-hexane mixtures to the trace analysis of uranium. Extractionof the uranium from the impurities leaves an aqueous solution which may beanalyzed in any conventional way. Since this reagent also extracts thorium,
232

the technique presumably can also be applied to analysis of thorium compounds.With regard to the application of spectrograph^ techniques, this extractionmethod, combined with the porous cup technique, offers the following advantagesover the carrier distillation method currently used for the spectrograph^analysis of U308.
(1) It permits an accuracy and precision of 2-3% in values obtainedfor trace concentrations, compared to the ± 30-50% usually obtainedby the carrier distillation technique.(2) All trace elements soluble in 5JV HN03 and not extracted by thereagent (see below) can be analyzed for; this introduces the possibilityof analyzing for Al, rare earths, and other elements which are difficult or impossible to volatilize by the carrier distillation technique.(3) Any uranium or thorium compound soluble in 5NHN03 can be handledby this technique. This for instance, includes U02(NH4)P04, UFe and UF4,which cannot be handled by the carrier distillation method withoutchemical treatment. Such treatment introduces the danger of loss of theimpurities being determined.(4) If the aqueous layer is concentrated by evaporation after extractionof the U or Th, there is no theoretical limit to the sensitivity relativeto U (or Th) which can be achieved. In the carrier distillation method,on the other hand, relative sensitivity is limited by sample size.(5) No uranium is consumed by the analysis; uranium can be returned tothe laboratory submitting it, in a highly purified condition.(6) In the case of TJ23" and Uas8 preparations, the separation removesthe uranium from the vicinity, thus eliminating the danger of contaminating the operator during the spectrograph^ exposure. The exposure ismade using the impurities only.A study was made to determine the extent to which common metals in the
quantities likely to be present in U or Th samples were extracted into theorganic layer. Asolution was prepared containing the indicated quantities ofmetals in 5ml of 5NHN03. Two ml of this solution was shaken for one minutewith 10 ml of a1:4 tributyl phosphate-hexane mixture. The aqueous layer wasdrawn off and discarded, and the organic layer heated until the hexane waseliminated. Its volume was made up to 2ml with pure tributyl phosphate, andthis was analyzed directly by the porous cup method. Results are given inTable XI.
None of these elements was detected in the organic layer. The only exception to this was the appearance of vary faint lines of Ca. Since very
233

TABLE XI
Extent of extraction of impurities into tributyl phosphate-hexane
TRACE ELEMENTCONCN. OF TRACE
EL. IN AQ. LAYEI(ppm)
fit OF TRACEEL. IN AQ.
LAYER
APPROX. DETECT
ION LIMIT BY PCE
(PP">)
UPPER LIMIT FOR
DISTR. COEFF.
(org. aixt./aq.)
Al 20 100 1 2 x 10'3
B 20 100 0-5 1 x 10"3
Ca* 10 50 0. 1 0.4 x 10"S
Cd 200 1000 100 2 x 10'2
Co 20 100 2 4 x 10"3
Cr (as Cr04~) SO 250 2 1.6 x 10*3
Fe 20 100 2.5 5 x 10*3
Mn (as Mn ) 50 250 2 1.6 x lo"3
Mo 100 500 3 1.2 x lo"3
Ni 200 1000 10 2 x 10"3
Pb 200 1000 10 2 x 10"3
Y 20 100 0.2 0.4 x 10*3
Zn 500 2500 25 2 x lo"3
234

faint Mg lines also appear and no Mg was added to the aqueous solution, itappears that the presence of Ca lines was due to contamination of the electrodes,rather than extraction of Ca by the tributyl phosphate.
Maximum values were calculated for distribution coefficients of theimpurity metals between the tributyl phosphate-hexane mixture and the aqueousphase. The upper limits of metallic trace concentrations in the evaporatedmixture were takentobe those characterizing the porous cup electrode technique
in general (AECD-2392).In addition to these elements, Zr, Cb, and Ru have been shown by the
Technical Division to have extraction coefficients of less than 1 * 10™ .4., Qualitative Analysis of Inhomogeneous Metallic Surfaces with a Micro
Spark, Work is ^75% complete on an arrangement which will permit the qualitative spectrographs analysis of metallic inclusions, 0.2 mm in diameter. Atiny high-voltage D.C spark between an Al wire and the specimen is photographedwith a medium quartz spectrograph. Correlated motion of specimen and photographic plate, combined with photographing of the specimen before and afterexposure, permits identification of individual grains.
This arrangement is modeled after a similar arrangement in use at theFord Company laboratories in Detroit.
ANALYTICAL SERVICE
In general, the demands for analytical service made by the Laboratoryduring the past four months have not changed radically. There has been a decrease in the requirements of the Pilot Plant resulting from completion of thework of Redox by the Technical Division, However, because of the higherlevels of radioactivity now being handled, the analytical personnel requirements have not changed. During the next period the Pilot Plant will be occupiedwith the 25 recovery process, The analytical requirements for this process arevery similar to those of the Redox process and little change is necessary except for the greater care necessary in handling the enriched 25 samples.
Agreater number of samples was submitted by the Laboratory and Semi-works Sections of the Technical Division and also by the Radioisotope Development Section of the Operations Division. In addition, a trend toward morestringent requirements on the part of radioisotope customers has placed anadded load on the Radioisotope Production Control Group,
A summary of service analytical work is given in Table XII.
235

RADIOCHEM.
DEV-
IONIC SPECTRO- GENERAL GENERAL WATER LAB. AND PILOT PRODUCTION
DEV- CHEM. RADIOCHEM IOHIC ANALYSES SEMI'! WORKS PLANT CONTROL TOTALS
GROUP GROUP GROUP CONTROL
PERSONNEL
Tech. 8 4 4 4 4 1 2 S 8 40
Non-Tech. 4 2 - 6 1 4 10 M 18 66
Biology 03ease•»
PhysicsM
46 3* 11 60K•
o
«
Chemistryeca
o
23 137 4 40 24 785 10131
c
0
Technical •o 226 88 4920 25 1408 10,698 11,295 2757 31417sA
in
a
1e
0o
Metallurgy>
•a66 32 119 217
to
t©
ase
Operating Div.
«
8
73 65 84 10840 11062 R
R
i-3
fe«M B «*** t-"
Health-Phys.o
(ft 1 164 24 189XTA
1
X«+
CO.H
Or*.
0> K-25
sa
m
M
48 7 470525
42
O
6O
H
Misc. 42
1m9to
»A
•o0"1
1*-
1
297 460 5623 100 1527 10,841 11,295* 14382 44525
f* 13
3.1
O
•Tine of 1-1^3 people devoted to preparation of qoajpounda for Phyaica Division.
\