progressive iga nephropathy is associated with low...
TRANSCRIPT

CLINICAL RESEARCH
Corre
and In
smith
matth
Recei
21 No
426
Progressive IgA Nephropathy Is Associated
With Low Circulating Mannan-Binding
Lectin–Associated Serine Protease-3
(MASP-3) and Increased Glomerular Factor
H–Related Protein-5 (FHR5) Deposition
Nicholas R. Medjeral-Thomas1, Anne Troldborg2,3, Nicholas Constantinou1,
Hannah J. Lomax-Browne1, Annette G. Hansen2, Michelle Willicombe4, Charles D. Pusey5,
H. Terence Cook1, Steffen Thiel2 and Matthew C. Pickering1
1Centre for Complement and Inflammation Research, Imperial College London, London, UK; 2Department of Biomedicine,
Aarhus University, Aarhus, Denmark; 3Department of Rheumatology, Aarhus University Hospital, Aarhus, Denmark; 4Renal
and Transplant Centre, Imperial College Healthcare NHS Trust, London, UK; and 5Renal and Vascular Inflammation Section,
Imperial College London, London, UK
Introduction: IgA nephropathy (IgAN) is characterized by glomerular deposition of galactose-deficient
IgA1 and complement proteins and leads to renal impairment. Complement deposition through the
alternative and lectin activation pathways is associated with renal injury.
Methods: To elucidate the contribution of the lectin pathway to IgAN, we measured the 11 plasma lectin
pathway components in a well-characterized cohort of patients with IgAN.
Results: M-ficolin, L-ficolin, mannan-binding lectin (MBL)–associated serine protease (MASP)-1 and MBL-
associated protein (MAp) 19 were increased, whereas plasma MASP-3 levels were decreased in patients
with IgAN compared with healthy controls. Progressive disease was associated with low plasma MASP-3
levels and increased glomerular staining for C3b/iC3b/C3c, C3d, C4d, C5b-9, and factor H–related protein 5
(FHR5). Glomerular FHR5 deposition positively correlated with glomerular C3b/iC3b/C3c, C3d, and C5b-9
deposition, but not with glomerular C4d. These observations, together with the finding that glomerular
factor H (fH) deposition was reduced in progressive disease, are consistent with a role for fH deregulation
by FHR5 in renal injury in IgAN.
Conclusion: Our data indicate that circulating MASP-3 levels could be used as a biomarker of disease
severity in IgAN and that glomerular staining for FHR5 could both indicate alternative complement
pathway activation and be a tissue marker of disease severity.
Kidney Int Rep (2018) 3, 426–438; https://doi.org/10.1016/j.ekir.2017.11.015
KEYWORDS: complement; IgA nephropathy; lectin; MBL
ª 2017 International Society of Nephrology. Published by Elsevier Inc. This is an open access article under the CC BY
license (http://creativecommons.org/licenses/by/4.0/).
IgA nephropathy (IgAN) is a common glomerular pa-thology that frequently causes renal failure, especially
in young people.1,2 IgAN is characterized by glomerulardeposits of galactose-deficient IgA1.3,4 Although a 4-hittheory is proposed for mesangial IgA deposition,5 themechanisms leading to glomerular injury remain poorlyunderstood. The clinical course of IgAN is heteroge-neous: after 20 years of follow-up from renal biopsy,up to 40% of patients will reach end-stage renal disease,
spondence: Matthew C. Pickering, Centre for Complement
flammation Research, Imperial College London, Hammer-
Campus, Du Cane Road, London W12 0NN, UK. E-mail:
ved 26 October 2017; revised 16 November 2017; accepted
vember 2017; published online 29 November 2017
but 20% of patients will have preserved renal function.6
Our incomplete understanding of IgAN pathogenesislimits the development of biomarkers allowing the iden-tification of patients who may benefit from immunosup-pression and disease-specific therapies.2,7
The complement system is an importantinflammation-generating arm of the immune system.Complement activation occurs in IgAN.8 Colocalizationof glomerular complement C3c with IgA is present in90% of cases.3 Serum levels of activated C39 andmesangial C3 deposition10 correlate with loss of renalfunction. The degree of complement regulation is alsoimportant. Imbalances in plasma factor H (fH), anessential negative regulator of C3 activation, and factorH–related (FHR) proteins 1 and 5, that deregulate fH,
Kidney International Reports (2018) 3, 426–438

NR Medjeral-Thomas et al.: MASP-3, FHR5, and IgA Nephropathy Severity CLINICAL RESEARCH
associate with IgAN.11,12 Complement activation leads tothe accumulation of C3 proteolytic fragments, such asC3dg, within glomeruli.8
The lectin pathway pattern-recognition moleculesinclude MBL (mannan-binding lectin), L-ficolin (alsocalled ficolin-2), M-ficolin (ficolin-1), H-ficolin (ficolin-3),collectin liver 1 (CL-L1, also called CL-10), and collectinkidney 1 (CL-K1 or CL-11). Following interaction withligands that include pathogen and/or damage-associated molecular patterns, the pattern-recognitionmolecules trigger complement activation throughcomplexed serine proteases: MBL-associated serineprotease (MASP)-1, MASP-2, and MASP-3. Pattern-recognition molecules also can bind nonenzymaticsubunits: MBL-associated protein (MAp) 19 andMAp44. The pathway generates a C3-convertase,termed C4bC2b.13 The C4b is further processed to C4d.The finding of glomerular C4d in the absence of C1q,the activator of the classic pathway of complement, inIgAN is consistent with lectin pathway activation.14
IgAN is characterized by disease flares followingrespiratory or gastrointestinal tract inflammation15;both IgA and the lectin complement pathway areimportant mediators of innate immunity at these sites.IgAN is associated with higher levels of IgA1 withexposed N-acetyl-galactosamine.5,16 N-acetyl-galactos-amine is a structure that may trigger lectin pathwayactivation due to interaction of ficolins with patterns ofacetyl-groups.17 Furthermore, MBL binds polymericIgA and triggers complement activation in vitro.18 Bothhigh and very low MBL levels were associated withpoor renal outcomes in a Chinese IgAN population.19
Roos et al.20 demonstrated glomerular MBL, L-ficolin,MASP1/3, and C4d deposition in 25% of patients withIgAN, which associated with disease severity. Thisfinding is supported by the association of glomerularC4d deposition with poor prognosis in IgAN.12,21
We hypothesized that the lectin pathway contrib-utes to glomerular inflammation and disease severity inIgAN. We examined (i) levels of circulating lectinpathway components; (ii) glomerular complementdeposition; and (iii) glomerular fH, FHR1, and FHR5deposition in IgAN. Using a cohort of patients withIgAN stratified into those with either stable or pro-gressive disease, we identified circulating lectinpathway components, glomerular complement proteindeposition, and immunohistologic evidence of fHderegulation that correlated with disease severity.
METHODS
Study Cohort and Clinical Measurements
We expanded our previously characterized11 Causes andPredictors of Outcome in IgANephropathy study cohort
Kidney International Reports (2018) 3, 426–438
of patients with biopsy-proven IgAN to 323 patients(Supplementary Figure S1, UK National Research EthicsService Committee number 14/LO/0155). Progressivedisease was defined by at least 1 of the following criteria:(i) end-stage renal disease without histology evidence ofa second pathology causing renal impairment; (ii) biopsyevidence of endocapillary hypercellularity, or (iii)cellular and/or fibrocellular crescents; (iv) treatmentwith immunosuppression for native IgAN; (v) clinicalHenoch-Schonlein purpura, unless spontaneous resolu-tion and>20 years of follow-upwith “stable” criteria; or(vi) 50% loss of estimated glomerular filtrationrate (eGFR) or average annual loss of eGFR of more than5 ml/min without evidence of a second pathologycausing renal impairment. Stable disease was defined asmeeting all of the following: (i) urine protein-creatinineratio less than 100 units or daily proteinuria of less than 1g/24 hours; (ii) combined Oxford classification22 MEST(mesangial hypercellularity [M], endocapillary hyper-cellularity [E], segmental glomerulosclerosis [S], inter-stitial fibrosis/tubular atrophy [T]) score of less than 3;and (iii) average annual loss of eGFR of less than 3ml/minper 1.73 m2. The transplantation cohorts have also beencharacterized.11 Control samples were obtained fromhealthy volunteers. The eGFR was calculated using theChronic Kidney Disease Epidemiology CollaborationCreatinine Equation.23
Protein Measurements
Levels of MBL,24 M-ficolin,25 H-ficolin,26 CL-L1,27
CL-K1,28 MASP-1,29 MASP-2,30 MASP-3,31 MAp19,32
and MAp4431 were measured using time-resolvedimmunofluorometric sandwich-type immunoassays aspreviouslydescribedusing“in-house” antibodies. PlasmaL-ficolin was measured by enzyme-linked immunosor-bent assay (Hycult Biotech, Uden, The Netherlands).Serum IgA and galactose-deficient IgA1 levels weremeasured by enzyme-linked immunosorbent assay.33
Histology
Immunohistochemistry protocols were optimized(Supplementary Figures S2–S4) for formalin-fixedparaffin-embedded renal biopsy tissue with thefollowing antibodies: rabbit polyclonal anti-human C3c(Dako, Glostrup, Denmark), rabbit polyclonal anti-human C4d (DB Biotech, Kosice, Slovakia), mousemonoclonal anti-human factor H (OX-24; Abcam,Cambridge, UK), rabbit polyclonal anti-human C3d(Abcam), mouse monoclonal anti-human C5b9 (Dako),mouse monoclonal anti-human FHR1 (Abnova, Taipei,Taiwan), and rabbit polyclonal anti-human FHR5(Abnova). The anti-C3c antibody cannot distinguishamong C3c, C3b, and iC3b, so we refer to this stainingas anti-C3b/iC3b/C3c. We graded antigen-staining
427

Table1.
Circulatinglectin
pathway
proteinlevelsin
IgAne
phropa
thy
Results
Assessmentcohort
Com
pletecohort
Patientswith
IgAN
,median(range),n[
125
Healthycontrols,
median(range),n[
211
Difference
between
medians
95%
CI
Patientswith
IgAN
,median(range),n[
323
Healthycontrols,median
(range),n[
262
Difference
between
medians
95%
CI
MBL,ng/m
l10
86(<
10–72
02)
1839
(<10
–72
02)
�753
�587
to17
1507
(<10
–70
02)
1557
(<10
–72
02)
�50
�249
to14
5
MBL,whiteonly,ng/m
l10
62(<
10–60
05),n¼
8518
39(<
10–72
02),n¼
211
�777
a�7
14to
�914
71(<
10–65
56),n¼
270
1534
(<10
–72
02),n¼
258
�63
�235
to17
0
MBL
<10
0,ng/m
l15
(12.0%
)26
(12.3%
)43
(13.3%
)32
(12.2%
)
M-ficolin,ng/m
l45
70(144
3–18
538)
4201
(145
8–10
243)
369b
181to
702
5422
(100
2–18
538)
4124
(115
9–10
243)
1299
c10
66to
1546
H-ficolin,ng/m
l35
466(961
7–82
262)
3630
3(692
8–74
806)
�837
�388
1to
1185
L-ficolin,ng/m
l30
82(963
–85
00)
2751
(982
–82
67)
341a
49to
576
3463
(872
–92
30)
2740
(659
–83
81)
723c
543to
960
CL-L1,
ng/m
l53
5(295
–96
9)53
4(337
–78
9)1
�22to
15
CL-K1,
ng/m
l40
5(111
–19
26)
391(206
–55
5)14
�1to
27
MASP-1,
ng/m
l10
325(434
3–20
322)
7789
(318
8–15
494)
2536
c19
49to
2936
1032
3(234
9–56
002)
8091
(449
0–18
130)
2233
c12
46to
2327
MASP-2,
ng/m
l51
4(114
–13
76)
490(110
–16
98)
24�2
0to
69
MASP-3,
ng/m
l62
48(292
4–12
101)
7038
(294
2–14
922)
�790
b�1
092to
�218
5836
(285
6–12
101)
7028
(294
2–14
922)
�119
2c�1
411to
�825
MAp19
,ng/m
l58
8(<
60–92
8)48
9(186
–11
40)
99c
73to
125
552(<
60–99
6)48
5(186
–11
40)
67c
51to
89
MAp44
,ng/m
l24
08(102
2–43
55)
2351
(132
3–44
17)
57�8
0to
174
CI,c
onfidenceinterval;C
L-K1,c
ollectin
kidney-1;C
L-L1,c
ollectin
liver-1;IgA
N,IgA
nephropathy;
MAp
,MBL
-associatedprotein;
MAS
P,MBL
-associatedserin
eprotease;M
BL,m
annan-bindinglectin.
a P<
0.05.
b P<
0.005.
c P<
0.0001.
CLINICAL RESEARCH NR Medjeral-Thomas et al.: MASP-3, FHR5, and IgA Nephropathy Severity
intensities from anonymized sections as 0 (absent), 0.5(minimal), 1þ, 2þ, and 3þ. Staining described as“positive” includes 1þ, 2þ, and 3þ. Stainingdescribed as “negative” includes 0 and 0.5. For tubularcell FHR1 staining, we used the area of most intensestaining to grade tubular cell FHR1 staining intensityfrom 0 to 3. We identified 41 IgAN biopsies with me-dian of 6 glomeruli per section (range 2–16). All bi-opsies had absent or nonsignificant C1q stainingdocumented in clinical reports. We excluded sectionsthat contained <2 nonsclerosed glomeruli.
Statistical Analysis
Analyses were performed using GraphPad Version 6.00for Windows (La Jolla, CA). Normally distributedcontinuous variables were compared using unpaired orpaired t-test and 1-way analysis of variance for multi-ple groups. Continuous variables with skewed distri-bution were tested using Mann-Whitney U tests,Kruskal-Wallis tests for multiple groups, and Wil-coxon matched-pairs signed rank test for matchedtransplant samples. Confidence intervals (CIs) werecalculated using the Hodges-Lehmann method; cate-gorical data compared using the Fisher exact test; andcorrelation assessed using Pearson or Spearman ranktests. We adjusted for multiple analyses with the 2-stage linear step-up procedure of Benjamini, Krieger,and Yekutieli.34
RESULTS
Plasma M-Ficolin, L-Ficolin, MASP-1, and
MAp19 Are Increased, Whereas Plasma MASP-3
Levels Are Reduced in IgAN
Due to the large number of cases and lectin proteins, wequantified lectin pathway plasma concentrations in 2stages. In the assessment cohort of 125 patients withIgAN and 211 controls, we measured the plasma con-centrations of MBL, MASP-1, MASP-2, MASP-3,MAp19, MAp44, CL-K1, CL-L1, M-ficolin, H-ficolin,and L-ficolin (Table 1). We found plasma levels of M-ficolin, L-ficolin, MASP-1, and MAp19 were increased,whereas MASP-3 levels were reduced in patients. Thiswas confirmed in our entire patient cohort (n ¼ 323,Table 1). The difference in MBL level seen in theassessment cohort between white patients with IgANand healthy controls was not replicated. The proportionof MBL-deficient individuals (plasmaconcentration <100 ng/ml) did not differ between pa-tients and controls (Table 1). Notably, as the 2 proteinsare alternative splice products from the same gene(MASP-2), 1 patient had a very low plasma MAp19 level(<65 ng/ml) but normal plasma MASP-2 level (180 ng/ml). M-ficolin is expressed in peripheral blood leuco-cytes.35 There was a positive correlation between plasma
428 Kidney International Reports (2018) 3, 426–438

NR Medjeral-Thomas et al.: MASP-3, FHR5, and IgA Nephropathy Severity CLINICAL RESEARCH
M-ficolin and white cell count (r ¼ 0.38, P < 0.0001;Supplementary Figure S5). However, 93% of our cohorthad a white cell count in the normal range. L-ficolin,MASP-1, MAp19, and MASP-3 are expressed by hepa-tocytes.13 We identified a positive correlation betweenplasma MASP-3 and alanine aminotransferase (r ¼ 0.31,P¼ 0.0015; Supplementary Figure S5), a marker of liverinflammation. No associations were identified betweenalanine aminotransferase and plasma L-ficolin, MASP-1,or MAp19 concentrations (data not shown). PlasmaMASP-3 levels did not correlate with proteinuria(Supplementary Figure S5).
Plasma M-Ficolin and MAp19 Levels Are
Influenced by Glomerular Filtration Rate
There was no relationship between eGFR and plasmalevels of either L-ficolin or MASP-1 (Supplementary
0
5000
10000
15000
20000
M-fi
colin
(ng/
ml)
Controls(n=262)
0
5000
10000
15000
20000
MA
SP
-3 (n
g/m
l)
Controls(n=262)
IgAN(n=323)
a
b
c
0
5000
10000
15000
20000
MA
SP
-3 (n
g/m
l)M
AS
P3
(ng/
ml)
n= 262 99133
eGFR <30>60
Controls IgAN
0
5000
10000
15000
20000
M-fi
colin
(ng/
ml)
M-fi
colin
(ng/
ml)
n= 262
eGFR
Controls
0
5000
10000
0
5000
10000
15000
Transplant
Figure 1. Plasma lectin pathway components in IgA nephropathy. (a) Plasm3 (left), M-ficolin (middle), and MBL-associated protein (MAp) 19 (right) inMann-Whitney test. (b) Plasma MASP-3 (left), M-ficolin (middle), and MApreduced (<30 ml/min) estimated glomerular filtration rate (eGFR) and healtMASP-3 (left), M-ficolin (middle), and MAp19 (right) before and after reautosomal dominant polycystic kidney disease (ADPKD, gray circles). P v
Kidney International Reports (2018) 3, 426–438
Figure S6). Plasma MASP-3 levels positively correlated(r ¼ 0.29, P < 0.0001), whereas M-ficolin and MAp19negatively correlated with eGFR (r ¼ �0.17, P ¼ 0.002and r ¼ �0.13, P ¼ 0.02, respectively; SupplementaryFigure S6). Increased plasma M-ficolin and MAp19,and reduced MASP-3 levels, were still evident when wecompared patients with preserved eGFR (>60 ml/min)with healthy controls (Figure 1b). These differencesincreased in magnitude when we compared patientswith reduced eGFR (<30 ml/min) with healthy controls(Figure 1b). To determine if these changes were solelydue to their association with progressive disease, wecompared plasma levels before and after renal trans-plantation.11 Although plasma M-ficolin and MAp19levels fell significantly posttransplantation in both IgANand a cohort of adult polycystic kidney disease, plasmaMASP-3 levels did not change (Figure 1c).We concluded
IgAN(n=323)
0
500
1000
1500
MA
p19
(ng/
ml)
Controls(n=262)
IgAN(n=323)
0
500
1000
1500
MA
p19
(ng/
ml)
MA
p19
(ng/
ml)
n= 262 99133
eGFR <30>60
Controls IgAN
99133
<30>60
IgAN
0
500
1000
1500
2000
Transplant
a mannan-binding lectin (MBL)–associated serine protease (MASP)-patients with IgAN and healthy controls. P values derived from the19 (right) in patients with IgAN with either preserved (>60 ml/min) orhy controls. P values derived from the Kruskal-Wallis test. (c) Plasmanal transplantation in patients with either IgAN (white circles) oralues derived from Wilcoxon matched-pairs signed rank test.
429

CLINICAL RESEARCH NR Medjeral-Thomas et al.: MASP-3, FHR5, and IgA Nephropathy Severity
that M-ficolin and MAp19 levels were influenced byboth IgAN and eGFR, whereas MASP-3 levels wereinfluenced only by IgAN.
MASP-3 Plasma Levels Are Associated With
IgAN Severity
To explore the significance of the altered lectinpathway levels in IgAN, we compared patients witheither stable or progressive disease. M-ficolin, L-ficolin,MASP-1, and MAp19 did not differ between thegroups (Supplementary Figure S7); however, MASP-3levels were reduced in patients with progressive dis-ease (Figure 2a), including those with progressive dis-ease despite immunosuppressive therapy (Figure 2b).Given the demonstrated stability of MASP-3 serologylevels over time,31,36 we compared plasma levels(sampled at recruitment) with the Oxford Classificationof IgA Nephropathy22 scores from diagnostic renal bi-opsies. Plasma MASP-3 levels were lower in the patient
a
c
0
5000
10000
15000
20000
MA
SP
-3 (n
g/m
l)
P=0.003 P=0.011
n= 262 19183
Controls IgAN
Stable Progressive
P<0.0001
0
5000
10000
15000
MA
SP
-3 (n
g/m
l)
n= 44 217
P = 0.007
M 0 1
Figure 2. Plasma MASP-3 and progressive IgA nephropathy (IgAN). (a)(MASP)-3 levels in patients with stable or progressive IgAN compared witPlasma MASP-3 levels in patients with stable or progressive IgAN despiteWhitney test. (c) Plasma MASP-3 plasma levels in patients with IgAN wit(M). (d) Plasma MASP-3 plasma levels in patients with IgAN without (0, grathe Mann-Whitney test.
430
cohort with biopsy evidence of mesangial hyper-cellularity (Figure 2c) and tubular atrophy (Figure 2d).Plasma MAp19 levels were higher in patients withsegmental sclerosis (mean 576 vs. 539 ng/ml; difference37; 95% CI: 2–73 ng/ml; P ¼ 0.040). We did notidentify associations between histology parameters andM-ficolin, L-ficolin, or MASP-1 levels.
Glomerular Complement Deposition Is
Associated With Progressive IgAN
To understand the significance of the association be-tween MASP-3 levels and progressive IgAN, weassessed complement deposition in our stable andprogressive cohorts (Figure 3). In progressive comparedwith stable disease, there was proportionately greaterglomerular staining for C3b/iC3b/C3c (odds ratio [OR]:5.66; 95% CI: 1.49–23.39; P ¼ 0.02), C3d (OR: 17.6;95% CI: 3.01–89.97; P ¼ 0.001), C4d (OR: 8.32; 95% CI:2.00–30.33; P ¼ 0.004), and C5b9 (OR: 12.14; 95%
b
d
0
5000
10000
15000M
AS
P-3
(ng/
ml)
P= 0 .0 3 9
n= 38 23
IgAN post IS Stable Progressive
0
5000
10000
15000
MA
SP
-3 (n
g/m
l)
P = 0.027
n= 37 67
T 0 1
Plasma mannan-binding lectin (MBL)–associated serine proteaseh healthy controls. P values derived from the Kruskal-Wallis test. (b)immunosuppressive therapy (IS). P values derived from the Mann-
hout (0, gray box) and with (1, white box) mesangial hypercellularityy box) and with (1, white box) tubular atrophy. P values derived from
Kidney International Reports (2018) 3, 426–438

C3d C4d C5b9a
b
C3b/iC3b/C3c
+
–
Figure 3. Glomerular complement staining in IgA nephropathy (IgAN). (a) Representative images for complement C3b/iC3b/C3c, C3d, C4d, orC5b9. The top row represents present (þ) and the bottom row represents negative (�) staining. Original magnification �400. Bar ¼ 100 mm. (b)Proportion of cases with present (black) versus absent/uncertain (gray) glomerular staining in stable and progressive IgAN. P values derivedfrom the Fisher exact test.
NR Medjeral-Thomas et al.: MASP-3, FHR5, and IgA Nephropathy Severity CLINICAL RESEARCH
CI: 1.95–61.35; P ¼ 0.004). Glomerular C5b-9 staining,a marker of complement terminal pathway activation,significantly correlated with both glomerular C3b/iC3b/C3c and C3d but not C4d staining (Table 2). There wasno correlation between glomerular C4d and either C3dor C3b/iC3b/C3c.
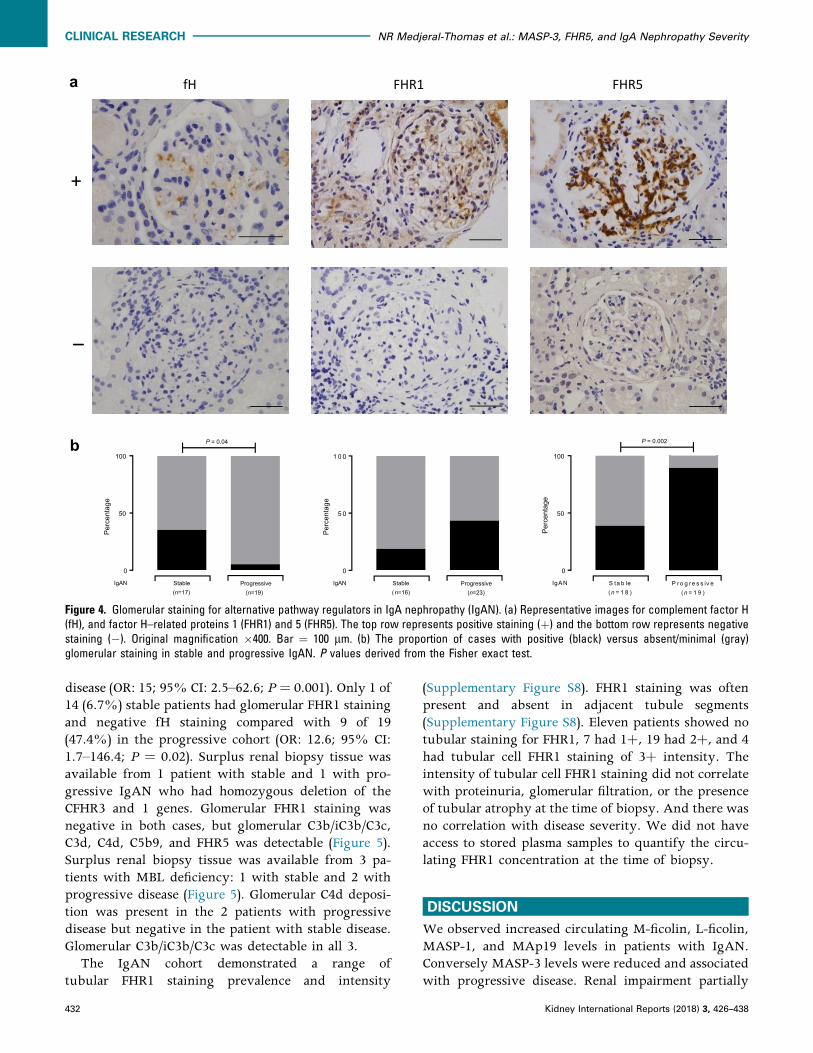
Glomerular FHR5 Deposition Is Associated With
Progressive IgAN
We have previously shown levels of negative (fH) andpositive regulators (FHR1, FHR5) of the complementalternative pathway associated with progressiveIgAN.11 In progressive disease, there wasmore glomerular staining for FHR5 (OR: 13.4; 95%
Table 2. Correlation of mesangial complement antigen intensity in IgA neCorrelation coefficient R values C3b/iC3b/C3c C3d C4d
C3b/iC3b/C3c – 0.45 (P ¼ 0.01) 0.31 (P ¼ 0.09) 0
C3d – 0.22 (P ¼ 0.20) 0
C4d –
C5b9
fH
FHR1
FHR5
A correlation of complement antigen-staining intensities in sections from the same biopsy, ucorrelation. P values shown have been adjusted for multiple analyses to minimize the falseYekutieli). fH, factor H; FHR1, factor H–related protein 1; FHR5, factor H–related protein 5.
Kidney International Reports (2018) 3, 426–438
CI: 2.2–66.9; P ¼ 0.002) and a trend for greater FHR1staining (Figure 4). In contrast, glomerular staining forfH was significantly reduced in progressive comparedwith stable disease (OR: 0.10; 95% CI: 0.008–0.87;P ¼ 0.04). Glomerular FHR5 staining correlated withglomerular C3b/iC3b/C3c, C3d, and C5b-9 but not C4d(Table 2). In aggregate, a heat map of the glomerularstaining data showed that the renal biopsies from pa-tients with progressive disease had more staining forC3b/iC3b/C3c, C3d, C4d, C5b9, and FHR5 than thosewith stable disease (Figure 5). Interestingly, the com-bination of FHR5 staining with negative fH stainingwas significantly more common in patients with pro-gressive (15/18, 88.2%) versus stable (4/16, 25%)
phropathy native renal biopsiesC5b9 fH FHR1 FHR5
.57 (P < 0.001) 0.06 (P ¼ 0.52) �0.28 (P ¼ 0.8) 0.64 (P < 0.001)
.53 (P ¼ 0.003) �0.29 (P ¼ 0.11) �0.11 (P ¼ 0.42) 0.68 (P < 0.001)
0.34 (P ¼ 0.08) �0.22 (P ¼ 0.19) 0.08 (P ¼ 0.45) 0.27 (P ¼ 0.12)
– �0.26 (P ¼ 0.14) �0.31 (P ¼ 0.09) 0.75 (P < 0.001)
– �0.33 (P ¼ 0.09) �0.16 (P ¼ 0.30)
– �0.31 (P ¼ 0.09)
–
sing the 0, 0.5, 1þ, 2þ, and 3þ scale. R values are calculated from Spearman’s rankdiscovery rate (using the 2-stage linear step-up procedure of Benjamini, Krieger, and
431
fH
0
50
100
Per
cent
age
P = 0.04
IgAN Stable(n=17)
Progressive(n=19)
FHR1
0
50
100
Per
cent
age
IgA N S ta b le(n = 1 8 )
P ro g re s s iv e(n = 1 9 )
P = 0.002
FHR5
0
5 0
1 0 0
Per
cent
age
IgAN Stable(n=16)
Progressive(n=23)
a
b
+
–
Figure 4. Glomerular staining for alternative pathway regulators in IgA nephropathy (IgAN). (a) Representative images for complement factor H(fH), and factor H–related proteins 1 (FHR1) and 5 (FHR5). The top row represents positive staining (þ) and the bottom row represents negativestaining (�). Original magnification �400. Bar ¼ 100 mm. (b) The proportion of cases with positive (black) versus absent/minimal (gray)glomerular staining in stable and progressive IgAN. P values derived from the Fisher exact test.
CLINICAL RESEARCH NR Medjeral-Thomas et al.: MASP-3, FHR5, and IgA Nephropathy Severity
disease (OR: 15; 95% CI: 2.5–62.6; P ¼ 0.001). Only 1 of14 (6.7%) stable patients had glomerular FHR1 stainingand negative fH staining compared with 9 of 19(47.4%) in the progressive cohort (OR: 12.6; 95% CI:1.7–146.4; P ¼ 0.02). Surplus renal biopsy tissue wasavailable from 1 patient with stable and 1 with pro-gressive IgAN who had homozygous deletion of theCFHR3 and 1 genes. Glomerular FHR1 staining wasnegative in both cases, but glomerular C3b/iC3b/C3c,C3d, C4d, C5b9, and FHR5 was detectable (Figure 5).Surplus renal biopsy tissue was available from 3 pa-tients with MBL deficiency: 1 with stable and 2 withprogressive disease (Figure 5). Glomerular C4d deposi-tion was present in the 2 patients with progressivedisease but negative in the patient with stable disease.Glomerular C3b/iC3b/C3c was detectable in all 3.
The IgAN cohort demonstrated a range oftubular FHR1 staining prevalence and intensity
432
(Supplementary Figure S8). FHR1 staining was oftenpresent and absent in adjacent tubule segments(Supplementary Figure S8). Eleven patients showed notubular staining for FHR1, 7 had 1þ, 19 had 2þ, and 4had tubular cell FHR1 staining of 3þ intensity. Theintensity of tubular cell FHR1 staining did not correlatewith proteinuria, glomerular filtration, or the presenceof tubular atrophy at the time of biopsy. And there wasno correlation with disease severity. We did not haveaccess to stored plasma samples to quantify the circu-lating FHR1 concentration at the time of biopsy.
DISCUSSION
We observed increased circulating M-ficolin, L-ficolin,MASP-1, and MAp19 levels in patients with IgAN.Conversely MASP-3 levels were reduced and associatedwith progressive disease. Renal impairment partially
Kidney International Reports (2018) 3, 426–438

IgAN severity CFHR3-1 copies MBL deficient C3b/iC3b/C3c C3d C4d C5b9 fH FHR1 FHR5
Stable 2 No 0 0 0 0.5 0 0 0
Stable 2 No 0 0.5 0.5 1 0.5 0.5 0
Stable 2 No 0.5 1 0 0 1 0.5
Stable 1 No 0.5 1 0 0 0 0.5 0
Stable 2 No 0.5 0.5 0 0.5 0.5 0 0.5
Stable 2 No 0.5 0.5 0 1 0
Stable 1 No 0.5 0.5 0.5 1 0 0.5 0.5
Stable 2 No 0.5 1 0.5 2 0 0.5 1
Stable 1 No 0.5 0.5 1 0.5 0.5 0.5 0.5
Stable 1 No 0.5 1 1 0.5 0 1 1
Stable 2 No 0.5 0 1 0.5 1
Stable 1 No 1 0 0 3 0.5 0 2
Stable 2 Yes 1 0.5 1 1 2
Stable 2 No 1 0.5 0.5 0.5 1 0.5
Stable 2 No 1 0.5 1 1 0 0.5 1
Stable 0 No 1 1 1 2 1 0 2
Stable 2 No 1 0 2 0 1 0.5 0
Stable 2 No 2 0.5 0.5 0 1 0 0.5
Stable 2 No 0 0.5
Progressive 2 No 0.5 1 1
Progressive 2 No 0.5 1 1 1 0 2 1
Progressive 2 No 0.5 2 0.5 1 0 1 2
Progressive 2 No 0.5 1 1 2 0 0.5 2
Progressive 1 No 1 0.5 0
Progressive 1 No 1 1 0
Progressive 1 Yes 1 0.5 1 0.5 0 2 0.5
Progressive 2 No 1 0.5 1 0.5 0 2
Progressive 2 Yes 1 1 1 1 0.5 1 1
Progressive 1 No 1 1 1 0.5
Progressive 2 No 1 1 1 2 0 2 1
Progressive 2 No 1 1 1 2 0 0 1
Progressive 1 No 1 1 1 2 0.5 0 2
Progressive 0 No 1 1 2 2 0.5 0 2
Progressive 2 No 1 1 2 3 0 1 0
Progressive 1 No 2 0.5 0 1 2
Progressive 2 No 2 0.5 2 0 1 2
Progressive 1 No 2 2 1 2 0 0 3
Progressive 2 No 2 2 1 2 0 0.5 3
Progressive 2 No 2 2 1 3 0 0 3
Progressive 2 No 3 2 2 3 0 0 3
Progressive 2 No 3 1 1 3 0 0.5 3
Progressive 1 No 3 2 0.5 3 1 0 3
Glomerular staining score: 0 0.5 1 2 3
Figure 5. Complement glomerular deposition in IgA nephropathy (IgAN). Glomerular staining intensity scores from surplus native renal biopsytissue from patients with either stable or progressive IgAN. Each row represents information from a single patient. Staining intensity wasscored: 0, absent; 0.5, minimal; 1, mild; 2, moderate; 3, strong. Filled cells indicate insufficient renal tissue to perform staining. Mannan-bindinglectin (MBL) deficiency was defined as a plasma level of less than 100 ng/ml. CFHR3-1, complement factor H–related 3 and 1 genes; fH,complement factor H; FHR1, factor H–related protein 1; FHR5, factor H–related protein 5.
NR Medjeral-Thomas et al.: MASP-3, FHR5, and IgA Nephropathy Severity CLINICAL RESEARCH
explained the differences in M-ficolin and MAp19levels, because these levels changed significantlyfollowing renal transplantation. M-ficolin is mainlysynthesized in monocytes and granulocytes,37 butalmost all of our patients had a normal white cell count.
Kidney International Reports (2018) 3, 426–438
Although MASP-3 showed a positive correlation withalanine aminotransferase, we identified negative cor-relations with MASP-3 levels and IgAN severity. Wetherefore think it is unlikely that the M-ficolin andMASP-3 results are explained by confounding with
433

CLINICAL RESEARCH NR Medjeral-Thomas et al.: MASP-3, FHR5, and IgA Nephropathy Severity
leucocyte count and liver inflammation, respectively.Furthermore, MBL,38 M-ficolin,25 L-ficolin,39 MASP-1,40
and MAp1932 are not acute-phase proteins. CirculatingMASP-3 levels did not correlate with proteinuria,excluding this as a cause for the low levels, and there isno clear genotype-phenotype correlation to explain thevariation in MASP-3 levels.41
How these changes relate to IgAN pathogenesis isunclear. Increased MASP-142 and MAp1942 levels occurin lupus nephritis, so these changes are not specific toIgAN. Glomerular L-ficolin and MASP1/3 stainingcorrelated with IgAN severity,20 but circulating L-fico-lin levels did not.20 In fact, reduced circulating L-ficolinlevels have been reported in lupus nephritis,43 althoughthiswas not replicated in a Japanese cohort,44 in additionto reduced M-ficolin levels.29 M-ficolin35 and L-ficolin45
are capable of triggering lectin pathway activation, andMASP-1 is essential for MASP-2 and lectin complementactivation,46 so higher levels of these 3 componentscould be associated with greater complement activationwithin the kidney. The significance of the raisedMAp19is unclear. It has been shown to have a regulatory role onlectin pathway activation in vitro,47 but the physiolog-ical relevance of this is unknown.32
MASP-3 levels are lower in patients with systemiclupus erythematosus with nephritis compared withthose without,42 so low MASP-3 levels are not specificto IgAN. When MASP-3 binds to pattern-recognitionmolecules, it can displace MASP-2 and MASP-1,48
and, because it does not lead to convertase forma-tion,49 inhibit activation.48,50 Low levels of MASP-3could be associated with increased complement acti-vation. However, MASP-3 activates pro-factor D tofactor D,51 a requirement for C3-convertase forma-tion.52 Whether or not glomerular activation of thealternative pathway in either lupus nephritis or IgANdirectly influences MASP-3 levels is unknown.
We replicated the association between IgAN severityand glomerular C3b/iC3b/C3c10 and C4d.20,21 Our dataalso showed an association between progressive IgANand glomerular C3d and C5b9. Glomerular C4d did notcorrelate with either C3b/iC3b/C3c or C5b9. This mayreflect technical limitations (e.g., sample size, stainingprocedure), but also could be because the amount ofC4d, compared with C3 and C5b-9, will be lower afterglomerular complement activation. Previous studieshave identified glomerular C3 and C5b9 in most C4d-positive and -negative cases, but did not record anti-gen correlations.20,21
The correlation of glomerular FHR5 deposition withprogressive IgAN is a key finding of our study.Glomerular FHR5 correlated with C3b/iC3b/C3c, C3d,and C5b9 staining, as previously reported.53 In a
434
proteomic analysis, glomerular FHR5 was 1.79 timesmore abundant in patients with progressive versusstable IgAN.54 FHR5 antagonizes the ability of fH tonegatively regulate C3 activation.55,56 Consequently, itwas interesting that patients with progressive diseasehad more cases of glomerular FHR5 staining in theabsence of fH. Notably, there are phenotypic similar-ities between IgAN and familial C3 glomerulopathyassociated with mutant FHR5 proteins.57,58
Considering the genetic and serology associationsbetween IgAN and FHR1,11,12,59,60 it was surprisingthat glomerular FHR1 was absent in more than 50% ofprogressive IgAN biopsies. Unlike FHR5, glomerularFHR1 did not correlate with other complement anti-gens. This could be explained by differences in bind-ing avidity of FHR1 and FHR5 to C3b, iC3b, andC3dg.55 Nevertheless, our data indicate a more promi-nent role for FHR5 than FHR1 in complement activationin IgAN. Notably, 1 patient with progressive diseasewas deficient in FHR1.
The cause of tubular cell FHR1 staining is unclear. Itdid not correlate with proteinuria at the time of biopsy.It may result from changes to the tubular cell mem-brane as a consequence of nephron loss or changes intubular fluid characteristics, such as acidity, or tubularepithelia or glycocalyx features.
Our complement staining data demonstrated thepathogenic heterogeneity of IgAN. For example, the co-deposition of FHR5, C3d, C3b/iC3b/C3c, and C5b9,especially in the absence of fH, implies FHR5-dependent fH deregulation and alternative pathwayactivation, and glomerular co-deposition of C4d withC3b/iC3b/C3c and C5b9 may reflect complement acti-vation triggered by the lectin pathway. Interestingly,all 4 biopsies from patients with progressive diseaseand negative glomerular C4d had FHR5 staining.Identifying and understanding this heterogeneity ofcomplement activity might be clinically importantbecause we now have the ability to target complementactivation at specific points in the activation sequence.For example, OMS721, a monoclonal antibody targetingMASP-2, was recently designated breakthrough ther-apy status for IgAN treatment; Eculizumab, a C5 in-hibitor, has been used in recurrent61 andprogressive62,63 IgAN; and factor D inhibitors are inclinical trials for C3 glomerulopathy.64
Although our observations require confirmation inlarger IgAN cohorts, our data indicate (Figure 6) that (i)circulating MASP-3 is a potential biomarker of diseaseseverity in IgAN; and (ii) glomerular FHR5 staining ofdiagnostic biopsies can identify those with severedisease who are at risk of progression to renalimpairment.
Kidney International Reports (2018) 3, 426–438

Carbohydrate / acetyl pa�erns
MBL, M-ficolin, L-ficolin, H-ficolin, CL-K1, CL-L1
MASP-1, MASP-2, MASP-3, MAp19, MAp44
PRM
Ligand
Lec�n pathway Alterna�ve pathway
C3b
C4b
Spontaneous C3 hydrolysis
C3b
C5 C5b-9
C5a
fH
fIiC3b C3d
Amplifica�on loop Terminal pathway
a
Pathway molecules
C4d
GLOMERULUS
PLASMA FHR1:fH11,12
FHR511
MASP-3
C3b/iC3b/C3c10
C3d
C4d12,20,21
C5b-9
FHR5
fH
FHR1 + absent fH
Progressive IgAN
Stable IgAN
b
Figure 6. Complement and IgA nephropathy. (a) Schematic diagram depicting lectin and alternative pathway complement activation. Lectinpathway activation is triggered by the binding of pattern-recognition molecules (PRMs) to carbohydrate or acetyl molecular patterns. Alter-native pathway activation happens through the spontaneous, constant generation of reactive forms of C3. Both pathways result in the gen-eration of C3b. C3b can be proteolytically cleaved to iC3b and C3d by complement factor I in the presence of cofactors, such as complementfactor H. Similarly, C4b produced during lectin pathway activation can be cleaved to C4d. C3b generation can be rapidly amplified through anamplification loop. This results in the generation of large amounts of the opsonin C3b and can trigger complement C5 activation. This leads tothe generation of the anaphylatoxin C5a, and the membrane attack complex (C5b-9) through the terminal pathway. fH, factor H; fI, factor I; MAp,MBL-associated protein; MASP, MBL-associated serine protease; MBL, mannose-binding lectin. (b) Complement proteins and severity of IgAnephropathy. Within plasma, increased levels of FHR1,11,12 FHR5,11 and the FHR1:fH ratio11,12 associate with progressive IgAN. Conversely, wefound that reduced levels of MASP-3 associated with progressive disease. Within glomeruli, we replicated the association between increasedC4d12,20,21 and C3b/iC3b/C3c10 with IgAN severity, and we showed that increased glomerular C3d, C5b-9, and FHR5 associated with progressivedisease. The presence of FHR1 in the absence of fH was also more frequently seen in patients with progressive disease. FHR1, factor H–relatedprotein 1; FHR5, factor H–related protein 5. (Continued)
NR Medjeral-Thomas et al.: MASP-3, FHR5, and IgA Nephropathy Severity CLINICAL RESEARCH
Kidney International Reports (2018) 3, 426–438 435

c
GLOMERULUS
C3b/iC3b/C3c
C3d
MASP-3
GLOMERULUS
Progressive IgANStable IgAN
gd-IgA1
C3b
Alterna�ve pathway
FHR5FHR1:fH ra�o
FHR5FHR1:fH ra�o
Lec�n pathway
C4d
C3d C5b-9
FHR5C3b/iC3b/C3cC4d
Lec�n pathway
MASP-3
Figure 6. (Continued) (c) A hypothetical depiction of glomerular complement activation in IgA nephropathy. Galactose-deficient IgA1 (gd-IgA1)activates the lectin and alternative complement pathways in IgAN.8 Glomerular complement deposition is enhanced in progressive disease.Glomerular complement activation is influenced by FHR5, and the FHR1-fH ratio and associated with changes in circulating MASP-3 levels.Changes in FHR1, FHR5, and fH influence complement activation through the alternative pathway. fH negatively regulates activation, whereasFHR1 and FHR5 promote activation through antagonizing fH (“fH deregulation”). The mechanism through which circulating MASP-3 levels fall inprogressive disease are not understood but are presumed to be linked to lectin pathway activation. Red text highlights proteins demonstrated toassociate with progressive IgAN, and the larger boxes indicate more deposition.
CLINICAL RESEARCH NR Medjeral-Thomas et al.: MASP-3, FHR5, and IgA Nephropathy Severity
DISCLOSURE
All the authors declared no competing interests.
ACKNOWLEDGMENTS
NM-T is funded by a Kidney Research UK PhD clinical
Research Fellowship (TF14/2015). MCP is a Wellcome
Trust Senior Fellow in Clinical Science (WT082291MA).
We acknowledge support by the National Institute for
Health Research Biomedical Research Centre based at
Imperial College Healthcare National Health Service
Trust and Imperial College London, and from the Na-
tional Institute for Health Research Clinical Research
Network. The views expressed are those of the authors
and not necessarily those of the National Health Service,
the National Institute for Health Research, or the
Department of Health. This work was also supported by
funding from the Medical Research Council (MR/
K01353X/1). We acknowledge the support from the
Danish National Research Foundation and the Lundbeck
Foundation. We thank all the Causes and Predictors of
Outcome in IgA Nephropathy study patients and local
research staff.
SUPPLEMENTARY MATERIAL
Figure S1. Table of IgA nephropathy and healthy control
cohort characteristics.
Figure S2. Representative images of renal immuno-
histochemistry staining for complement pathway
antigens: C3b/iC3b/C3c, C3d, C4d, and C5b-9. Original
magnification �400. Bar ¼ 100 mm.
436
Figure S3. Representative images of renal immuno-
histochemistry staining for complement pathway
antigens: FHR1, FHR5, and fH. Original magni-
fication �400. Bar ¼ 100 mm.
Figure S4. Representative image of liver immuno-
histochemistry staining for fH. Original magni-
fication �400. Bar ¼ 100 mm.
Figure S5. Graphs showing the (a) correlation of plasma
MASP-3 levels and urine protein-creatinine ratio (PCR) in
patients (n ¼ 223) with IgA nephropathy (IgAN); (b) the
correlation of plasma M-ficolin with white cell count (WCC)
in patients (n ¼ 108) with IgAN; and (c) the correlation
between mannan-binding lectin (MBL)-associated serine
protease (MASP)-3 with alanine aminotransferase (ALT) in
patients (n ¼ 108) with IgAN.
Figure S6. Graphs showing the correlation between
estimated glomerular filtration rate (eGFR) and (a)
M-ficolin, (b) mannan-binding lectin (MBL)-associated
protein (MAp) 19, (c) MBL-associated serine protease
(MASP)-3 levels, (d) L-ficolin, and (e) MASP-1 levels.
Figure S7. Table of circulating lectin pathway protein levels
in stable and progressive IgA nephropathy.
Figure S8. Renal immunohistochemistry staining for
factor H–related protein 1 (FHR1) in IgA nephropathy.
Representative images of tubular staining intensity 3þ (a),
2þ (b), 1þ (c), and 0 (d–f). (f) Representative image from a
patient with complete FHR1 deficiency. Bar ¼ 100 mm.
Correlation of tubular FHR1 staining intensity with
estimated glomerular filtration rate (eGFR, g) at the time of
biopsy, urine protein-creatinine ratio (UPCR) at the time of
biopsy (h), the presence (T1 or T2) or absence (T0) of tubular
Kidney International Reports (2018) 3, 426–438

NR Medjeral-Thomas et al.: MASP-3, FHR5, and IgA Nephropathy Severity CLINICAL RESEARCH
atrophy from the biopsy report (i); and disease severity at
enrollment (j).Nocorrelations reachedstatistical significance.
Supplementary material is linked to the online version of
the paper at www.kireports.org.
REFERENCES
1. McGrogan A, Franssen CF, de Vries CS. The incidence of
primary glomerulonephritis worldwide: a systematic review
of the literature. Nephrol Dial Transplant. 2011;26:414–430.
2. Wyatt RJ, Julian BA. IgA nephropathy. N Engl J Med.
2013;368:2402–2414.
3. Jennette JC. The immunohistology of IgA nephropathy. Am J
Kidney Dis. 1988;12:348–352.
4. Lai KN. Pathogenesis of IgA nephropathy. Nat Rev Nephrol.
2012;8:275–283.
5. Knoppova B, Reily C, Maillard N, et al. The origin and activ-
ities of IgA1-containing immune complexes in IgA nephrop-
athy. Front Immunol. 2016;7:117.
6. D’Amico G. Natural history of idiopathic IgA nephropathy and
factors predictive of disease outcome. Semin Nephrol.
2004;24:179–196.
7. Rauen T, Eitner F, Fitzner C, et al. Intensive supportive care
plus immunosuppression in IgA nephropathy. N Engl J Med.
2015;373:2225–2236.
8. Maillard N, Wyatt RJ, Julian BA, et al. Current understanding
of the role of complement in IgA nephropathy. J Am Soc
Nephrol. 2015;26:1503–1512.
9. Zwirner J, Burg M, Schulze M, et al. Activated complement
C3: a potentially novel predictor of progressive IgA ne-
phropathy. Kidney Int. 1997;51:1257–1264.
10. Kim SJ, Koo HM, Lim BJ, et al. Decreased circulating C3
levels and mesangial C3 deposition predict renal outcome in
patients with IgA nephropathy. PLoS One. 2012;7:e40495.
11. Medjeral-Thomas NR, Lomax-Browne HJ, Beckwith H, et al.
Circulating complement factor H-related proteins 1 and 5
correlate with disease activity in IgA nephropathy. Kidney Int.
2017;92:942–952.
12. Tortajada A, Gutierrez E, Goicoechea de Jorge E, et al.
Elevated factor H-related protein 1 and factor H pathogenic
variants decrease complement regulation in IgA nephropa-
thy. Kidney Int. 2017;92:953–963.
13. Kjaer TR, Thiel S, Andersen GR. Toward a structure-based
comprehension of the lectin pathway of complement. Mol
Immunol. 2013;56:413–422.
14. Miyazaki R, Kuroda M, Akiyama T, et al. Glomerular deposi-
tion and serum levels of complement control proteins in pa-
tients with IgA nephropathy. Clin Nephrol. 1984;21(6):
335–340.
15. Wyatt RJ, Kanayama Y, Julian BA, et al. Complement acti-
vation in IgA nephropathy. Kidney Int. 1987;31:1019–1023.
16. Berthoux F, Suzuki H, Thibaudin L, et al. Autoantibodies
targeting galactose-deficient IgA1 associate with progres-
sion of IgA nephropathy. J Am Soc Nephrol. 2012;23:
1579–1587.
17. Thiel S. Complement activating soluble pattern recognition
molecules with collagen-like regions, mannan-binding lectin,
ficolins and associated proteins. Mol Immunol. 2007;44:
3875–3888.
Kidney International Reports (2018) 3, 426–438
18. Roos A, Bouwman LH, van Gijlswijk-Janssen DJ, et al. Human
IgA activates the complement system via the mannan-
binding lectin pathway. J Immunol. 2001;167:2861–2868.
19. GuoWY, Zhu L, Meng SJ, et al. Mannose-binding lectin levels
could predict prognosis in IgA nephropathy. J Am Soc
Nephrol. 2017;28:3175–3181.
20. Roos A, Rastaldi MP, Calvaresi N, et al. Glomerular activation
of the lectin pathway of complement in IgA nephropathy is
associated with more severe renal disease. J Am Soc Neph-
rol. 2006;17:1724–1734.
21. Espinosa M, Ortega R, Sanchez M, et al. Association of C4d
deposition with clinical outcomes in IgA nephropathy. Clin J
Am Soc Nephrol. 2014;9:897–904.
22. Working Group of the International Ig A Nephropathy
Network and the Renal Pathology Society, Roberts IS,
Cook HT, et al. The Oxford classification of IgA nephropathy:
pathology definitions, correlations, and reproducibility. Kid-
ney Int. 2009;76:546–556.
23. Levey AS, Stevens LA, Schmid CH, et al. A new equation to
estimate glomerular filtration rate. Ann Intern Med. 2009;150:
604–612.
24. Thiel S, Moller-Kristensen M, Jensen L, Jensenius JC. Assays
for the functional activity of the mannan-binding lectin
pathway of complement activation. Immunobiology.
2002;205:446–454.
25. Wittenborn T, Thiel S, Jensen L, et al. Characteristics and
biological variations of M-ficolin, a pattern recognition
molecule, in plasma. J Innate Immun. 2010;2:167–180.
26. Krarup A, Sorensen UB, Matsushita M, et al. Effect of
capsulation of opportunistic pathogenic bacteria on bind-
ing of the pattern recognition molecules mannan-binding
lectin, L-ficolin, and H-ficolin. Infect Immun. 2005;73:
1052–1060.
27. Axelgaard E, Jensen L, Dyrlund TF, et al. Investigations on
collectin liver 1. J Biol Chem. 2013;288:23407–23420.
28. Selman L, Henriksen ML, Brandt J, et al. An enzyme-linked
immunosorbent assay (ELISA) for quantification of human
collectin 11 (CL-11, CL-K1). J Immunol Methods. 2012;375:
182–188.
29. Troldborg A, Thiel S, Jensen L, et al. Collectin liver 1 and
collectin kidney 1 and other complement-associated pattern
recognition molecules in systemic lupus erythematosus. Clin
Exp Immunol. 2015;182:132–138.
30. Moller-Kristensen M, Jensenius JC, Jensen L, et al. Levels of
mannan-binding lectin-associated serine protease-2 in
healthy individuals. J Immunol Methods. 2003;282:159–167.
31. Degn SE, Jensen L, Gal P, et al. Biological variations of
MASP-3 and MAp44, two splice products of the MASP1 gene
involved in regulation of the complement system. J Immunol
Methods. 2010;361:37–50.
32. Degn SE, Thiel S, Nielsen O, et al. MAp19, the alternative
splice product of the MASP2 gene. J Immunol Methods.
2011;373:89–101.
33. Lomax-Browne HJ, Visconti A, Pusey CD, et al. IgA1 glyco-
sylation is heritable in healthy twins. J Am Soc Nephrol.
2017;28:64–68.
34. Benjamini Y, Krieger AM, Yekutieli D. Adaptive linear step-up
procedures that control the false discovery rate. Biometrika.
2006;93:491–507.
437

CLINICAL RESEARCH NR Medjeral-Thomas et al.: MASP-3, FHR5, and IgA Nephropathy Severity
35. Liu Y, Endo Y, Iwaki D, et al. Human M-ficolin is a secretory
protein that activates the lectin complement pathway.
J Immunol. 2005;175:3150–3156.
36. Troldborg A, Hansen A, Hansen SW, et al. Lectin complement
pathway proteins in healthy individuals. Clin Exp Immunol.
2017;188:138–147.
37. Lu J, Tay PN, Kon OL, Reid KB. Human ficolin: cDNA cloning,
demonstration of peripheral blood leucocytes as the major
site of synthesis and assignment of the gene to chromosome
9. Biochem J. 1996;313:473–478.
38. Thiel S, Holmskov U, Hviid L, et al. The concentration of the
C-type lectin, mannan-binding protein, in human plasma
increases during an acute phase response. Clin Exp Immunol.
1992;90:31–35.
39. Endo Y, Matsushita M, Fujita T. The role of ficolins in the
lectin pathway of innate immunity. Int J Biochem Cell Biol.
2011;43:705–712.
40. Thiel S, Jensen L, Degn SE, et al. Mannan-binding lectin
(MBL)-associated serine protease-1 (MASP-1), a serine pro-
tease associated with humoral pattern-recognition mole-
cules: normal and acute-phase levels in serum and
stoichiometry of lectin pathway components. Clin Exp
Immunol. 2012;169:38–48.
41. Degn SE, Jensenius JC, Thiel S. Disease-causingmutations in
genes of the complement system. Am J Hum Genet. 2011;88:
689–705.
42. Troldborg A, Thiel S, Laska MJ, et al. Levels in plasma of the
serine proteases and associated proteins of the lectin
pathway are altered in patients with systemic lupus erythe-
matosus. J Rheumatol. 2015;42:948–951.
43. Tanha N, Pilely K, Faurschou M, et al. Plasma ficolin levels
and risk of nephritis in Danish patients with systemic lupus
erythematosus. Clin Rheumatol. 2017;36:335–341.
44. Watanabe H, Saito R, Asano T, et al. Serum L-ficolin levels in
patients with systemic lupus erythematosus. Mod Rheuma-
tol. 2012;22:899–902.
45. Matsushita M. Ficolins in complement activation. Mol
Immunol. 2013;55:22–26.
46. Heja D, Kocsis A, Dobo J, et al. Revised mechanism of com-
plement lectin-pathway activation revealing the role of serine
protease MASP-1 as the exclusive activator of MASP-2. Proc
Natl Acad Sci U S A. 2012;109:10498–10503.
47. Iwaki D, Kanno K, Takahashi M, et al. Small mannose-binding
lectin-associated protein plays a regulatory role in the lectin
complement pathway. J Immunol. 2006;177:8626–8632.
48. Zundel S, Cseh S, Lacroix M, et al. Characterization of
recombinant mannan-binding lectin-associated serine prote-
ase (MASP)-3 suggests an activation mechanism different
from that of MASP-1 and MASP-2. J Immunol. 2004;172:
4342–4350.
49. Dobo J, Pal G, Cervenak L, Gal P. The emerging roles of
mannose-binding lectin-associated serine proteases (MASPs)
in the lectin pathway of complement and beyond. Immunol
Rev. 2016;274:98–111.
438
50. Dahl MR, Thiel S, Matsushita M, et al. MASP-3 and its
association with distinct complexes of the mannan-binding
lectin complement activation pathway. Immunity. 2001;15:
127–135.
51. Iwaki D, Kanno K, Takahashi M, et al. The role of mannose-
binding lectin-associated serine protease-3 in activation of
the alternative complement pathway. J Immunol. 2011;187:
3751–3758.
52. Volanakis JE, Narayana SV. Complement factor D, a novel
serine protease. Protein Sci. 1996;5:553–564.
53. Murphy B, Georgiou T, Machet D, et al. Factor H-related
protein-5: a novel component of human glomerular immune
deposits. Am J Kidney Dis. 2002;39:24–27.
54. Paunas TIF, Finne K, Leh S, et al. Glomerular abundance of
complement proteins characterized by proteomic analysis of
laser-captured microdissected glomeruli associates with
progressive disease in IgA nephropathy. Clin Proteomics.
2017;14:30.
55. Goicoechea de Jorge E, Caesar JJ, Malik TH, et al. Dimer-
ization of complement factor H-related proteins modulates
complement activation in vivo. Proc Natl Acad Sci U S A.
2013;110:4685–4690.
56. Csincsi AI, Kopp A, Zoldi M, et al. Factor H-related protein 5
interacts with pentraxin 3 and the extracellular matrix and
modulates complement activation. J Immunol. 2015;194:
4963–4973.
57. Gale DP, de Jorge EG, Cook HT, et al. Identification of a
mutation in complement factor H-related protein 5 in patients
of Cypriot origin with glomerulonephritis. Lancet. 2010;376:
794–801.
58. Medjeral-Thomas N, Malik TH, Patel MP, et al. A novel
CFHR5 fusion protein causes C3 glomerulopathy in a
family without Cypriot ancestry. Kidney Int. 2014;85:
933–937.
59. Gharavi AG, Kiryluk K, Choi M, et al. Genome-wide associa-
tion study identifies susceptibility loci for IgA nephropathy.
Nat Genet. 2011;43:321–327.
60. Zhu L, Zhai YL, Wang FM, et al. Variants in complement factor
H and complement factor H-related protein genes, CFHR3 and
CFHR1, affect complement activation in IgA nephropathy.
J Am Soc Nephrol. 2015;26:1195–1204.
61. Herzog AL, Wanner C, Amann K, Lopau K. First treatment of
relapsing rapidly progressive IgA nephropathy with eculizu-
mab after living kidney donation: a case report. Transplant
Proc. 2017;49:1574–1577.
62. Ring T, Pedersen BB, Salkus G, Goodship TH. Use of eculi-
zumab in crescentic IgA nephropathy: proof of principle and
conundrum? Clin Kidney J. 2015;8:489–491.
63. Rosenblad T, Rebetz J, Johansson M, et al. Eculizumab
treatment for rescue of renal function in IgA nephropathy.
Pediatr Nephrol. 2014;29:2225–2228.
64. Ricklin D, Barratt-Due A, Mollnes TE. Complement in clinical
medicine: clinical trials, case reports and therapy monitoring.
Mol Immunol. 2017;89:10–21.
Kidney International Reports (2018) 3, 426–438