project 28 - ngjyra ndryshe:layout 1 - ubo consulting mosaic... · table of contents foreword 7...
TRANSCRIPT


Kosovo Mosaic Public Services and Local Authorities in Focus

Acknowledgments Team Leader Uliks Osmani – Managing Director of UBO Consulting
UBO Consulting - Team of analysts and writersKalterina LatifiBerat AbdiuIlirjana KacanikuAferdita Rushiti
UNDP Support Staff:Mytaher Haskuka, Head of Policy UnitFaton Bislimi, Programme Coordinator, EWS/HDR Armend Muja, Team Leader CommunicationsAiko Watanabe, Programme Analyst, Democratic Governance ClusterDanijela Mitic, Communication AnalystBurbuqe Dobranja, Public Information Officer, Emrush Ujkani, Acting Head of Democratic Governance Cluster
Steering Committee:Izet Sadiku, Senior Advisor to Minister, Ministry of Local Government AdministrationSazan Ibrahimi, Executive Director, Association of Kosovo MunicipalitiesBarry J. Reed, Chief of Party, Effective Municipal Initiative/USAIDRreze Duli, Project Manager, Support to Decentralisation in Kosovo, UNDPKrenar Loshi, Head, Democratic Governance Cluster, UNDPAndre Durr, Programme Specialist, Democratic Governance Cluster, UNDP
English Language EditorAmanda Morgan
Design and Printashagraphics.com
The views expressed in this report are those of the authors and do not necessarily represent the views of either UNDP or USAID.The Mosaic Report 2009 would not have been published without the generous assistance of the Norwegian Government.

TABLE OF CONTENTSForeword 7Executive Summary 8Introduction 9
Kosovo’s political context 11Kosovo’s socio-economic context 12Methodology and survey design 14Organisation of this report 14
Chapter I: Economic Well-being 15Household expenditures 17Financial outlook 19Household well-being 21Household possessions 22Optimism about the future 25Chapter summary and lessons learned 26
Chapter II: Public Services 27Perceptions about responsibility for public services 31Water supply 32Sewage disposal 34Electric power supply 34Sanitation 35Public transportation 37Heating 38Chapter summary and lessons learned 39
Chapter III: Participation in Municipal Government 41Municipal public meetings 44Voting 46Other ways to influence decision-making 47Satisfaction with municipal administration 48Opinions on decentralisation 53Chapter summary and lessons learned 55
Chapter IV: Employment, Farming and Entrepreneurship 57Employment 59Land ownership and farming 62Business ownership 63Chapter summary and lessons learned 64Conclusions 64
Annex1. Summary of main results 65

LIST OF TABLESTable 1. Average monthly household expenditures in euro 18Table 2. Current financial outlook and expectations for the future 21Table 3. Household possessions 23Table 4. Perceived problems in Kosovo 23Table 5. Perceived problems in municipalities 24Table 6. Responses to “I am optimistic about the future of Kosovo in general”
according to respondents' age and ethnicity 25Table 7. Optimism about municipality’s future by ethnicity 25Table 8. Public services perceived to need improvement 30Table 9. Percentage of respondents with access to basic public services 30
Table 10. Perceived causes for lack of cleanliness in municipalities rated “very dirty” 37Table 11. Use of green areas 37Table 12. Use of public transportation—top five municipalities 38Table 13. Municipalities rated most open to citizen participation 45Table 14. Top six municipalities for town hall attendance 46Table 15. Index of satisfaction with municipal administration, 2003–2009 49Table 16. Rating of specific elements of municipal government service, 2009 50Table 17. Respondents’ employment status 59Table 18. Employment by mean age 59Table 19. Respondents’ education levels 60Table 20. Education by mean age 60

LIST OF FIGURESFigure 1. Monthly household expenditures 17Figure 2. Household expenditures by category 19Figure 3. Perceived financial status 19Figure 4. Top and bottom five municipalities by the Household Wellbeing Index 21Figure 5. Percentage of households with a computer 23Figure 6. Percentage of households connected to the Internet 23Figure 7. Satisfaction with public services in 2006 and 2009 29Figure 8. Perceptions on the responsibilities of central and municipal governments 32Figure 9. Connection to water supply 33Figure 10. Satisfaction with water quality 33Figure 11. Satisfaction with sewage and sanitation system 34Figure 12. Satisfaction with electricity supply 35Figure 13. Municipality’s cleanliness 35Figure 14. Perceived reasons for lack of cleanliness 36Figure 15. Ways to improve cleanliness of municipalities 36Figure 16. “My municipal government welcomes citizen participation” 45Figure 17. Percentage of citizens informed about municipal public meetings 45Figure 18. Reasons for choosing to vote 46Figure 19. Ways to influence municipal decision-making 47Figure 20. Participation in political activities to influence decision-making 48Figure 21. Perceived trustworthiness of municipal government on fund management 50Figure 22. Five most and least visited municipal offices 51Figure 23. Top and bottom five municipalities regarding success of requests
for information or documents from a municipal office 52Figure 24. Knowing where to go for help 52Figure 25. “How informed do you feel about the work that your municipality is doing?” 53Figure 26. Sources for information on decentralisation 54Figure 27. Opinions on who will benefit from decentralisation 54Figure 28. Opinions on who will benefit from decentralisation by ethnic group 55Figure 29. Employment rates by education level 61Figure 30. Percentage of respondents’ unemployed and looking for work 61Figure 31. Ownership of private business by municipality 63

LIST OF ABBREVIATIONSEU European UnionGDP Gross Domestic ProductHDI Human Development Index K-Albanians Kosovo AlbaniansKEK Kosovo Energy CorporationK-Serbs Kosovo SerbsKMS Kosovo Mosaic StudyMEF Ministry of Economy and Finance

FOREWORD Kosovo Mosaic is the third report in a series of surveys designed to measure citizens’ perceptions
and awareness of a variety of topics that affect their everyday lives and their interaction with local gov-ernment. This report presents the views of 6,400 respondents and is an important source of informationabout the real conditions of Kosovo people. Since the last 2006 report, Kosovo has undergone substantialchange, democratic elections for both central and local government, and the unilateral declaration of in-dependence in February 2008. This wide-ranging and detailed report, including the trend analysis andcomparisons with 2003 and 2006 would provide a significant and relevant analysis of the effects thatthese changes could have had.
The report is designed to contribute to the ongoing debate and reform of the local governments byhighlighting priorities, bottlenecks in service delivery, people’ willingness to participate in public policyprocess and municipalities’ openness to local demands. Respondents were asked to answer How theyfelt about their local government? Which services were they least satisfied with? What are the biggestconcerns looking ahead? To whom did they attribute responsibility for key public services? How trans-parent their government was? etc. KMS 2009 collected primary data through face-to-face interviewsusing a custom-designed research tool. Each of Kosovo’s thirty-three municipalities was assigned a pro-portional number of respondents based on population figures and the sample was split equally betweenurban and rural areas, to reflect the differing nature of Kosovo’s human complexion and to ensure thatthe sample fairly represented the whole of Kosovo.
The findings will be of interest to an array of different groups and organisations throughout Kosovoand internationally about the current state-of-play in Kosovo, including policy makers, civil society lead-ers, and the government,. It has the potential therefore, to shape the direction and focus of Kosovo’sdevelopment in years to come. We remain confident that the rich data and content will stimulate andprovoke further thoughts and ideas, promote meaningful and participatory discussions among readersand attract the attention of relevant and responsible actors in Kosovo.
The first chapter presents the findings on matters of well-being and economic outlook at thehousehold level. It uses the ‘Wellbeing Index’, as well as household purchasing power, to assess thechanging economic status of Kosovo citizens. Secondly, it explores topics concerning public service, inparticular it focuses on where services need to improve, and the way that citizens’ understanding of thedivision of services between central and municipal government has evolved. Public participation in localgovernment is described in the third chapter. The final chapter reports on issues affecting livelihoodssuch as employment, land and business ownership, and education. Each part illustrates how trends havedeveloped since 2003, and highlights both Kosovo’s progress and its remaining problems.
We extend our appreciation to UBO Consulting for carrying out the study, to Steering Committeemembers for their valuable insights, to the Government of Norway and USAID for their generous financialcontribution, and to all those involved in the completion of this report.
Parviz FartashUNDP/ Kosovo Director

EXECUTIVE SUMMARYThe 2009 Kosovo Mosaic Survey (KMS) measures Kosovo citizen’s opinions, perceptions and
awareness on a variety of topics revolving around their everyday lives and their interactions with theirlocal government. KMS 2009 is the third in a series of surveys (having previously been conducted in 2003and 2006), which have been developed principally for describing Kosovo citizens’ satisfaction with theirlocal government, assessing their access to basic public services as well as showing the impact ofKosovo’s development on their well-being.
Continuing the methodological approach from previous KMS surveys, KMS 2009 conducted 6,400in-person interviews with respondents from 33 municipalities, including the newly established munic-ipalities of Mamushë/Mamuša, Junik/Junik, and Hani i Elezit/Ðeneral Janković. Continuing from KMS2006, the Wellbeing Index, an indicator of financial status, was used in this study along with additionalquestions on household expenditures.
In order to effectively share and compare the results of KMS 2009 with previous KMS surveys, in-formation is presented in four chapters. The first chapter, “Economic Wellbeing”, presents informationon respondents’ assessments of their current and expected future financial well-being, their expectationsfor the future, as well as the extent to which Kosovo’s development has benefited their households. Re-sults comparing survey trends from 2003, 2006 and 2009 are also presented, providing useful informa-tion.
The second chapter, “Public Services”, examines in detail respondents’ reported access to publicservices, their satisfaction with public service delivery, as well as their awareness on the level of gov-ernment in charge for various public services. From the use of public transportation to the availabilityof running water, this chapter provides valuable data on the services Kosovo citizens use and deem im-portant for their well-being.
“Participation in Municipal Government”, the third chapter in KMS 2009, describes respondents’attitudes towards their local administration, and the degree to which they are involved in the shapingof public policies in their communities. This chapter also addresses respondents’ perceptions on thetrustworthiness of, as well as their overall satisfaction with, their local government.
The final chapter of KMS 2009, “Employment, Farming and Entrepreneurship”, describes in moredetail the respondents’ immediate economic environment. Information on respondents’ employment,their land ownership, as well as their ownership of small businesses is provided. KMS 2009 survey datais also provided according to respondents’ municipality and region, in order to unveil important regionaldifferences and disparities.

INTRODUCTION


Koso
vo M
osaic
Surve
y 200
9
11
INTRODUCTIONThe Kosovo Mosaic Survey 2009 is the third in aseries of surveys aimed at exploring the attitudesand perceptions of Kosovo citizens regarding publicservices and their local government. The first sur-vey was conducted in 2003, followed by a secondsurvey in 2006 and the newest survey was com-pleted in February 2009. As part of this survey, re-spondents were asked for their perceptions of whowas responsible for managing different publicservices and their opinions on the quality of publicservices, the management of their municipalities,the transparency of municipal government and thedecentralisation process.
This report outlines the most important results ofthe survey. It provides information that can beused for public policy development and public ad-ministration reform, as well as to provide supportto the decentralisation process. Results from thissurvey may be used by the Ministry of Local Gov-ernment Administration and individual municipal-ities as a basis for evaluating their effectiveness inproviding public services, which could ultimatelylead to the improvement of services and hence, inthe quality of life for all Kosovo citizens.
KOSOVO’S POLITICAL CONTEXTSince October 2006 when the second KMS waspublished, Kosovo has undergone rapid politicaldevelopments, not the least of which include the
conclusion of negotiations on Kosovo’s status,democratic elections for both central and localgovernment, and the unilateral declaration of inde-pendence in February 2008.
The elections of November 2007 heralded a newparadigm of political participation. The open-listvoting system enabled Kosovans to vote directlyfor candidates for the Kosovo and municipal as-semblies as well as for mayoral candidates, in-stead of voting for political parties. However, evenwith the open-list voting system, which was ex-pected to improve the already-declining voterturnout, the 2007 elections had the worst turnoutsince record-keeping began in 2000. Nonetheless,these elections led to the establishment of a newpolitical leadership. The Democratic Party ofKosovo, which had been sitting in the oppositionsince the 2004 elections, formed a coalition gov-ernment with the Democratic League of Kosovo onJanuary 9, 2008.
The unilateral declaration of independence in Feb-ruary 2008 resulted in the re-configuration of theinternational presence in Kosovo. The United Na-tions Mission in Kosovo continues to exercise someauthority based on Security Council Resolution1244, passed in 1999. International authority isalso vested in the International Civilian Office, ledby the International Civilian Representative, andin the European Union Rule of Law Mission inKosovo, launched under the European Security andDefence Policy.

The Constitution of Kosovo was approved by theparliament on April 9, 2008, and entered into forcetwo months later on June 15, 2008. It promises to“provide for the protection of human rights andcommunities according to international and Euro-pean standards1” .In 2005, the Kosovo Parliament initiated a decen-tralisation process that aimed to provide local gov-ernments with greater administrativeresponsibilities and increased financial resources,thus raising their ability to provide more and betterpublic services to its citizens. This course of actionfocuses its attention on special needs and con-cerns of non-majority communities in Kosovo. Theongoing process thus far has resulted in the cre-ation of three new municipalities - Junik/Junik, Ma-mushë/Mamuša and Hani i Elezit/ĐeneralJanković.
KOSOVO’S SOCIO-ECONOMIC CONTEXTKosovo’s population is estimated at 2.1 million2,with the breakdown of 88% Kosovo Albanians, 7%Kosovo Serbs, and 5% other minorities. Kosovo’seconomic performance remains poor. Estimates ofeconomic growth from 2007 to 2008 range from3.5%3 to 5.4%4 . The per capita value of grossdomestic product (GDP) is estimated to be be-tween 1,150 euro5 and 1,600 euro6 .
While the Ministry of Economy and Finance (MEF)says the Kosovan economy has been resilient inthe face of the global financial crisis, it reports thatthe crisis period of 2008 saw significant inflationat a rate of 9.3%. This number is considerablyhigher compared to those recorded in the EU(3.9%) and SEE (7.6%) during the same period7.According to MEF, high oil and food prices in inter-national markets are the main cause of the in-creased inflation, as Kosovo is highly dependenton imported goods8.
Kosovo’s trade deficit was 37% of GDP in 2006and 41% of GDP in 2007. This trend continued in2008, with the trade deficit reaching 43%9. In2009 imports of goods increased by 22%, whileexports increased by 20% compared to the sameperiod a year earlier10. The current negative tradedeficit is expected to increase as a result of theglobal financial crisis11.
Kosovo has among the highest rates of unemploy-ment and poverty in the Balkans and in Europe.The Macroeconomic Department at MEF estimatesthat between 39 and 46% of employable, job-seeking Kosovans are unemployed12. In June 2008,the total number of registered job-seekers reached335,935, and over 60% of them were unskilled.Of great concern is the fact that 90% of these job-seekers have been registered as long-term unem-ployed13. The World Bank’s latest assessment ofpoverty in Kosovo, published in October 2007, es-
1 Commission of the European Communities, Kosovo (Under United Nations Security Council Resolution 1244/99) 2008 Progress Report (Brussels: Commissionof the European Communities, 11 May 2008), 8.2 Ministry of Trade and Industry, Kosovo at a Glance, Prishtina, June, 2008, 4.3 Early Warning Report Number 20/21 Special Edition (Pristina, Kosovo: United Nations Development Programme, June 2008), 6.4 Semiannual Macroeconomic Bulletin Issue 1 (January–June 2008), 6. Macroeconomic Department, Ministry of Finance and Economy.5 Early Warning Report Number 20/21 Special Edition (Pristina, Kosovo: United Nations Development Programme, June 2008), 6.6 Central Intelligence Agency, The World Fact Book, August, 2009, https://www.cia.gov/library/publications/the-world-factbook/fields/2004.html 7 Central Bank of Republic Of Kosovo, Annual Report 2008, Prishtine, June 2009, 44.8 Semiannual Macroeconomic Bulletin Issue 1 (January–June 2008), 6. Macroeconomic Department, Ministry of Finance and Economy.9 Central Bank of Republic Of Kosovo, Annual Report 2008, Prishtine, June 2009, 44.10 Ibid, 41-4311 GAP Institute for Advanced Studies, The Effects of Global Financial Crises in Kosovo,, Prishtina November 20, 2008, 2. 12 Arbër Domi, Labour Market In Kosovo: A projection on the Relationship Between GDP Growth and Unemployment (Ministry of Economy and Finance –
Macroeconomics Department, Prishtina, September, 2008), 5.13 Ministry of Economy and Finance, Semiannual Macroeconomic Bulletin (Macroeconomics Department,Prishtina, June, 2008), 8–9.14 The World Bank Kosovo Poverty Assessment, Volume I: Accelerating Inclusive Growth to Reduce Widespread Poverty October 3, 2007), 7–9. Pu
blic S
ervice
s and
Loca
l Auth
oritie
s in F
ocus
12

timated a 45% povertyrate, with 15% living in ex-treme poverty1 4 . MEF estimates that Kosovo’s cur-rent GDP growth will maintain unemployment ratesat the current level. In order to reduce unemploy-ment rate by 50 percent, by the year 2020, a GDPgrowth rate of 7.3% would be needed15. MEF esti-mates that this reduction in unemployment can beachieved through investments in the Kosovaneconomy in the amount of 1,508 billion euro in2010 and 1,618 billion euro in 201116.
A similar amount has been estimated by the gov-ernment of Kosovo’s Medium Term ExpenditureFramework, which identifies socio-economic de-velopment needs for 2008–2011. This frameworkwas presented at the 2008 Donors’ Conference forKosovo held in Brussels, and succeeded in raising1.2 billion euro from 37 countries and 16 interna-tional organisations. The donors “highlighted theneed to make rapid progress in accelerating eco-nomic growth, improvement in civil service, accel-eration of public administration reform tosignificantly improve the effectiveness of publicservice delivery, and in strengthening the judicialsystem and the fight against corruption”17.
Kosovo’s economy is heavily dependent on remit-tances. Although estimates of their extent differ, astudy conducted by Forum 2015 estimated that in2007 the total value of remittances sent by Koso-vans living abroad was 317 million euro—170million in cash, 22 million euro in-kind and 125million euro spent on “diaspora tourism”18. Withoutthe safety net provided by migration and remit-
tances, the financial welfare of many Kosovanswould be worse19. The Forum 2015 report statesthat 45% of the remittances are used for privateconsumption, 19% for house construction, 17%for health care needs and 16% for education, whileonly 3% is invested in entrepreneurial activity20.
It is anticipated that the global financial crisis willimpact the Kosovan economy through a decline inremittances. Some Kosovans working abroad maylose their jobs as large corporations downsize21.Foreign investment in Kosovo, already low, couldfurther decrease22. Among the first to be affectedby the crisis was the Kosovo Pension Trust. Its ini-tial investment value has declined by almost 30%,a value of 106 million euro, since 200823. However,the banking sector in Kosovo seems to be relativelyunaffected by the financial crisis, which can be at-tributed to the fact that banks in Kosovo have moredeposits than loans.
The privatisation of socially owned enterprises hasyielded significant funds that could boost Kosovo’seconomy. But this process may also be affectedby the global crisis. By mid-2008, the accumulatedproceeds from the sale of privatised assets hadreached over 383 million euro or around 11.5% ofGDP. Proceeds continued to be kept in the KosovoTrust Agency Fund, frozen and withheld from eco-nomic activity,24 even after the PrivatisationAgency of Kosovo replaced the internationally-managed Kosovo Trust Agency25. Assuming all pri-vatisation commitments (tender proceeds,liquidation sales and investments) are honoured,
15 Arbër Domi, Labour Market In Kosovo: A projection on the Relationship Between GDP Growth and Unemployment (Ministry of Economy and Finance ofKosovo – Macroeconomics Department, Prishtina, September, 2008), 5.
16 ibid, 6. 17 European Commission, Kosovo Donors’ Conference, Brussels, 11 July 2008, Conclusions of the Chair, 1. 18 Mustafa,M., Kotorri, M., Gashi, P., Gashi, A, Demukaj, V. Diaspora and Migration Policies, Forum 2015, Prishtina, December 2007, 38. 19 The World Bank Kosovo Poverty Assessment, Volume I: Accelerating Inclusive Growth to Reduce Widespread Poverty, Prishtina, October 3, 2007).-Mustafa,M., Kotorri, M., Gashi, P., Gashi, A, Demukaj, V. Diaspora and Migration Policies, Forum 2015, Prishtina, December 2007, 38. 43. 21 GAP Institute, The Effects of Global Financial Crises in Kosovo, 2.22 ibid 23 Trusti ka humbur 106 milionë, [Kosovo Pension Fund lost 106 Million Euro]” Gazeta Express, 14 May 2009, http://www.gazetaexpress.com/index.php/ar-
tikujt/lexo/7786/C4/C1324 Forum 2015, Privatization and Post-Privatization in Kosovo- Glass Half Empty or Half Full, Prishtina, September 2008, 12.25 Kosovo Stability Initiative, Who’s the Boss?, Prishtina, December, 2008, 4. 26 Forum 2015, Privatization and Post-Privatization in Kosovo- Glass Half Empty or Half Full, Prishtina, September 2008, 12.
Koso
vo M
osaic
Surve
y 200
9
13

more than half a billion euro has been raisedthrough the privatisation programme26. A Forum2015 study on the effects of privatisation on theKosovan economy surveyed 103 privatised enter-prises and found that only 66 of them remainedactive. Of the active 66, nearly 60% were engagedin production, 21% were in the service sector andthe remaining 19% were in the trade sector27.
METHODOLOGY AND SURVEY DESIGNKMS 2009 collected primary data through face-to-face interviews using a custom-designed researchinstrument. Primary data collection was conductedusing a multistage random sampling model, whereKosovo’s 33 municipalities were assigned propor-tionate sampling quotas based on their estimatedpopulation. Further, the sample was split equally be-tween urban and rural settlements within the deter-mined municipal quotas, and municipal data fromthe Organization for Security and Co-operation in Eu-rope28 were used to randomly select initial points ofdata collection. Within data collecting points in urbanareas, the selected household was every fourth ad-dress/house on the left-hand side of the street. Inapartment complexes, the selected household wasevery fifth apartment, counting them from the first tothe left of the entrance. In rural areas, the selectedhousehold was every fourth habitable dwelling houseon both sides of the interviewer's route. Within theselected household, only one person aged 18 or olderwas selected by asking birthdays of residents andselecting the person whose birthday was the firstfrom the date of the interview. A total of 6,400 face-to-face interviews were conducted by pen and pencilmethod. The detailed sample structure can be viewedin Annex 1, together with information on gender, ageand urban/rural attributes.
The survey design and methodology was developedby the Mosaic Committee, which consisted of rep-resentatives of the United Nations DevelopmentProgramme, the United States Agency for Interna-tional Development, the Ministry of Local Govern-ment Administration and the Association of KosovoMunicipalities. The KMS 2009 questionnaire wasdeveloped from further elaboration of the KMS2003 and 2006 questionnaires.
Statistical analyses and data processing were con-ducted using the SPSS (Statistical Package for theSocial Sciences) software. The statistics for thereport have a margin of error of less than 5%.
ORGANISATION OF THIS REPORTThe report has four chapters, each addressingseparate segments of the perceptions and opinionsof Kosovans regarding municipal services and au-thorities. The first chapter reports findings on mat-ters of well-being and economic outlook at thehousehold level and the second chapter explorestopics concerning public service. The third chapterdescribes public participation in local government,and the final chapter reports on issues affectinglivelihoods such as employment, land and busi-ness ownership, and education. Each chapter il-lustrates how trends have developed since KMS2003 and 2006, and highlights both Kosovo’sprogress and its remaining problems.
27 ibid, 15. 28 OSCE Mission in Kosovo, Municipal Profiles, Prishtina,22 April 2009, http://www.osce.org/kosovo/13982.html.Pu
blic S
ervice
s and
Loca
l Auth
oritie
s in F
ocus
14

CHAPTER I


17
Koso
vo M
osaic
Surve
y 200
9
ECONOMIC WELL-BEINGKMS 2006 established a Wellbeing Index combining a number of different indicators including householdincome and possessions. Household purchasing power often determines the well-being of a communityand provides reliable macroeconomic data. For this purpose, KMS 2009 introduced monthly householdexpenses as a key indicator, while also maintaining the Wellbeing Index, which recorded respondents’evaluations of their own financial condition as well as their possession of appliances first presented inKMS 2003 and 2006. This indicator makes it possible to compare the wellbeing of different municipalitiesand to compare current trends with those observed in previous surveys.
HOUSEHOLD EXPENDITURESThe average monthly household expenditure of the 2009 respondents was 352 euro. Approximately halfof households spent between 201 and 400 euro per month (Figure 1.). Some 19% spent 200 euro or less.Household expenses depend on family size; the majority (60%) of respondents had three to five membersin their family, while about 23% of respondents had six to nine members.
Figure 1. Monthly household expenditures
Zveçan/Zvečan respondents reported the highest average expenditures, totalling 1,027 euro per month.Gjakovë/Đjakovica and Prizren/Prizren were next, at 490 and 443 euro, respectively, followed by Fushë

Kosovë/Kosovo Polje and Prishtinë/Priština.Respondents from predominantly rural municipal-ities had lower household expenditures. The fivemunicipalities with the lowest expenditures wereLipjan/Lipljan, Dragash/Dragaš, Skenderaj/Srbica,Mamushë/Mamuša and Shtime/Štimlje, with ex-penditures ranging from 153 to 200 euro permonth.
The declared average monthly household expen-diture for Kosovo is 352 euro; the average familysize is 4.7 members; simple average expenditureper person per month is 74.9 euro and theweighted mean expenditure per month per personis around 77.8 euro. Both simple and weighted av-erage of expenditure per person per month showsimilar values.
18
Publi
c Serv
ices a
nd Lo
cal A
uthori
ties i
n Foc
us
Municipality Average monthly expenditure (in euro)
Deςan/Dečani 331Dragash/Dragaš 163Ferizaj/Uroševac 335Fushë Kosovë/Kosovo Polje 425Gjakove/Đjakovica 490Gjilan/Gnjilane 359Gllogovc/Glogovac 378Hani i Elezit/Đeneral Janković 292Istog/Istok 301Junik/Junik 367Kaçanik/Kačanik 259Kamenicë/Kamenica 292Klinë/Klina 322Leposaviq/Leposavić 410Lipjan/Lipljan 153Malishevë/Mališevo 411Mamushë/Mamuša 198Mitrovicë/Mitrovica 342Novobërdë/Novo Brdo 363Obiliq/Obilić 242Pejë/Peć 378Podujevë/Podujevo 415Prishtinë/Priština 416Prizren/Prizren 443Rahovec/Orahovac 410Shtërpcë/Štrpce 397Shtime/Štimlje 200Skenderaj/Srbica 197Suharekë/Suva Reka 227Viti/Vitina 349Vushtrri/Vučitrn 324Zubin Potok/Zubin Potok 406Zveçan/Zvečan 1027Average 352
Table 1. Average monthly household expenditures in euroNote: Expenditures were calculated without consideration of household size and do not representper-person expenditures.

Household expenditures include food, clothing, alcohol, tobacco and other items. Figure 2 shows house-hold expenditures by category. About 40% of household income is spent on food. Expenditures for housingand clothing represent 13% each. Medication/health care and transportation each total less than 10%.
Figure 2. Household expenditures by category
FINANCIAL OUTLOOK To measure well-being, KMS 2009 recorded, among other things, respondents’ evaluations of their fi-nancial condition29. Comparing these results with those from previous surveys, a number of trends wereobserved (see Table 2 and Figure 3). More families are satisfied with their current financial status nowthan in 2003 or 2006, but fewer families are optimistic about their future financial status.
Figure 3. Perceived financial status
When evaluating current financial status, compared to KMS 2003 and 2006, respondents in the followingmunicipalities have shown positive trends: Deçan/Dečani, Ferizaj/Uroševac, Gllogovc/Glogovac, Ka-
19
Koso
vo M
osaic
Surve
y 200
9
29 In KMS 2006, respondents’ evaluations of financial conditions served as a key indicator of municipal well-being.

menicë/Kamenica, Lipjan/Lipljan and Pejë/Peć. Onthe other hand, municipalities ofGjakovë/Đjakovica, Mitrovicë/Mitrovica andNovobërdë/Novo Brdo continue to have a pes-simistic outlook on their financial status.
In contrast to previous KMS survey findings, KMS2009 shows that when evaluating their financialstatus for the past 12 months, respondents believethat their financial conditions have improved. Al-though the majority of respondents report improve-ment in their current financial conditions,respondents from Dragash/Dragaš, FushëKosovë/Kosovo Polje, Gjilan/Gnjilane,Shtërpcë/Štrpce and Zveçan/Zvečan report signif-icant deterioration in their financial status duringthe past 12 months. Respondents from these mu-nicipalities have continuously reported deteriora-tion in their financial conditions, as first noted inKMS 2003.
Consistent with trends observed in previous KMSsurveys, KMS 2009 respondents indicate that theyare optimistic regarding their financial conditionfor the upcoming year (see table 2). While KMS2009 respondents expect financial improvementsin the future, they are considerably less optimisticthan they were in 2003 or 2006. However, thisoverall positive trend is not shared by respondentsin a number of municipalities. For example, re-spondents from Fushë Kosovë/Kosovo Polje, Gji-lan/Gnjilane, Shtërpcë/Štrpce and Zveçan/Zvečan,which are municipalities with large K-Serb minori-ties, show high levels of pessimism over their fu-ture financial conditions. Additionally, respondentsfrom these municipalities have also reported thehighest levels of deterioration in their financialconditions during the past 12 months. On the con-trary, respondents from Deçan/Dečani,Gllogovc/Glogovac and Leposaviq/Leposavić con-tinue to be significantly optimistic regarding theirfuture financial conditions, even surpassing previ-ous levels of optimism.
Publi
c Serv
ices a
nd Lo
cal A
uthori
ties i
n Foc
us
20
Municipality Current outlook Future expectations2003 2006 2009 Trend 2003 2006 2009 Trend
Deçan/Dečani 0.031 -0.236 0.438 + 0.578 0.450 0.630 +Dragash/Dragaš -0.321 -0.194 -0.303 - 0.238 0.291 0.230 -Ferizaj/Uroševac -0.238 -0.251 0.339 + 0.435 0.472 0.429 -Fushë Kosovë/Kosovo Polje -0.052 -0.100 -0.820 - 0.476 0.478 -0.775 -Gjakovë/ jakovica -0.083 -0.387 -0.096 + 0.366 0.367 0.296 -Gjilan/Gnjilane -0.281 -0.261 -0.345 - 0.052 0.312 -0.147 -Gllogovc /Glogovac -0.229 -0.059 0.331 + 0.370 0.469 0.760 +Hani i Elezit/ eneral Janković NA NA 0.200 NA NA NA 0.611 NAIstog/Istok -0.096 0.104 0.257 + 0.323 0.420 -0.024 -Junik/Junik NA NA -0.079 NA NA NA 0.225 NAKamenicë/Kamenica -0.208 -0.253 0.354 + 0.202 0.148 0.283 +Kaçanik/Kačanik -0.155 -0.159 0.319 + 0.612 0.425 0.313 -Klinë/Klina -0.133 -0.225 0.355 + 0.152 0.387 0.130 -Leposaviq/Leposavić -0.256 -0.329 0.187 + -0.024 -0.171 0.275 +Lipjan/Lipljan -0.194 -0.146 0.408 + 0.430 0.152 0.417 +Malishevë/Malisevo -0.159 0.093 0.267 + 0.103 0.396 0.533 +Mamushë/Mamuša NA NA 0.209 NA NA NA 0.187 NAMitrovicë/Mitrovica -0.271 -0.319 -0.037 + 0.529 0.229 0.025 -Novobërdë/Novo Brdo -0.344 -0.399 -0.202 + -0.034 -0.238 0.190 +Obiliq/Obilić -0.103 -0.112 0.189 + 0.459 0.415 0.283 -Pejë/Peć -0.233 -0.257 0.334 + 0.664 0.543 0.353 -Podujevë/Podujevo -0.257 -0.218 -0.160 + 0.437 0.286 0.057 -

Table 2. Current financial outlook and expectations for the futureNote: Index of current outlook and future expectations - in the range from (-1) "has become worse/will becomeworse" to (+1) "has become better/will become better"
HOUSEHOLD WELL-BEINGAnother indicator of household well-being was calculated by the amount of household utilities and ap-pliances in possession and assigning each item a proportional weight.A household that declared to be in possession of all items listed in the questionnaire was considered tohave a Household Wellbeing Index of 100%30. While this model is not an absolute measure of well-being, it does provide for comparative analysis.
Based on this index, the five municipalities with the highest level of household well-being wereGjakovë/Đjakovica, Prishtinë/Priština, Vushtrri/Vučitrn, Kaçanik/Kačanik and Deçan/Dečani. Those withthe lowest level of well-being were Skenderaj/Srbica, Shtime/Štimlje, Fushë Kosovë/Kosovo Polje, Lep-osaviq/Leposavić and Hani i Elezit/Đeneral Janković.
Figure 4. Top and bottom five municipalities by the Household Wellbeing Index Koso
vo M
osaic
Surve
y 200
9
21
Prishtinë/Priština -0.229 -0.209 0.159 + 0.247 0.127 0.538 +Prizren/Prizren -0.307 -0.295 0.082 + 0.279 0.401 0.474 +Rahovec/Orahovac -0.197 -0.228 -0.064 + 0.162 0.026 0.344 +Shtërpcë/Štrpce 0.156 -0.116 -0.522 - 0.366 0.134 -0.567 -Shtime/Štimlje -0.211 -0.244 0.045 + 0.323 0.440 0.807 +Skenderaj/Srbica -0.087 0.054 0.695 + 0.308 0.426 0.856 +Suharekë/Suva Reka -0.035 -0.035 0.180 + 0.666 0.673 0.262 -Viti/Vitina -0.060 -0.160 0.110 + 0.343 0.176 0.333 +Vushtrri/Vučitrn -0.105 -0.219 0.262 + 0.455 0.436 0.506 +Zubin Potok/Zubin Potok -0.175 -0.298 -0.189 + 0.043 -0.135 -0.133 +Zveçan/Zvečan -0.283 -0.344 -0.458 - 0.122 -0.116 -0.458 -Average -0.191 -0.191 0.100 + 0.352 0.317 0.290 -
30The category of tractors was not included in this index, because it was not relevant to urban dwellers, which made up 50% of the sample.

Municipalities of Skenderaj/Srbica and Shtime/Štimlje continue to rank among the lower five municipal-ities in the Household Wellbeing Index, while Prishtinë/Priština and Leposavic/Leposavić continue torank among the top five. A pattern that indicates association between low Household Wellbeing Indexand low HDI 31 can be noticed for municipalities of Skenderaj/Srbica, Shtime/Štimlje, and Hani iElezit/Đeneral Janković.
HOUSEHOLD POSSESSIONSPossession of common household appliances such as televisions and mobile phones, and other spe-cialised items such as tractors and power supply generators have not shown significant increases or de-creases since KMS 2006. The only household possessions that showed a significant increase werecomputers and Internet connections. This can be attributed to the expansion of fibre optic cables through-out Kosovo and the expanded presence of Internet providers.
Table 3. Household possessions
There were significant differences between municipalities in terms of the possession of computers. Thepercentage of households with computers was highest in Klinë/Klina, Prishtinë/Priština, Istog/Istok,Pejë/Peć and Dragash/Dragaš, and lowest in Mamushë/Mamuša, Shtime/Štimlje, Skenderaj/Srbica,Malishevë/Mališevo and Leposaviq/Leposavić. The data shows that there is a positive trend in nine cat-egories of household items, and a negative trend in three categories, resulting in an overall positivetrend.
There were also differences between municipalities in terms of the number of Internet connections.Households in urban areas (Prishtinë/Priština, Pejë/Peć and Prizren/Prizren) had higher rates of Internetconnections than municipalities with a predominantly rural character such as Shtime/Štimlje,Novobërdë/Novo Brdo, Malishevë/Mališevo and Mamushë/Mamuša. Nevertheless, possession of com-puters and Internet connection has increased in all areas since 2006. This is especially true inDragash/Dragaš, which in KMS 2006 had one of the five lowest rates of Internet connection but now hasthe highest rate, at 65%.
Publi
c Serv
ices a
nd Lo
cal A
uthori
ties i
n Foc
us
22
2003 2006 2009 TrendRadio 87% 89% 91% +Television 96% 98% 98% =Video recorder 58% 61% 63% +Satellite antenna 67% 63% 64% +Computer 12% 28% 59% +Internet connection 2% 9% 45% +Camera 31% 42% 45% +Mobile telephone 54% 84% 82% -Landline telephone 36% 34% 40% +Washing machine 77% 88% 94% +Refrigerator 85% 91% 94% +Car 57% 63% 59% -Tractor 23% 23% 23% =Generator 14% 34% 30% -Air conditioner NA NA 12%
31 United Nations Development Program, KHDR 2004, http://www.kosovo.undp.org/repository/docs/KHDR2004.pdf

Figure 5. Percentage of households with a computer
Figure 6. Percentage of households connected to the Internet
A number of studies conducted over the past few years have revealed that Kosovans are more concernedabout economic and social development than about political issues32. In its latest Kosovo Poverty As-sessment33, the World Bank stated that living standards in Kosovo remain unchanged mainly becausereal economic growth has been slow and labour market conditions have been poor as a result.
Table 4. Perceived problems in Kosovo* Data not available from KMS 2006 Ko
sovo
Mos
aic Su
rvey 2
009
23
2006 2009Average K-Albanian K-Serb Other Average K-Albanian K-Serb Other
ethnicities ethnicities
Unemployment 50% 51% 10% 67% 32% 34% 15% 36%Lack of economic growth * * * * 16% 17% 5% 13%Corruption 2% 3% 1% 1% 13% 13% 5% 27%Lack of electricity 2% 2% 1% 2% 10% 11% 10% 5%Poverty/low standard of living 2% 2% 2% 4% 12% 10% 23% 7%Inadequate infrastructure * * * * 2% 3% 1% 0%Crime * * * * 3% 3% 6% 2%Lack of general or per. security 2% * 24% 2% 2% 1% 8% 0%Limited freedom of movement 2% * 22% 4% 3% 1% 18% 4%Inter-ethnic relations * * * * 1% 1% 4% 1%
32 Early Warning Report #23 (Pristina, Kosovo: United Nations Development Programme, Prishtina,December, 2008). 33 Kosovo Poverty Assessment, Volume I: Accelerating Inclusive Growth to Reduce Widespread Poverty (The World Bank, October 3, 2007)

In terms of problems facing Kosovo as a whole, in KMS 2006, 50% of respondents declared unemploy-ment as the worst. In KMS 2009, unemployment remained the number one problem, chosen by 32% ofrespondents overall, with a breakdown by ethnicity of 36% of Kosovo’s other minorities, 34% of KosovoAlbanians, and 15% of Kosovo Serbs. This marked a decrease for Kosovo Albanians and other minoritiesand an increase for Kosovo Serbs.
The lack of economic growth, included in KMS for the first time in 2009, was rated as the second problemfor Kosovo by respondents as a whole (16%)—including 17% of Kosovo Albanians, 5% of KosovoSerbs, and 13% of other Kosovo minorities.
Kosovo Serb responses showed a different pattern from the Kosovo average. They ranked poverty/lowstandard of living as the worst problem (23%, up from 2% in 2006), followed by limited freedom ofmovement (18%, down from 22% in 2006).
Regarding problems in their respective municipalities, 32% of respondents declared unemployment thenumber one problem. Other minorities were the most concerned about unemployment in their munici-palities, just as they were for Kosovo as a whole.
For respondents overall, lack of economic growth was the second perceived problem at the municipallevel (16%). But amongst ethnicities, only Kosovo Albanians gave it second place. Kosovo Serbs viewedpoverty/low standard of living and limited freedom of movement as the top two problems in their mu-nicipalities. Among other minorities, unemployment was ranked first, followed by corruption.
Table 5. Perceived problems in municipalities
Publi
c Serv
ices a
nd Lo
cal A
uthori
ties i
n Foc
us
24
Average K-Albanian K-Serb Other ethnicitiesUnemployment 32% 34% 15% 36%Lack of economic growth 16% 17% 5% 13%Corruption 13% 13% 5% 27%Electricity (Frequent power cuts) 10% 11% 10% 5%Poverty/low standard of living 12% 10% 23% 7%Crime 3% 3% 6% 2%Inadequate infrastructure 2% 3% 1% 0%Environmental pollution 2% 2% 1% 3%Poor state of water supply 2% 2% 2% 2%Lack of general or personal security 2% 1% 8% 0%Poor governance 1% 1% 1% 0%Limited freedom of movement 3% 1% 18% 4%Poor health care 1% 1% 1% 0%Inter-ethnic relations 1% 1% 4% 1%

OPTIMISM ABOUT THE FUTURERespondents were asked for the first time in KMS 2009 to agree or disagree with the statement: “I amoptimistic about the future of Kosovo in general”. Close to 75% responded they remained optimistic.Kosovo Albanians (78%) and other ethnicities (49%) were more optimistic than Kosovo Serbs (24%).A relationship between age and optimism was also observed (see Table 6), with younger people tendingto express more optimism.
Table 6. Responses to “I am optimistic about the future of Kosovo in general” according to respon-dents’ age and ethnicity
Respondents were also asked to agree or disagree with the statement “I am optimistic about the futureof my municipality”. Kosovo Albanians were the most optimistic with 78% (“Strongly agree” and “Iagree”), followed by other minorities (49%) and Kosovo Serbs (24%). Respondents expressed less op-timism about their own municipalities (64%) than about Kosovo (72%).
Table 7. Optimism about municipality’s future by ethnicity
Koso
vo M
osaic
Surve
y 200
9
25
Categories Mean age All K-Albanian K-Serb Other ethnicities ethnicities
Strongly agree 35 36% 40% 9% 8%I agree 37 36% 38% 15% 41%Neither agree nor disagree 39 15% 13% 31% 34%Disagree 40 7% 5% 25% 8%Strongly disagree 40 4% 2% 17% 3%Don't know 45 2% 2% 3% 6%
Categories Mean age All K-Albanian K-Serb Other ethnicities ethnicities
Strongly agree 35 28% 32% 8% 8%I agree 37 36% 37% 22% 41%Neither agree nor disagree 39 22% 20% 36% 36%Disagree 39 7% 5% 20% 8%Strongly disagree 38 5% 4% 13% 2%Don't know 43 2% 2% 1% 5%

CHAPTER SUMMARY AND LESSONS LEARNEDWhile it is clear that many problems still affect Kosovo’s citizens, the latest macroeconomic indicatorspoint towards an improving economic condition for Kosovo. When the Kosovo Mosaic Survey was firstadministered in 2003, Kosovo’s GDP was 1.32 billion euro. It had increased to 3.18 billion euro by thetime KMS 2006 was administered, and keeping in line with this trend in 2008, the last year for whichfull data is available, the GDP increased to 3.86 billion euro34. KMS 2006 was administered, and keepingin line with this trend in 2008, the last year for which full data is available, the GDP increased to 3.86billion euro . KMS 2009 aimed at examining whether this progress had translated into improved well-being for Kosovo’s citizens and whether it is reflected in respondents’ attitudes and perceptions.
KMS 2009 shows that respondents are more content with their financial well-being than they were inthe past and they remain optimistic for future financial improvements, although less so than reportedin prior KMS surveys. However, trends revealing a regional disparity in economic well-being observedin KMS 2003 and 2006 remain. K-Serb majority municipalities continue to lead in household expenditure,and regional centres such as Gjakovë/Đjakovica, Prizren/Prizren and Prishtinë/Priština follow suit. Mu-nicipalities of Dragash/Dragaš, Lipjan/Lipljan and Skenderaj/Srbica remain well below the Kosovo av-erage of household expenditure and the Wellbeing Index, a clear indicator of disproportionate gains fromKosovo’s development.
KMS 2009 shows that Kosovo is quickly embracing technology and making it a part of everyday life. Thisis shown by the fivefold increase in Internet connections in just three years, which serves as proof ofan improved economic environment. Optimism still reigns in Kosovo, with most K-Albanians and otherminorities believing in further improvements in Kosovo. K-Serbs on the other hand, were less optimistic,a reflection of their main concerns - security and freedom of movement.
A lack of job opportunities remains the main concern for respondents. While fewer respondents identifiedunemployment as the main concern in 2009 compared to 2006, one in three respondents perceived alack of jobs to be the main problem facing their community. KMS 2009 results point to a somewhat im-proving economic environment, with increased economic satisfaction and an optimistic future outlook.However, large disparities and divisions remain between municipalities, an issue which is in need of im-mediate attention.
26
Publi
c Serv
ices a
nd Lo
cal A
uthori
ties i
n Foc
us

CHAPTER II


29
Koso
vo M
osaic
Surve
y 200
9
CHAPTER II: PUBLIC SERVICESThis chapter will explore citizens’ satisfaction with basic public services such as water supply, energy,public transportation and heating, and with the cleanliness of parks and green zones. Respondent an-swers for satisfaction with public services were aggregated to produce the Index of Satisfaction with Pub-lic Services on a scale from (-100) "very dissatisfied" to (+100) "very satisfied". The Index of Satisfactionwith Public Services enables the ranking of public services by satisfaction and also the comparison ofthe same Index from KMS 2006, thus providing for trend inference. Respondents expressed more dissatisfaction with the delivery of public services in 2009 than in 2006(see Figure 7).
Figure 7. Satisfaction with public services in 2006 and 2009* Index of satisfaction with public services - in the range from (-100) "very dissatisfied" to (+100)"very satisfied"

30
Publi
c Serv
ices a
nd Lo
cal A
uthori
ties i
n Foc
usSatisfaction with fire and emergency services saw the most significant decrease since 2006, while an-other negative trend observed was regarding public transportation. Both these services are managed bythe municipalities. Satisfaction of respondents with local and inter-city road maintenance, sewage andsanitation has shown improvement compared to KMS 2006.
In 2009, respondents as a whole said that the public service most urgently in need of attention is elec-tricity, followed by primary health care facilities and waste collection. Kosovo Albanians also gave theimprovement of these three services the greatest urgency. Kosovo Serbs gave the highest priority toelectricity, followed by road maintenance and water supply. Other Kosovo minorities gave highest priorityto electricity, waste collection and road maintenance. Respondents reported that since 2006, their accessto sewage and sanitation has increased by 10%, access to drinking water supply by 7%, and accessto central heating by about 3%, but access to electricity has decreased.
Table 8. Public services perceived to need improvement
Table 9. Percentage of respondents with access to basic public services
Average K-Albanian K-Serb Other ethnicities
Electricity 15% 15% 16% 15%Ambulance 13% 13% 9% 11%(primary health care)Waste collection 10% 10% 11% 14%Road maintenance 10% 9% 12% 13%Water supply 9% 9% 12% 12%Education 8% 8% 7% 3%Sewage and sanitation 7% 7% 10% 11%Social housing 7% 8% 4% 7%Curbing illegal construction 5% 5% 2% 5%Parks and recreational facilities 4% 4% 4% 2%Sports 4% 4% 5% 1%Issuing civil documents 3% 4% 2% 1%Pedestrian and biking areas 2% 2% 3% 0%Procedures for tax payment 2% 2% 1% 3%Open market areas 1% 1% 2% 1%
2003 2006 2009 TrendRunning water 68% 74% 84% +Sewage and sanitation 51% 61% 71% +Central heating 3% 6% 9% +Electricity 97% 99% 96% -
31
Koso
vo M
osaic
Surve
y 200
9
PERCEPTIONS ABOUT RESPONSIBILITY FOR PUBLIC SERVICES In Kosovo, responsibility for public services is divided between municipal governments and the centralgovernment. Competencies of municipal governments are regulated by the Law on Local Self Government03/L04035. For example, services such as local public transportation, and social services such as cashassistance schemes are managed by the local government. Services delivered by publicly owned com-panies are managed by the central government. Currently, water supply service is overseen by the centralgovernment; however, it is anticipated that through the decentralisation process this authority will betransferred to local governments. Some sport and cultural services are jointly managed by local govern-ment institutions, although they fall in the domain of the Ministry of Culture, Youth and Sports.
In order to accurately assess the performance of local and central government administrations, seek ac-countability and evaluate service improvements, Kosovo citizens must correctly identify the level of gov-ernment responsible for specific pubic services. KMS 2009 shows that as with previous KMS surveys,confusion persists on who is in charge of what service. For the most part, respondents have a similarunderstanding of the responsible party for the various public services measured as in previous KMSsurveys. However, there were also notable exceptions. For example, in contrast to previous years, con-siderably more respondents accurately identified primary and secondary education to be a responsibilityof the local government, with 62% holding the municipal government accountable for the delivery of pri-mary and secondary education, whereas approximately 25% consider the central government to be incharge.
Regarding the delivery of primary health care service, the majority of respondents were aware that pri-mary health care services were the responsibility of the local government, a result in line with previousKMS survey results. Only about 20% of respondents identified the central government to be in chargeof this service.
Concerning local road maintenance, a local government duty, significantly fewer KMS 2009 respondentsconsidered the local government to be in charge of this service, compared to prior KMS results. Regardingelectricity supply, the administration of pensions, and management of inter-municipality roads and high-ways, the majority of respondents accurately identify the central government to be in charge. However,in a show of confusion, the majority of respondents believed that the local government is responsiblefor issuing passports, a service provided by the Ministry of Internal Affairs. KMS 2009 results show that although the majority of respondents identified the accurate governmentinstitutions in charge of services provided, respondents continued to exhibit high levels of uncertaintyon the level of government in charge. Such situation poses a serious challenge when demanding improve-ments in public services, and high levels of uncertainty may also inhibit respondents in seeking govern-mental accountability.
35 Official Gazette. Law on Local Self Government 03/L040 http://www.gazetazyrtare.com/e-gov/index.php?option=com_content&task=view&id=147&Itemid=56

Figure 8. Perceptions on the responsibilities of central and municipal governments
WATER SUPPLYFive reservoirs—Ujmani/Gazivoda, Batllava/Batlava, Badovc/Badovac, Përlepnic/Prilepnica andRadoniq/Radonic—supply Kosovo with drinking water. The water supply is managed by regional com-panies, which are licensed by the Waste and Water Regulatory Office. Annual water consumption reaches75–80 million cubic meters of water. Securing water has become a challenge for many companies, andvery few municipalities are supplied with water 24 hours a day.
32
Publi
c Serv
ices a
nd Lo
cal A
uthori
ties i
n Foc
us

33
Koso
vo M
osaic
Surve
y 200
9
Of the KMS 2009 respondents, 54% were supplied with water more than 11 hours per day or had un-restricted access, while 17% were not connected to the public water system at all. The highest percent-age of respondents reporting unrestricted water access were Skenderaj/Srbica (98%), Zveçan/Zvečan(86%), Deçan/Dečani (71%), Gjakovë/Đjakovica (79%) and Zubin Potok/Zubin Potok (43%).Skenderaj/Srbica respondents were both the most connected to water supply and the most satisfied(62%).
Figure 9. Connection to water supply
Fewer than 50% of the respondents said their water quality was good. Those most satisfied with waterquality were primarily in rural municipalities, and the least satisfied were in small cities such as Ra-hovec/Orahovac (where only 9% of respondents said water quality was good) and Novobërdë/Novo Brdo(14%).
Figure 10. Satisfaction with water quality

34
Publi
c Serv
ices a
nd Lo
cal A
uthori
ties i
n Foc
us
SEWAGE DISPOSALIn Kosovo, there is no wastewater treatment system; rather, sewage is emptied into open areas. Accessto sewage disposal does not appear related to ethnicity – 71% of Kosovo Albanians, 69% of KosovoSerbs and 80% of other minorities reported that they had access.The municipalities most and least satisfied with the sewage and sanitation system are shown in Figure
11. The Kosovo average is 2.5 on a scale of 4, with 1 being very satisfied and 4 being very unsatisfied.The municipalities shown below are a mixture of urban and rural, indicating that sewage disposal is aconcern for all residents, regardless of ethnicity or location.
Figure 11. Satisfaction with sewage and sanitation system
ELECTRIC POWER SUPPLYKosovo possesses the world’s fifth largest proven reserves of lignite (14.7 million tons), which is extractedfrom two strip mines, and feeds into two local coal-burning power stations. However, in the past threeyears, there has been an increase in dissatisfaction with the electricity supply. In the index produced fromthe service satisfaction scale measurements, in a range of (-100) to (+100), the index for satisfactionwith electricity supply has moved from -3.0 in 2006 to -11.4 in 2009, and is similar among all ethnicgroups. A move in the negative direction suggests a growing dissatisfaction with electricity supply. Given that the Kosovo Energy Corporation (KEK) is the only electricity supplier in Kosovo, it is not sur-prising that 56% of respondents said that the central government is responsible for supplying electricity.A quarter of respondents said that local authorities were responsible. Only 7% said, correctly, thatelectric power is a public enterprise.
Respondents were asked to rate their satisfaction on a scale of 1 to 4, with 1 being very satisfied and4 being very unsatisfied. Those who were the most satisfied with electricity supply were from

Zveçan/Zvečan, Skenderaj/Srbica, Hani i Elezit/Đeneral Janković, Lipjan/Lipljan and Shtime/Štimlje.Those who were the least satisfied were from Shtërpcë/Štrpce, Fushë Kosovë/Kosovo Polje,Mamushë/Mamuša, Junik/Junik, and Rahovec/Orahovac.
Figure 12. Satisfaction with electricity supply
SANITATIONThe cleanliness of Kosovo and its municipalities depends on the frequency of waste collection and onpublic awareness, as well as on other factors such as construction activity. The majority of respondentsrated their respective municipalities as “somewhat clean”.
Figure 13. Municipality’s cleanliness
Respondents rated their municipalities as “very dirty” were then asked why that was the case. Almosthalf (46%) answered that the citizens were to blame. Others blamed a lack of garbage bins (20%) andthe bins’ distance from dwellings (15%).
35
Koso
vo M
osaic
Surve
y 200
9
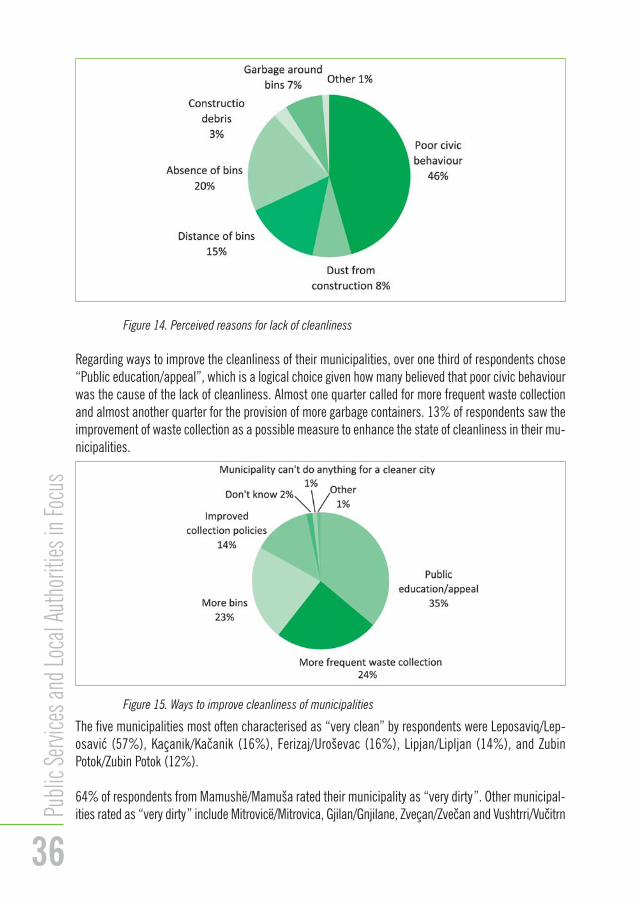
Figure 14. Perceived reasons for lack of cleanliness
Regarding ways to improve the cleanliness of their municipalities, over one third of respondents chose“Public education/appeal”, which is a logical choice given how many believed that poor civic behaviourwas the cause of the lack of cleanliness. Almost one quarter called for more frequent waste collectionand almost another quarter for the provision of more garbage containers. 13% of respondents saw theimprovement of waste collection as a possible measure to enhance the state of cleanliness in their mu-nicipalities.
Figure 15. Ways to improve cleanliness of municipalities
The five municipalities most often characterised as “very clean” by respondents were Leposaviq/Lep-osavić (57%), Kaçanik/Kačanik (16%), Ferizaj/Uroševac (16%), Lipjan/Lipljan (14%), and ZubinPotok/Zubin Potok (12%).
64% of respondents from Mamushë/Mamuša rated their municipality as “very dirty”. Other municipal-ities rated as “very dirty” include Mitrovicë/Mitrovica, Gjilan/Gnjilane, Zveçan/Zvečan and Vushtrri/Vučitrn
36
Publi
c Serv
ices a
nd Lo
cal A
uthori
ties i
n Foc
us

(49 %, 48 %, 46 % and 43 %, respectively). Most respondents blamed the condition and appearanceof their municipalities on poor civic behaviour. The availability, location and state of garbage bins werealso perceived as a considerable problem. For example, 83% of Mamushë/Mamuša respondents attrib-uted the lack of cleanliness to poor civic behaviour. Respondents from Mitrovicë/Mitrovica attributed theproblem both to poor civic behaviour and to the unavailability of garbage containers, the latter of whichis the responsibility of public utility companies. This indicates that responsibility lies within the munic-ipalities and public utility companies as well as with the citizens. Thus there is a need for the government,the Kosovan people and public utility companies to work together to create a cleaner Kosovo.
Table 10. Perceived causes for lack of cleanliness in municipalities rated “very dirty”
PARKS AND GREEN ZONESOnly one in five respondents said they visit city parks. 35% of respondents declared that they would useparks as a venue for recreation if they were available. However, 56% of the respondents stated that theydo not use parks. Almost all respondents (97%) said that their municipalities did not have enough treesand grassy areas. Dissatisfaction rates were diverse, but the perceived shortage of recreational areaswas highest (56%) in Mitrovicë/Mitrovica.
Do you use city parks or other recreational green areas?Yes 18%I would use, but there are none 35%No 47%
Table 11. Use of green areas
PUBLIC TRANSPORTATIONKosovo’s urban road infrastructure and inter-city road networks have undergone significant refurbish-ment since the conflict in 1999. However, the need for improved roads and infrastructure is far from ful-filled. Public passenger transportation services in Kosovo are limited to inter- and intra-city transitbuses, city van pool services and commuter trains. Bus services, both within and between cities, rep-resent the main mode of public transportation in Kosovo. Railway passenger traffic was recently re-es-tablished, but only operates in two inter-city lines with a minimal number of passengers. KMS 2009 37
Koso
vo M
osaic
Surve
y 200
9
Mitrovicë/Mitrovica 43% 41% 10% 16% 15% 3% 14% 0%Gjilan/Gnjilane 46% 34% 6% 11% 37% 4% 4% 4%Vushtrri/Vučitrn 48% 48% 4% 15% 18% 2% 14% 1%Zveçan/Zvečan 49% 29% 2% 9% 17% 12% 31% 0%Mamushë/Mamuša 64% 83% 9% 6% 2% 0% 0% 0%
Top five dirtiestmunicipalities
"Ver
y dirt
y"
ratin
g
Poor
civic
be
havio
ur
Dust
from
co
nstru
ction
Bins
are
fa
r awa
y
No b
ins
Resid
ual
cons
truct
ion
debr
is
Garb
age
arou
nd b
ins
Othe
r

38
Publi
c Serv
ices a
nd Lo
cal A
uthori
ties i
n Foc
us
MunicipalityPercentage ofrespondents
who use publictransportation
Several timesa day (morethan twice)
Once or twicedaily
Once or twicea week
Once or twicein a month
Several timesa year or less
Frequency of public transportation use
results show that approximately 19% of survey respondents are regular users of public transportation,with the majority reporting that they only use public transportation once or twice a week. Results show that municipalities with the highest reported use of public transportation are FushëKosovë/Kosovo Polje, Zveçan/Zvečan, Leposaviq/Leposavić, and Lipjan/Lipljan. It is worth noting thatthese municipalities border larger regional centres such as Prishtinë/Priština and Mitrovicë/ Mitrovica,which have more extensive road networks. When asked about the frequency of public transportationuse, the majority of respondents from Fushë Kosovë/Kosovo Polje, the municipality with the highest re-ported use of public transportation, declared that they used public transportation only once or twice aweek, compared to respondents from Zveçan/Zvečan, Leposaviq/Leposavić and Prishtinë/Priština, wherethe majority use public transportation on a daily basis.
KMS 2009 shows that approximately 35% of survey respondents identified the poor condition of busesas a major problem with public transportation, and some 25% reported the overcrowding of buses asanother major problem. The cost of tickets was also considered a major issue by 10% of survey re-spondents. These results indicate that the availability of road networks, the quality of the road infrastruc-ture and the management of transportation services directly contribute to the use of public transportationin Kosovo
Fushë Kosovë/Kosovo Polje 89% 2% 32% 59% 7% 0%Zveçan/Zvečan 67% 26% 74% 0% 0% 0%Leposaviq/Leposavić 55% 25% 56% 19% 0% 0%Lipjan/Lipljan 51% 48% 26% 16% 10% 1%Prishtinë/Priština 44% 10% 66% 20% 3% 0%
Table 12. Use of public transportation—top five municipalities
Survey respondents in a number of municipalities indicated that public transportation services wereunreliable, operating with frequent delays and variable schedules. Service delays and limited frequencyappear to be the most common in Podujevë/Podujevo, as half of public transportation users claimed thatas a result of service delays or service disruptions, they do not reach their destination on time. About aquarter of respondents from Junik/Junik expressed the same dissatisfaction. On the other hand, publictransportation in Prishtinë/Priština and Mitrovicë/Mitrovica, both with extensive public transportation net-works, received the highest satisfaction rates, with 98% and 91%, respectively.
HEATINGHeavy oil- and diesel-based district heating is a relatively new service in Kosovo. It is offered to a numberof residents in only four municipalities - Prishtinë/Priština, Gjakovë/Đjakovica, Mitrovicë/Mitrovica andZveçan/Zvečan. Electric heaters and wood-burning stoves are the main options for those with no accessto district heating systems.

39
Koso
vo M
osaic
Surve
y 200
9
The largest district heating supplier is Termokos, a publicly owned enterprise created in 1970 in Prisht-inë/Priština. Its two furnaces burn heavy oil to heat water and distribute it through 28 km of pipes to 245substations. Heat transmitted to substations is then distributed to apartment blocks, and individualhouses. However, due to bad maintenance, leaks, lack of insulation, and damaged tubes, 20-25% of heatis lost during distribution.
KMS found that access to district heating increased from 3% in 2003 to 6% in 2006 and 9% in 2009.Kosovo Serbs reported the most access to district heating, at 17%, followed by Kosovo Albanians(8%) and other minority groups (4%).
CHAPTER SUMMARY AND LESSONS LEARNEDAs Kosovo’s economy grew steadily over the past years, its revenues also grew and expanded the modeststate budget. From 600 million euro in 2003, when KMS was first administered, Kosovo’s budget grewclose to 1.4 billion euro in 2009. Increased budget revenues, and the resulting higher expenditures wereexpected to directly improve the delivery of public services. In addition, capital investments in infrastruc-ture, education and other areas, as part of budget expenditures, were also thought to improve the avail-ability and delivery of public services. While improvements in public services tend to be lengthy andshow modest immediate results, KMS 2009 asked respondents to express their assessment of serviceavailability and delivery in their local communities.
Compared to previous surveys, KMS 2009 respondents reported significantly higher access to basicservices, including running water, sewage and sanitation as well as central heating, marking an importantaccomplishment of local and central government. However, with a slight drop in its access, electricityremains the biggest concern for Kosovo citizens.
Increased access to basic services does not seem to influence overall satisfaction with service delivery.KMS 2009 shows that respondents judge power shortages in need of the most immediate attention, fol-lowed by primary health care, road maintenance and water supply. While most public services are con-sidered to be delivered somewhat satisfactorily, respondents are less pleased with their deliverycompared to previous KMS surveys, indicating a more critical respondent assessment.
One in five Kosovo citizens regularly use public transportation, with some relying extensively on it. Over-crowding, poor bus conditions and poor road networks are identified as areas requiring the most imme-diate attention from local governments. Continued infrastructure investments, especially in areas thatare connected to larger road networks and in inter-city road infrastructure, should further encourage the use of public transportation in Kosovo.
Respondents’ continued uncertainty regarding who is in charge of delivering specific public servicescan be seen as a negative contributor to the low satisfaction levels with public service delivery. Eventhough respondents are increasingly more accurate in identifying those in charge of service provisioncompared to previous years, respondents continue to be uncertain in many areas, directly inhibiting re-spondents from seeking governmental accountability.


CHAPTER III


PARTICIPATION IN MUNICIPAL GOVERNMENTSince the administration of the last KMS in 2006, Kosovo municipal governments have undergone sig-nificant changes. In an attempt to create a sustainable and effective system of local governance andassure local self-governance for minority communities, a shift of authority from the central governmentto municipal governments has taken place. This ongoing transition of power was initially marked withseveral major initiatives.
Working under UNMIK Regulations 2007/27 and 2007/30, the November 2007 local elections markedone of such major initiatives. This election resulted in the first direct election of municipal mayors acrossKosovo. Open party lists also allowed the direct election of municipal and Kosovo assembly represen-tatives. Although an anticipated increase in voter turnout did not occur, the direct election of mayors wasexpected to bring significant changes in the political scene in a number of municipalities.
A major initiative that directly contributed to this authority shift was the incorporation of the Compre-hensive Proposal for a Status Settlement for Kosovo36 into the Constitution and legislation of Kosovo, andthe commitment of Kosovo institutions to carry out proposed actions. The Comprehensive Proposal fora Status Settlement for Kosovo, known as the “Ahtisaari Plan”, was drafted by a team headed by Pres-ident Martti Ahtisaari, Special Envoy of then-UN Secretary-General, Kofi Annan. One of the issues ad-dressed in this proposal is the issue of decentralisation which shifts authority from central to localgovernments, in order to promote good governance, transparency and effectiveness in public services.Through the decentralisation of authority, the proposal also aims at easing the concerns of the K-Serbcommunity, by promising K-Serbs a higher degree of control over their own affairs.
According to the Kosovo Government’s action plan on the implementation of decentralisation37, a numberof laws that address actions proposed by the Ahtisaari Plan and extend local government reform wereadopted by the Assembly of Kosovo in 2008. For example, the Law on Municipal Administrative Bound-aries (2008/03-L041), which regulates the territorial organisation of local self-governments in Kosovo,also establishes new municipalities, as proposed by the Plan. Additionally, this law converts MunicipalPilot Units (MPU) of Junik/Junik, Mamushë/Mamuša and Hani i Elezit/Đeneral Janković into fully fledgedmunicipalities, further expanding the decentralisation of authority.
43
Koso
vo M
osaic
Surve
y 200
9
36 United Nations Office of the Special Envoy for Kosovo. Comprehensive proposal for the Kosovo Status Settlement (2007).Http://www.unosek.org/unosek/en/statusproposal.html37 Government of Kosovo. (2008). Action Plan on the Implementation of Decentralization. Prishtina

The Law on Local Government Finance (2008/03-L049) provides for new competencies for local gov-ernments including responsibility for their own budget and provides expanded competencies and financialautonomy to all municipal governments. Additionally, as set out by the Ahtisaari Plan, all municipalitieswill be entitled to their own financial resources, including its own sources of revenue.
Another enacted law, the Law on Local Self-Government (2008/03-L040), represents another major ini-tiative in the shift of authority. This law, which defines the legal status of municipalities, also sets theframework for the organisation and functioning of municipal bodies and regulates inter-municipal agree-ments and cooperation. Also, as set forth by the Ahtisaari Plan, the law regulates the relationshipbetween municipalities and the central government, which further contributes to the decentralisation ofauthority.
Such local government reforms, including the decentralisation of authority, aim at promoting trans-parency, accountability and effectiveness in public services, as well as bringing the government closerto its constituents. In addition to voting in local or central government elections, citizens in Kosovo havedifferent means of influencing the makeup of their government or the government’s policies. Thesemeans include the use of the media, volunteering, joining organisations and attending town hall meetings.While social activism is being used more frequently to seek transparent governance, other methods ofinfluencing decision-making are being used less frequently. In particular, voter turnout, which was highin the first elections after the conflict, has declined significantly in the last elections. It was expectedthat election reform—the introduction of the proportional system with open lists and the direct electionof mayors—would reverse the decline in voter turnout; however, fewer than 40% of Kosovans turnedout to vote in the November 2007 elections.
The previous Mosaic surveys showed that the majority of Kosovans are not interested in voicing theiropinions on public policy, a lack of interest reflected in the decline in voter turnout. This chapter explorespossible reasons for that apathy.
MUNICIPAL PUBLIC MEETINGS Engagement in any activity is often determined by how welcoming the activity is deemed to be. The ma-jority of KMS 2009 respondents believe that their municipality somewhat welcomes citizen participation.Another factor contributing to the degree of involvement in activities is the awareness of opportunitiesto participate. In KMS 2006, 23% of respondents said they were aware of meetings organised by theirmunicipality. In 2009, this figure was higher—on average, one in three respondents reported of beingaware of municipal public meetings organised by the municipality within the last year though only 8%attended a municipal public meeting. Kosovo Serbs (86%) were less informed about municipal publicmeetings than Kosovo Albanians (68%).
44
Publi
c Serv
ices a
nd Lo
cal A
uthori
ties i
n Foc
us

Figure 16. “My municipal government welcomes citizen participation”
Figure 17. Percentage of citizens informed about municipal public meetings
The municipalities that were rated as the most open to input from their citizens are shown in Table 13.
Municipality Feel welcome Feel informed Attended meeting(s)Skenderaj/Srbica 83% 75% 12%Dragash/Dragaš 77% 1% 0%Rahovec/Orahovac 60% 15% 2%Shtime/Štimlje 56% 0% 0%Gllogovc/Glogovac 50% 35% 3%
Table 13. Municipalities rated most open to citizen participation
45
Koso
vo M
osaic
Surve
y 200
9

46
Publi
c Serv
ices a
nd Lo
cal A
uthori
ties i
n Foc
usA very high percentage of respondents from Skenderaj/Srbica said they were informed of meetings, andmore than 80% perceived the local government as welcoming their input. However, in the same munic-ipality, only 12% of respondents said they attended municipal public meetings. In Dragash/Dragaš, re-spondents said they felt welcome, though only 1% of respondents claimed to be informed and nonesaid they had attended meetings within the last year.
As in KMS 2003 and 2006, the participation rates of Kosovo Serbs were higher than average, as theytended to value municipal public meetings more than other citizens. Among the five municipalities withthe highest attendance rates, two were predominantly Serb. Fewer than 10% of Zubin Potok/Zubin Potokand Leposaviq/Leposavić respondents had attended a municipal public meeting in the past year. Respon-dents from Skenderaj/Srbica showed more interest, with 12% of surveyed citizens having attended mu-nicipal public meetings. No respondents from Dragash/Dragaš, Lipjan/Lipljan or Mamushë/Mamušahad attended a municipal public meeting in the last year.
Municipality Attended Skenderaj/Srbica 12%Zubin Potok/ Zubin Potok 9%Leposaviq/Leposavić 8%Pejë/Peć 7%Gjilan/Gnjilane 4%Gjakovë/Đjakovica 4%
Table 14. Top six municipalities for town hall attendance
Holding high perceptions on municipal governments as welcoming, and being informed about municipalpublic meetings, therefore does not directly correlate to high citizen participation in such meetings.
VOTINGVoter turnout in 2007 (40%) was the lowest since the first post-conflict elections in 2001. When askedto name the single most important reason for voting, respondents gave the following answers: belief inthe promises of the political party (32%), belief that the vote had meaning (17%),the feeling that theywere helping Kosovo (17%), belief in a better life (12%), belief in positive changes (11%), I like politicalparty people that I voted for (5%), know personally people I voted (2%), because my family membervoted (2%), and because of other and unspecified reasons (1%).
Figure 18. Reasons for choosing to vote

47
Koso
vo M
osaic
Surve
y 200
9
OTHER WAYS TO INFLUENCE DECISION-MAKINGKMS 2009 sought to identify what respondents considered as the most effective way of influencing gov-ernmental decision-making. Respondents were asked to rate the effectiveness of various modes of in-fluencing municipal government policies and decisions. The results show that respondents consider theuse of media to be the most effective mode of impacting government policies, in stark contrast to par-ticipation in public protests, which was identified as one of the least effective modes in achieving policychange at the local level. It is worth noting that voluntary work in organisations and personal contactwith representatives of the municipal government were deemed to be more effective methods of influ-encing municipal government policies than attending public protests. However, it is somewhat discour-aging that, although considered somewhat effective, attending municipal public meetings is believed tobe less effective in achieving policy change than participation in public protests.
Figure 19. Ways to influence municipal decision-making
Respondents reported that they most frequently resorted to simpler forms of influence, such as petitionsand participation in public protests to express concern or dissatisfaction with the government’s perform-ance or policies. KMS 2009 results show that over the past year, one in five K-Albanian respondents hadsigned a petition, and some 17% had participated in a public protest, with approximately the samenumber having attended a municipal public meeting. Over the same period, 26% of K-Serb respondentsreported to having signed a petition, and over 40% to have participated in a public protest, much higherthan the 23% that reported to have attended a municipal public meeting. When compared to K-Albaniansand K-Serbs, fewer respondents from other minorities in Kosovo indicated having participated in publicprotests. Only 14% of respondents reported participating in such protests. Some 14% of minority re-spondents also reported having signed petitions as a means of influencing policy.
Although respondents consider participating in public protests to be among the least effective modes ofinfluencing municipal decision making, KMS 2009 shows that for K-Albanians, it is the second most fre-quently used mode, after petition signing. More K-Serbs respondents reported having attended publicprotests than having signed a petition, attended a public debate or attended a municipal public meeting.
Last Effective Most Effective

Figure 20. Participation in political activities to influence decision-making
The Law on Local Self Governance requires that each municipal government organises two annual mu-nicipal public meetings with its constituents. These meetings are perceived as having the ability to affectdecisions of the mayor and the municipal assembly. Making one’s voice heard is done through signinga petition, protesting in the streets or participating in discussions at municipal public meetings. Inessence, these actions are peripheral forms of affecting decision-making, while voting has direct im-pact.
Evaluation of listed forms of citizen participation can be seen as less effective, and is asserted with theresult where 55% of respondents stated that municipal representatives do not consider the opinions ofcitizens when making decisions.
SATISFACTION WITH MUNICIPAL ADMINISTRATIONLocal government reform, the November 2007 elections and the decentralisation of authority from centralto local governments have been expected to significantly impact the efficiency of local administrations.In addition to measuring general satisfaction with municipal government administrations and analysingsatisfaction trends, KMS 2009 aimed at reporting respondents’ perceptions on their municipal govern-ment’s trustworthiness, its accessibility and respondents’ attitudes towards access to information anddocumentation at their local government offices. KMS 2009 also intended to describe respondents’knowledge of the functions of their municipal governments and whom they needed to address when re-questing help from their local government.
When asked to express their satisfaction with their local administration, respondents revealed somewhatmixed satisfaction levels. Compared to previous KMS, KMS 2009 respondents were somewhat moresatisfied with their local governments than respondents in 2006, but less satisfied than respondents fromthe first Kosovo Mosaic Survey in 2003. Although the overall satisfaction across all of Kosovo’s munic-ipalities was positive, the results varied considerably across regions. For example, respondents from Sk-enderaj/Srbica, a municipality with a K-Albanian majority and respondents from Leposaviq/Leposavić,a K-Serb majority municipality, were very satisfied with their local governments. In stark contrast, re-spondents from Rahovec/Orahovac and Prizren/Prizren reported the highest levels of discontent with theirmunicipal government.
48
Publi
c Serv
ices a
nd Lo
cal A
uthori
ties i
n Foc
us
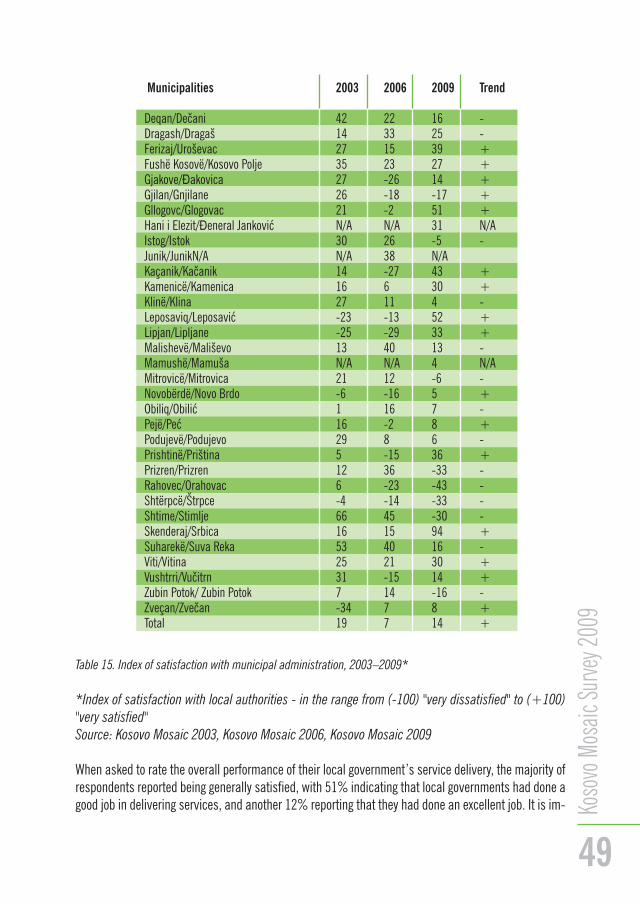
49
Koso
vo M
osaic
Surve
y 200
9
Table 15. Index of satisfaction with municipal administration, 2003–2009*
*Index of satisfaction with local authorities - in the range from (-100) "very dissatisfied" to (+100)"very satisfied"Source: Kosovo Mosaic 2003, Kosovo Mosaic 2006, Kosovo Mosaic 2009
When asked to rate the overall performance of their local government’s service delivery, the majority ofrespondents reported being generally satisfied, with 51% indicating that local governments had done agood job in delivering services, and another 12% reporting that they had done an excellent job. It is im-
Municipalities 2003 2006 2009 Trend
Deqan/Dečani 42 22 16 -Dragash/Dragaš 14 33 25 -Ferizaj/Uroševac 27 15 39 +Fushë Kosovë/Kosovo Polje 35 23 27 +Gjakove/Đakovica 27 -26 14 +Gjilan/Gnjilane 26 -18 -17 +Gllogovc/Glogovac 21 -2 51 +Hani i Elezit/Đeneral Janković N/A N/A 31 N/AIstog/Istok 30 26 -5 -Junik/JunikN/A N/A 38 N/AKaçanik/Kačanik 14 -27 43 +Kamenicë/Kamenica 16 6 30 +Klinë/Klina 27 11 4 -Leposaviq/Leposavić -23 -13 52 +Lipjan/Lipljane -25 -29 33 +Malishevë/Mališevo 13 40 13 -Mamushë/Mamuša N/A N/A 4 N/AMitrovicë/Mitrovica 21 12 -6 -Novobërdë/Novo Brdo -6 -16 5 +Obiliq/Obilić 1 16 7 -Pejë/Peć 16 -2 8 +Podujevë/Podujevo 29 8 6 -Prishtinë/Priština 5 -15 36 +Prizren/Prizren 12 36 -33 -Rahovec/Orahovac 6 -23 -43 -Shtërpcë/Štrpce -4 -14 -33 -Shtime/Stimlje 66 45 -30 -Skenderaj/Srbica 16 15 94 +Suharekë/Suva Reka 53 40 16 -Viti/Vitina 25 21 30 +Vushtrri/Vučitrn 31 -15 14 +Zubin Potok/ Zubin Potok 7 14 -16 -Zveçan/Zvečan -34 7 8 +Total 19 7 14 +

portant to note that while the overall performance received a passing grade, some 46% of respondentsbelieved their local governments did a poor or a very poor job when it came to solving the problems oftheir constituents. Additionally, 63% of respondents believed their local governments are doing an ex-cellent or good job in providing clear and precise information, and the majority (54%) thought their mu-nicipality did a poor or a very poor job in tackling corruption.
Excellent Good Poor Very poor Don’t know
Overall performance 12% 51% 31% 3% 3%Clear and precise information 14% 49% 31% 4% 3%Ease of contacting the right person 18% 38% 36% 5% 3%Ability to solve the problem 12% 39% 40% 6% 3%Convenience of office hours 19% 46% 27% 4% 3%Timeliness of service 17% 37% 35% 8% 3%Courtesy of employees 21% 41% 27% 9% 3%Anti-corruption measures 10% 20% 31% 24% 16%
Table 16. Rating of specific elements of municipal government service, 2009
The perception that local municipal governments lack anti-corruption measures is also expressed whenrespondents were asked to rate the trustworthiness of their local governments in managing municipalfunds and assets. Overall, respondents had a mixed view of their local government’s ability to reliablymanage municipal funds. Some 39% said that they were “Somewhat trustful” while another 19% con-sidered the local government “Trustworthy’ or “Very trustworthy” in managing municipal funds. Fewerrespondents (32%) regarded the local government as untrustworthy when it came to managing funds.
Figure 21. Perceived trustworthiness of municipal government on fund management
In the last year, one in three respondents visited a municipal office to request documents of personalinterest—such as the Kosovo identity card and passport, which the government started to issue in July
50
Publi
c Serv
ices a
nd Lo
cal A
uthori
ties i
n Foc
us
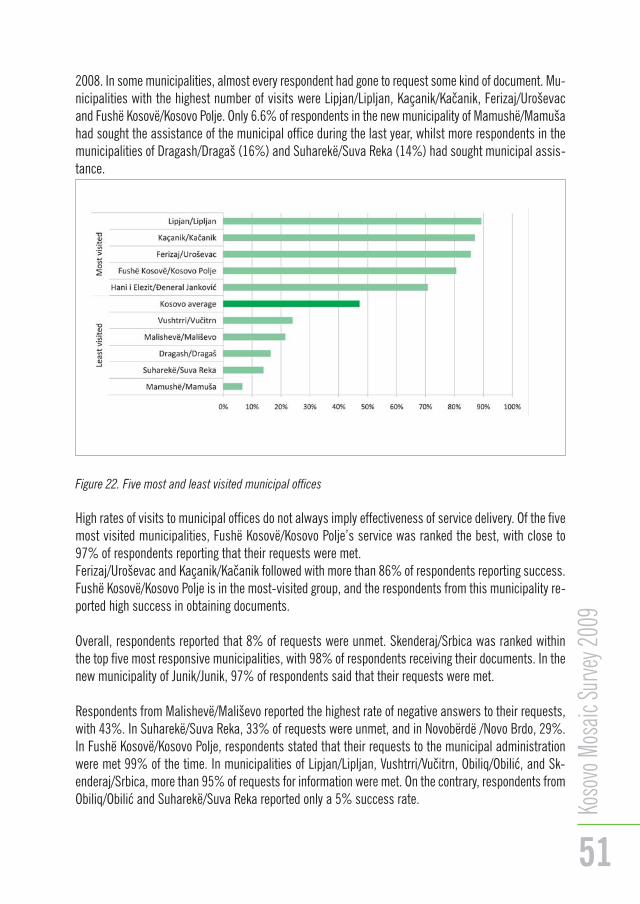
2008. In some municipalities, almost every respondent had gone to request some kind of document. Mu-nicipalities with the highest number of visits were Lipjan/Lipljan, Kaçanik/Kačanik, Ferizaj/Uroševacand Fushë Kosovë/Kosovo Polje. Only 6.6% of respondents in the new municipality of Mamushë/Mamušahad sought the assistance of the municipal office during the last year, whilst more respondents in themunicipalities of Dragash/Dragaš (16%) and Suharekë/Suva Reka (14%) had sought municipal assis-tance.
Figure 22. Five most and least visited municipal offices
High rates of visits to municipal offices do not always imply effectiveness of service delivery. Of the fivemost visited municipalities, Fushë Kosovë/Kosovo Polje’s service was ranked the best, with close to97% of respondents reporting that their requests were met. Ferizaj/Uroševac and Kaçanik/Kačanik followed with more than 86% of respondents reporting success.Fushë Kosovë/Kosovo Polje is in the most-visited group, and the respondents from this municipality re-ported high success in obtaining documents.
Overall, respondents reported that 8% of requests were unmet. Skenderaj/Srbica was ranked withinthe top five most responsive municipalities, with 98% of respondents receiving their documents. In thenew municipality of Junik/Junik, 97% of respondents said that their requests were met.
Respondents from Malishevë/Mališevo reported the highest rate of negative answers to their requests,with 43%. In Suharekë/Suva Reka, 33% of requests were unmet, and in Novobërdë /Novo Brdo, 29%.In Fushë Kosovë/Kosovo Polje, respondents stated that their requests to the municipal administrationwere met 99% of the time. In municipalities of Lipjan/Lipljan, Vushtrri/Vučitrn, Obiliq/Obilić, and Sk-enderaj/Srbica, more than 95% of requests for information were met. On the contrary, respondents fromObiliq/Obilić and Suharekë/Suva Reka reported only a 5% success rate.
51
Koso
vo M
osaic
Surve
y 200
9

52
Publi
c Serv
ices a
nd Lo
cal A
uthori
ties i
n Foc
us
Figure 23. Top and bottom five municipalities regarding success of requests for information or documents froma municipal office
When respondents were asked if they knew where to address their problems within the municipal ad-ministration, only a fifth of surveyed respondents said they did not know who to address. One fifth saidthat they were confident as to where to address their problems, and a same proportion of respondentsdeclared that they “somewhat” knew where to address their problems in the municipal administration.Novobërdë/Novo Brdo respondents most often said they were well informed (93%), followed by Sk-enderaj/Srbica with 84%.
Seven out of ten respondents from Podujevë/Podujevo and Gllogovc/Glogovac reported knowing whichdepartments to address. However, in Shtërpcë/Štrpce, half of the respondents said that they did notknow. Four out of ten Suharekë/Suva Reka respondents, and more than a third of the respondents fromKlinë/Klina, Vushtrri/Vučitrn and Mitrovicë/Mitrovica, declared the same lack of information.
Figure 24. Knowing where to go for help

A substantial number of all respondents (37%) said that they did not have sufficient information abouttheir municipality’s activities. In Mamushë/Mamuša, 67% of respondents did not believe they were in-formed. The Kosovo Serb community had the highest percentage both of respondents who felt very in-formed (7%, compared to 4 or 5% for the other groups) and of those who felt they were not informedat all (35%, compared to 18 or 20% for the other groups).
Figure 25. “How informed do you feel about the work that your municipality is doing?”
OPINIONS ON DECENTRALISATION Local government reforms, promoted by the Ahtisaari Plan, include the decentralisation of authorityfrom central governmental institutions to local, municipal governments. This decentralisation of authorityis intended to promote accountability, good governance, transparency and a much-needed increase inthe effectiveness of public services. Decentralisation is also expected to provide additional freedom tothe K-Serb community, by assuring a higher degree of control over their own affairs.
This process of shifting authority allows municipalities to manage their own budget and sources of rev-enue, as well as allowing municipalities to forms partnerships with other municipalities for mutual ben-efit. Additionally, decentralisation provides new competencies for municipalities, such as control overtheir primary and secondary schools, planning local economic development and managing public primaryhealth care. Majority K-Serb municipalities would have enhanced responsibilities, including authority overhospitals and the protection and promotion of cultural and religious affairs at the local level, amongothers.
When asked on various topics related to decentralisation, KMS 2009 results show that respondents re-ceive most of their information on topics of decentralisation from television and the radio. 76% of re-spondents said they learned about decentralisation through these two media sources, while newspapersaccounted for 15%. Public debates were a source of information for only 7% of respondents, while 2%of respondents responded with the internet as the primary source of information about decentralisation.
53
Koso
vo M
osaic
Surve
y 200
9

54
Publi
c Serv
ices a
nd Lo
cal A
uthori
ties i
n Foc
us
Figure 26. Sources for information on decentralisation
When asked on the concepts they associate with decentralisation, more than half of respondents (52%)related decentralisation to the creation of new municipalities. One in ten respondents considered decen-tralisation to be a requirement of the Ahtisaari Plan. Of the remainder, 10% believed that decentralisationwas supposed to improve public services, 9% believed it would result in expanded competencies for localgovernments, and 8% thought it is intended to integrate the Kosovo Serb minority. Very few respondentsbelieved it was a requirement for European integration, and even fewer respondents saw it as an obli-gation that originated from the Constitution of Kosovo.When asked to identify the group that would benefit most from decentralisation, 43% of respondents de-clared that ‘ethnic groups’ would benefit most, although only approximately 1% of respondents specif-ically identified Serbs as the beneficiaries of decentralisation. Another 40% said that all of Kosovo’scitizens would benefit from decentralisation, whereas government officials were identified by 11% of re-spondents as the group to gain.
Figure 27. Opinions on who will benefit from decentralisation
When examining respondents’ answers on the groups to benefit from decentralisation by their ethnicity,some differences can be seen. For example, the majority (56%) of other minority respondents believe

55
Koso
vo M
osaic
Surve
y 200
9
that decentralisation will benefit all of Kosovo’s citizens, in contrast to fewer than 40% of K-Albaniansand K-Serbs who answered the same. Some 45% of K-Albanian respondents considered ‘ethnic groups’would be the beneficiaries of decentralisation, in contrast to 32% of K-Serbs. Also 10% of K-Albanianand 8% of K-Serb respondents identified government officials as the group to benefit from decentrali-sation, which reflects a level of misunderstanding and mistrust on how the process of decentralisationis currently being handled.
Figure 28. Opinions on who will benefit from decentralisation by ethnic group
CHAPTER SUMMARY AND LESSONS LEARNEDSince 2006, when the last KMS survey was administered, efforts to create a sustainable and effectivesystem of local governance and assure local self-governance for minority communities has increasedin pace. Local government reforms, including the shift of authority and responsibility from central gov-ernment to local, municipal governments was expected to have a lasting impact on the efficiency andtransparency of local government performance. KMS 2009 intended to measure respondents’ attitudestowards their local administrations, on the assumption that their attitudes would reflect the changes inthe organisation of local government and their additional responsibilities.
Results show that Kosovo citizens remain active when it comes to making their voices heard, althoughthe modes chosen to do this continue to differ somewhat between communities. Importantly, respondentsacknowledge that attending protests on the street is not the most effective way of affecting governmentalpolicy, but a large number of respondents still report having attended such public demonstrations of dis-satisfaction at least once.
Media continues to lead as the mode of choice when it comes to influencing governmental policies,while town hall meetings are not deemed to be very effective by the respondents. This is further demon-strated by results indicating a minimal number of respondents having attended town hall meetings inthe past. It is worth noting, however, that respondents considered their local governments as open to cit-izen participation, while also maintaining that municipal representatives do not consider the opinionsof citizens when making decisions. This discrepancy is important to emphasise as mixed messagestend to frustrate respondents and directly influences satisfaction levels with the local government.

Kosovo citizens continue to show mixed levels of satisfaction with their local governments, although animprovement in satisfaction levels is noted. It is believed that due to increased spending on local infra-structure developments, new school buildings, and educational investments, Kosovo’s citizens are show-ing an improved level of content with their local government. Although satisfaction levels are higherthan in 2006, a lack of corruption measures continues to be among the main concerns for Kosovo citi-zens. In order to improve the rapport with their constituents and increase their trustworthiness, it iscrucial for local government officials to promptly address this concern.

57
Koso
vo M
osaic
Surve
y 200
9
CHAPTER IV


59
Koso
vo M
osaic
Surve
y 200
9
59
Koso
vo M
osaic
Surve
y 200
9
EMPLOYMENT, FARMING AND ENTREPRENEURSHIPKMS 2009 respondents pointed to unemployment and the lack of economic growth as the two leadingchallenges to Kosovo’s development. This chapter explores the household economy relative to employ-ment, land ownership and entrepreneurship.
EMPLOYMENT Unemployment continues to be pervasive in Kosovo. Only 48% of respondents said they were employed.Kosovo Albanian and Kosovo Serb respondents reported lower employment rates than Kosovo-Other re-spondents. Male respondents reported higher employment rates than female respondents in both urbanand rural areas. Of male respondents, 58% were employed, while 42% of female respondents wereemployed.
All K-Albanian K- Serb Other ethnicities Male Female Rural Urbanrespondents
Working 48% 48% 49% 62% 57% 40% 46% 51%Unemployed 28% 29% 19% 26% 18% 37% 32% 26%Student 16% 16% 11% 8% 15% 16% 12% 15%Retired 6% 5% 17% 3% 8% 5% 8% 5%Disabled 1% 1% 2% 1% 1% 1% 1% 1%Other 1% 1% 2% 0% 1% 1% 1% 1%
Table 17. Respondents’ employment status
The mean age of working male respondents was 38 years, and that of females was 37 years. The meanage for both female and male students was 22 years.
Average Male Female Working 38 38 37Unemployed 37 37 38Student 22 22 22Retired 64 65 63Disabled 47 47 46Other 44 44 43
Table 18. Employment by mean age

60
Publi
c Serv
ices a
nd Lo
cal A
uthori
ties i
n Foc
us
Education LevelAll
respondents K-Albanian K-Serb
Other minorities
Male Female
When asked on their education levels, over half of the respondents (62%) said they had completed sec-ondary education, and 11% had completed higher education, an increase from KMS 2006. Kosovo Al-banians and Kosovo Serbs remain similar in secondary and higher education levels (81% and 82%,respectively). Most of the individuals who do not have education are females (70%), while less than onethird are males (30%). When looking at the population with a higher education, the mean age for maleswithin this education level is 36 years, while the mean age of females is 34.Male survey respondents reported higher education levels than female respondents. Education levels aresummarised in the table below.
No formal education 0% 0% 0% 1% 0% 1%Elementary 4% 4% 4% 10% 3% 4%Primary 19% 19% 17% 18% 13% 24%Secondary 62% 61% 72% 60% 65% 59%Higher 15% 16% 7% 11% 19% 12%
Table 19. Respondents’ education levels
Age and education levels also appear to be related. For example, the small number (less than 0.5%) ofrespondents with no formal education were considerably older—their average age was 62, comparedto an average age of 38 for the rest of the respondents.
Average Male FemaleNo formal education 59 62 58Elementary 50 53 49Primary 44 48 42Secondary 34 35 33Higher 35 36 34
Table 20. Education by mean age
Education levels also varied among municipalities. Respondents in Pejë/Peć, Prizren/Prizren, Junik/Junik,Zveçan/Zvečan and Istog/Istok had higher levels of education than other municipalities. The percentageof respondents in Prishtinë/Priština, Podujevë/Podujevo, Deçan/Dečani, Viti/Vitina, Lipjan/Lipljan andFushë Kosovë/Kosovo Polje without formal education was higher than in other municipalities.
Respondents’ levels of education correlated positively with their employment levels - those with moreeducation were more likely to be employed. About 67% of respondents with higher education said theywere employed, compared to only 14% of those with no formal education.
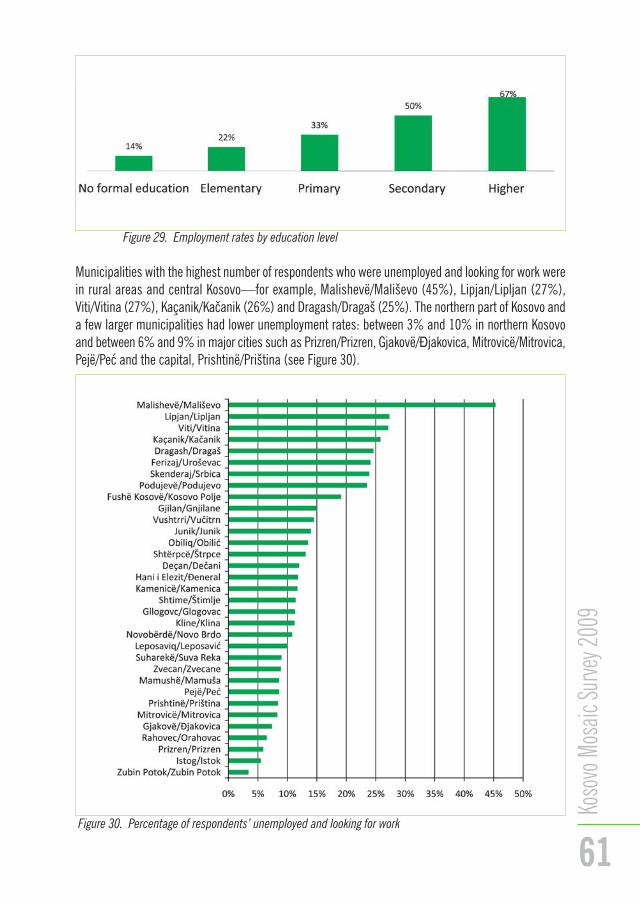
61
Koso
vo M
osaic
Surve
y 200
9
Figure 29. Employment rates by education level
Municipalities with the highest number of respondents who were unemployed and looking for work werein rural areas and central Kosovo—for example, Malishevë/Mališevo (45%), Lipjan/Lipljan (27%),Viti/Vitina (27%), Kaçanik/Kačanik (26%) and Dragash/Dragaš (25%). The northern part of Kosovo anda few larger municipalities had lower unemployment rates: between 3% and 10% in northern Kosovoand between 6% and 9% in major cities such as Prizren/Prizren, Gjakovë/Đjakovica, Mitrovicë/Mitrovica,Pejë/Peć and the capital, Prishtinë/Priština (see Figure 30).
Figure 30. Percentage of respondents’ unemployed and looking for work

LAND OWNERSHIP AND FARMINGTwo other factors that influence household economic conditions in Kosovo are the possession of farmlandand of a private business. While farming has been a tradition in rural and semi-rural areas of Kosovo,it was often abandoned in the post-conflict period. This was initially due to security issues, as landmines left over from the conflict prevented people from farming. Once the land was cleared of mines,high costs of and the unavailability of agricultural machines, seeds and fertilisers became a new im-pediment to agricultural development.
Of the 1.1 million hectares of land in Kosovo, 53% is cultivable38. This land is largely owned by residentsof rural areas. 67% of rural and 47% of urban respondents said they owned land.
Land ownership has not changed significantly since 2006; rural households in poorer municipalitiescontinue to own more land than those in urban areas. This suggests that land ownership does not suf-ficiently reduce poverty rates, and rather, it is the agricultural activity conducted on the land that affectsthe decline of poverty and improvement of livelihoods.
BUSINESS OWNERSHIPIt is generally assumed that if one owns a business, one is less likely to be poor. In 2009, 19% of re-spondents said they owned a private business, compared to 15% in 2006. In a number of municipalities,the survey results indicated that a very small number of residents owned a business. Such municipalitiesare located mainly in the central and southern regions of Kosovo, including Skenderaj/Srbica,Dragash/Dragaš, Junik/Junik, Novobërdë/Novo Brdo and Hani i Elezit/ eneral Janković. Business own-ership rates in these municipalities ranged from 2% to 6%. Residents in Klinë/Klina, Kaçanik/Kačanik,Zveçan/Zvečan, Ferizaj/Uroševac and Mitrovicë/Mitrovica were most frequently to be self-employed,with the majority of them owning a business. In Klinë/Klina, every second respondent owned a busi-ness—a major increase since 2006, when only 8% of respondents ran their own businesses (see Figure31).
Compared to 2006, much has changed in municipalities traditionally known for their flourishing small-business sector. Business ownership has declined by 7% in Prizren/Prizren during the last three years,but it has increased by 10% in Gjakovë/Đjakovica, and by 13% in Pejë/Peć.
62
Publi
c Serv
ices a
nd Lo
cal A
uthori
ties i
n Foc
us
38 Ministry of Trade and Industry, Kosovo at a Glance, Prishtina, June, 2008, 4.

Figure 31. Ownership of private business by municipality
CHAPTER SUMMARY AND LESSONS LEARNEDKosovo’s accelerated economic growth is expected to boost the establishment of new businesses as wellas the creation of new jobs. While governmental policies that make use of increased state and municipalbudgets to improve the economic environment for Kosovo citizens tend to be laborious and be imple-mented over extended periods of time, some positive indicators are noticeable.
While still low, some 20% more Kosovo citizens reported their own businesses today than in 2006. Thispositive trend is a strong indicator of a continued improvement of the business and economic environ-ment in Kosovo. Given that small businesses and family-owned businesses are among the biggest em-ployers in Kosovo, this trend provides some optimism for future job availability.
Employment remains a main concern among Kosovo’s citizens and KMS 2009 shows that only 1 out of2 respondents is currently employed, with marked inequality in employment across regions of Kosovo.
63
Koso
vo M
osaic
Surve
y 200
9

Municipalities with the highest number of unemployed respondents and those looking for work were inrural areas and central Kosovo, with a significantly lower proportion of respondents reporting being un-employed in regional centres and K-Serb municipalities. The trend is clear that divisions remain and dis-parities are significant across municipalities and regions. It is very important that local and centralgovernments make genuine effort in sharing Kosovo’s economic development with all of its regions.KMS 2009 results show that in addition to very low employment, Kosovo’s central regions remain in theworst shape when compared to other regions, including being the most pessimistic for their future eco-nomic well-being.
CONCLUSIONSFrom tripling its GDP and doubling its budget in 6 years, to implementing extensive local governmentalreforms, the past few years were marked with significant developments for Kosovo. The role of KMS2009 was to examine whether this progress has translated into improved well-being for Kosovo’s citizensand whether it is reflected by respondents’ attitudes and perceptions.
When analysing the extensive information provided in KMS 2009, a complex image becomes apparent.Kosovo’s citizens appear to be more content with their current financial well-being than they were in thepast, and yet, they remain hopeful for future financial gain. This image also shows that Kosovo’s largeyoung population is leading the way in Kosovo’s embrace of technology, which can be attributed to a man-ifestation of an improved economic environment. Increased reported business ownership is another sig-nificant sign of an expanding economy.
Increased budgets and higher expenditures seem to be improving the quality of life of Kosovo’s citizens,resulting in significantly higher access to basic services, as reported in this survey. Kosovo citizens con-tinue to be uncertain at times of who is in charge for various services in Kosovo, leading to frustrationand dissatisfaction. Such frustration influences their assessment of the work of local government. Evenwith an improved level of satisfaction, Kosovo’s citizens remain very critical of their local governments,demanding that their voice be heard and did not express hesitation in taking to the streets when dis-satisfied.
Unemployment continues to lead as the main concern for Kosovo’s citizens, but reflecting the improvedeconomic environment, it seems that slightly less people consider it to be the most important issue. How-ever, optimism still reigns in Kosovo, with most Kosovo citizens believing in further improvements, ex-cluding K-Serbs, who are still troubled by their lack of security and freedom of movement.While KMS 2009 portrays an improving picture of Kosovo citizen’s well-being, significant regional dis-parities remain. Kosovo’s central municipalities continuously fare worse than their neighbouring munic-ipalities, and special attention must be paid to their needs.
64
Publi
c Serv
ices a
nd Lo
cal A
uthori
ties i
n Foc
us

ANNEX1. SUMMARY OF MAIN RESULTS

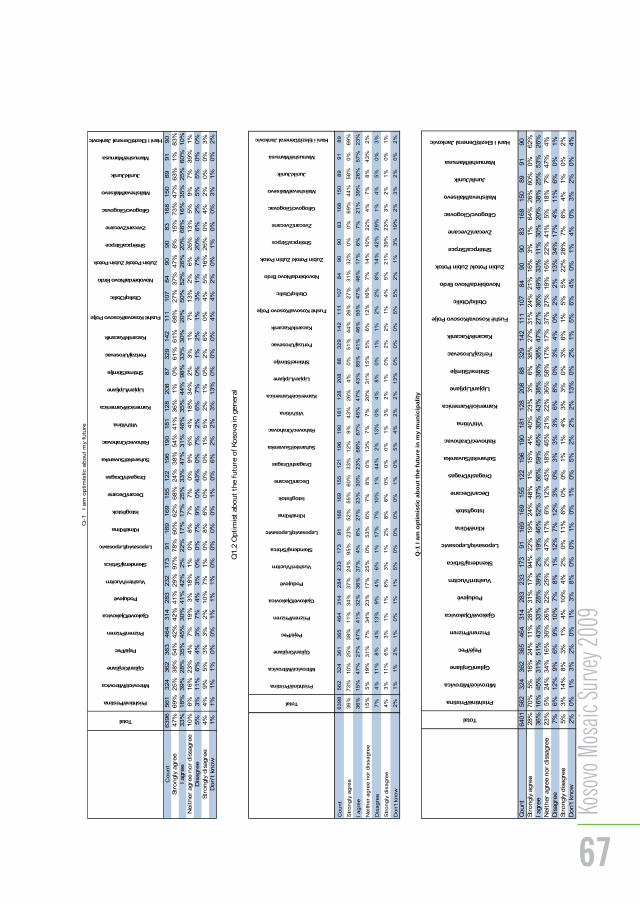
67
Koso
vo M
osaic
Surve
y 200
9
Total
Prishtinë/Pristina
Mitrovicë/Mitrovica
Gjilan/Gnjilane
Pejë/Pec
Prizren/Prizren
Gjakovë/Djakovica
Podujevë
Vushtrri/Vucitrn
Skenderaj/Srbica
Leposaviq/Leposavic
Klinë/Klina
Istog/Istok
Decan/Decane
Dragash/Dragas
Suharekë/Suvareka
Rahovec/Orahovac
Viti/Vitina
Kamenicë/Kamenica
Lipjan/Lipljane
Shtime/Stimlje
Ferizaj/Urosevac
Kacanik/Kacanik
Fushë Kosova/Kosovo Polje
Obiliq/Obilic
Novobërda/Novo Brdo
Zubin Potok/ Zubin Potok
Shtërpca/Strpce
Zvecan/Zvecane
Gllogovc/Glogovac
Malisheva/Malisevo
Junik/Junik
Mamushë/Mamusa
Hani iElezit/Deneral Jankovic
Count
6396
561
324
362
363
464
314
283
232
173
91
169
169
155
122
196
190
181
128
208
87
329
142
111
107
84
90
90
83
168
150
89
91
90
Str
ongly
agre
e47%
69%
25%
38%
54%
42%
42%
41%
29%
97%
78%
60%
62%
68%
24%
38%
54%
41%
36%
1%
0%
61%
61%
69%
27%
37%
47%
8%
15%
73%
47%
63%
1%
83%
I agre
e33%
18%
39%
28%
35%
45%
30%
41%
42%
2%
22%
17%
17%
25%
33%
47%
31%
46%
35%
44%
98%
33%
30%
20%
50%
52%
26%
20%
66%
16%
35%
25%
60%
10%
Neit
her
agre
e n
or
dis
sagre
e10%
6%
16%
23%
4%
7%
19%
3%
18%
1%
0%
8%
7%
7%
0%
9%
6%
4%
18%
34%
2%
3%
1%
7%
13%
2%
6%
26%
13%
5%
9%
7%
39%
1%
Dis
agre
e5%
3%
11%
6%
4%
3%
7%
4%
3%
0%
0%
7%
9%
0%
43%
0%
7%
2%
6%
7%
0%
1%
2%
1%
3%
1%
7%
20%
6%
2%
5%
5%
0%
0%
Str
ongly
dis
agre
e4%
4%
9%
5%
3%
3%
2%
10%
7%
1%
0%
8%
6%
0%
0%
0%
1%
5%
2%
1%
0%
2%
6%
0%
4%
5%
16%
26%
0%
4%
2%
0%
0%
3%
Don't
know
1%
1%
1%
1%
0%
0%
1%
1%
1%
0%
0%
0%
0%
1%
0%
6%
2%
2%
3%
13%
0%
0%
0%
4%
4%
2%
0%
1%
0%
0%
3%
1%
0%
2%
Q-1
I a
m o
ptim
istic
about
my
futu
re
Total
Prishtinë/Pristina
Mitrovicë/Mitrovica
Gjilan/Gnjilane
Pejë/Pec
Prizren/Prizren
Gjakovë/Djakovica
Podujevë
Vushtrri/Vucitrn
Skenderaj/Srbica
Leposaviq/Leposavic
Klinë/Klina
Istog/Istok
Decan/Decane
Dragash/Dragas
Suharekë/Suvareka
Rahovec/Orahovac
Viti/Vitina
Kamenicë/Kamenica
Lipjan/Lipljane
Shtime/Stimlje
Ferizaj/Urosevac
Kacanik/Kacanik
Fushë Kosova/Kosovo Polje
Obiliq/Obilic
Novobërda/Novo Brdo
Zubin Potok/ Zubin Potok
Shtërpca/Strpce
Zvecan/Zvecane
Gllogovc/Glogovac
Malisheva/Malisevo
Junik/Junik
Mamushë/Mamusa
Hani i Elezit/Deneral Jankovic
Cou
nt
639
856
23
24
36
13
65
46
431
42
84
23
31
73
91
16
81
69
15
51
21
19
619
01
81
12
82
08
88
32
91
42
11
11
07
84
90
90
83
168
15
08
991
89
Str
on
gly
ag
ree
36
%7
3%
10
%2
5%
38
%1
1%
34
%37
%2
4%
95
%2
3%
52
%55
%6
0%
33
%1
2%
9%
43
%2
6%
4%
0%
51
%44
%2
6%
27
%31
%3
2%
0%
0%
69
%44
%5
8%
0%
69%
I a
gre
e36
%1
5%
47
%2
7%
47
%4
1%
32
%36
%3
7%
4%
6%
27
%23
%3
0%
23
%6
8%
67
%45
%4
7%
43
%8
5%
41
%46
%5
5%
47
%46
%1
7%
6%
7%
21
%39
%2
6%
57
%2
3%
Neith
er
ag
ree
nor
dis
sa
gre
e15
%5
%19
%3
1%
7%
34%
23
%17
%2
5%
0%
53%
6%
7%
8%
0%
13%
7%
7%
20%
31
%1
5%
5%
6%
12%
16
%7
%1
4%
10
%2
2%
4%
7%
8%
43
%2
%
Dis
agre
e7
%4
%11
%8
%4
%1
3%
9%
4%
6%
1%
17%
7%
10
%1
%4
4%
2%
13
%0%
4%
8%
0%
1%
1%
2%
2%
8%
14
%42
%2
9%
1%
4%
5%
0%
3%
Str
on
gly
dis
ag
ree
4%
3%
11
%6
%3
%1
%1
%6%
3%
1%
2%
8%
6%
0%
0%
0%
1%
3%
2%
1%
0%
2%
2%
1%
4%
5%
21
%39
%2
3%
3%
2%
1%
0%
1%
Don
't k
no
w2
%1
%1%
2%
1%
0%
1%
1%
5%
0%
0%
0%
0%
1%
0%
5%
4%
2%
2%
13
%0
%0
%0%
5%
5%
2%
1%
3%
19%
2%
3%
2%
0%
2%
Q1.2
Opti
mis
t about
the futu
re o
fKoso
va in g
enera
l
Total
Prishtinë/Pristina
Mitrovicë/Mitrovica
Gjilan/Gnjilane
Pejë/Pec
Prizren/Prizren
Gjakovë/Djakovica
Podujevë
Vushtrri/Vucitrn
Skenderaj/Srbica
Leposaviq/Leposavic
Klinë/Klina
Istog/Istok
Decan/Decane
Dragash/Dragas
Suharekë/Suvareka
Rahovec/Orahovac
Viti/Vitina
Kamenicë/Kamenica
Lipjan/Lipljane
Shtime/Stimlje
Ferizaj/Urosevac
Kacanik/Kacanik
Fushë Kosova/KosovoPolje
Obiliq/Obilic
Novobërda/Novo Brdo
Zubin Potok/Zubin Potok
Shtërpca/Strpce
Zvecan/Zvecane
Gllogovc/Glogovac
Malisheva/Malisevo
Junik/Junik
Mamushë/Mamusa
Hani i Elezit/Deneral Jankovic
Count
6401
562
324
362
365
464
314
283
233
173
91
169
169
155
122
196
190
181
128
208
88
329
142
111
107
84
90
90
83
168
150
89
91
90
Str
ongly
agre
e28%
70%
5%
16%
24%
11%
28%
31%
17%
94%
22%
19%
24%
48%
1%
15%
4%
40%
23%
3%
6%
38%
27%
31%
24%
21%
16%
3%
1%
64%
26%
60%
0%
62%
I agre
e36%
16%
45%
31%
51%
43%
33%
28%
39%
2%
19%
46%
52%
37%
56%
59%
45%
30%
43%
38%
36%
38%
47%
27%
36%
49%
33%
11%
30%
20%
38%
25%
53%
26%
Neit
her
agre
e n
or
dis
sagre
e23%
5%
24%
34%
16%
36%
26%
22%
25%
2%
47%
17%
6%
12%
43%
18%
45%
21%
22%
36%
58%
17%
17%
37%
27%
19%
16%
22%
41%
5%
18%
7%
47%
4%
Dis
agre
e7%
6%
12%
9%
6%
9%
10%
7%
8%
1%
12%
7%
12%
3%
0%
3%
3%
3%
6%
8%
0%
3%
4%
0%
2%
2%
13%
34%
17%
4%
11%
6%
0%
1%
Str
ongly
dis
agre
e5%
3%
14%
8%
3%
1%
4%
10%
4%
2%
0%
11%
6%
0%
0%
1%
1%
4%
3%
3%
0%
3%
6%
1%
5%
5%
22%
28%
7%
6%
4%
1%
0%
2%
Don't
know
2%
0%
1%
3%
2%
0%
1%
3%
8%
0%
0%
1%
0%
1%
0%
5%
2%
2%
2%
13%
0%
2%
1%
5%
6%
4%
0%
1%
4%
0%
3%
2%
0%
4%
Q-1
I am
op
tim
isti
c a
bo
ut
the f
utu
re i
n m
y m
un
icip
ali
ty

68
Publi
c Serv
ices a
nd Lo
cal A
uthori
ties i
n Foc
us
Total
Prishtinë/Pristina
Mitrovicë/Mitrovica
Gjilan/Gnjilane
Pejë/Pec
Prizren/Prizren
Gjakovë/Djakovica
Podujevë
Vushtrri/Vucitrn
Skenderaj/Srbica
Leposaviq/Leposavic
Klinë/Klina
Istog/Istok
Decan/Decane
Dragash/Dragas
Suharekë/Suvareka
Rahovec/Orahovac
Viti/Vitina
Kamenicë/Kamenica
Lipjan/Lipljane
Shtime/Stimlje
Ferizaj/Urosevac
Kacanik/Kacanik
Fushë Kosova/KosovoPolje
Obiliq/Obilic
Novobërda/Novo Brdo
Zubin Potok/ ZubinPotok
Shtërpca/Strpce
Zvecan/Zvecane
Gllogovc/Glogovac
Malisheva/Malisevo
Junik/Junik
Mamushë/Mamusa
Hani i Elezit/DeneralJankovic
Count
63
89
562
32
43
62
358
46
43
14
284
23
31
73
91
16
91
69
155
12
21
96
190
18
11
28
207
88
329
138
11
11
07
84
90
90
83
16
71
50
89
91
90
Lack
ofeco
nom
ic g
row
th22
%28%
29
%2
0%
25%
28
%3
3%
37%
16
%2
0%
0%
41
%3
1%
34%
0%
3%
2%
24
%2
9%
40%
2%
15%
9%
10
%3
5%
24%
27
%7%
1%
13
%6%
12%
1%
16%
Inadequate
infr
ast
ruct
ure
2%
2%
3%
3%
3%
0%
5%
2%
2%
0%
1%
4%
4%
3%
0%
1%
1%
0%
2%
1%
1%
6%
4%
1%
0%
4%
0%
0%
0%
1%
1%
3%
0%
19%
Lack
ofgenera
l or
pers
onal se
curi
ty2
%1
%4%
1%
1%
0%
4%
1%
0%
0%
6%
1%
3%
1%
0%
1%
4%
0%
2%
1%
1%
2%
1%
0%
0%
7%
22
%3%
23%
0%
0%
0%
0%
0%
Lim
ited fre
edom
of m
ovem
ent
3%
2%
6%
5%
2%
0%
2%
0%
0%
1%
1%
0%
4%
0%
0%
0%
4%
0%
4%
1%
0%
0%
1%
1%
0%
5%
12
%2
3%
49%
1%
1%
0%
1%
0%
Unem
plo
ym
ent
44
%52%
31
%2
7%
36%
33
%3
8%
49%
45
%6
2%
26%
34
%2
0%
37%
25
%5
7%
69%
59
%2
9%
30%
94
%4
7%
49%
84
%4
7%
29%
20
%1
0%
10%
65
%71
%6
3%
91
%5
0%
Cri
me
3%
1%
6%
1%
3%
1%
2%
3%
1%
0%
9%
1%
3%
3%
0%
4%
3%
3%
9%
5%
0%
2%
6%
0%
2%
0%
8%
8%
0%
0%
4%
0%
6%
1%
Corr
upti
on
7%
3%
4%
4%
6%
20
%5%
3%
10
%2%
24%
0%
10%
5%
32
%1
0%
2%
3%
17%
13%
0%
8%
5%
1%
11%
7%
1%
2%
1%
3%
8%
2%
0%
2%
Povert
y/L
ow
sta
ndard
oflivin
g7
%5
%2%
33%
7%
1%
5%
1%
3%
6%
7%
5%
12%
3%
43
%2%
5%
2%
5%
5%
1%
2%
3%
3%
3%
10%
3%
14%
11%
7%
0%
9%
1%
7%
Inte
r-eth
nic
rela
tions
1%
1%
0%
1%
1%
0%
0%
0%
1%
1%
11%
0%
4%
0%
0%
0%
0%
0%
1%
0%
0%
0%
1%
0%
0%
0%
6%
3%
1%
0%
0%
0%
0%
0%
Ele
ctri
city
7%
2%
12
%2%
10%
10
%5%
3%
18
%3%
14%
8%
8%
9%
0%
4%
10%
3%
2%
0%
0%
16%
17%
1%
0%
7%
0%
7%
0%
5%
7%
10%
0%
0%
Poor
state
of w
ate
rsu
pply
1%
0%
0%
0%
1%
0%
1%
0%
1%
0%
0%
2%
1%
0%
0%
2%
1%
1%
0%
0%
0%
1%
0%
0%
0%
4%
0%
0%
1%
2%
1%
0%
0%
0%
Poor
state
of heati
ng s
upply
0%
0%
1%
0%
0%
0%
0%
0%
0%
0%
0%
0%
1%
0%
0%
0%
0%
0%
0%
0%
0%
0%
0%
0%
0%
0%
0%
0%
0%
1%
0%
0%
0%
0%
Envir
onm
enta
l polluti
on
1%
1%
1%
0%
1%
5%
1%
1%
0%
3%
0%
2%
0%
4%
0%
12%
0%
2%
0%
0%
0%
1%
1%
0%
0%
1%
0%
0%
1%
2%
1%
0%
0%
1%
Poor
healt
hca
rese
rvic
e1
%0
%1%
0%
1%
0%
0%
0%
0%
4%
1%
1%
0%
0%
0%
0%
0%
1%
0%
0%
0%
0%
1%
0%
2%
2%
0%
1%
0%
0%
0%
0%
0%
1%
Poor
public
transp
ort
serv
ices
0%
0%
0%
0%
0%
0%
0%
0%
0%
0%
0%
0%
0%
0%
0%
0%
0%
1%
0%
0%
0%
0%
0%
0%
0%
0%
0%
0%
0%
0%
1%
0%
0%
0%
Lack
of/
underd
evelo
ped p
ost
serv
ice
0%
0%
0%
0%
0%
0%
0%
0%
0%
0%
0%
0%
0%
0%
0%
0%
0%
0%
0%
0%
0%
0%
0%
0%
0%
0%
0%
0%
0%
0%
0%
0%
0%
0%
Poorl
y funct
ionin
g r
ubbis
h c
ollect
ion s
erv
ice
0%
0%
0%
0%
0%
0%
0%
0%
0%
0%
0%
0%
0%
0%
0%
1%
0%
0%
0%
0%
0%
0%
0%
0%
0%
0%
0%
0%
0%
0%
0%
0%
0%
2%
Lack
offu
nct
ionin
g a
dm
inis
trati
on
0%
0%
0%
0%
1%
0%
0%
1%
0%
0%
0%
0%
0%
0%
0%
0%
0%
0%
0%
0%
0%
1%
1%
0%
1%
0%
0%
2%
0%
0%
0%
0%
0%
0%
Poor
pri
mary
and s
eco
ndary
educa
tion
0%
0%
0%
0%
0%
0%
0%
0%
0%
0%
0%
0%
0%
0%
0%
0%
0%
1%
0%
0%
0%
0%
0%
0%
0%
0%
0%
0%
1%
0%
0%
0%
0%
0%
Ille
gal co
nst
ruct
ion
0%
0%
0%
0%
0%
0%
0%
0%
0%
0%
0%
0%
0%
0%
0%
0%
0%
0%
0%
0%
0%
0%
0%
0%
0%
0%
0%
0%
0%
0%
0%
0%
0%
0%
Legal fr
am
ew
ork
ofKoso
vo
0%
0%
0%
0%
0%
0%
0%
0%
0%
0%
0%
1%
1%
0%
0%
0%
0%
0%
0%
0%
0%
0%
0%
0%
0%
0%
0%
4%
0%
0%
0%
0%
0%
0%
Poor
Govern
ance
0%
1%
0%
0%
0%
0%
0%
0%
0%
0%
0%
0%
0%
1%
0%
4%
0%
0%
0%
0%
0%
0%
0%
0%
0%
1%
0%
3%
0%
0%
0%
0%
0%
0%
Koso
vo s
tatu
s0
%1
%0%
0%
0%
0%
0%
0%
0%
0%
0%
0%
0%
0%
0%
0%
0%
0%
0%
0%
0%
0%
0%
0%
0%
0%
0%
6%
0%
0%
0%
0%
0%
0%
Keepin
g t
he p
eace
0%
0%
0%
0%
0%
0%
0%
0%
0%
0%
0%
0%
0%
0%
0%
0%
0%
0%
0%
0%
0%
0%
0%
0%
0%
0%
1%
3%
0%
0%
0%
0%
0%
0%
Rese
ttling r
efu
gees/
dis
pla
ced
pers
ons
0%
0%
0%
0%
0%
0%
0%
0%
0%
0%
0%
0%
0%
0%
0%
0%
0%
0%
0%
0%
0%
0%
0%
0%
0%
0%
0%
1%
0%
0%
0%
0%
0%
0%
Air
polluti
on
0%
0%
0%
0%
0%
0%
0%
0%
0%
0%
0%
0%
0%
1%
0%
0%
0%
0%
0%
0%
0%
0%
0%
0%
0%
0%
0%
0%
0%
0%
0%
0%
0%
1%
Oth
er
0%
0%
0%
1%
0%
0%
0%
0%
0%
0%
0%
0%
0%
0%
0%
0%
0%
0%
0%
0%
0%
0%
0%
0%
0%
0%
0%
0%
0%
0%
0%
0%
0%
0%
Refu
ses
0%
0%
0%
0%
0%
0%
0%
0%
0%
0%
0%
0%
0%
0%
0%
0%
0%
0%
0%
1%
0%
0%
0%
0%
0%
0%
0%
0%
0%
0%
0%
0%
0%
0%
Don't
know
0%
0%
0%
0%
0%
0%
0%
0%
0%
0%
0%
0%
0%
0%
0%
3%
0%
0%
0%
2%
0%
0%
1%
0%
0%
0%
0%
1%
0%
0%
0%
0%
0%
0%
Q-2
a.
And
wha
t is
cu
rre
ntly
the
mo
st im
po
rta
nt
pro
ble
m f
acin
g y
ou
r m
un
icip
alit
y?

69
Koso
vo M
osaic
Surve
y 200
9
Total
Prishtinë/Pristina
Mitrovicë/Mitrovica
Gjilan/Gnjilane
Pejë/Pec
Prizren/Prizren
Gjakovë/Djakovica
Podujevë
Vushtrri/Vucitrn
Skenderaj/Srbica
Leposaviq/Leposavic
Klinë/Klina
Istog/Istok
Decan/Decane
Dragash/Dragas
Suharekë/Suvareka
Rahovec/Orahovac
Viti/Vitina
Kamenicë/Kamenica
Lipjan/Lipljane
Shtime/Stimlje
Ferizaj/Urosevac
Kacanik/Kacanik
Fushë Kosova/Kosovo Polje
Obiliq/Obilic
Novobërda/Novo Brdo
Zubin Potok/ Zubin Potok
Shtërpca/Strpce
Zvecan/Zvecane
Gllogovc/Glogovac
Malisheva/Malisevo
Junik/Junik
Mamushë/Mamusa
Hani i Elezit/Deneral Jankovic
Count
6379
562
32
3362
35
946
4314
279
233
173
91
169
16
91
55
12
2195
190
181
128
207
88
328
13
6111
107
84
90
90
83
16
6150
89
91
90
Lack
of eco
nom
ic g
row
th9%
7%
4%
4%
10%
18%
5%
16
%6%
49%
1%
2%
8%
4%
0%
3%
1%
17%
4%
4%
0%
7%
8%
16%
7%
18%
2%
10%
0%
11%
7%
25
%0%
12%
Inadequate
infr
ast
ruct
ure
3%
3%
0%
3%
4%
0%
2%
8%
3%
1%
1%
6%
7%
3%
0%
1%
1%
2%
11%
4%
1%
4%
3%
1%
2%
2%
0%
2%
1%
5%
0%
7%
0%
9%
Lack
of genera
l or
pers
onalse
curi
ty2%
1%
3%
1%
0%
0%
0%
1%
1%
1%
1%
2%
1%
0%
0%
2%
1%
0%
10%
8%
2%
1%
4%
0%
0%
0%
16%
1%
2%
0%
0%
0%
0%
1%
Lim
ited fre
edom
of m
ovem
ent
2%
0%
2%
22
%3%
0%
0%
1%
1%
1%
1%
1%
2%
1%
0%
0%
1%
0%
6%
1%
0%
1%
1%
0%
0%
0%
1%
2%
18%
1%
1%
1%
0%
1%
Unem
plo
ym
ent
18%
20%
23%
19
%2
1%
14%
17%
27
%22%
21%
6%
24%
15%
5%
43%
9%
5%
20%
15%
31%
2%
17%
16%
11%
53
%27%
14%
12%
16%
17%
13%
12
%2%
14%
Cri
me
4%
2%
12%
3%
4%
1%
2%
8%
2%
0%
29%
4%
8%
2%
0%
4%
2%
2%
11%
14%
2%
1%
1%
0%
7%
4%
10%
2%
0%
2%
5%
3%
0%
0%
Corr
upti
on
18%
9%
14%
10
%1
2%
37%
24%
13
%8%
3%
12%
7%
13%
9%
24%
30
%63
%14%
26%
11%
18%
22%
15%
11%
12
%1%
7%
0%
2%
8%
19%
6%
95%
28%
Povert
y/L
ow
sta
ndard
oflivin
g16%
36%
3%
21
%1
1%
1%
19%
12
%5%
19%
10%
7%
16%
3%
0%
2%
18
%24%
16%
13%
74%
17%
11%
31%
18
%25%
26%
19%
19%
28%
9%
18
%3%
16%
Inte
r-eth
nic
rela
tions
2%
2%
3%
2%
3%
1%
2%
0%
0%
1%
4%
4%
4%
3%
0%
1%
0%
1%
2%
1%
0%
2%
2%
0%
0%
1%
6%
3%
2%
0%
1%
1%
0%
2%
Ele
ctri
city
14%
8%
24%
8%
21%
15%
19%
7%
30%
1%
21%
19%
15%
48%
1%
19
%1%
12%
0%
4%
0%
20%
28%
0%
2%
5%
3%
10%
5%
11%
35%
26
%0%
0%
Poor
state
of w
ate
rsu
pply
3%
0%
0%
2%
2%
1%
0%
1%
12%
0%
4%
17%
4%
1%
32%
2%
3%
2%
0%
0%
0%
1%
0%
5%
0%
1%
1%
2%
4%
5%
7%
0%
0%
1%
Poor
state
of heati
ng
supply
1%
0%
2%
1%
1%
0%
1%
0%
3%
0%
0%
1%
2%
3%
0%
0%
0%
1%
0%
0%
0%
0%
0%
1%
0%
0%
0%
0%
0%
0%
0%
0%
0%
0%
Envir
onm
enta
l polluti
on
3%
6%
2%
1%
4%
5%
4%
1%
3%
1%
0%
2%
1%
9%
0%
8%
0%
2%
0%
1%
0%
2%
3%
23%
0%
0%
0%
0%
7%
8%
0%
1%
0%
6%
Poor
healt
hca
rese
rvic
e1%
1%
0%
1%
1%
1%
1%
2%
1%
4%
0%
2%
0%
3%
0%
1%
0%
3%
0%
0%
0%
2%
1%
0%
0%
4%
0%
1%
5%
1%
1%
0%
0%
2%
Poor
public
transp
ort
serv
ices
0%
0%
0%
0%
0%
0%
0%
0%
0%
0%
0%
0%
0%
0%
0%
0%
0%
1%
0%
2%
0%
1%
0%
0%
0%
0%
1%
0%
2%
0%
0%
0%
0%
0%
Lack
of/
underd
evelo
ped p
ost
serv
ice
0%
0%
0%
0%
0%
0%
0%
0%
0%
0%
0%
0%
0%
0%
0%
1%
0%
0%
0%
0%
0%
0%
1%
0%
0%
0%
0%
1%
0%
0%
0%
0%
0%
0%
Poorl
y funct
ionin
g r
ubbis
hco
llect
ion
serv
ice
0%
0%
0%
0%
1%
0%
0%
1%
2%
0%
0%
1%
0%
1%
0%
0%
0%
0%
0%
0%
0%
0%
1%
0%
0%
0%
0%
2%
6%
1%
0%
0%
0%
1%
Lack
of fu
nct
ionin
g a
dm
inis
trati
on
1%
1%
1%
1%
0%
0%
0%
1%
1%
0%
0%
1%
0%
1%
0%
0%
0%
1%
0%
2%
0%
1%
3%
0%
0%
1%
0%
0%
0%
1%
0%
0%
0%
1%
Low
level of ta
xpaym
ent
0%
0%
0%
0%
0%
0%
0%
0%
0%
0%
0%
0%
0%
0%
0%
0%
0%
0%
0%
0%
0%
0%
0%
0%
0%
0%
0%
0%
0%
0%
0%
0%
0%
0%
Poor
pri
mary
and s
eco
ndary
educa
tion
0%
0%
0%
0%
0%
0%
2%
0%
0%
0%
0%
0%
0%
0%
0%
0%
0%
0%
0%
0%
0%
1%
0%
0%
0%
0%
0%
0%
4%
0%
0%
0%
0%
0%
Ille
gal co
nst
ruct
ion
0%
0%
0%
0%
0%
0%
0%
0%
0%
0%
0%
0%
0%
1%
0%
0%
0%
0%
0%
0%
0%
0%
1%
0%
0%
0%
2%
0%
0%
0%
0%
0%
0%
0%
Terr
itori
alre
configura
tion/N
ew
munic
ipal boundari
e0%
0%
0%
0%
0%
0%
0%
0%
0%
0%
0%
0%
0%
0%
0%
0%
0%
0%
0%
0%
0%
0%
0%
0%
0%
0%
0%
0%
0%
0%
0%
0%
0%
0%
Legal fr
am
ew
ork
of Koso
vo
0%
0%
0%
0%
0%
0%
0%
0%
0%
0%
0%
1%
1%
0%
0%
0%
1%
0%
0%
0%
0%
0%
0%
0%
0%
0%
0%
3%
0%
0%
0%
0%
0%
0%
Poor
Govern
ance
2%
0%
1%
1%
1%
4%
3%
1%
0%
0%
0%
0%
4%
1%
0%
16
%1%
0%
0%
0%
0%
0%
2%
0%
0%
0%
1%
6%
0%
0%
1%
0%
0%
0%
Perf
orm
ance
of politi
cal part
ies
0%
0%
0%
0%
1%
0%
1%
0%
0%
0%
0%
0%
0%
0%
0%
1%
0%
0%
0%
0%
0%
0%
0%
0%
0%
0%
0%
0%
0%
0%
1%
0%
0%
0%
Koso
vo s
tatu
s0%
1%
1%
0%
0%
1%
0%
0%
0%
0%
2%
0%
0%
0%
0%
0%
1%
0%
0%
0%
0%
0%
0%
0%
0%
0%
0%
6%
0%
0%
0%
0%
0%
0%
Keepin
g t
he p
eace
1%
1%
3%
1%
0%
0%
0%
0%
0%
0%
0%
0%
0%
1%
0%
0%
2%
0%
0%
0%
0%
0%
0%
0%
0%
7%
6%
9%
1%
0%
0%
0%
0%
0%
Rese
ttling r
efu
gees/
dis
pla
ced
pers
ons
1%
0%
3%
0%
0%
0%
0%
0%
0%
0%
8%
0%
0%
0%
0%
0%
2%
0%
0%
0%
0%
0%
0%
0%
0%
2%
4%
6%
1%
0%
0%
0%
0%
0%
Air
polluti
on
0%
0%
0%
0%
0%
0%
0%
0%
0%
0%
0%
0%
0%
3%
0%
1%
0%
0%
0%
0%
0%
0%
0%
1%
0%
1%
0%
0%
2%
0%
1%
0%
0%
4%
Refu
ses
0%
0%
0%
0%
0%
0%
0%
0%
0%
0%
0%
0%
0%
0%
0%
0%
0%
0%
0%
1%
0%
0%
0%
0%
0%
0%
0%
0%
0%
0%
0%
0%
0%
0%
Don't k
now
0%
0%
0%
0%
0%
0%
0%
0%
0%
0%
0%
0%
0%
0%
0%
3%
0%
0%
0%
2%
0%
0%
1%
0%
0%
0%
0%
2%
0%
1%
0%
0%
0%
1%
Q-2
b. A
nd w
ha
t is
curr
ently the
second m
ost im
po
rtant
pro
ble
m f
acin
g y
ou
r m
unic
ipalit
y?

70
Publi
c Serv
ices a
nd Lo
cal A
uthori
ties i
n Foc
us
Total
Prishtinë/Pristina
Mitrovicë/Mitrovica
Gjilan/Gnjilane
Pejë/Pec
Prizren/Prizren
Gjakovë/Djakovica
Podujevë
Vushtrri/Vucitrn
Skenderaj/Srbica
Leposaviq/Leposavic
Klinë/Klina
Istog/Istok
Decan/Decane
Dragash/Dragas
Suharekë/Suvareka
Rahovec/Orahovac
Viti/Vitina
Kamenicë/Kamenica
Lipjan/Lipljane
Shtime/Stimlje
Ferizaj/Urosevac
Kacanik/Kacanik
Fushë Kosova/Kosovo Polje
Obiliq/Obilic
Novobërda/Novo Brdo
Zubin Potok/ Zubin Potok
Shtërpca/Strpce
Zvecan/Zvecane
Gllogovc/Glogovac
Malisheva/Malisevo
Junik/Junik
Mamushë/Mamusa
Hani i Elezit/Deneral Jankovic
Co
un
t6364
561
323
362
365
464
311
282
233
174
91
169
167
146
122
194
188
181
127
201
88
327
138
111
106
84
90
90
83
166
150
89
91
90
Gott
en b
ett
er
28%
27%
7%
11%
45%
17%
25%
19%
37%
70%
29%
46%
38%
45%
1%
23%
20%
31%
48%
49%
5%
42%
44%
0%
37%
12%
7%
2%
5%
40%
40%
8%
23%
28%
Sta
yed t
he s
am
e52%
61%
82%
42%
40%
73%
39%
45%
49%
29%
60%
42%
48%
49%
68%
60%
53%
48%
39%
31%
96%
49%
41%
18%
43%
52%
67%
39%
45%
52%
46%
75%
75%
40%
Gott
en w
ors
e18%
11%
11%
45%
12%
9%
35%
35%
11%
1%
10%
11%
13%
1%
31%
5%
26%
20%
13%
9%
0%
8%
12%
82%
18%
32%
26%
54%
51%
7%
13%
16%
2%
8%
Re
fuse
s1%
1%
1%
0%
1%
0%
0%
0%
0%
0%
1%
1%
1%
0%
0%
0%
1%
0%
0%
5%
0%
1%
1%
0%
2%
0%
0%
2%
0%
0%
0%
1%
0%
13%
Don't
know
2%
0%
0%
2%
3%
0%
1%
1%
3%
0%
0%
0%
0%
6%
0%
12%
1%
2%
1%
7%
0%
2%
1%
0%
1%
4%
1%
2%
0%
0%
1%
0%
0%
11%
Q-4
a. C
om
pare
d to
a y
ear
ago
, d
o y
ou
th
ink
the
fin
an
cia
l sta
tus o
fyou
r ho
useh
old
re
sid
ing
here
ha
s
Total
Prishtinë/Pristina
Mitrovicë/Mitrovica
Gjilan/Gnjilane
Pejë/Pec
Prizren/Prizren
Gjakovë/Djakovica
Podujevë
Vushtrri/Vucitrn
Skenderaj/Srbica
Leposaviq/Leposavic
Klinë/Klina
Istog/Istok
Decan/Decane
Dragash/Dragas
Suharekë/Suvareka
Rahovec/Orahovac
Viti/Vitina
Kamenicë/Kamenica
Lipjan/Lipljane
Shtime/Stimlje
Ferizaj/Urosevac
Kacanik/Kacanik
Fushë Kosova/Kosovo Polje
Obiliq/Obilic
Novobërda/Novo Brdo
Zubin Potok/ Zubin Potok
Shtërpca/Strpce
Zvecan/Zvecane
Gllogovc/Glogovac
Malisheva/Malisevo
Junik/Junik
Mamushë/Mamusa
Hani i Elezit/Deneral Jankovic
Cou
nt
63
62
561
324
361
36
3464
311
283
23
3174
91
169
169
146
122
19
5186
180
127
20
688
324
134
11
1106
84
90
90
83
167
15
089
91
90
Get
bett
er
43%
64
%15%
23%
42%
53
%39%
34%
55%
86%
43%
36%
24
%66%
23%
40%
51
%39%
43%
48%
83
%49%
42%
3%
44%
33%
14%
1%
5%
78%
62%
39
%20%
62%
Sta
y t
he s
am
e32%
23
%65%
22%
36%
33
%49%
25%
34%
13%
39%
39%
33
%24%
1%
32%
27
%27%
41%
35%
15
%36%
29%
17%
16%
39%
48%
22
%45%
17%
28%
40
%79%
11%
Get
wors
e14%
10
%13%
38%
7%
5%
9%
28%
5%
1%
15%
23%
26
%3%
0%
13%
16
%6%
14%
6%
2%
7%
10%
80%
16%
14%
28%
58
%51%
2%
9%
17
%1%
1%
Refu
ses
2%
1%
1%
1%
1%
0%
2%
0%
1%
0%
1%
1%
1%
0%
43%
2%
1%
0%
0%
4%
0%
1%
0%
0%
2%
0%
0%
4%
0%
1%
0%
1%
0%
11%
Don't k
now
9%
3%
6%
16%
14%
8%
2%
12%
5%
1%
2%
1%
17
%8%
33%
14%
5%
28%
2%
6%
0%
7%
19%
0%
22%
13%
10%
14
%0%
3%
1%
2%
0%
14%
Q-4
b. A
nd
over
the
ne
xt
yea
r, d
o y
ou
exp
ect th
at
the
fin
an
cia
l sta
tus o
f you
r h
ouse
hold
re
sid
ing
he
re w
ill

71
Koso
vo M
osaic
Surve
y 200
9
Total
Prishtinë/Pristina
Mitrovicë/Mitrovica
Gjilan/Gnjilane
Pejë/Pec
Prizren/Prizren
Gjakovë/Djakovica
Podujevë
Vushtrri/Vucitrn
Skenderaj/Srbica
Leposaviq/Leposavic
Klinë/Klina
Istog/Istok
Decan/Decane
Dragash/Dragas
Suharekë/Suvareka
Rahovec/Orahovac
Viti/Vitina
Kamenicë/Kamenica
Lipjan/Lipljane
Shtime/Stimlje
Ferizaj/Urosevac
Kacanik/Kacanik
Fushë Kosova/Kosovo Polje
Obiliq/Obilic
Novobërda/Novo Brdo
Zubin Potok/ Zubin Potok
Shtërpca/Strpce
Zvecan/Zvecane
Gllogovc/Glogovac
Malisheva/Malisevo
Junik/Junik
Mamushë/Mamusa
Hanii Elezit/Deneral Jankovic
Count
6404
56
23
24
362
36
54
64
315
28
42
33
17
491
16
91
69
155
12
21
96
190
18
11
28
20
888
32
91
42
111
10
784
90
90
83
16
81
50
89
91
90
Am
bula
nce
26
47
55
-31
916
-34
33
35
81
77
-832
12
-45
-19
26
22
56
24
47
25
36
34
13
27
62
61
76
28
-346
50
53
Hosp
ital
15
33
50
-15
12
17
-40
11
34
76
71
22
27
9-4
5-2
11
818
19
16
42
20
22
-90
12
12
59
28
51
23
-15
550
2
Public h
ealt
hca
re16
41
40
-17
12
14
-43
15
26
70
46
424
8-4
60
16
19
19
17
26
16
21
24
77
52
20
38
26
-10
22
46
9
Managin
g e
lem
enta
ry a
nd s
eco
ndary
educa
tion
21
51
35
-10
23
19
-37
14
28
74
62
121
75
-47
53
018
16
18
35
15
16
54
615
42
15
-46
46
-419
38
41
Wast
e C
ollect
ion
51
97
-54
10
-7-1
2-1
97
825
-91
24
-6-7
-18
8-6
21
37
19
12
48
-96
-62
-51
13
-24
18
27
1
Wate
r su
pply
10
42
22
-11
14
-35
30
-26
79
5-1
010
64
-70
-38
323
25
37
13
25
-77
19
31
7-6
90
17
-34
57
24
11
Sew
age a
nd s
anit
ati
on
33
95
-20
-85
06
-15
77
35
-6-1
4-3
66
0-1
21
-22
346
-57
-14
6-7
-14
-77
-57
19
-5-1
418
25
Main
tenance
oflo
cal ro
ad n
etw
ork
33
21
-27
-13
6-1
38
-10
76
33
-4-2
0-8
50
-3-2
23
26
50
-41
45
76
-4-8
1-7
925
-16
12
13
8
Main
tenance
of in
terc
ity r
oads
54
3-2
-21
-18
9-1
717
26
425
-12
-22
-9-2
5-1
-422
28
38
-312
74
019
-15
-69
-19
38
-10
10
-44
6
Tra
fic
and p
ark
ing r
egula
tion
-32
71
-37
-14
-20
-28
-10
-56
936
-7-2
5-9
-23
4-2
8-1
523
25
28
-38
35
-10
-31
-56
40
19
-14
-4-1
9-2
Ele
ctri
city
supply
-11
21
-26
-35
-26
-18
-40
-3-3
06
67
-5-4
5-3
4-2
4-1
2-4
4-3
7-5
28
25
623
-64
-13
01
8-8
384
16
-35
-55
-55
46
Tele
phone a
nd p
ost
alse
rvic
es
15
48
10
-15
13
15
-14
-217
78
55
-1-3
55
22
-2-1
3-5
38
26
36
10
12
-63
-4-9
23
-174
48
-758
91
1
Envir
onm
ent
pro
tect
ion
-21
1-1
-34
-6-7
-16
-23
-56
554
10
-23
16
69
-7-6
-12
32
24
38
-14
18
-82
-3-2
1-9
-67
-54
31
724
-20
Pro
tect
ion o
fla
nd a
nd landsc
ape
and w
ildlife
-31
9-6
-38
-1-8
-37
-25
-56
653
15
-20
04
54
-21
-14
32
24
38
-17
20
13
-1-2
2-1
9-7
3-6
42
39
32
-33
Cult
ura
l act
ivit
es
11
32
12
-22
23
15
-46
-16
41
71
51
9-1
40
74
19
14
-17
64
26
48
615
48
-12
-14
-16
-73
-23
23
15
-11
30
9
Sport
s act
ivie
s13
34
16
-18
22
14
-47
-17
39
71
59
22
-13
18
023
17
-12
58
20
41
310
49
-11
-17
11
-52
-25
33
15
031
4
Fir
efighti
ng a
nd
em
erg
ency
serv
ices
15
44
10
-17
18
11
-42
-221
73
59
-610
-67
517
16
053
22
28
811
56
11
10
-29
41
47
20
13
17
13
Rura
l and u
rban p
lannin
g1
28
-3-3
48
-7-4
1-2
111
64
39
-29
-76
89
0-2
918
19
31
-82
22
-13
-29
-3-6
3-4
635
00
-3-5
Soci
al se
rvic
es
-16
6-4
-48
-16
-29
-39
-27
-46
320
1-2
5-4
-2-9
-55
-48
01
938
-11
7-7
3-1
7-2
2-2
0-6
1-7
02
-50
2-7
0-2
9
Pensi
ons
-20
1-9
-56
-22
-31
-39
-28
-10
62
14
-2-3
0-2
-8-9
-57
-55
-11
16
36
-13
11
-89
-22
-21
-7-3
7-5
2-1
4-5
7-1
9-7
6-3
4
Tax p
aym
ent
pro
cedure
s1
38
-1-3
42
0-3
2-1
34
73
27
-43
4-2
7-3
5-2
911
16
40
-12
13
30
-6-1
1-1
7-2
98
31
04
-62
14
Public t
ransp
ort
ati
on
54
3-5
-25
617
-32
-24
66
938
17
-61
11
-22
-28
29
15
41
-15
11
51
-6-1
94
-44
29
39
817
-35
-25
Pro
tect
ion
of cu
ltura
l heri
tage
03
3-1
0-2
5-8
2-3
9-1
88
67
21
-4-6
-7-7
9-1
3-3
331
16
43
-10
769
-11
-13
-10
-76
-50
29
41
-27
6
Tenders
Pro
cure
ment
-72
4-1
2-2
9-1
5-7
-37
-44
-36
411
4-1
2-3
-12
10
-27
-48
11
15
44
-612
-1-2
1-3
94
-60
-12
16
-21
-17
-10
6
Recr
uit
ment
ofci
vil s
erv
ants
-43
6-1
0-3
0-1
0-5
-34
-36
36
59
6-7
1-3
210
-39
-49
51
631
414
12
-31
-42
-6-7
6-3
229
-24
037
9
Managem
ent
of m
unic
ipal fu
nds
-33
4-9
-31
-18
-4-2
7-3
82
66
37
4-1
8-2
-53
13
-5-6
66
16
35
720
9-3
2-4
56
-61
-422
-25
140
10
Public lig
hti
ng
53
312
-33
-19
32
-11
-36
76
851
9-2
024
-14
13
14
-53
30
16
39
20
24
-9-3
3-5
01
1-5
8-7
241
0-1
343
-6
Sid
ew
alk
s4
26
19
-41
-26
11
-13
-35
76
554
20
-19
24
-59
19
-49
52
16
48
20
20
1-2
9-5
42
3-6
2-8
151
913
46
-7
Q-5
. T
ell
me
to
wh
at
exte
nt
are
yo
u s
atisfied
with
the
perf
orm
an
ce
of
the
fo
llow
ing
serv
ice
s.e
rvic
es.
(Ave
rage
s f
rom
-100
to
100)

72
Publi
c Serv
ices a
nd Lo
cal A
uthori
ties i
n Foc
us
Total
Prishtinë/Pristina
Mitrovicë/Mitrovica
Gjilan/Gnjilane
Pejë/Pec
Prizren/Prizren
Gjakovë/Djakovica
Podujevë
Vushtrri/Vucitrn
Skenderaj/Srbica
Leposaviq/Leposavic
Klinë/Klina
Istog/Istok
Decan/Decane
Dragash/Dragas
Suharekë/Suvareka
Rahovec/Orahovac
Viti/Vitina
Kamenicë/Kamenica
Lipjan/Lipljane
Shtime/Stimlje
Ferizaj/Urosevac
Kacanik/Kacanik
Fushë Kosova/Kosovo Polje
Obiliq/Obilic
Novobërda/Novo Brdo
Zubin Potok/Zubin Potok
Shtërpca/Strpce
Zvecan/Zvecane
Gllogovc/Glogovac
Malisheva/Malisevo
Junik/Junik
Mamushë/Mamusa
Hani iElezit/Deneral Jankovic
Count
6378
560
324
362
364
463
312
283
232
174
91
169
168
155
122
196
187
181
124
208
88
328
141
110
107
84
90
89
82
168
149
89
90
88
Very
cle
an
7%
9%
4%
2%
3%
7%
5%
6%
4%
3%
53%
8%
8%
1%
1%
1%
5%
2%
11%
14%
2%
16%
16%
7%
2%
4%
12%
3%
0%
12%
9%
5%
2%
7%
Som
ew
hat
clean
67%
73%
47%
49%
57%
89%
70%
67%
52%
96%
44%
59%
64%
70%
34%
78%
70%
85%
66%
72%
96%
66%
62%
77%
81%
58%
81%
60%
54%
69%
61%
83%
33%
64%
Very
dir
ty23%
17%
49%
48%
40%
3%
25%
23%
43%
1%
0%
33%
27%
28%
0%
17%
23%
10%
11%
3%
2%
17%
16%
16%
12%
38%
6%
35%
46%
19%
28%
12%
64%
17%
Refu
ses
2%
1%
0%
0%
0%
0%
0%
0%
0%
0%
0%
0%
0%
0%
66%
1%
2%
1%
2%
6%
0%
0%
6%
0%
3%
0%
1%
0%
0%
0%
0%
0%
0%
9%
Don't
know
1%
1%
0%
1%
0%
0%
0%
3%
1%
0%
3%
0%
1%
1%
0%
4%
1%
2%
10%
6%
0%
2%
0%
0%
2%
0%
0%
2%
0%
0%
2%
0%
0%
3%
Q-6
H
ow
would
you
rate
the
cle
an
liness in
you
r m
unic
ipalit
y
Total
Prishtinë/Pristina
Mitrovicë/Mitrovica
Gjilan/Gnjilane
Pejë/Pec
Prizren/Prizren
Gjakovë/Djakovica
Podujevë
Vushtrri/Vucitrn
Skenderaj/Srbica
Leposaviq/Leposavic
Klinë/Klina
Istog/Istok
Decan/Decane
Dragash/Dragas
Suharekë/Suvareka
Rahovec/Orahovac
Viti/Vitina
Kamenicë/Kamenica
Lipjan/Lipljane
Shtime/Stimlje
Ferizaj/Urosevac
Kacanik/Kacanik
Fushë Kosova/Kosovo Polje
Obiliq/Obilic
Novobërda/Novo Brdo
Zubin Potok/Zubin Potok
Shtërpca/Strpce
Zvecan/Zvecane
Gllogovc/Glogovac
Malisheva/Malisevo
Junik/Junik
Mamushë/Mamusa
Hanii Elezit/Deneral Jankovic
Count
6186
553
321
354
361
452
309
221
233
172
89
166
167
154
120
158
186
179
120
208
87
325
139
111
88
78
90
88
82
164
146
89
90
86
Yes
18%
44%
6%
9%
4%
4%
38%
2%
24%
2%
55%
2%
4%
5%
20%
1%
11%
0%
20%
51%
1%
16%
9%
89%
3%
5%
28%
1%
67%
25%
36%
8%
3%
5%
No
75%
56%
94%
69%
78%
96%
62%
74%
75%
98%
43%
97%
68%
94%
48%
83%
89%
93%
73%
45%
99%
83%
89%
11%
86%
81%
68%
86%
33%
73%
64%
85%
97%
70%
Refu
ses
3%
0%
0%
1%
18%
0%
0%
1%
0%
0%
0%
1%
28%
1%
32%
4%
0%
3%
3%
1%
0%
0%
0%
0%
0%
0%
4%
10%
0%
1%
0%
0%
0%
17%
Don't
know
4%
0%
1%
21%
0%
0%
0%
24%
1%
0%
2%
1%
1%
0%
1%
11%
0%
4%
4%
3%
0%
0%
3%
0%
10%
14%
0%
2%
0%
2%
0%
7%
0%
8%
Q-7
a. D
oyou u
se p
ublic
transp
ort
ati
on
inyour
munic
ipality
?
Total
Prishtinë/Pristina
Mitrovicë/Mitrovica
Gjilan/Gnjilane
Pejë/Pec
Prizren/Prizren
Gjakovë/Djakovica
Podujevë
Vushtrri/Vucitrn
Skenderaj/Srbica
Leposaviq/Leposavic
Klinë/Klina
Istog/Istok
Decan/Decane
Dragash/Dragas
Suharekë/Suvareka
Rahovec/Orahovac
Viti/Vitina
Kamenicë/Kamenica
Lipjan/Lipljane
Shtime/Stimlje
Ferizaj/Urosevac
Kacanik/Kacanik
Fushë Kosova/Kosovo Polje
Obiliq/Obilic
Novobërda/Novo Brdo
Zubin Potok/ Zubin Potok
Shtërpca/Strpce
Zvecan/Zvecane
Gllogovc/Glogovac
Malisheva/Malisevo
Junik/Junik
Mamushë/Mamusa
Hani i Elezit/Deneral Jankovic
Count
6341
561
324
348
362
464
311
276
233
174
86
169
169
154
121
192
188
180
127
206
88
326
138
111
107
84
90
89
80
165
149
89
90
90
(1 t
o 4
)hours
16%
8%
14%
8%
1%
10%
1%
4%
55%
0%
1%
4%
2%
1%
76%
8%
50%
21%
3%
11%
53%
10%
12%
23%
27%
17%
0%
9%
1%
4%
57%
0%
97%
60%
(5 t
o 6
)hours
13%
15%
28%
6%
4%
17%
5%
12%
9%
0%
1%
18%
5%
3%
23%
12%
34%
16%
9%
6%
21%
13%
8%
41%
19%
26%
24%
15%
0%
9%
6%
2%
3%
6%
(11
or
more
) hours
26%
51%
20%
17%
43%
44%
4%
46%
6%
1%
59%
56%
50%
3%
0%
13%
1%
22%
23%
14%
0%
25%
36%
16%
21%
5%
28%
40%
0%
38%
4%
83%
0%
6%
Unre
stri
ctre
d25%
25%
24%
18%
36%
23%
79%
24%
4%
98%
24%
12%
25%
71%
0%
3%
7%
11%
17%
11%
26%
13%
18%
0%
33%
10%
43%
15%
86%
11%
0%
12%
0%
1%
Q-8
a. O
n a
vera
ge,
duri
ng t
he l
ast
year,
how
man
y h
ours
per
day y
ou h
ad
runnin
g w
ate
r?

73
Koso
vo M
osaic
Surve
y 200
9
Total
Prishtinë/Pristina
Mitrovicë/Mitrovica
Gjilan/Gnjilane
Pejë/Pec
Prizren/Prizren
Gjakovë/Djakovica
Podujevë
Vushtrri/Vucitrn
Skenderaj/Srbica
Leposaviq/Leposavic
Klinë/Klina
Istog/Istok
Decan/Decane
Dragash/Dragas
Suharekë/Suvareka
Rahovec/Orahovac
Viti/Vitina
Kamenicë/Kamenica
Lipjan/Lipljane
Shtime/Stimlje
Ferizaj/Urosevac
Kacanik/Kacanik
Fushë Kosova/Kosovo Polje
Obiliq/Obilic
Novobërda/Novo Brdo
Zubin Potok/Zubin Potok
Shtërpca/Strpce
Zvecan/Zvecane
Gllogovc/Glogovac
Malisheva/Malisevo
Junik/Junik
Mamushë/Mamusa
Hani i Elezit/Deneral Jankovic
Count
6315
560
323
347
362
460
307
276
230
174
89
169
168
153
122
190
188
179
125
207
88
324
140
110
107
82
90
85
82
163
148
89
90
88
Yes
19%
22%
19%
6%
39%
8%
24%
24%
14%
1%
47%
43%
27%
10%
57%
7%
9%
7%
29%
0%
0%
24%
41%
20%
0%
6%
9%
4%
72%
2%
30%
7%
1%
2%
No,I w
ould
use
but
there
are
none
35%
23%
16%
37%
9%
5%
7%
34%
24%
99%
8%
46%
21%
64%
1%
62%
7%
69%
17%
83%
0%
45%
36%
78%
82%
66%
44%
54%
6%
73%
10%
83%
31%
85%
No
47%
55%
65%
57%
52%
87%
69%
42%
62%
1%
45%
11%
52%
26%
43%
31%
84%
24%
54%
17%
100%
31%
23%
2%
18%
28%
47%
42%
22%
25%
60%
10%
68%
13%
Q-9
. D
o y
ou
use
city p
ark
s o
r o
the
rre
cre
ation
alg
ree
n a
reas?
Total
Prishtinë/Pristina
Mitrovicë/Mitrovica
Gjilan/Gnjilane
Pejë/Pec
Prizren/Prizren
Gjakovë/Djakovica
Podujevë
Vushtrri/Vucitrn
Skenderaj/Srbica
Leposaviq/Leposavic
Klinë/Klina
Istog/Istok
Decan/Decane
Dragash/Dragas
Suharekë/Suvareka
Rahovec/Orahovac
Viti/Vitina
Kamenicë/Kamenica
Lipjan/Lipljane
Shtime/Stimlje
Ferizaj/Urosevac
Kacanik/Kacanik
Fushë Kosova/Kosovo Polje
Obiliq/Obilic
Novobërda/Novo Brdo
ZubinPotok/ Zubin Potok
Shtërpca/Strpce
Zvecan/Zvecane
Gllogovc/Glogovac
Malisheva/Malisevo
Junik/Junik
Mamushë/Mamusa
Hani i Elezit/Deneral Jankovic
Tota
l6298
561
324
362
358
462
309
280
231
172
91
167
169
153
121
182
190
179
116
197
87
320
137
111
106
83
89
90
83
164
150
89
91
74
Am
bula
nce
52%
66%
58%
69%
25%
28%
92%
56%
25%
65%
10%
2%
28%
59%
13%
95%
62%
42%
53%
85%
36%
42%
22%
79%
74%
52%
55%
10%
46%
65%
98%
35%
90%
34%
Wast
e_co
llect
ion
41%
56%
30%
37%
34%
40%
41%
42%
46%
17%
47%
6%
23%
22%
32%
82%
79%
24%
13%
31%
92%
10%
10%
96%
28%
51%
54%
40%
22%
49%
96%
23%
99%
10%
Wate
r_su
ppl y
37%
31%
23%
48%
11%
42%
48%
28%
56%
26%
46%
29%
17%
14%
42%
74%
66%
21%
19%
10%
60%
25%
10%
99%
9%
68%
47%
51%
24%
53%
92%
23%
96%
18%
Sew
age_Sanit
ati
on
30%
17%
17%
37%
30%
19%
55%
24%
17%
13%
17%
14%
17%
50%
10%
29%
56%
15%
21%
13%
78%
15%
7%
78%
22%
49%
61%
52%
47%
43%
65%
70%
97%
4%
Road_m
ain
tenance
39%
32%
32%
44%
31%
47%
75%
34%
24%
19%
41%
24%
24%
39%
78%
57%
52%
23%
14%
15%
53%
22%
21%
55%
27%
37%
58%
53%
65%
34%
80%
48%
97%
8%
Ele
ctri
cit y
63%
64%
75%
74%
43%
94%
86%
52%
83%
67%
82%
7%
43%
75%
56%
84%
55%
51%
42%
50%
54%
45%
54%
46%
69%
63%
43%
70%
8%
69%
97%
91%
92%
1%
Pro
cedure
s_fo
r_ta
x_paym
ent
8%
5%
8%
4%
6%
3%
23%
19%
2%
0%
8%
4%
7%
3%
3%
7%
21%
5%
7%
8%
8%
5%
5%
2%
3%
6%
8%
7%
1%
11%
47%
6%
30%
1%
Curb
ing_ille
gal_
const
ruct
ion
19%
28%
7%
19%
17%
29%
68%
27%
7%
12%
3%
5%
12%
24%
3%
8%
18%
11%
16%
6%
12%
12%
10%
12%
5%
10%
8%
34%
1%
22%
51%
14%
11%
3%
Soci
al_
housi
ng
30%
46%
13%
27%
12%
39%
45%
49%
10%
24%
3%
5%
18%
19%
26%
76%
16%
30%
26%
36%
8%
20%
16%
87%
31%
33%
18%
17%
11%
50%
81%
9%
8%
26%
Issu
ing_ci
vil_docu
ments
14%
18%
14%
19%
10%
4%
52%
23%
16%
30%
1%
1%
11%
13%
3%
2%
8%
12%
10%
5%
31%
6%
7%
3%
11%
8%
6%
14%
1%
10%
55%
10%
1%
4%
Educa
tion
32%
50%
26%
43%
12%
19%
38%
56%
18%
74%
6%
1%
8%
27%
73%
18%
12%
45%
23%
31%
5%
18%
19%
3%
48%
41%
20%
57%
49%
34%
83%
43%
0%
28%
Sport
s16%
34%
10%
23%
11%
2%
24%
32%
9%
1%
3%
1%
4%
20%
7%
3%
7%
16%
8%
7%
0%
10%
4%
2%
19%
30%
21%
40%
16%
25%
68%
10%
0%
16%
Park
s_and_re
creati
ons
16%
32%
6%
11%
3%
2%
21%
23%
8%
13%
2%
1%
3%
20%
66%
5%
17%
17%
2%
24%
0%
2%
0%
77%
19%
11%
18%
14%
53%
40%
33%
19%
0%
14%
Pedest
rian_and_bik
ingare
as
9%
20%
7%
13%
13%
0%
9%
18%
4%
1%
0%
1%
13%
5%
2%
3%
2%
17%
2%
4%
0%
0%
2%
2%
10%
10%
9%
8%
41%
18%
51%
8%
0%
1%
Open_m
ark
et_
are
as
6%
19%
4%
3%
1%
0%
7%
16%
2%
0%
3%
1%
3%
1%
0%
1%
1%
12%
4%
2%
0%
1%
2%
1%
5%
8%
10%
8%
36%
20%
9%
12%
0%
4%
Q17 M
ost
urg
ent
needed s
erv
ices
in m
unic
ipalit y
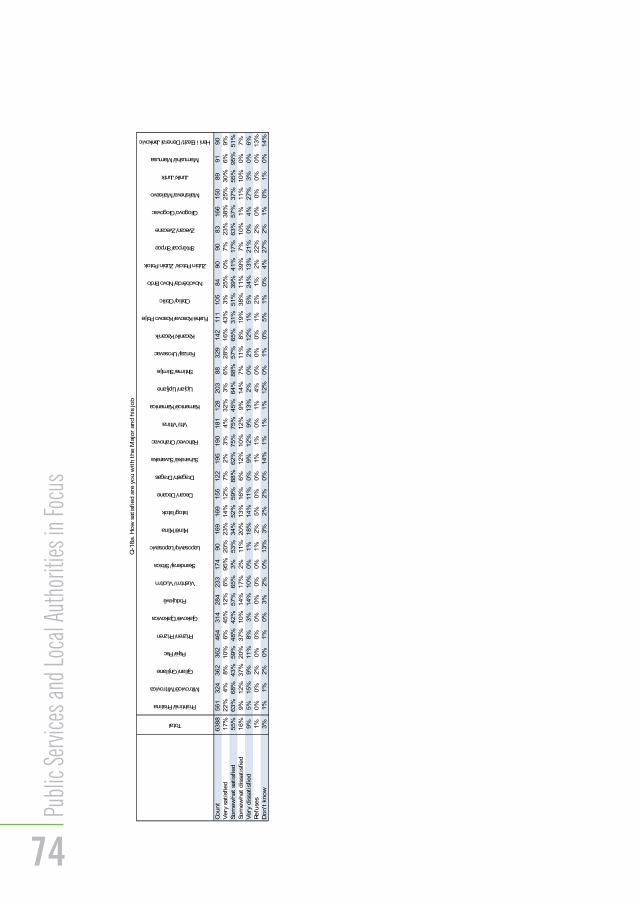
Total
Prishtinë/Pristina
Mitrovicë/Mitrovica
Gjilan/Gnjilane
Pejë/Pec
Prizren/Prizren
Gjakovë/Djakovica
Podujevë
Vushtrri/Vucitrn
Skenderaj/Srbica
Leposaviq/Leposavic
Klinë/Klina
Istog/Istok
Decan/Decane
Dragash/Dragas
Suharekë/Suvareka
Rahovec/Orahovac
Viti/Vitina
Kamenicë/Kamenica
Lipjan/Lipljane
Shtime/Stimlje
Ferizaj/Urosevac
Kacanik/Kacanik
Fushë Kosova/Kosovo Polje
Obiliq/Obilic
Novobërda/Novo Brdo
ZubinPotok/ Zubin Potok
Shtërpca/Strpce
Zvecan/Zvecane
Gllogovc/Glogovac
Malisheva/Malisevo
Junik/Junik
Mamushë/Mamusa
Hani i Elezit/Deneral Jankovic
Count
6388
561
324
362
362
464
314
284
233
174
90
169
169
155
122
195
190
181
128
203
88
329
142
111
105
84
90
90
83
166
150
89
91
90
Very
sati
sfie
d17%
22%
4%
8%
10%
6%
45%
12%
6%
95%
20%
23%
14%
12%
7%
2%
3%
4%
32%
3%
6%
28%
16%
43%
3%
25%
0%
7%
23%
38%
25%
30%
6%
9%
Som
ew
hat
sati
sfie
d55%
63%
68%
43%
59%
48%
42%
57%
65%
3%
53%
34%
52%
59%
88%
62%
75%
75%
45%
64%
88%
57%
65%
31%
51%
39%
41%
17%
63%
57%
37%
55%
95%
51%
Som
ew
hat
dis
sati
sfie
d16%
9%
12%
37%
20%
37%
10%
14%
17%
2%
11%
20%
13%
16%
6%
12%
10%
12%
9%
14%
7%
11%
8%
19%
38%
11%
39%
7%
10%
1%
11%
10%
0%
7%
Very
dis
sati
sfie
d9%
5%
15%
9%
11%
8%
3%
14%
10%
0%
1%
18%
14%
11%
0%
9%
12%
9%
13%
2%
0%
2%
12%
1%
5%
24%
13%
21%
0%
4%
27%
3%
0%
6%
Refu
ses
1%
0%
0%
2%
0%
0%
0%
0%
0%
0%
1%
2%
5%
0%
0%
1%
1%
0%
1%
4%
0%
0%
0%
1%
2%
1%
2%
22%
2%
0%
0%
0%
0%
13%
Don't
know
3%
1%
1%
2%
0%
1%
0%
3%
2%
0%
13%
3%
2%
2%
0%
14%
1%
1%
1%
12%
0%
1%
0%
5%
1%
0%
4%
27%
2%
1%
0%
1%
0%
14%
Q-1
8a. H
ow
sati
sfie
d a
re y
ou w
ith t
he M
ajo
r and h
is job
Publi
c Serv
ices a
nd Lo
cal A
uthori
ties i
n Foc
us
74
