project: advancing the seea experimental ecosystem...
TRANSCRIPT

System of Environmental-Economic Accounting
Condition Account (Levels 1 and 2)
Project: Advancing the SEEA
Experimental Ecosystem Accounting

System of Environmental-Economic Accounting
Overview: The Condition Account
1. Learning objectives
2. Review of Level 0 (5m)
3. Level 1 (Compilers) • Concepts (15m)
• Group exercise & Discussion (30m)
4. Level 2 (Data providers) • Data options, examples & issues (15m)
• Group exercise & Discussion (15m)
5. Closing Discussion (10m)

System of Environmental-Economic Accounting
SEEA-EEA Training Levels 1 and 2
• Learning objectives
• Level 1:
• Understand the basic concepts of the Condition Account
• Learn the steps of compiling a Condition Account
• Level 2
• Understand the data options and sources
• Understand the important conceptual issues
• Be aware of how other countries have approached
measuring Condition
3

System of Environmental-Economic Accounting
Account 2: Condition
4
System of Environmental-Economic Accounting
Review of Level 0:
Condition Account
5

System of Environmental-Economic Accounting
Level 0: Account 2: Condition
• What? • Ecosystem condition reflects the overall quality of an
ecosystem asset, in terms of its characteristics. (SEEA EEA
paragraph 2.34)
• Why? • Policies to limit degradation of natural heritage, rehabilitation of
degraded ecosystems
• Links to capacity to produce services (Services Supply)
• Indicators:
• Indices of condition change over time where changes
• Good/bad condition (exceeding “safe” levels) where
6

System of Environmental-Economic Accounting
Level 0: Account 2: Condition
What does a Condition Account look like?
7
Maps Tables
Vegetation
Soil
Biodiversity
Water
Carbon
Scaling & aggregation

System of Environmental-Economic Accounting
Level 0: Account 2: Condition
• What does a Condition Account look like? • Spatially-detailed condition measures (quality or biophysical) for
each characteristic: • Vegetation
• Biodiversity (species abundance, diversity indices)
• Soil
• Water
• Carbon
• Air
• Overall measures (e.g., heterogeneity)
• Selected to reflect an area’s capacity to generate services
• Summarized in terms of an index
• Accounts for changes over time (accounting period)
• Attributes changes to drivers (natural and human) 8

System of Environmental-Economic Accounting
Level 0: Account 2: Condition
• What do you need to compile a Condition
Account? • Ecosystem Extent Account
• Common spatial database (Spatial units)
• Data: • Condition measures from satellite imagery and field studies
over two periods of time
• Environmental monitoring data (water, air, soil, species)
• Expertise: • Ecologists (vegetation, soil, water)
• Statisticians (methodologists to create indices, Scaling,
Aggregation)
• Environmental policy analysts (focus on relevant indices)
• Geographers (GIS, remote sensing, integration)
9
System of Environmental-Economic Accounting
Level 1: Account 2:
Condition
10

System of Environmental-Economic Accounting
Level 1: Account 2: Condition
• Concepts • Quality and other biophysical measures
• Reference state
• Creating indices
11

System of Environmental-Economic Accounting
Level 1: Account 2: Condition
• Quality and other biophysical measures • Data are limited, so:
• Select the most important and reliable condition measures
• That link most directly to the services you are analysing
• Examples: • Water quality measures water purification
• Air quality measures air quality regulation
• Biodiversity index iconic species
• Vegetation, soil types carbon sequestration
• Other biophysical measures are needed to interpret
quality data • Stream flow rates capacity to purify water & control floods
• Slope capacity for control erosion
12

System of Environmental-Economic Accounting
Level 1: Account 2: Condition
• Reference state • Aggregates could be “arbitrary”
• For example, average of water quality measures
• Or, indexed to a “reference state” • For example, compare with “quality standard” for use
(drinking, recreation, livestock, wildlife, irrigation…)
• Can compare with past or “ideal” reference condition:
• Pristine or Pre-development state,
• Sustainable state (theoretical)
• Earliest available information
• Choice of reference state can affect interpretation
• e.g., Are we experiencing short-term fluctuations or a
long-term trend?
13

System of Environmental-Economic Accounting
Level 1: Account 2: Condition
• Creating indices • “Up” may be better or worse
• e.g., if pollutants increase this is usually worse
• e.g., if biodiversity increases, this is usually better
• “Up” or “Down” from ideal may be worse • e.g., pH of drinking water should be neutral
• e.g., species may have an “optimal” abundance
• Is there a need for weighting? • One measure may be more important than another
• Is there a need for scaling? • One measure may representative of a larger area
14

System of Environmental-Economic Accounting
Level 1: Account 2: Condition
• Compilation Group Exercise (30m) • Situation:
• Same EUs as defined in Spatial Units
• Added environmental quality data (indices scaled 1-10)
• “Reference state” is Opening Conditions
• Objective (Groups of 3-5): 1. Record quality data in appropriate cells in Condition Table
2. Using formulas provided, calculate an unweighted index for
each forested EU
– For the Opening Conditions
3. Calculate a summary for each indicator for Tree Covered
Area
4. Calculate and allocate changes to improvements or
reductions in condition
5. Report your results
15

System of Environmental-Economic Accounting
Level 1: Account 2: Condition
Group Exercise: Step 1 – Transfer data for Tree Covered EUs
16
Opening Conditions Condition table
System of Environmental-Economic Accounting
Level 1: Account 2: Condition
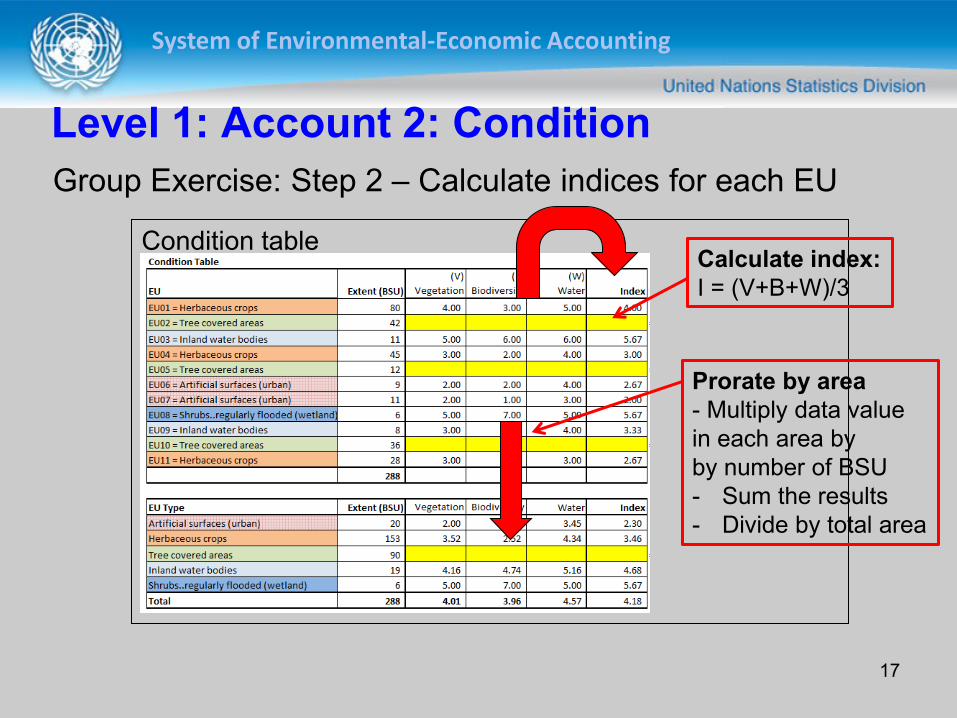
Group Exercise: Step 2 – Calculate indices for each EU
17
Condition table
Prorate by area
- Multiply data value
in each area by
by number of BSU
- Sum the results
- Divide by total area
Calculate index:
I = (V+B+W)/3

System of Environmental-Economic Accounting
Level 1: Account 2: Condition
Group Exercise: Step 2 – Prorate area for each EU
18
Condition table
BSU V
80 * 4 = 320
45 * 3 = 135
28 * 3 = 84
153 Total 539
539/153= 3.52
Prorate by area

System of Environmental-Economic Accounting
Level 1: Account 2: Condition
Group Exercise: Step 3 – Finalize Condition Account
19
Condition Table (Opening Conditions)
Condition Table (Closing Conditions - Provided)
Calculate and allocate changes to Condition Account
Calculate and allocate changes
(Closing – Opening) + improvement
- reduction

System of Environmental-Economic Accounting
Level 1: Account 2: Condition
Is everyone clear on the
objectives?
30 minutes group work
Please ask questions
Results: • Each group report:
▫ Tree Cover Area Index result
• Has condition been improved or reduced?
• For which components?
20

System of Environmental-Economic Accounting
Level 2: Account 2:
Condition
22

System of Environmental-Economic Accounting
Level 2: Account 2: Condition
• Learning objectives (Level 2)
• Understand the data options and sources
• Understand the important conceptual issues
• Be aware of how other countries have approached measuring
Condition
23

System of Environmental-Economic Accounting
Level 2: Account 2: Condition
Data Options • Types of condition data
• Sources of national condition data
• Estimating condition data
• Selecting condition measures
24

System of Environmental-Economic Accounting
Level 2: Account 2: Condition
Types of condition data • There are many possible quality measures
▫ Water quality is often an index based on selection of
indicators (BOD, COD, pH, metals…) according to fitness for
use (drinking, recreation, livestock, wildlife, irrigation…)
▫ Air quality (Ozone, PM2.5, NOx, SO2…) is often measured
only in urban areas and indexed on effects on human health
▫ Soil quality (moisture, texture, contaminants) should be
available from soil inventories
▫ Ecosystem integrity (fragmentation, heterogeneity) can be
estimated from satellite and administrative data (e.g., roads)
25

System of Environmental-Economic Accounting
Level 2: Account 2: Condition
Types of condition data • Quality data may refer to
different levels of
“holism” ▫ Reductionist = indicator
species, ratios between
organisms
▫ Composite indicators =
biomass, primary
productivity
▫ Holistic = diversity,
resilience, thermodynamic
capacity
26
Holistic
Composite
Reductionist

System of Environmental-Economic Accounting
Level 2: Account 2: Condition
Types of condition data • For ecosystem accounting, it is not necessary to have
all measures
link available data to important services
Examples: • Water purification of wetlands: Type of wetland, flow
rates, quality of inflow, quality of outflow
(phosphorous? metals?)
• Erosion control: Vegetation density, slope, soil type
• Biomass for crops: Soil type, soil carbon, slope
27

System of Environmental-Economic Accounting
Level 2: Account 2: Condition
Sources of national condition data • Departments of Environment: Water quality, air quality,
Species diversity indices
• Departments of Natural Resources: Hydrology
• Departments of Agriculture: Soil type, soil quality, farming
practices
• Departments of Forestry: Forest status, species mix, forest
inventory, carbon balances
• Departments of Fisheries: Coastal and marine water quality,
species diversity
• International sources:
▫ FAO: land cover, soil, marine species distributions
▫ IUCN: protected areas, red list of threatened species
28

System of Environmental-Economic Accounting
Level 2: Account 2: Condition
UNEP-WCMC Composite map of global
ecosystem assets
29
Source: Dickson, Blaney et al. (2014)

System of Environmental-Economic Accounting
Level 2: Account 2: Condition
Recommendation:
Conduct an inventory of available data in
government, academia and NGOs
Data inventories are inexpensive and have many
benefits: Engage the data providers
Improve metadata
Improve use of existing data
Suggest means of harmonizing existing data
Identify data gaps
30

System of Environmental-Economic Accounting
Level 2: Account 2: Condition
Estimating condition data Not all data need to be measured (or measured frequently)
Can estimate condition or services from other condition data
using Biophysical Modelling
Examples:
Land cover class carbon storage
Sampled data on forest growth estimate for other areas
Forest cover, distance from roads, etc. orangutan habitat
Primary production (from remote sensing) + soil respiration
carbon sequestration
31

System of Environmental-Economic Accounting
Ecosystem services Central Kalimantan Carbon storage Model used
Look Up Tables (every land cover class is attributed a specific carbon storage value) Kriging (values are interpolated from samples)
High : 1.67 m3/ha/year
Low : 0.42 m3/ha/year
Timber production
Source: Sumarga and Hein, 2014

System of Environmental-Economic Accounting
Ecosystem services Central Kalimantan
Orangutan habitat Model used:
Statistical model (Maxent) (habitat suitability predicted on the basis of forest cover, distance from road, etc.) Process-based Model (primary ecosystem production minus soil respiration)
High : 8.52 ton/ha/year
Low : -23.22 ton/ha/year
Carbon sequestration
Source: Sumarga and Hein, 2014

System of Environmental-Economic Accounting
Level 2: Account 2: Condition
Conceptual issues • Measurement
▫ Are data representative?
– Do monitoring sites represent all ecosystem types?
▫ What is the quality of the data?
▫ Are data consistent over time?
• Linkage to services ▫ Condition and services have a complex relationship
– A small change in condition may have a large effect on
services (e.g., change in coastal water quality on coral)
– A large change in condition may have a small effect on
services (e.g., change in coastal water quality on
tourism)
34

System of Environmental-Economic Accounting
Level 2: Account 2: Condition
Are data
representative?
Canada example:
Monitoring sites
selected to identify
“problems”
Some areas and types
of streams
undersampled
Populated areas
oversampled
Solution?
Source: Statistics Canada, 2007
35

System of Environmental-Economic Accounting
Level 2: Account 2: Condition
Linkage to services
As some services increase (e.g., crops), quality (biodiversity,
heterogeneity) may decrease
• This is not good, since intensive and extensive cropping
creates ecosystems that are less resilient to change.
Some services (e.g., iconic species habitat) may be very sensitive
to disturbance.
Research on resilience is trying to understand how to better link
conditions with services.
36
System of Environmental-Economic Accounting
Level 2: Account 2: Condition
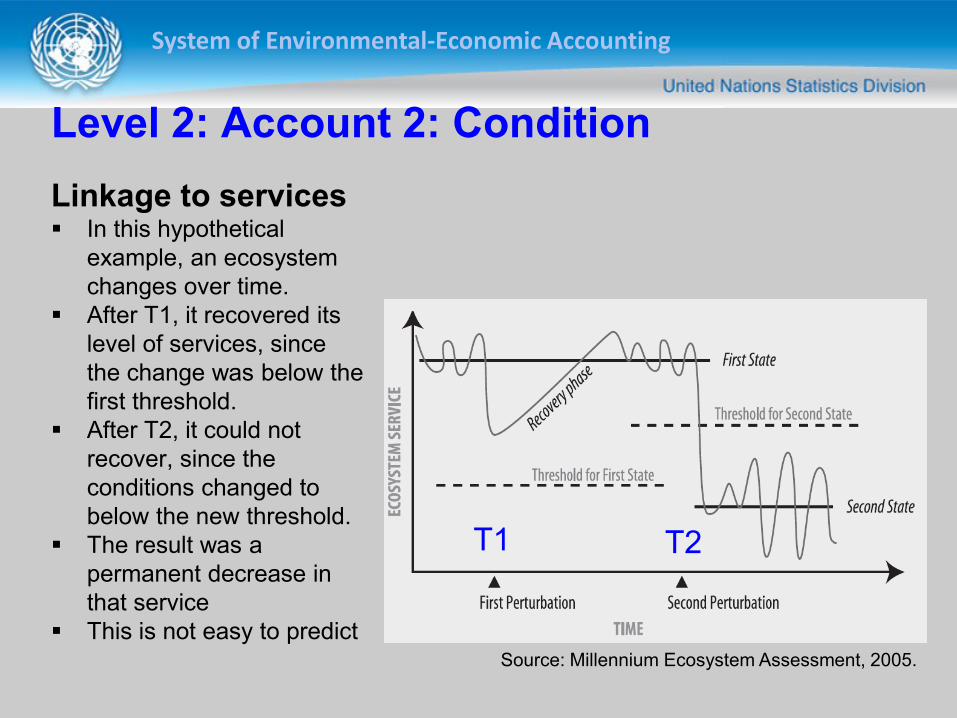
Linkage to services In this hypothetical
example, an ecosystem
changes over time.
After T1, it recovered its
level of services, since
the change was below the
first threshold.
After T2, it could not
recover, since the
conditions changed to
below the new threshold.
The result was a
permanent decrease in
that service
This is not easy to predict
Source: Millennium Ecosystem Assessment, 2005.
T1 T2
System of Environmental-Economic Accounting
Level 2: Account 2: Condition
Group exercise (15m) (Groups of 3-5)
1. Choose one ecosystem type and a service it
provides (e.g., forests flood protection)
2. Suggest three condition measures (quality and
biophysical) that could inform the relationship
between the condition and the service
3. Report: • The service and condition measures you selected
• How are they related? (direction, importance)
• Are national data available in your country for these
condition measures?
38

System of Environmental-Economic Accounting
Level 2: Account 2: Condition
Concepts Group exercise (15m)
Group reports • The service and condition measures you selected
• How are they related? (direction, importance)
• Are national data available in your country for these
condition measures?
Discussion • What other condition measures could you suggest?
• What other data sources could you suggest?
39

System of Environmental-Economic Accounting
Level 2: Account 2: Condition
Discussion and questions
Take home points: • Conduct an inventory of ecosystem condition data
• Data may be limited, but can be useful
• There are no simple formulas to calculate
ecosystem condition indicators for all purposes
• Biophysical modelling can be used to fill some gaps
• Ecosystem condition and services supply are non-
linear
• Testing will provide a better understanding of data
opportunities and constraints
• Focus on available data and priority services 40

System of Environmental-Economic Accounting
Level 2: Account 2: Condition
References DIckson, B., Blaney, et al., 2014. Towards a global map of natural capital: Key
ecosystem assets. DEW/1824/NA. Nairobi, Kenya: UNEP.
Millennium Ecosystem Assessment, 2005.
http://www.millenniumassessment.org/documents/document.300.aspx.pdf41
Statistics Canada, 2007. Canadian Environmental Sustainability Indicators 2007. Cat.
No. 16-251-x.
Sumarga, E. And Hein, L., 2014. Mapping Ecosystem Services for Land Use
Planning, the Case of Central Kalimantan. Environmental management, pp. 1-14.
Further Information • SEEA Experimental Ecosystem Accounting (2012)
• SEEA-EEA Technical Guidance (forthcoming)
▫ Detailed supporting document on “Ecosystem Condition and
Capacity” by Michael Bordt
41

System of Environmental-Economic Accounting
Evaluation of the training module
Please complete the online evaluation form for this
module: http://tinyurl.com/pbopmy2
For this module
• What did you learn that you could apply in your work?
• Was the presentation clear and informative?
• Was it too simple? Too complex?
• Was there anything you did not understand?
• What additions or deletions would you suggest (recognizing that
the unit is intended for a general audience)?
• Do you have any suggestions as to how the SEEA-EEA may be
improved (concepts, principles) in this area?

System of Environmental-Economic Accounting
Acknowledgements
This project is a collaboration of The United Nations
Statistics Division, United Nations Environment
Programme and the Secretariat of the Convention on
Biological Diversity and is supported by the Government
of Norway.
Contact: [email protected]