project craft: technical aspects of a real time
TRANSCRIPT

A multi-institution collaboration demonstrated real time compression and Internet-based
transmission technology to make possible an affordable nationwide operational capture,
distribution, and archiving of WSR-88D data.
1JULY 2007AMERICAN METEOROLOGICAL SOCIETY |
T he National Oceanic and Atmospheric Admin- istration’s (NOAA’s) National Weather Service (NWS) had an underutilized national resource
in the real-time high-resolution level II radar data. NOAA’s National Severe Storms Laboratory (NSSL) had developed a method to access the data in real time, but the challenge was finding an affordable way to disseminate the data given the limitations of the net-work bandwidth. NSSL needed the data to extend its
severe weather research throughout the country. The Center for Analysis and Prediction of Storms (CAPS) located at the University of Oklahoma (OU) had a need to use the data to initialize a high-resolution cloud model. NOAA’s National Climatic Data Center (NCDC) needed a method to improve its data capture rate of the level II data for archival purposes. Baron’s Services, a company specializing in radar data for the commercial television market, needed the data
PROJECT CRAFTA Real-Time Delivery System for Nexrad Level II Data
Via the Internet
BY KEVIN E. KELLEHER, KELVIN K. DROEGEMEIER, JASON J. LEVIT, CARL SINCLAIR, DAVID E. JAHN, SCOTT D. HILL, LORA MUELLER, GRANT QUALLEY, TIM D. CRUM, STEVEN D. SMITH, STEPHEN A. DEL GRECO,
S. LAKSHMIVARAHAN, LINDA MILLER, MOHAN RAMAMURTHY, BEN DOMENICO, AND DAVID W. FULKER
AFFILIATIONS: KELLEHER—NOAA/National Severe Storms Labo-ratory, Norman, Oklahoma; DROEGEMEIER, AND QUALLEY#—School of Meteorology and Center for Analysis and Prediction of Storms, University of Oklahoma, Norman, Oklahoma; LEVIT,* SINCLAIR,+ JAHN,# HILL, AND MUELLER@—Center for Analysis and Prediction of Storms, University of Oklahoma, Norman, Oklahoma; CRUM, AND SMITH—NOAA/WSR-88D Radar Operations Center, Norman, Oklahoma; DEL GRECO—NOAA/National Climatic Data Center, Asheville, North Carolina; LAKSHMIVARAHAN—School of Computer Science, University of Oklahoma, Norman, Oklahoma; MILLER, RAMAMURTHY, DOMENICO, AND FULKER—University Corporation for Atmospheric Research, Boulder, Colorado*CURRENT AFFILIATION : NOAA/Storm Prediction Center, Norman, Oklahoma+CURRENT AFFILIATION : Sasaki Institute, University of Oklahoma, Norman, Oklahoma
#CURRENT AFFILIATION : Weathernews International, 350 David L Boren Boulevard Suite 1000, Norman, OK 73072@CURRENT AFFILIATION : National Weather Service, Silver Spring, MarylandA supplement to this article is available online (DOI:10.1175/BAMS-88-7-Kelleher)CORRESPONDING AUTHOR: Kevin E. Kelleher, National Severe Storms Laboratory, 120 David L. Boren Blvd., Norman, OK 73072E-mail: [email protected]
The abstract for this article can be found in this issue, following the table of contents.DOI:10.1175/BAMS-88-7-xxx
In final form 25 January 2007©2007 American Meteorological Society

2 JULY 2007|
for its customers. Driven by their various require-ments, this collection of federal and state govern-ment, university, and private sector entities joined together to form the Collaborative Radar Acquisition Field Test (CRAFT) Project. In 2004, after five years of research funded by such programs as NOAA’s High Performance Computing and Communica-tions (HPCC) and Environmental Systems Data and Information Management (ESDIM) programs and a grant from the State of Oklahoma Regents, the project was transferred into operations.
This paper highlights the evolution of Project CRAFT that led to the NWS decision to implement the NEXRAD Level II central collection functionality across the contiguous United States (CONUS). This decision directly supported recommendation 5 of the National Research Council report “Fair Weather” (NRC 2003), which states, in part, that “the NWS
should make its data and products available in Internet-accessible digital form.” This paper also discusses the present status of CRAFT as NWS moves beyond an initial operating capability (Droegemeier et al. 2005a). The next section gives a technical description of the CRAFT infrastructure, as well as the system design, performance, and reliability considerations. The third section discusses the path to operations and the NWS national implementation of CRAFT. The fourth section describes reliability improvements in data archives, new applications created for data retrieval and visualization, and initial data mining efforts. The fifth section provides a summary of the project and discusses future directions.
TECHNICAL DISCUSSION. The NWS finished commissioning the Weather Surveillance Radar-1988 Doppler (WSR-88D) Next-Generation Weather
Radar (NEXRAD) network as part of a $4.5 billion M o d e r n i z a t i o n a n d Associated Restructuring De ve lopment i n 19 97 (Crum and Alberty 1993; Crum et al. 1998). Today the NEXR AD network
FIG. 1. (top) Radar reflectiv-ity observations taken by the Fort Worth, TX, WSR-88D radar at 1.45° elevation for the tornadic storms of 28 Mar 2000. A tornado hit downtown Fort Worth between 0015 and 0030 UTC. The corresponding forecasts generated by the Advanced Regional Predic-tion System (ARPS) (middle) with and (bottom) without the assimilation of level II radar data, respectively (adapted from Hu et al. 2006b). Storm cell reference points A, B, C, and D are added for con-venience. For the case that uses level II data, the tornadic storm cell responsible for the downtown tornado is marked as A. Good correspondence is found for individual cells in the 1.5-h forecast valid at 0030 UTC, the time of the downtown tornado. Hook echo characteristics are also evident at this time with cell A (Courtesy of Ming Xue).
3JULY 2007AMERICAN METEOROLOGICAL SOCIETY |
consists of 121 radars operated by the NWS, 26 Department of Defense (DOD) radars, 12 Federal Aviation Administration (FAA) radars, and eight support radars.
Raw data collected by each WSR-88D are used to generate four different archive level datasets as described in OFCM (2006) and Crum et al. (1993). The focus of Project CRAFT and this paper is archive level II data, also known as base data (hereafter, we use the terms interchange-ably). Archive level II data are ful l eight-bit preci-sion, full spatial resolution data of all three Doppler moments (radial velocity, reflectivity, and spectrum width) in polar coordinate range gates, for all elevation scans, along with appropri-ate metadata.
Early in the NEXRAD program, the value of full-volume, full-precision level II data for scientific research, training, operations support, and algorithm development was recog-nized, and in 1994 an 8-mm robotic tape cartridge recording system was installed on each radar (Crum et al. 1993). Since 1994, NCDC had been archiving the 8-mm tapes and using the same media to provide level II data to users. However, rapid advances in data transmission, compression, and storage technologies suggested that far better solutions were available and could be implemented with high reliability at reason-ably low cost.
In 1995, NSSL completed development of a system for accessing the level II data in real time over dedi-cated T1 communications circuits called the Radar Interface and Data Distribution System (RIDDS; Jain and Rhue 1995). Before long, it became appar-ent these data were also becoming important for use in numerical weather prediction research (e.g., Lilly 1990; Droegemeier 1997; Xue et al. 2003; Hu et al. 2006a,b; Fig. 1), and that a long-term, reliable level II data archival and distribution system was needed. In response, CAPS and the NSSL joined forces in 1998 with the University Corporation for Atmospheric
Research (UCAR), the University of Washington, and the WSR-88D Radar Operations Center (formerly the Operational Support Facility) to establish Project CRAFT (Droegemeier et al. 1999, 2002). About two years later, the partnership was extended to NCDC.
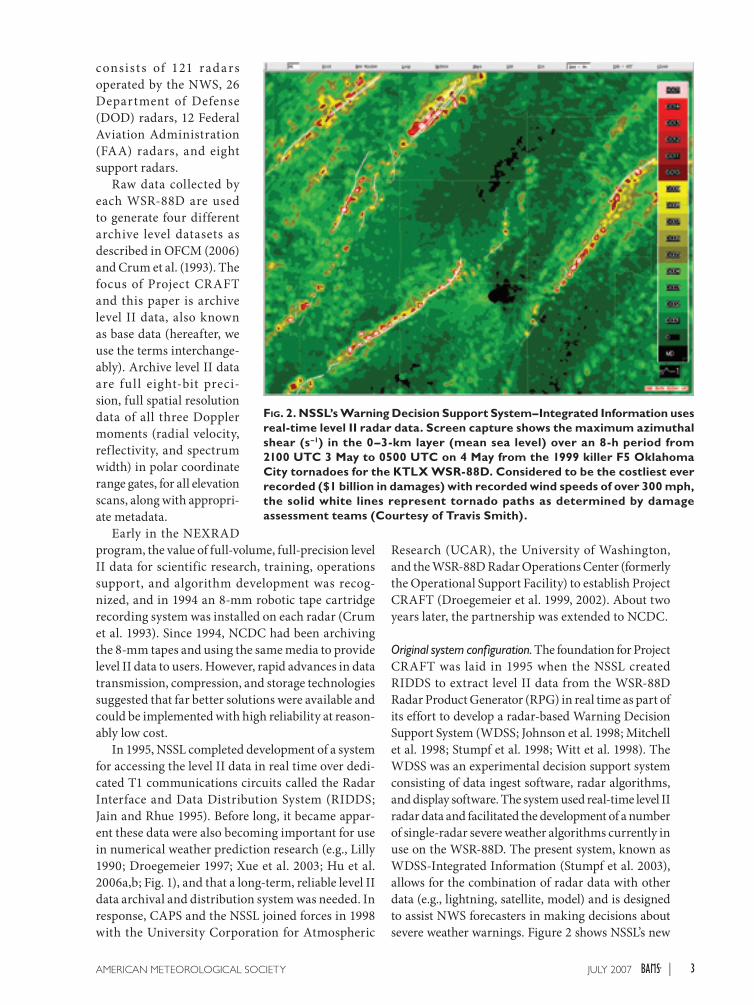
Original system configuration. The foundation for Project CRAFT was laid in 1995 when the NSSL created RIDDS to extract level II data from the WSR-88D Radar Product Generator (RPG) in real time as part of its effort to develop a radar-based Warning Decision Support System (WDSS; Johnson et al. 1998; Mitchell et al. 1998; Stumpf et al. 1998; Witt et al. 1998). The WDSS was an experimental decision support system consisting of data ingest software, radar algorithms, and display software. The system used real-time level II radar data and facilitated the development of a number of single-radar severe weather algorithms currently in use on the WSR-88D. The present system, known as WDSS-Integrated Information (Stumpf et al. 2003), allows for the combination of radar data with other data (e.g., lightning, satellite, model) and is designed to assist NWS forecasters in making decisions about severe weather warnings. Figure 2 shows NSSL’s new
FIG. 2. NSSL’s Warning Decision Support System–Integrated Information uses real-time level II radar data. Screen capture shows the maximum azimuthal shear (s–1) in the 0–3-km layer (mean sea level) over an 8-h period from 2100 UTC 3 May to 0500 UTC on 4 May from the 1999 killer F5 Oklahoma City tornadoes for the KTLX WSR-88D. Considered to be the costliest ever recorded ($1 billion in damages) with recorded wind speeds of over 300 mph, the solid white lines represent tornado paths as determined by damage assessment teams (Courtesy of Travis Smith).

4 JULY 2007|
maximum azimuthal shear algorithm displayed on WDSS-II (Smith and Elmore 2004).
The original RIDDS architecture consisted of a Sun SparcStation 5/110 workstation, located at the RPG and running software developed by the NSSL, which took base data from the WSR-88D wideband 3 port and output it as user datagram protocol packets to an eight-port Ethernet hub. A circular memory buffer on the RIDDS workstation held about one volume scan of data. Until the advent of Project CRAFT, a maximum of eight users could directly access the RIDDS base data by establishing a T1 network connection (1.55 Mb s–1 and usually rather expensive) to the Ethernet hub. By the end of 1999, some 50 RIDDS sites were active around the nation, mostly associated with NSSL’s testing of WDSS.
Project CRAFT sought to enhance the RIDDS capability by 1) using the Internet as a transmission medium for providing real-time base data access to a virtually unlimited number of users; 2) reducing significantly the bandwidth, and thus the cost, of the network connection to the RIDDS computer by imple-menting a real-time, loss-less compression algorithm (i.e., one that outputs an exact copy of the original data after decompression, without any information loss); and 3) developing a system that could be scaled to accommodate larger data streams. The decision to require the system to be scalable was critical given the expected addition of more radars (i.e., potentially all WSR-88Ds), the planned increase in level II data volume per radar (resulting from enhancements to the existing radars such as faster scanning), and the expected data loads from different radars (e.g., dual-polarization, phased-array, FAA Terminal Doppler Weather Radars). One component leading to the success of Project CRAFT was the University of Washington’s implementation of a nonproprietary compression algorithm called bzip2, which, coupled with NSSL’s RIDDS system, linked to an inexpensive personal computer running the UCAR Unidata Local Data Manager (LDM) software, led to the successful real-time transmission of the data to remote users via the Internet. The LDM software (Davis and Rew 1994) has been used by numerous universities, the federal government, and operational centers (Chiswell 1999). It is a distributed system for event-driven data dissemination that acquires data from, and shares them with, other networked computers.
In the original CRAFT system design, the data were transmitted from the RIDDS Sun workstation to a PC, then to an optional $2000 mutiport router and onto a standard 56 Kb s–1 phone line. The phone lines were soon upgraded to 64 Kb s–1 or greater to
accommodate high data rate bursts observed under certain weather conditions during early CRAFT testing (see “Data compression”). In 2002, the NEXRAD agencies completed deployment of the Open Systems Architecture RPG (Saffle and Johnson 1999) developed by NSSL. The new architecture included the Base Data Distribution System (BDDS; Crum et al. 2003b) whose functionality replaced that of the RIDDS and LDM computers in the March 2004 Build 5 RPG software release.
Network design. Project CRAFT also attributes its success to the exploitation of two national network-ing infrastructures, Internet2 and Abilene. Internet2 is a nonprofit consortium of over 200 universities in the United States that works in partnership with industry and government to develop and deploy advanced network applications and technologies. Abilene is a Gb s–1 backbone that supports Internet2 activities by providing a high-speed interconnect among collaborators. Both Abilene and Internet2 are managed by the nonprofit University Corporation for Advanced Internet Development.
The logical networking topology originally envisioned centered on the transmission of base data from all radars to selected sites on the Abilene ring, such as high-priority NOAA facilities, the National Center for Atmospheric Research, and some universities. These sites would serve as hubs or transfer points for the entire data stream. Nodes not linked directly to Abilene (e.g., universities, pri-vate companies, other government facilities) would obtain base data via the commodity Internet for as many radars as the available bandwidth allowed. As networking capabilities continued to expand, band-width limitations on the commodity Internet would likely vanish. The network topology implemented by the NWS in 2004 (Fig. 3) was surprisingly similar to the original concept envisioned when CRAFT began.
Local data management software. Several significant features of local data management (LDM) added to the flexibility of Project CRAFT. One such feature was scalability. LDM has an effectively unlimited number of both data source and data recipient nodes that can be added since each functions as a transmission point. A second feature is a single LDM node that can transmit to multiple other LDM nodes. This capability allowed data from the CRAFT radars to be transmitted simultaneously to OU, NSSL, and NCDC. In the event of a communications failure, a third feature of LDM allowed the LDM PC at the radar site

5JULY 2007AMERICAN METEOROLOGICAL SOCIETY |
to automatically store the data in a local data buffer and retransmit up to four days worth of backlogged level II data when commu-nication was reestablished. Additional storage was possible by simply increas-ing the capacity of the local PC disk.
Data compression. Efficient real time compression of the level II data was a key component to the success of CRAFT. Compression was needed to reduce the net-work bandwidth necessary to transport these data, reduce t he a ssoc iated communications costs, and reduce storage require-ments for long-term archives at NCDC. A typical WSR-88D generates compressed level II data at rates between 22 (in clear air surveillance mode) and 77 Kb s–1 [during the fastest volume coverage patterns (VCPs) 12 and 121] or approximately 0.5 TB yr–1, worst case (OFCM 2006). Details of the CRAFT level II data compression may be found in the supplement, available online at http://dx.doi.org/10.1175/BAMS-88-7-Kelleher. Although additional steps were taken to enhance the compression of the bzip2 algorithm, such as removing all data located higher than 70,000 ft above the radar, data from certain weather events containing high gradients in the moment data (e.g., squall lines and mesoscale convective systems with deep anvil echoes) and fast VCPs (12 and 121) did not compress sufficiently to meet the CRAFT 56 Kb s–1 bandwidth. As a result, the NWS chose to double the bandwidth used during the CRAFT project, from 56 to 128 Kb s–1 per radar, for the national implementa-tion (Crum et al. 2003a).
Network simulation. The need to ensure the CRAFT network design was scalable became important as the number of radars increased. The CRAFT network was built upon the LDM hierarchical model using the high bandwidth Abilene backbone for data transmis-sion. Computations showed that if the entire NWS network of 121 radars was added to CRAFT, only a very small fraction of the Abilene network would be used. However, questions still remained regarding the scalability of the local bandwidth (between the radar site and the Abilene network), the system software
and hardware (design used to collect and transmit the data), and the factors that determined the data latency. A network simulation model was employed to help find answers to these questions.
The simulation was done using freeware software called Network Simulator (NS; Network Simulator Web site www.isi.edu/nsnam/ns), an object-oriented, discrete event-driven network simulator developed at the University of California. The NS is capable of simulating both local and wide area networks.
The NS was used to examine three CRAFT network properties: 1) bandwidth, 2) local buffer, and 3) latency (which determines overf low queue length). The bandwidth study examined whether the capacity of the transmission circuit was correctly sized to accommodate maximum data loads, other-wise data were queued in a local buffer. The local buffer examined whether the buffer size was ad-equate for storing several days’ worth of data before unrecoverable data loss occurred. Latency exam-ined the delay in the packet transfer, which was an important key to deciding the usability of the level II data in real time. (Details may be found online in the electronic supplement at http://dx.doi.org/10.1175/BAMSxxxxxxxx.) In summary, latencies caused by insufficient bandwidth during prolonged stormy weather events (high data rates) were substantial and unacceptable for a real-time network that is expected to perform well under such conditions. Therefore, these network simulation results sup-ported the NWS decision to double the bandwidth per radar site for the national implementation of the CRAFT-like technology.
FIG. 3. Shown is the NWS WSR-88D level II Data Collection and Distribution Network configuration at the time the system became fully operational in 2004 (courtesy of Tim Crum and Jami Casamento from NWS).

6 JULY 2007|
TRANSFERRING CRAFT TO OPERATIONS. The NWS allocates resources based upon require-ments. Therefore, it had to be demonstrated that CRAFT technology would help NWS meet its require-ments before investments would be made by the NWS to make CRAFT-like technology operational. NWS had an ongoing requirement to archive level II data. However, it was clear that by 2004 the 8-mm tape recording system in use at that time would become logistically unsupportable. The CRAFT approach not only offered an alternative to the legacy 8-mm tape approach at approximately the same program cost, but also offered higher data archival rates. In addition, the proposed real-time data collection and distribution network would meet a newly emerging NWS requirement for real-time numerical model initialization for which data latency was a key factor. By choosing the previously described network archi-tecture, NWS was able to deliver level II data with a latency that met both the NWS National Centers for Environmental Prediction (NCEP) requirement of 60 s and the private sector’s request for latencies of 10 s or less. Furthermore, making the real-time level II data readily available without restriction on its use and redistribution would help a wide range of users.
A comprehensive description of the complex policy issues surrounding the implementation Project CRAFT may be found in Gratz (2006). CRAFT was physically implemented by the NWS by increasing the bandwidth of its internal Frame Relay network (NWSnet). The four NWS regional headquarters sites within the CONUS acted as collection points for the radar data using the existing frame relay (Fig. 3). Large LDM servers were installed at each region and were connected to Abilene via a DS3 or OC3 (45 Mb s–1) data circuit. From each regional server, LDM feeds were disseminated to four top-tier distri-bution nodes located at OU, Purdue University, the Education and Research Consortium of the Western Carolinas (ERC) at Asheville, North Carolina, and at an NWS server located at the University of Maryland configured to distribute data to other U.S. govern-ment organizations. The private sector, or any user, may enter into agreements with any of the three distribution entities—OU, Purdue (more informa-tion available online at http://roskilde.eas.purdue.edu/~level2/), or the ERC (more information avail-able online at www.ercbroadband.org/centerpage.php?pagename=wsr-88d). These entities must provide the unaltered data on a cost-recovery fee basis, as per the terms of their agreement with the NWS. An example is the Integrated Radar and Data Services (IRaDS; more information available online
at www.radarservices.org) program set up at OU. As part of the agreement to use the Abilene or Internet2 as the communications backbone to transmit the data, university users have free access to the data via a distribution process managed by Unidata. Government users receive the data through the top-tier site located at the University of Maryland. The NWS Telecommunications Gateway provides the data to NCEP for numerical model initialization.
IMPROVEMENTS IN LEVEL II RADAR DATA ARCHIVAL, RETRIEVAL, AND MINING. The NCDC is responsible for acquisition, archive, and dissemination services for all level II data from both civilian and military WSR-88D systems. Before Project CRAFT, the level II data archive was achieved through the use of 8-mm tapes mailed in 10-tape cases from the radar sites to the NCDC. Each 4.8-GB tape had to be checked for errors. These data were then merged and compressed, at a rate up to 10:1, to an 8-mm archive tape for long-term storage. The original 8-mm tapes received from the radar site were then degaussed and recycled (Fig. 4). In August, 2000, the NCDC began copying 8-mm tape receipts directly to the NCDC robotic mass storage system also known as the Hierarchical Data Storage System (HDSS).
Providing level II data to users from the 8-mm tape library was also expensive and time consuming. Copying the data for one radar site for one day from 8-mm tape took up to four hours. The typical level II data user required data from multiple radar sites over a period of days and the tape-based process took NCDC several days or weeks to fill these orders. Therefore, the cost for the data, especially for use in long-term, large-area climatological studies (e.g., Carbone et al. 2002), could have run into the hundreds of thousands of dollars, far more than can be accommodated by a
FIG. 4. 8-mm tape process and archive prior to August 2000. The data are archived on the NCDC HDSS system.

7JULY 2007AMERICAN METEOROLOGICAL SOCIETY |
typical research grant. Furthermore, no mechanism existed to peruse level II data online or efficiently mine vast amounts of historical data. The cost to maintain the now outdated tape system, both in the field and at the NCDC, exceeded $750,000 yr–1. As a result of these and other limitations, the non-NOAA scientific community, especially universities, had largely avoided using archived level II data for research or education when large numbers of tapes were required. In other words, in many cases the usage did not reflect a lack of interest, but rather a lack of cost-effective and timely access.
One of the principal goals of Project CRAFT was to demonstrate the efficiencies achieved in both time and cost by directly ingesting and archiving level II data at the NCDC, thereby eliminating the increas-ingly expensive and unreliable 8-mm recording technology in use at the time. The CRAFT system has reduced the number of interactive processing steps required for long-term level II data archival at the NCDC from eight to two. As a result, the time required to archive data decreased from several weeks to near–real time. In addition, by removing the need for 8-mm tape recorders, CRAFT elimi-nated the time spent by NWS field personnel record-ing the data, eliminated the associated hardware maintenance costs, and also substantially reduced the requirements for 8-mm tape production at NCDC. This enabled a cost saving at NCDC of over $400,000 yr–1 in labor, supplies, shipping, and 8-mm hardware maintenance.
On average, the NCDC receives over 200 GB of level II data each day, or about 85 TB yr–1 uncompressed. The amount of data received has increased as the number of radars on the data collection network in-creased and with the new VCPs (12 and 121). Through September 2000, the NCDC had archived 77,000 8-mm tapes, with some data available as early as 1991. All of the 77,000 tapes have been migrated to the NCDC mass storage system. Before Project CRAFT (i.e., before 2000), the level II archive for all 121 NWS radars was only 64.9% complete (i.e., relative to the amount of data potentially available from the radars), while the DOD and FAA radar archives were only 35.7% and 9.5% complete, respectively. Consequently, for the entire network of 158 radars prior to CRAFT the archive is only 55.7% complete.
The data archival rate is now over 98%. The direct transfer of level II data to the NCDC HDSS, along with newly available software for user data retrieval via the Web, has dramatically reduced the time required to disseminate the archived data. For example, retrieval time for 20 GB of level II data from
the NCDC mass storage system takes approximately 10 min today compared with 234 h previously that required processing 58 customer tapes at 9 work stations, each running for 26 h (Del Greco 2003).
The NCDC has developed a Web interface to provide direct access to WSR-88D level II digital data products via the radar resources Web page. Users are able to directly access NEXRAD data at no cost via the Web without contacting an NCDC customer service representative. To browse NEXRAD data inventories, the user links to a Graphical User Interface at www.ncdc.noaa.gov/nexradinv and can choose data by clicking on the desired station (Fig. 5) or go to http://has.ncdc.noaa.gov, select the
FIG. 5. (a) All current radar sites in the network for which data are available and (b) a screen capture of the graphical user interface for the NCDC Data Inventory Search application used to retrieve the data.

8 JULY 2007|
level II option, and follow the instructions for dataset retrieval. When data processing is complete, NCDC forwards retrieval instructions to the data requester’s E-mail address.
In an effort to provide better support to these end users, NCDC developed visualization tools for browsing and displaying these data. The NCDC Interactive Weather Radar Viewer and Data Exporter loads level II data and derived products, known as level III, into an Open Geographic Information System (GIS) compliant environment. The applica-tion is launched via Java Web Start and runs on the client machine while accessing these data remotely from the NCDC archive or in near–real time from other servers (Del Greco and Ansari 2005).
The NOAA NCDC Radar Viewer and Data Exporter (Fig. 6) are both written entirely in the Java programming language. There are NCDC radar viewer and exporter instructions on the NCDC Radar Resources Web page at the following URL: www.ncdc.
noaa.gov/oa/radar/jnx/index.html and a tutorial at www.ncdc.noaa.gov/oa/radar/jnx/jnxv-basics.php.
The Weather Radar Viewer and Data Exporter project consists of two programs and an open source Application Program Interface. The software is avail-able free of charge from NCDC. The applications include the Weather Radar Viewer, a visual browser for the data, the Weather Radar Data Exporter, and the Data Export Utility. The entire software package will run on any Java-supported platform including Windows, Macintosh, and Linux. The visualization and data export software supports both the historical NEXRAD data at NCDC and real-time NEXRAD data distributed by the NWS. This allows developers and analysts to perform real-time GIS analysis on all NEXRAD data. The export of images and movies is provided in multiple formats that support the blending of radar data with other types of data.
Additional data visualization capability has been provided by NCDC in collaboration with the National
FIG. 6. Level-II data from Hurricane Charlie at 2103 UTC 13 Aug 2004 processed and displayed using NOAA’s Web-based Weather Radar Toolkit (WRT) located on NCDC’s Web site. The 2D images demonstrate the display of (a) level II reflectivity and (b) radial velocity in the WRT Viewer application along with Web Map Service (WMS) background maps. (c), (d) The 3D images are created in the Paraview and ArcScene software packages using data processed and exported from the WRT.

9JULY 2007AMERICAN METEOROLOGICAL SOCIETY |
Severe Storms Laboratory. NSSL has modified the Interactive Radar Analysis Software visualization software to create a platform independent application available for download at URL: http://lwf.ncdc.noaa.gov/oa/radar/iras.html. The software application allows users to read and display real time and archived level II radar data on platforms supporting Java version 1.3 and higher (Priegnitz 1995).
NSSL utilizes the level II real time data stream for a number of different applications. For example, NSSL creates a national radar mosaic for the CONUS, quality controls the data eliminating undesirable artifacts such as biological targets, ground clutter, and contamination from anomalous propagation (Fig. 7), and produces a quantitative precipitation
estimate every 5 min on a 1 km × 1 km grid, see Fig. 8. Leveraging this capability, radar precipitation climatologies can be derived for specific events or for a season as shown in Fig. 9.
Project CRAFT addressed not only data capture, transmission, and data archival issues, but also data retrieval issues. NSSL and NCDC partnered with the University of Alabama in Huntsville (UAH) to test some techniques for mining the data in antici-pation of the forthcoming need by the data users to extract information from the huge level II archive being built. Researchers at OU had begun a project to identify mesocyclones, areas of rotation in a thunderstorm often associated with tornadoes, using NSSL computer algorithms with the goal of creating
FIG. 7. The results of a radar data quality control (QC) algorithm developed at NSSL for 14 Aug 2006 at 0245 UTC. (a) Composite reflectivity before the QC, and (b) after the QC (courtesy of Ken Howard, Jian Zhang, and V. Lakshmanan).
FIG. 8. NSSL’s National Mosaic of Quantitative precipitation estimates (or NMQ) is produced using real-time level II data and other sensors (e.g., satellite, model, lightning, and rain gauge data) every 5 min on a 1 km × 1 km grid over the CONUS, 0000 UTC 24 Sep 2006. (a) The composite reflectivity product and (b) the corre-sponding hourly rain-rate product used to generate precipitation estimates (courtesy Ken Howard of NSSL).

10 JULY 2007|
a mesocyclone climatol-ogy (McGrath et al. 2002). As pointed out by Stumpf et al. (1998), detection of mesocyclones is important for severe weather forecasts because over 90% of meso-cyclones are accompanied by severe weather such as tornadoes or large hail. The OU researchers used the original NSSL code for their project, which was fast enough to run in real time, but not considered fast with respect to mining gigabytes of data retrospec-tively. Processing the data through the archive tapes looking for mesocyclones took nearly as much time as it would have if it were done in real time. NSSL and NCDC worked to develop faster techniques. They combined resources with researchers at UAH who have had experience mining data from the field of geosciences. The result was the formation of a collaborative group of meteorologists and data mining experts. The study was limited to finding an accurate, yet fast algorithm to detect mesocyclone signatures. Both UAH and NSSL tried different approaches. The approach taken by UAH showed the most promise with a 2× speed-up over NSSL’s fully optimized mesocyclone algorithm. Details may be found online in the electronic supple-ment at http://dx.doi.org/10.1175/BAMSxxxxx.
Building upon this success, NCDC established a memorandum of agreement with the Education and Research Consortium of the Western Carolinas. NCDC plans to leverage ERC computing and disk storage resources to run the mining engines mentioned above to create and make freely available special datasets (e.g., a database of all mesocyclone events) based on mesocyclone signatures.
SUMMARY AND FUTURE DIRECTIONS. One of the principal benefits of the CRAFT methodology, particularly in terms of cost and reliability, was its utili-zation of open source software (e.g., LDM, bzip2, Linux) and existing networking technology (the Internet, Internet2, and Abilene). By February 2003, when the NWS announced plans to adopt the project for all
CONUS and select DOD radars, CRAFT had demon-strated that WSR-88D level II data could be delivered to virtually any user without loss of information content, and at low cost, using existing software and telecom-munications infrastructures for 64 WSR-88D radar sites. It further had demonstrated that the long-term archive of level II data at the NCDC was more effec-tively accomplished via Internet-based transmission rather than 8 mm in situ recording technology. The CRAFT test bed successfully addressed the important issues for sustained operational use, such as net-work reliability, redundancy, and security. For these accomplishments, the NOAA group that transferred the CRAFT prototype to operations was the recipient of the 2004 NOAA Technology Transfer Award.
Today, the NWS’s CRAFT-like operational data distribution system represents a unique source of information for future research in data mining, digital libraries, and distributed storage technology. The architecture provides for not only the expansion to larger datasets via enhancements to the existing WSR-88Ds (e.g., more dense scanning strategies like recently deployed VCPs 12 and 121, possibly super-resolution WSR-88D data in 2008, and possibly dual-polarization capability in 2009), but also for the future inclusion of other radars such as the Terminal Doppler Weather Radar data from the
FIG. 9. Radar reflectivity climatology for the CONUS depicting the percent of time that a 1×1 km pixel contained reflectivity greater 0 dBZ for the period 0000 UTC 14 May 2006 to 2000 UTC 12 Oct 2006. The 43,279 images (volumes) were used to create the climatology. Prior to CRAFT and NMQ creating this high-resolution climatology would have been cost and time prohibitive (courtesy of Ken Howard of NSSL).

11JULY 2007AMERICAN METEOROLOGICAL SOCIETY |
FAA, the National Weather Radar Testbed Phased Array Radar (NWRT PAR; Forsyth et al. 2005), the low-elevation scanning radars proposed by the Collaborative Adaptive Sensing of the Atmosphere Projec t (Droegemeier et al. 2005b), Canadian and Mexican weather radars, or television station radar data. The NWS has added a monitoring capability to the real-time data feed to assist in minimizing network downtime. In 2008, the NWS is consid-ering migrating from the existing network architec-ture (Fig. 3) to one that also includes the NOAANet Backbone and distributed through two hubs, one at the NWS Telecommunications Gateway and the other at the NWS Southern Region Headquarters (Fig. 10). These hubs will continue to send data to the existing four top-tier distribution nodes.
Future plans by NCDC include developing applications to build and export radar products using the latest Web technology including Simple Object Access Protocol, GIS Web Services, and Open-source Project for a Network Data Access Protocol. Emphasis will be placed on interoperability, Open Geospatial Consortium compliance and geophysical community based formats such as Network Common Data Format (NetCDF), Hierarchical Data Format, and the Common Data Model.
Since the implementation of the NCDC direct access web interface for level II data, online requests have increased exponentially, as have requests for large datasets. Customer orders that were primarily from the federal government and universities now include more requests from users in both public and private sectors. Level II data orders that totaled approximately 100 GB yr–1 have increased to terabytes per year, with more than 1 TB accessed each month on average for the last three years.
ACKNOWLEDGMENTS. Project CRAFT is truly a collaborative effort among numerous institutions, and the outstanding collegiality of all involved is without question the reason for its success. In that spirit, the authors gratefully acknowledge the participation of Guy Almes of the Abilene Program and funding received from
the Oklahoma State Regents for Higher Education, the National Science Foundation (NSF) Experimental Program to Stimulate Competitive Research Program, the NSF (Grants ATM91-20009 and ATM99-81130), and NOAA’s NSSL, WSR-88D ROC, NCDC, and the ESDIM and HPCC programs. We recognize Ming Xue of CAPS for the ARPS figure, Mark Benner and Karen Cooper for their tireless work in deploying and maintaining the systems, Harry Edmon for initial adoption of the bzip2 algorithm, Yen Soon Low for his contributions to the network simulation work, and Ken Howard, Jian Zhang, and J. J. Gourley with the NSSL’s Hydrometeorological Group for providing the NMQ and precipitation estimation figures. Several people within NWS played a critical role in the successful transfer of the CRAFT-like technology to a National Weather Service level II Data Collection and Distribution Network. These people include Christina Horvat, WSR-88D Radar Operations Center; Warren Blanchard, NWS Office of Science and Technology; and Jami Casamento, Phil Cragg, and Tom Sandman, NWS office of the Chief Information Officer.
REFERENCESCarbone, R. E., J. D. Tuttle, D. A. Ahijevych, and S. B.
Trier, 2002: Inferences of predictability associated with warm season precipitation episodes. J. Atmos. Sci., 59, 2033–2056.
Chiswell, S. R., L. Miller, and P. Hirschberg, 1999: Toward expanding model data access through Unidata’s Internet Data Distribution System. Preprints, 15th Conf. on Interactive Information and Process-ing Systems for Meteorology, Oceanography, and Hydrology, Dallas, TX, Amer. Meteor. Soc., 441.
FIG. 10. Proposed NWS WSR-88D level II Data Collection and Distribution Network architecture plan for 2008 using the NOAANet Backbone (courtesy of Tim Crum and Jami Casamento from NWS).

12 JULY 2007|
Crum, T. D., and R. L. Alberty, 1993: The WSR-88D and the WSR-88D Operational Support Facility. Bull. Amer. Meteor. Soc., 74, 1669–1687.
—, —, and D. W. Burgess, 1993: Recording, archiving, and using WSR-88D data. Bull. Amer. Meteor. Soc., 74, 645–653.
—, R. E. Saffle, and J. W. Wilson, 1998: An update on the NEXRAD program and future WSR-88D support to operations. Wea. Forecasting, 13, 253–262.
—, D. Evancho, C. Horvat, M. Istok, and W. Blanchard, 2003a: An update on NEXRAD program plans for collecting and distributing WSR-88D base data in near real time. Preprints, 19th Int. Conf. on Interac-tive Information Processing Systems (IIPS) for Meteo-rology, Oceanography, and Hydrology, Long Beach, CA, Amer. Meteor. Soc., CD-ROM, 14.2.
—, and Coauthors, 2003b: Progress in implementing near real time collection, distribution, and archive of WSR-88D level II data. Preprints, 31st Conf. on Radar Meteorology, Seattle, WA, Amer. Meteor. Soc., 945–947.
Davis, G. P., and R. K. Rew, 1994: The Unidata LDM: Programs and protocols for f lexible processing of data products. Proc. 10th Int. Conf. on Interactive Information and Processing Systems for Meteorology, Oceanography, and Hydrology, Nashville, TN, Amer. Meteor. Soc., 131–136.
Del Greco, S. A., 2003: A history for WSR-88D level II data services at the National Climatic Data Center. Preprints, 31st Int. Conf. on Radar Meteorology, Seattle, WA, Amer. Meteor. Soc., 902–906.
—, and S. Ansari, 2005: GIS tools for visualization and analysis of NEXRAD radar (WSR-88D) archived data at the National Climatic Data Center, Preprints, 21st Int. Conf. on Interactive Information and Process-ing Systems (IIPS) for Meteorology, Oceanography, and Hydrology, San Diego, CA, Amer. Meteor. Soc., CD-ROM, J9.6.
Droegemeier, K. K., 1997: The numerical prediction of thunderstorms: Challenges, potential benefits, and results from real time operational tests. WMO Bull., 46, 324–336.
—, and Coauthors, 1999: The explicit numerical prediction of an intense hailstorm using WSR-88D observations: The need for real time access to level II data and plans for a prototype acquisition system. Preprints, 15th Int. Conf. on Interactive Informa-tion and Processing Systems (IIPS) for Meteorology, Oceanography, and Hydrology, Dallas, TX, Amer. Meteor. Soc., 295–299.
—, and Coauthors, 2002: Project CRAFT: A test bed for demonstrating the real-time acquisition and archival of WSR-88D level II data. Preprints, 18th Int. Conf.
on Interactive Information and Processing Systems (IIPS) for Meteorology, Oceanography, and Hydrology, Orlando, FL, Amer. Meteor. Soc., 136–139.
—, J. Martin, C. Sinclair, and S. Hill, 2005a: An Internet-based top-tier service for the distribution of streaming NEXRAD level II data: CRAFT becomes an operational system. Preprints, 21st Int. Conf. on Interactive Information and Processing Systems (IIPS) for Meteorology, Oceanography, and Hydrology, San Diego, CA, Amer. Meteor. Soc., CD-ROM, 11.3.
—, E. S. Godfrey, and D. Fessler, 2005a: The ability of CASA Doppler radars to observe tornadoes: An assessment using tornado damage path width clima-tology. Preprints, Ninth Symp. on Integrated Observ-ing and Assimilation Systems for the Atmosphere, Oceans, and Land Surface (IOAS-AOLS), San Diego, CA, Amer. Meteor. Soc., CD-ROM, 9.2.
Forsyth, D. E., and Coauthors, 2005: Progress report on the National Weather Radar Testbed (phased-array). Preprints, 21st Int. Conf. on Interactive Informa-tion and Processing Systems (IIPS) for Meteorology, Oceanography, and Hydrology, San Diego, CA, Amer. Meteor. Soc., CD-ROM, 19.5.
Gratz, J., 2006: Unlocking the treasure chest of Level-II radar data: Lessons in technology transfer policy for the atmospheric sciences. Preprints, First Symp. on Policy Research, Atlanta, GA, Amer. Meteor. Soc., CD-ROM, 1.6.
Hu, M., M. Xue, and K. Brewster, 2006a: 3DVAR and cloud analysis with WSR-88D Level-II data for the prediction of Forth Worth, Texas, tornadic thunder-storms. Part I: Cloud analysis and its impact. Mon. Wea. Rev., 134, 675–698.
—, —, J. Gao, and K. Brewster, 2006b: 3DVAR and cloud analysis with WSR-88D level II data for the prediction of Fort Worth, Texas, tornadic thunder-storms. Part II: Impact of radial velocity analysis via 3DVAR. Mon. Wea. Rev., 134, 699–721.
Jain, M., and D. Rhue, 1995: WSR-88D’s live data stream now accessible in real-time. NSSL Briefings, Summer 1995, 11. [Available online at www.nssl.noaa.gov/briefings, or from the National Severe Storms Labo-ratory, 1313 Halley Circle, Norman, OK 73069.]
Johnson, J. T., P. L. MacKeen, A. Witt, E. D. Mitchell, G. J. Stumpf, M. D. Eilts, and K. W. Thomas, 1998: The storm cell identification and tracking algorithm: An enhanced WSR-88D algorithm. Wea. Forecasting, 13, 263–276.
Lilly, D. K., 1990: Numerical prediction of thunder-storms—has its time come? Quart. J. Roy. Meteor. Soc., 116, 779–798.
McGrath, K. M., T. A. Jones, and J. T. Snow, 2002: Increasing the usefulness of a Mesocyclone

13JULY 2007AMERICAN METEOROLOGICAL SOCIETY |
climatology. Preprints, 21st Conf. on Severe Local Storms, San Antonio, TX, Amer. Meteor Soc., CD-ROM, 5.4.
Mitchell, E. D., S. V. Vasiloff, G. J. Stumpf, A. Witt, M. D. Eilts, J. T. Johnson, and K. W. Thomas, 1998: The National Severe Storms Laboratory tornado detec-tion algorithm. Wea. Forecasting, 13, 352–366.
NRC, 2003: Fair Weather: Effective Partnerships in Weather and Climate Services. The National Acad-emies Press, Washington, DC, 220 pp.
OFCM, 2006: Doppler radar meteorological obseva-tions, Part A. System concepts, responsibilities, and procedures. Federal Meteorological Handbook No. 11, FCM-H11A-2006, 50 pp. [Available online at www.ofcm.gov/fmh11/fmh11.htm.]
Priegnitz, D. L., 1995: IRAS: Software to display and an-alyze WSR-88D radar data. Preprints, 11th Int. Conf. on Interactive Information and Processing Systems for Meteorology, Oceanography, and Hydrology, Boston, MA, Amer. Meteor. Soc., 197–199.
Saffle, R. E., and L. D. Johnson, 1999: NEXRAD product improvement: Overview of NEXRAD open system plans. Preprints, 29th Int. Conf. on Radar Meteorology, Montreal, QC, Canada, Amer. Meteor. Soc., 51–54.
Smith, T. M., and K. L. Elmore, 2004: The use of radial velocity derivatives to diagnose rotation and divergence. Preprints, 11th Conf. on Aviation, Range, and Aerospace, Hyannis, MA, Amer. Meteor. Soc., CD-ROM, P5.6.
Stumpf, G. J., A. Witt, E. D. Mitchell, P. L. Spencer, J. T. Johnson, M. D. Eilts, K. W. Thomas, and D. W. Burgess, 1998: The National Severe Storms Laboratory mesocyclone detection algorithm for the WSR-88D. Wea. Forecasting, 13, 304–326.
—, T. M. Smith, and C. Thomas, 2003: The National Severe Storms Laboratory’s contribution to severe weather warning improvement: Multiple-sensor severe weather applications. Atmos. Res., 66, 657–669.
Witt, A., M. D. Eilts, G. J. Stumpf, J. T. Johnson, E. D. Mitchell, and K. W. Thomas, 1998: An enhanced hail detection algorithm for the WSR-88D. Wea. Forecasting, 13, 286–303.
Xue, M., D.-H. Wang, J.-D. Gao, K. Brewster, and K. K. Droegemeier, 2003: The Advanced Regional Predic-tion System (ARPS), storm-scale numerical weather prediction and data assimilation. Meteor. Atmos. Phys., 82, 139–170.