project falcon - western power distribution
TRANSCRIPT
www.westernpowerinnovation.co.uk
Project FALCON Meshed Networks
September 2015
Project FALCON
Neither WPD, nor any person acting on its behalf, makes any warranty, express or implied, with respect to the use of any information, method or process disclosed in this document or that such use may not infringe the rights of any third party or assumes any liabilities with respect to the use of, or for damage resulting in any way from the use of, any information, apparatus, method or process disclosed in the document. © Western Power Distribution 2015 No part of this publication may be reproduced, stored in a retrieval system or transmitted, in any form or by any means electronic, mechanical, photocopying, recording or otherwise, without the written permission of the Future Networks Manager, Western Power Distribution, Herald Way, Pegasus Business Park, Castle Donington. DE74 2TU. Telephone +44 (0) 1332 827446. E-mail [email protected].
Meshed Networks 2
Contents Executive Summary ............................................................ 6
1 Project Introduction .................................................... 8
2 Introduction to Technique Trial ................................ 10 2.1 Presentation of Learning 11 2.2 Overview of technique 11 2.3 Implementation limitations 12
3 Design, Construction and Commissioning ................ 14 3.1 Overview of as-installed equipment 15 3.2 Key Learning from Implementation 18
4 Overview of Trial Operations .................................... 25
5 Trial Results and Discussion ...................................... 27 5.1 Trial data 28 5.2 Trial Modelling 32 5.3 Key Learning from Trial Operations 34
6 Cross-technique Comparison .................................... 45
7 Conclusions and Recommendations ......................... 50
Appendices ....................................................................... 52
A Large Format Report Graphics 53 B Initial learning objectives 55 C Trial results 56 D Data Availability 66 E Scaled substation loads 70 F Cable data 74

Project FALCON
Meshed Networks 3
Figures
Figure 1 : Simple mesh trial circuit schematic. 15
Figure 2: Schematic of as-installed Meshed scheme 16
Figure 3 : Simple mesh trial circuit schematic showing location of P141 relays and Sub.net monitors used for monitoring. 17
Figure 4 : typical arrangement of the additional RMU adjacent to existing Distribution substation. 18
Figure 5 : Before and after site photographs at Granby Court. 19
Figure 6 : New distribution substations installed throughout the trial implementation period. 20
Figure 7 : RMU VT compartment. 21
Figure 8 : Simple mesh trial circuit schematic showing measurement locations 29
Figure 9 : Illustration of the scaled load model 31
Figure 10 : Schematic showing cable sizes 32
Figure 11 : Example results chart. 34
Figure 12 : Measured power at the trial circuit NOP. 35
Figure 13 : Measured power throughout Trial Test 3 highlighting periods of demand from the nominal Granby Court feeder loads and nominal Dons Fast Food Feeder loads. 36
Figure 14 : Sketches showing feeder current contribution to load 36
Figure 15 : Measured power throughout Trial Test 3 highlighting periods relating to load sharing approximations. 37
Figure 16 : Measured power throughout Trial Test 3 39
Figure 17 : Measured power throughout Trial Test 3 39
Figure 18 : Measured reactive power over 48 hour trial period 26th June to 28th June. 40
Figure 19 : Measured voltage over 48 hour trial period 26th June to 28th June 42
Figure 20 : THD reported data on both feeders over the trial operational periods 44
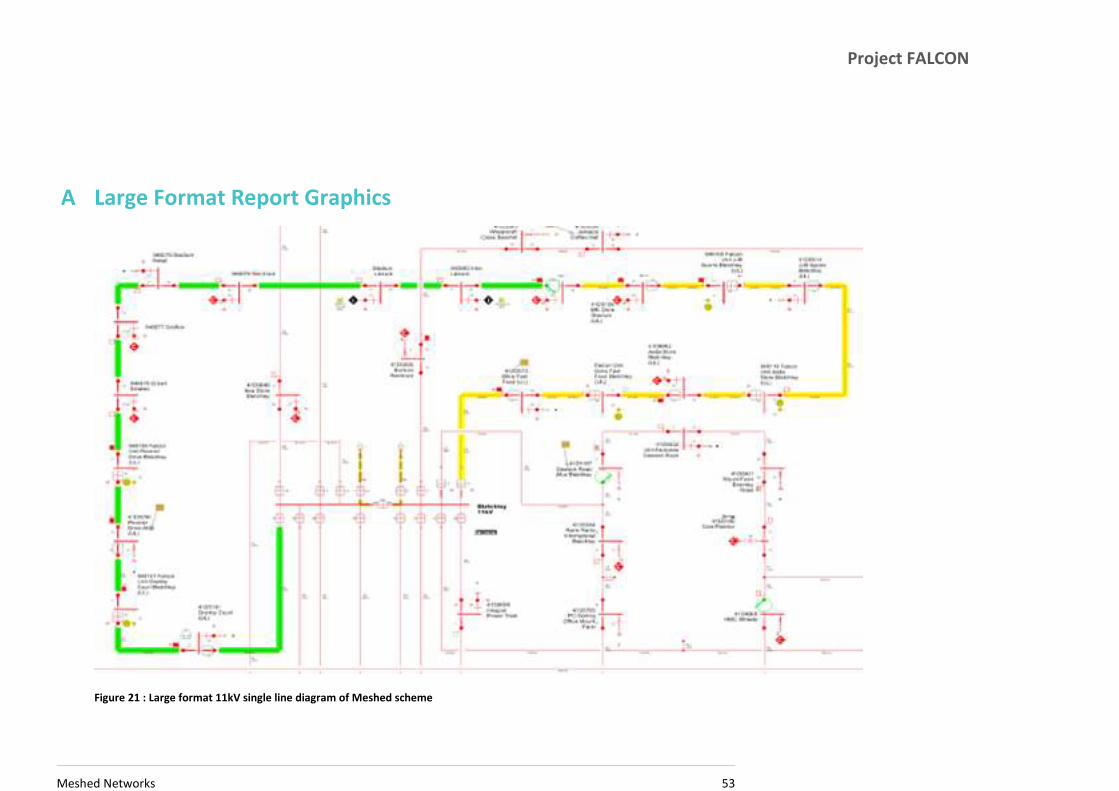
Figure 21 : Large format 11kV single line diagram of Meshed scheme 53
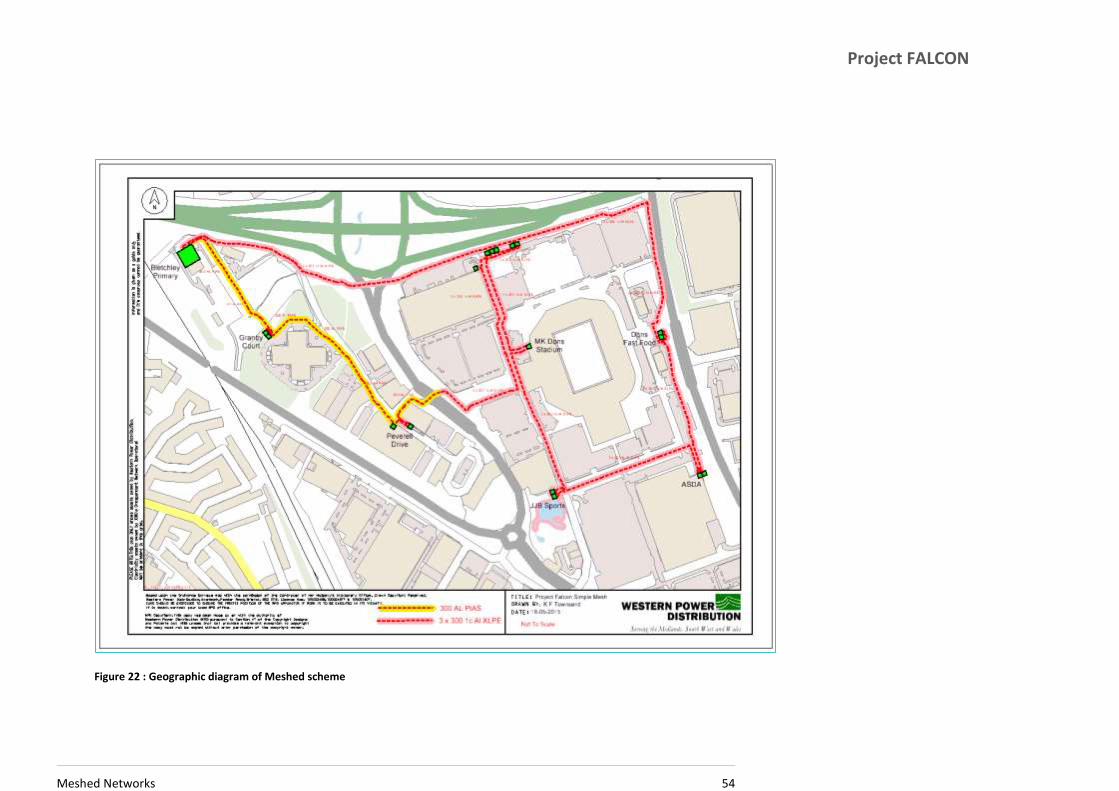
Figure 22 : Geographic diagram of Meshed scheme 54
Figure 23 : Real Power for 6 hour trial data Wed 20th May 56
Figure 24 : Reactive Power for 6 hour trial data Wed 20th May 57
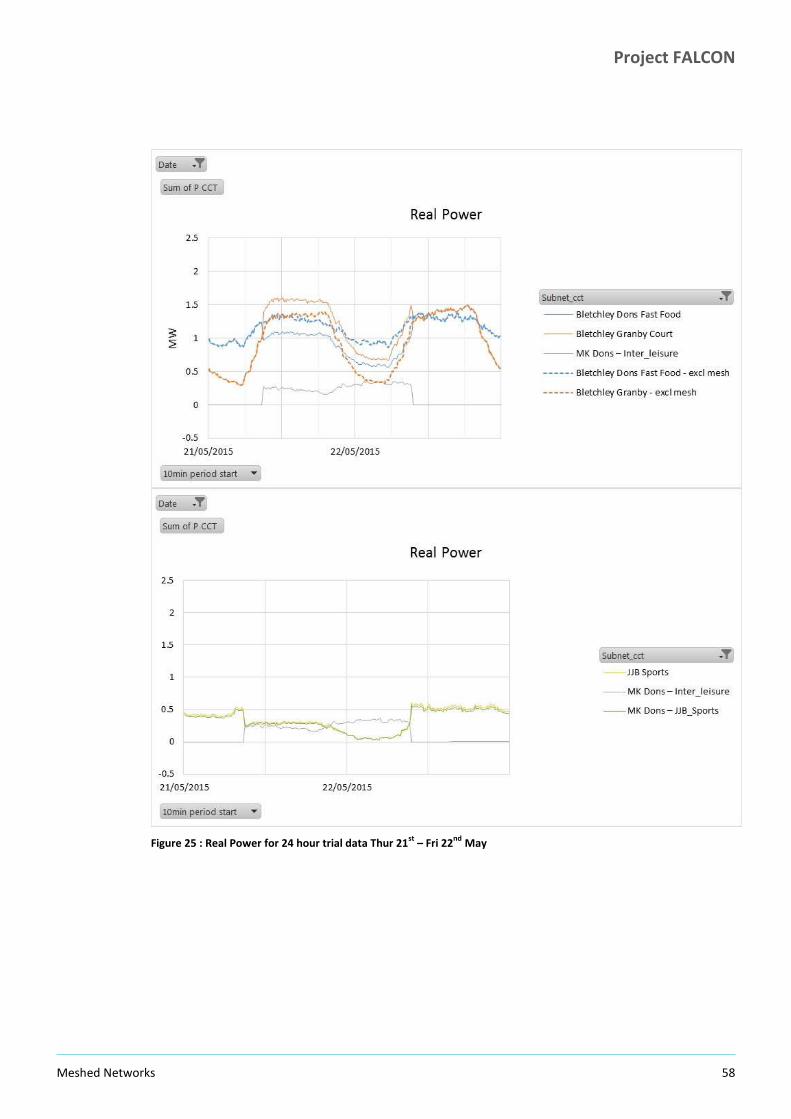
Figure 25 : Real Power for 24 hour trial data Thur 21st – Fri

Project FALCON
Meshed Networks 4
22nd May 58
Figure 26 : Reactive Power for 24 hour trial data Thur 21st – Fri 22nd May 59
Figure 27 : Real Power for 48 hour trial data Tue26th - Thur 28th May 60
Figure 28 : Reactive Power for 48 hour trial data Tue26th - Thur 28th May 61
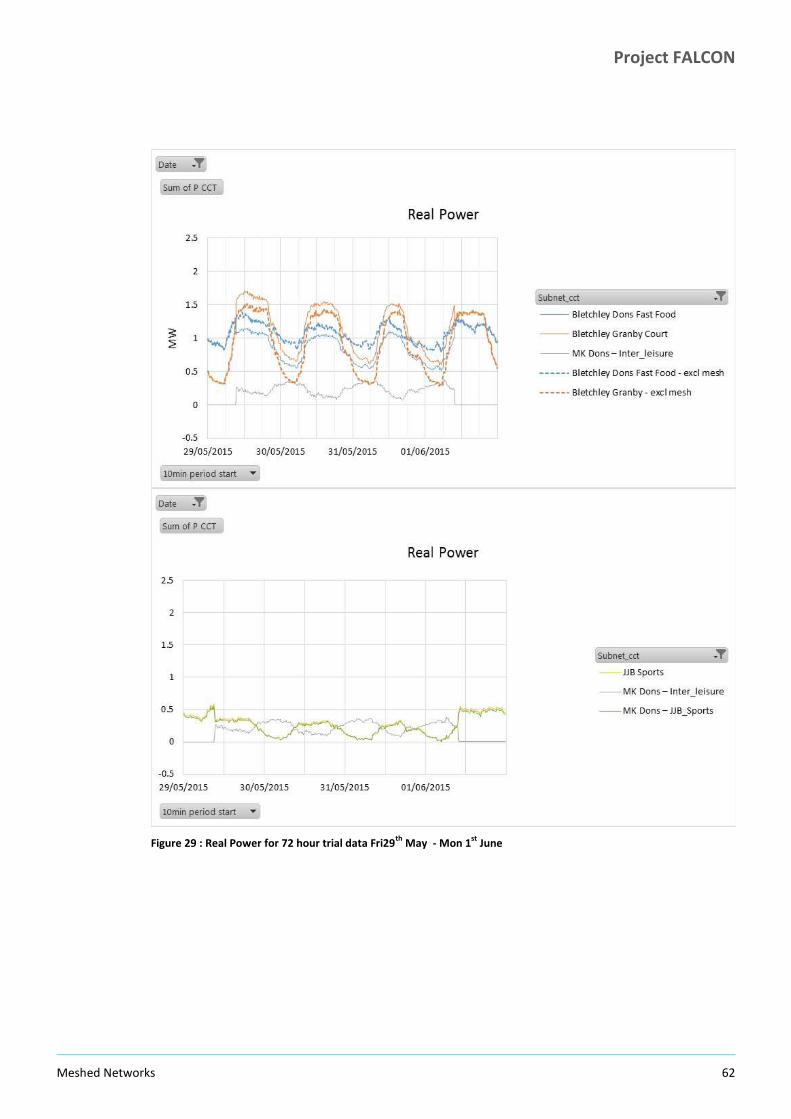
Figure 29 : Real Power for 72 hour trial data Fri29th May - Mon 1st June 62
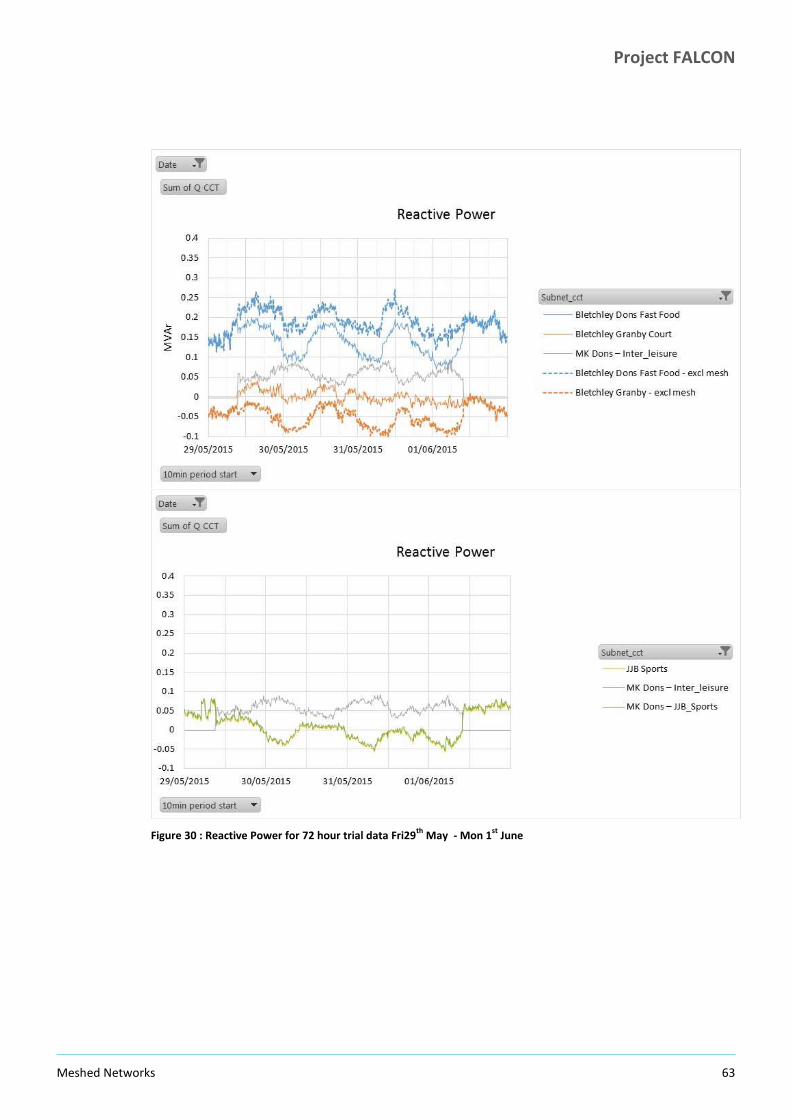
Figure 30 : Reactive Power for 72 hour trial data Fri29th May - Mon 1st June 63
Figure 31 : Reactive Power for 1 week trial data Wed 3rd – Wed 10th June 64
Figure 32 : Reactive Power for 1 week trial data Wed 3rd – Wed 10th June 65
Figure 33 : Comparison of Substation real power loads before and after final scaling for 20th May 2015. 70
Figure 34 : Comparison of Substation real power loads before and after final scaling for 10th June 2015. 71
Figure 35 : Comparison of Substation reactive power loads before and after final scaling for 20th May 2015. 72
Figure 36 : Comparison of Substation reactive power loads before and after final scaling for 6th June 2015. 73
Project FALCON
Meshed Networks 5
Tables
Table 1 : Programme of trials 26
Table 2 : Overview of data sources for each distribution substation. 30
Table 3 : Benefit cross checking 33
Table 4 : Percentage load fed from each substation under different configurations 37
Table 5 : Highest feeder utilisation(1st branch out of primary substation) 41
Table 6 : Highest branch utilisation with actual and assumed network configuration 41
Table 7 : Minimum bus voltage and losses with actual and assumed network configuration 42
Table 8 : losses with actual and assumed network configuration 43
Table 9 : Minimum bus voltage and losses with actual and assumed network configuration 43
Table 10: Cross-technique comparison of impact. 46
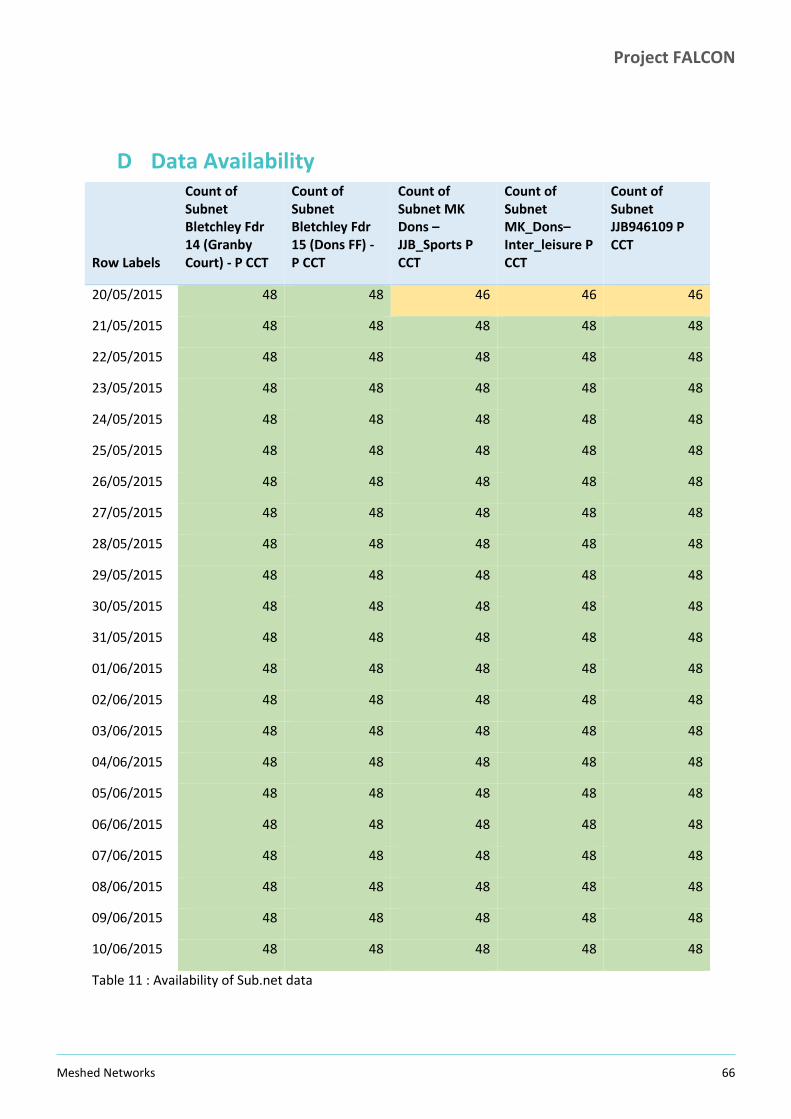
Table 11 : Availability of Sub.net data 66
Table 12 : P141 relay samples achieved. 67
Table 13 : Availability of P141 data. 68
Table 14 : availability of half-hourly settlement data. 69
Table 15 : Circuit data 74

Project FALCON
Meshed Networks 6
Executive Summary With the growth in all types of low carbon generation, such as wind and solar photovoltaic (PV), and the introduction of new demand technologies such as electric vehicles (EVs) and heat pumps, Western Power Distribution’s (WPD) electricity network is expected to see unprecedented swings between peaks and troughs of energy usage in localised areas.
WPD’s Project FALCON has examined a range of innovative alternatives to conventional reinforcement that might be used to mitigate the impact of such energy usage. This was undertaken firstly through physically trialling four engineering and two commercial techniques. Secondly, innovative alternatives where examined through building and operating a software tool. This tool: models the real network under a range of energy use scenarios out to 2050; identifies network constraints that arise over time; employ the studied techniques to mitigate constraints; and assesses impact and benefit.
This report is one of a series describing the engineering technique trials, and focuses on meshing within networks. The mesh engineering technique trial within the FALCON project examined the practice of closing normal open points and demonstrated and explored the potential to relieve technical constraints on the 11kV network. Within the project, meshing was considered as an alternative to conventional reinforcement, the traditional engineering remedy to network constraints.
Based upon the trial findings, meshing will not provide a widespread means of mitigating potential changes in network use as considered by FALCON. However, a recommendation is made on retaining the installed infrastructure to potentially test continuing work on the high-speed performance of the FALCON communications network.
This report contains an introduction to the project, an overview of design installation and commissioning (with costs and learning), a description of key findings and learning from the trial operations, followed by conclusions and recommendations.
The technique trial was composed of: equipment purchase, installation and commissioning; monitoring; pre- and post-operation modelling and validation; operation of assets; and impact assessment.
The mesh trial was changed by high-speed performance shortfalls against pre-trial expectations of the FALCON communications network. Whilst infrastructure to explore the technique was installed as originally envisaged (in parallel with communications infrastructure), an adjusted commissioning and testing scope was run.
Within the trial, no useful improvement in capacity headroom occurred. Whilst the sharing of total circuit load between feeders is entirely predictable, meshing does not necessarily tend to equalise load across feeders, and does not therefore automatically improve capacity headroom.

Project FALCON
Meshed Networks 7
No significant change was seen in circuit voltage or in power quality during mesh test periods, though a 5% improvement in losses was calculated to have occurred. These findings are specific to the trial network, and cannot necessarily be generalised. Network specific modelling is required to assess potential benefit on any candidate network.

Project FALCON
Meshed Networks 8
SECTION 1
1 Project Introduction1
1
This introduction to Project FALCON (Flexible Approaches for Low Carbon Optimised Networks) is common to all the engineering technique Final Reports.
Project FALCON
Meshed Networks 9
With the growth in all types of low carbon generation, such as wind and solar photovoltaic (PV), coupled with the introduction of new technologies such as electric vehicles (EVs) and heat pumps, Western Power Distribution’s (WPD) electricity network is expected to see unprecedented swings between peaks and troughs of energy usage in localised areas. This expected change in nature of customer demand and electricity generation will have an impact on networks nationwide and globally, and provides a significant challenge to WPD, and all electricity network operators.
Part of WPDs approach to this challenge has been look at new flexible ways to design, optimise and manage the network in the future. Project FALCON (Flexible Approaches for Low Carbon Optimised Networks) is designed to help answer these questions and is focussed on the Milton Keynes area 11kV network.
In the past, network operators have used conventional reinforcement to deal with constraints. However, this approach can lead to the solution being over engineered to meet only peak demands; it can also be expensive, disruptive and inefficient. In project FALCON, WPD and its partners are trialling alternative techniques and will assess if they are more flexible, cost effective, quicker to deploy and more effective at managing these new demand requirements than conventional reinforcement. The techniques are:
Dynamic Asset Ratings – Using prevailing weather conditions to run an asset at a rating potentially higher than its name plate to take advantage of, for example, cold temperatures.
Automatic load transfer – load is redistributed between 11kV feeders.
Implementation and operation of a meshed (interconnected) 11kV network.
Deployment of new battery technologies allow the flow of power on the network to be changed as the battery is charged or discharged.
Demand Response services - the use of localised smaller generation and load reduction services that can be provided in the event of a local constraint.
Central to the project is the Scenario Investment Model (SIM) - a new piece of software being developed to assist long term network planning. The SIM performs load flow analysis for the network for 48 half-hourly periods during the day for different days of the week and different seasons of the year. Predicted load patterns extend as far as 2050. A network planner will operate the SIM to help with planning based on load forecasting. When a network planner is running the SIM and a voltage or thermal problem is found, the SIM will select the techniques that could help resolve the problem and determine how they could be applied to the network. The best solution can be selected using a weighted metric that combines elements such as installation and operating costs, network performance, losses and disruption to customers.
This report presents the work undertaken through project FALCON on the meshing of 11kV network.

Project FALCON
Meshed Networks 10
SECTION 2
2 Introduction to Technique Trial
Project FALCON
Meshed Networks 11
2.1 Presentation of Learning Learning Objectives originally associated with this technique are listed in Appendix B. Throughout the document, key learning is presented in a box as follows:
LP # Brief description of learning.
Each piece of trials feedback is referenced as a Learning Point (LP) with a unique number.
2.2 Overview of technique Meshing networks is the process by which circuit breakers on the network are switched in order to feed loads from a multiple of locations. This approach fundamentally allows the load on each feeder in a meshed circuit to deviate according to the routine variations in the connected load, without the need for pre-existing analysis and changes to switch states.
However, simply closing Normal Open Points (NOPs) exposes more connected customers to supply interruption following a network fault. Therefore any planned closure of open points for long term operation is routinely accompanied by the installation of along-the-feeder fault sensing and interruption equipment (protection relays and circuit breakers). The installation of along-the-feeder protection devices restores, and potentially improves (i.e. reduces), the probability of customer interruption under fault conditions with mesh operations.
Meshing is primarily done to improve the security of supply. However, there are other potential benefits that may be expected when considering a meshed network. These benefits could include:
Improved capacity margins,
Voltage regulation,
Increased penetration of distributed generation,
Reduced losses,
Power quality improvements.
There are however disadvantages to meshing and these include increased fault levels and increased complexity of protection and automation, leading to additional cost.
The aim of the trial was to operate the designated trial 11kV networks with parallel feeding arrangements, with protective device driven auto-sectioning zones, and explore:
potential impacts, both benefits and trade-offs, that could be derived from parallel feeder configurations;
Project FALCON
Meshed Networks 12
potential impact, both benefits and constraints, of operation with auto-sectioning zones e.g. possible improvement in Customer Interruptions (CIs) and Customer Minutes Lost (CMLs), balanced against time/effort & cost; and
specific protection arrangements to implement auto-sectioning zones, and their effectiveness.
2.3 Implementation limitations For the Mesh technique (T3), three examples of mesh implementation were initially considered:
a simple mesh example, showcasing the closure of a NOP between two feeders originating from the same primary substation;
a (more) complex mesh example illustrating closure of two NOPs, with three feeders from the same primary substation; and
the interconnection of a single-transformer Primary to a three-transformer Primary, effectively linking one of the three primary transformers with the single transformer site.
Central to the proposed implementation of trials was the use of the FALCON WiMAX (radio) communications infrastructure to provide high-speed tele-protection signalling. This was a significant departure from previous tele-protection approaches that were reliant on pilot cables between devices to carry the communication signals. The retro-fitting of pilot cables to an existing network represents a significant implementation effort and cost. Throughout the project, achieving stability of the FALCON communications network and testing of the high-speed capability has taken considerably longer than expected. As a result, the use of high-speed tele-protection signalling via FALCON WiMAX communications has been removed from the trial implementation2.
Therefore, the implementation of the Mesh trials was correspondingly changed for the simple mesh trial, to use conventional protection techniques via the originally intended plant and equipment. This change allows the essential potential of meshing (with two zone isolation) to be explored through the trials, and meshing learning to be gained as intended. Clearly the learning associated with the high speed tele-protection was limited to highlighting the difficulties of achieving necessary communication speeds with the architecture of the installed communications system.
The removal of the high-speed tele-protection also led to the removal of the complex mesh and primary mesh examples from the trials as these were specifically reliant on the high-speed tele-protection functionality. Implementation was phased such that the plant associated with the mesh technique was installed and made live at the time that the communications infrastructure was being rolled out, and ahead of high-speed testing. As a result, technique trial costs included equipment that was latter not actively used in trial
2
Reference December 2014 Six Month Report

Project FALCON
Meshed Networks 13
testing, though the installed additional switchgear and remote control have improved potential network performance under fault conditions (i.e. more customers can be restored in short times following a fault).
LP 1. It is recommended that the option to re-open testing of high-speed tele-protection at some stage in the future is been maintained and the equipment has been left in a mothballed state.
The trial therefore consisted of:
1. Installation of circuit breakers and associated protection on an urban two feeder mesh fed from the same primary;
2. Installation of monitoring devices;
3. Monitoring;
4. Closing of open point;
5. Modelling;
6. Impact Assessment.

Project FALCON
Meshed Networks 14
SECTION 3
3 Design, Construction and Commissioning

Project FALCON
Meshed Networks 15
3.1 Overview of as-installed equipment The FALCON Trials simple mesh network comprised of feeders 14 (Granby Court) and 15 (Dons Fast Food) from Bletchley 33/11kV substation. These feeders are connected at the normal open point (NOP) at MK Dons Stadium distribution substation. The network schematic is shown in Figure 1 and also shown as the HV diagram in Figure 21, and geographically as Figure 22 (Appendix A, page 53).
Figure 1 : Simple mesh trial circuit schematic.
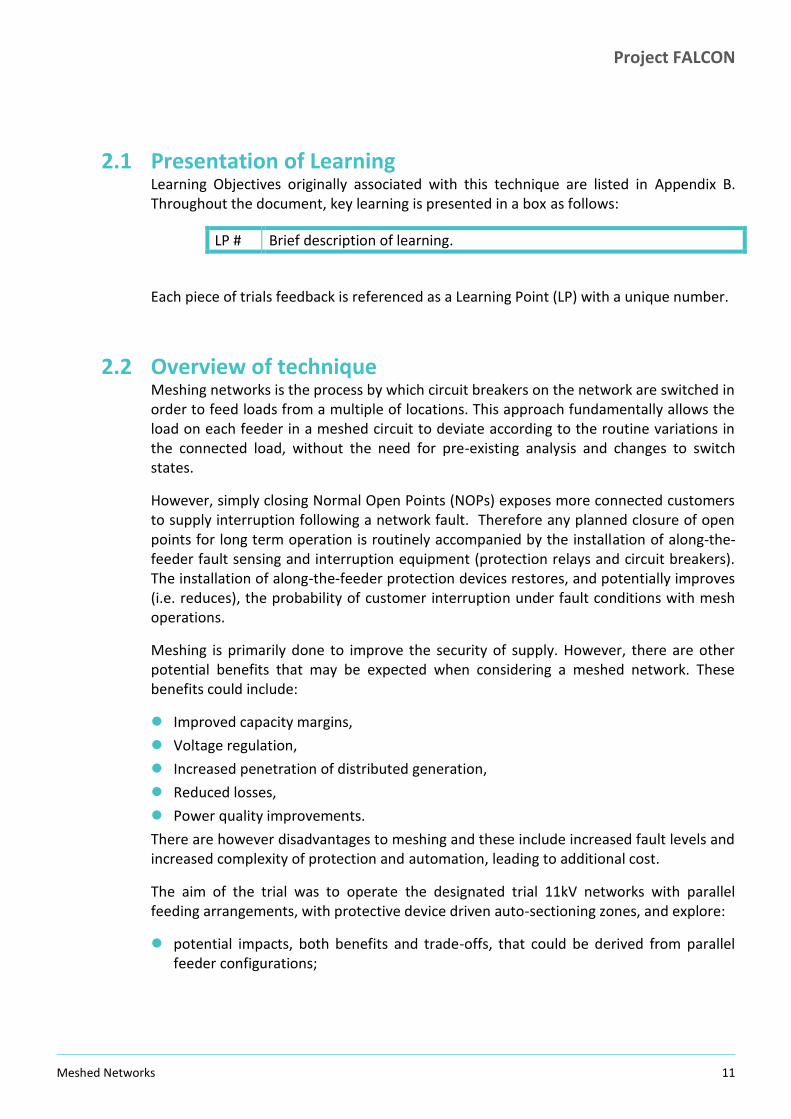
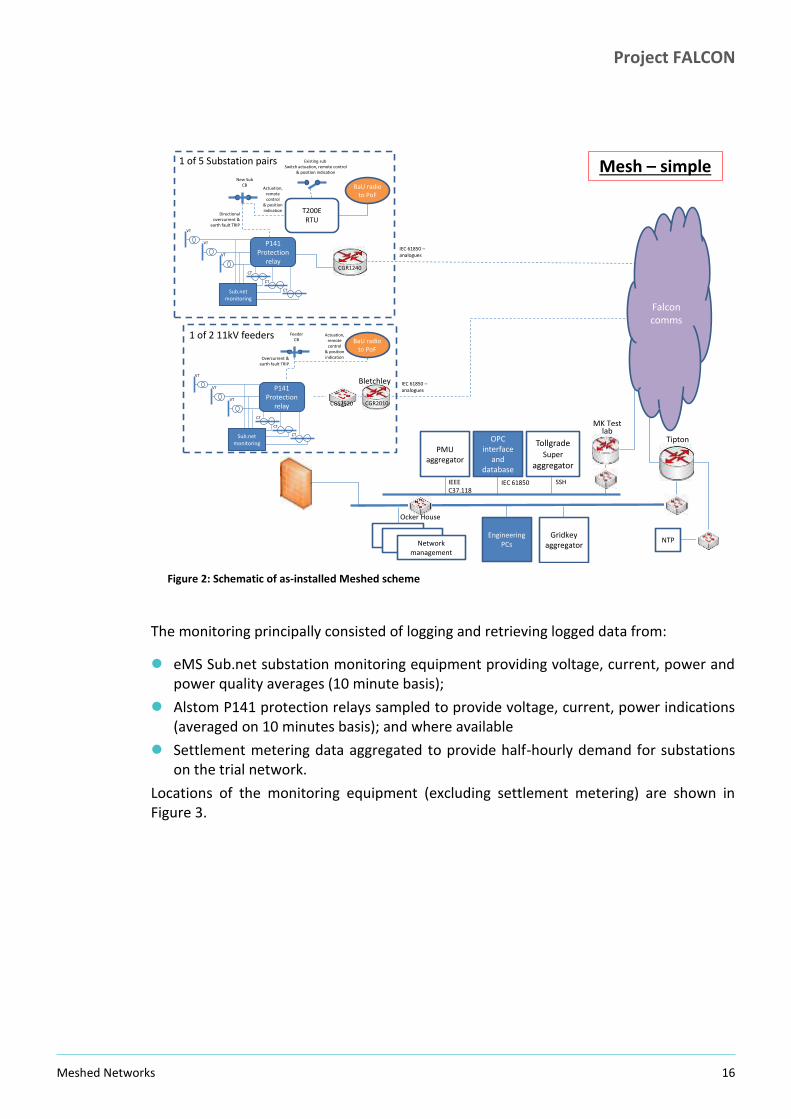
An overview of revised monitoring and control arrangements for the simple mesh scheme is shown in Figure 2.
Project FALCON
Meshed Networks 16
Figure 2: Schematic of as-installed Meshed scheme
The monitoring principally consisted of logging and retrieving logged data from:
eMS Sub.net substation monitoring equipment providing voltage, current, power and power quality averages (10 minute basis);
Alstom P141 protection relays sampled to provide voltage, current, power indications (averaged on 10 minutes basis); and where available
Settlement metering data aggregated to provide half-hourly demand for substations on the trial network.
Locations of the monitoring equipment (excluding settlement metering) are shown in Figure 3.
Mesh – simple
Falcon comms
MK Test lab
AirspanNMS Network
management
NTP
TollgradeSuper
aggregator
Gridkey aggregator
Tipton
Ocker House
IEEE C37.118
OPC interface
and database
SSH
PMU aggregator
IEC 61850
New SubCB
CGR1240
Existing sub Switch actuation, remote control
& position indication
T200ERTU
1 of 5 Substation pairs
Actuation, remote control
& position indication
Directional overcurrent &
earth fault TRIP
BaU radio to PoF
IEC 61850 –analogues
FeederCB
Overcurrent &earth fault TRIP
1 of 2 11kV feeders Actuation, remote control
& position indication
BaU radio to PoF
CGR2010
Bletchley
CGS2520
IEC 61850 –analogues
VT
VT
VT
CT
CT
CT
P141Protection
relay
Sub.netmonitoring
VT
VT
VT
CT
CT
CT
P141Protection
relay
Sub.netmonitoring
Engineering PCs
Project FALCON
Meshed Networks 17
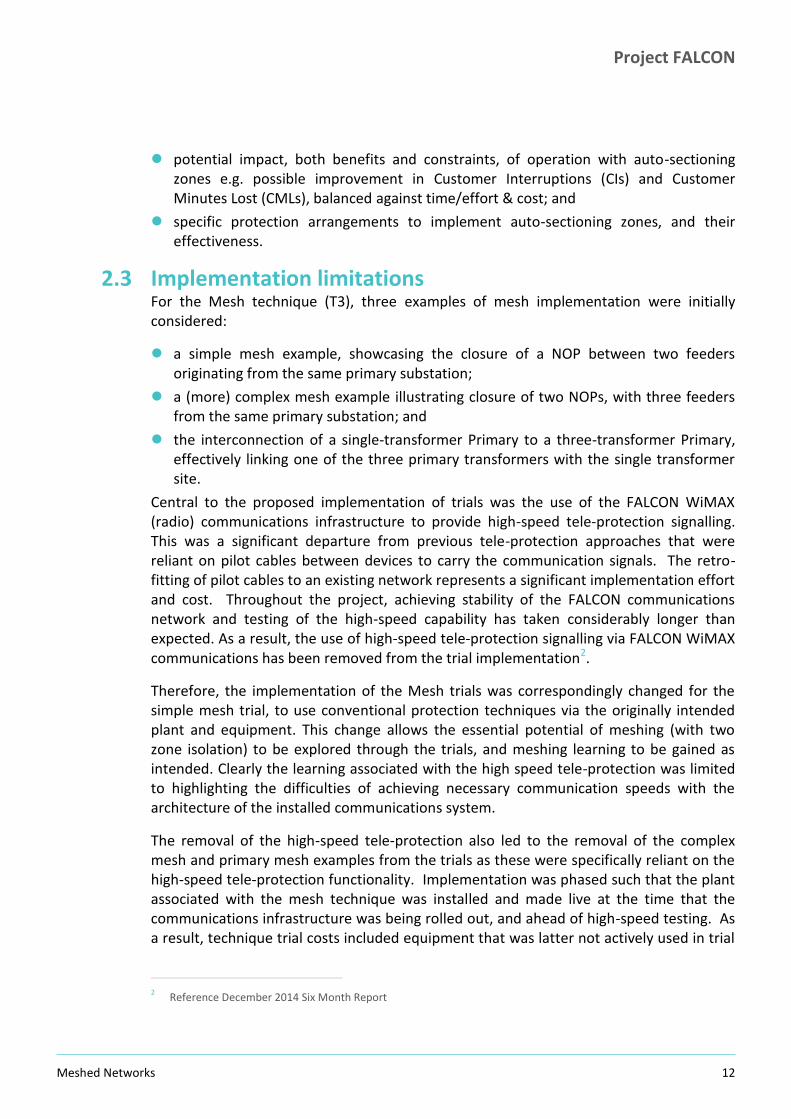
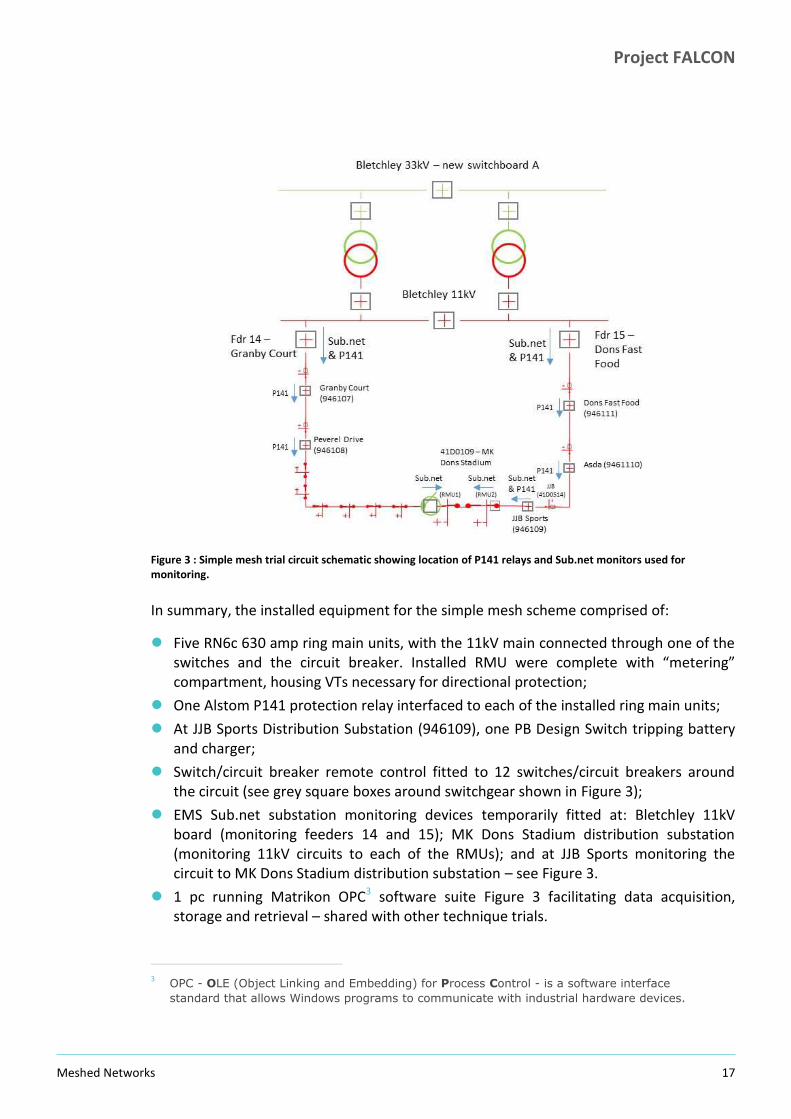
Figure 3 : Simple mesh trial circuit schematic showing location of P141 relays and Sub.net monitors used for monitoring.
In summary, the installed equipment for the simple mesh scheme comprised of:
Five RN6c 630 amp ring main units, with the 11kV main connected through one of the switches and the circuit breaker. Installed RMU were complete with “metering” compartment, housing VTs necessary for directional protection;
One Alstom P141 protection relay interfaced to each of the installed ring main units;
At JJB Sports Distribution Substation (946109), one PB Design Switch tripping battery and charger;
Switch/circuit breaker remote control fitted to 12 switches/circuit breakers around the circuit (see grey square boxes around switchgear shown in Figure 3);
EMS Sub.net substation monitoring devices temporarily fitted at: Bletchley 11kV board (monitoring feeders 14 and 15); MK Dons Stadium distribution substation (monitoring 11kV circuits to each of the RMUs); and at JJB Sports monitoring the circuit to MK Dons Stadium distribution substation – see Figure 3.
1 pc running Matrikon OPC3 software suite Figure 3 facilitating data acquisition, storage and retrieval – shared with other technique trials.
3
OPC - OLE (Object Linking and Embedding) for Process Control - is a software interface
standard that allows Windows programs to communicate with industrial hardware devices.
Project FALCON
Meshed Networks 18
Further details of the installed equipment and connection arrangements are shown in Appendix A.
3.2 Key Learning from Implementation
3.2.1 Technique-Specific Learning
LP 2.
The chosen way to retrofit circuit breakers to an 11kV circuit is a balance between cost, disruption and available space; and is always likely to be a compromise. For the technique trial, the implementation of additional switchgear (minimising customer disruption) was appropriate. If this technique were to be rolled out, a further cost assessment of alternative approaches would be appropriate.
In order to create additional automatic isolation points on the network it was necessary to install automatic circuit breakers either by replacing some of the existing switches with circuit breakers or by installing additional circuit breakers in the circuit adjacent to existing substations.
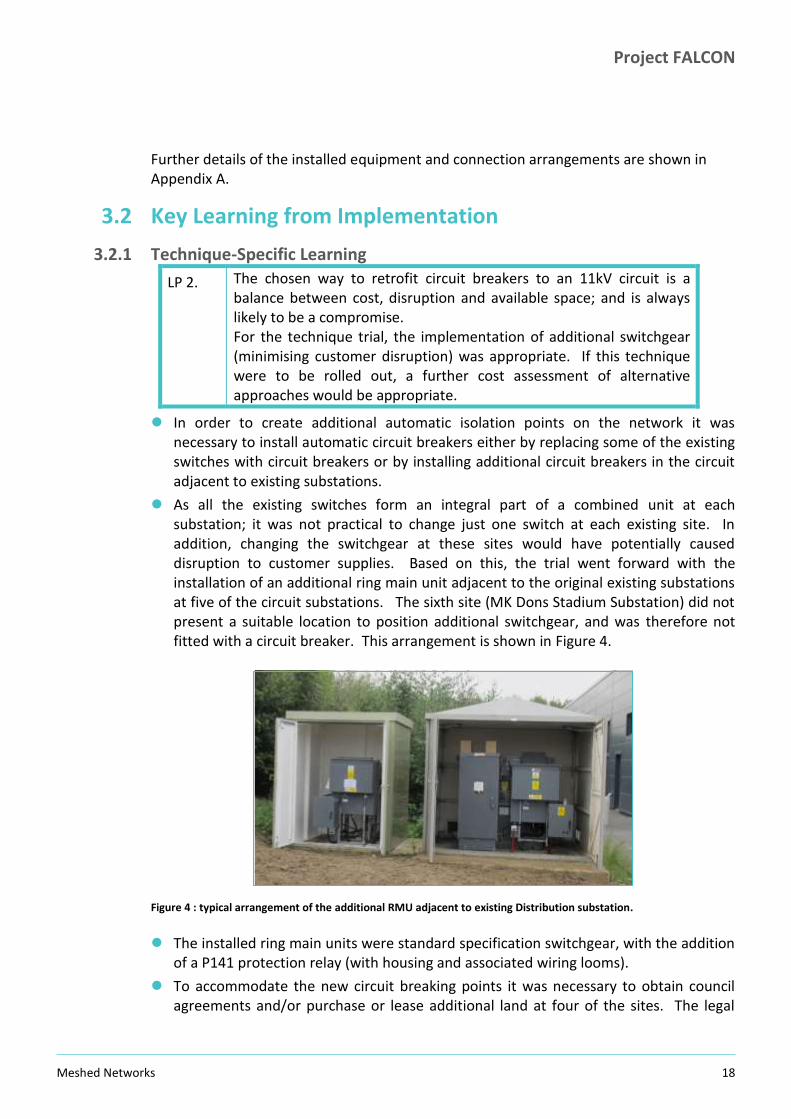
As all the existing switches form an integral part of a combined unit at each substation; it was not practical to change just one switch at each existing site. In addition, changing the switchgear at these sites would have potentially caused disruption to customer supplies. Based on this, the trial went forward with the installation of an additional ring main unit adjacent to the original existing substations at five of the circuit substations. The sixth site (MK Dons Stadium Substation) did not present a suitable location to position additional switchgear, and was therefore not fitted with a circuit breaker. This arrangement is shown in Figure 4.
Figure 4 : typical arrangement of the additional RMU adjacent to existing Distribution substation.
The installed ring main units were standard specification switchgear, with the addition of a P141 protection relay (with housing and associated wiring looms).
To accommodate the new circuit breaking points it was necessary to obtain council agreements and/or purchase or lease additional land at four of the sites. The legal

Project FALCON
Meshed Networks 19
processes were protracted and caused significant delays compared to initial expectations. A simple example of this is at the Granby Court site. This existing substation is set amid a spinney and although there was ample room adjacent to establish the FALCON circuit breaking station a certain amount of shrub clearance and ground work was required to create concrete plinth. The land required was owned by the council and, although there was no objection to the proposals, the council’s legal process was protracted. Once the time required to achieve full legal agreement was appreciated, a simple letter of intent was negotiated and issued by the Council, allowing work to proceed ahead of full legal agreements being in place. See before and after site photographs in Figure 5.
Figure 5 : Before and after site photographs at Granby Court.
LP 3.
The passage of time between design and implementation increases the risk of business-as-usual network development occurring, potentially skewing the intended scheme
There has been significant development in the area serviced by the mesh trial circuit. Consequently during the delays for planning and legal completion a further 6 substations were commissioned, making a total of 13 substations on the mesh trial circuit. Consequently one of the original zones now contains multiple substations, which was not the initial intent. The additional substations exist between Peverel Drive and MK Dons Stadium substations, as shown shaded in blue in Figure 6.

Project FALCON
Meshed Networks 20
Figure 6 : New distribution substations installed throughout the trial implementation period.
LP 4.
Ongoing development of the network (as exemplified above) will necessitate review of more complex protection arrangements associated with meshed circuits.
Changes to network potentially makes any existing mesh protection arrangements sub-optimal or even invalid;
Therefore additional load/generation connected to meshed network would require a further design effort, potentially utilising protection design resources.
LP 5.
The installed 3 phase VTs (for directional protection) are not a common item on the network. These require disconnection to allow pressure testing (post fault activity), and additional marking of the HV diagram, and the central network control system is required to ensure this happens. Whilst appropriate for the technique trial, any rolled-out switch gear (see LP 3) should consider this requirement.
The resultant three single phase VTs (star-star) offer a low impedance earth path under pressure testing, and require the disconnection of the VTs for such testing. Whilst this is practicable, it is not ideal as the connections are bolted, with a closed
Bletchley 11kV
Fdr 15 –Dons Fast Food
Fdr 14 –Granby Court
Bletchley 33kV – new switchboard A
Dons Fast Food (946111)
Dons Fast Food (41D0573)
Asda (9461110)
Asda(41D9992)
Inter Leisure (945983)
Stadium Leisure
(946122)
Redmoor(946078)
Granby Court (946107)
Granby Court (41D5191)
Peverel Drive (946108)
Peverel Drive (41D5290)
Stadium Retail
(946079)
Grafton (946077)
Crown Estates (946076)
JJB Sports (946109)
JJB(41D0514)(RMU1)
41D0109 – MK Dons Stadium
(RMU2)
Project FALCON
Meshed Networks 21
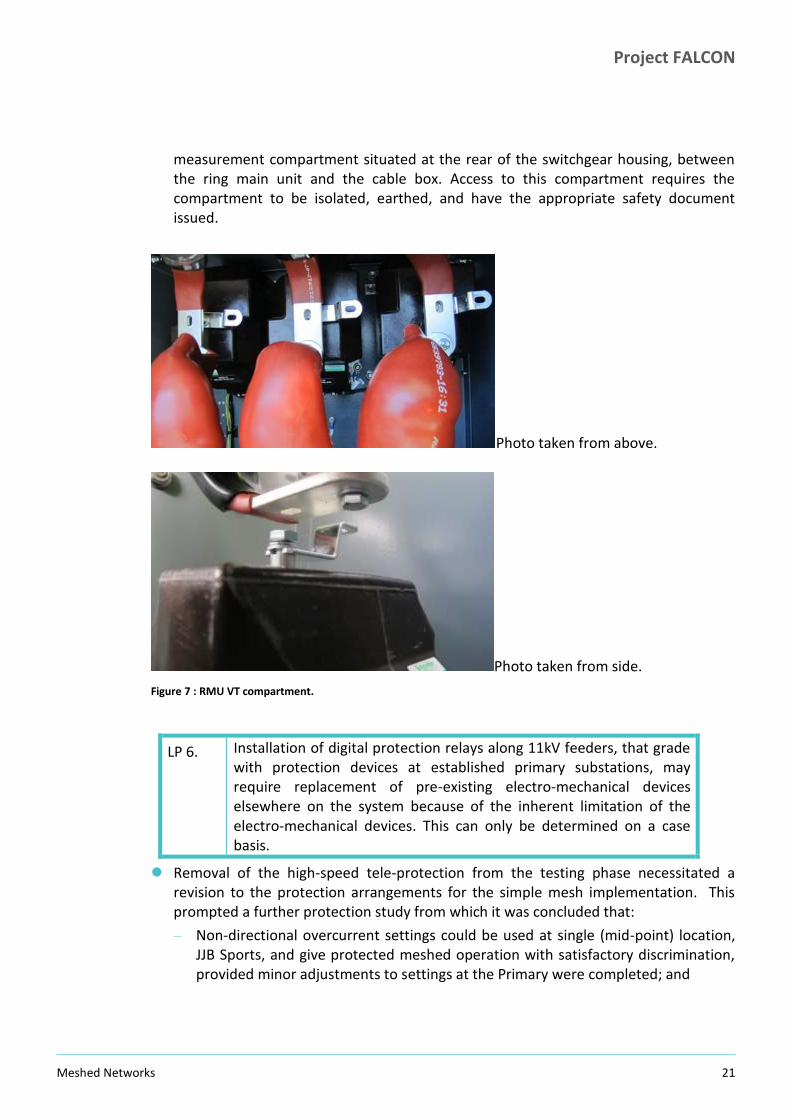
measurement compartment situated at the rear of the switchgear housing, between the ring main unit and the cable box. Access to this compartment requires the compartment to be isolated, earthed, and have the appropriate safety document issued.
Photo taken from above.
Photo taken from side.
Figure 7 : RMU VT compartment.
LP 6. Installation of digital protection relays along 11kV feeders, that grade with protection devices at established primary substations, may require replacement of pre-existing electro-mechanical devices elsewhere on the system because of the inherent limitation of the electro-mechanical devices. This can only be determined on a case basis.
Removal of the high-speed tele-protection from the testing phase necessitated a revision to the protection arrangements for the simple mesh implementation. This prompted a further protection study from which it was concluded that:
– Non-directional overcurrent settings could be used at single (mid-point) location, JJB Sports, and give protected meshed operation with satisfactory discrimination, provided minor adjustments to settings at the Primary were completed; and

Project FALCON
Meshed Networks 22
– Whilst settings were found for directional protection at three locations (achieving four-zone sectioning via conventional protection), there was not sufficient confidence in discrimination between digital protection relays installed along the 11kV feeder, and some of the electro-mechanical relays installed at the primary substation.
As a result, the simple mesh implementation was commissioned with a single protection/circuit breaker point that would open under fault conditions, essentially returning the circuit to open ring operation, where upon the appropriate source breaker would open to clear the fault. .
LP 7. The implemented protection arrangements successfully maintained customer security (in this simple mesh example), and allowed testing of mesh technique benefits to be undertaken.
LP 8. Installation of highly functioned digital protection relays along 11kV feeders, may necessitate installation of supply/tripping batteries and chargers. This adds complexity and maintenance cost to the system.
Completion of the as-installed protection arrangements at the mid-point also included the commissioning of a 110V tripping battery to power the relay and provide tripping supplies under fault conditions. This was a departure from routine along-the-11kV-feeder protection arrangements that incorporate self-powered protection relays.
LP 9. Installation was comfortably achieved within requirements of the Distribution Safety Rules.
3.2.2 Generalised and Cross-Technique Learning The following points of learning have been found across more than one technique. They are presented with examples specific to the mesh technique.
LP 10.
Design and specification work stopped at a high level (as is usual for 11kV distribution equipment), leaving a significant and initially unrecognised volume of work and problem solving for the commissioning/early operation phase. This applied to all the engineering techniques. Sophisticated equipment at Distribution Substations may require similar levels of engineering design to the primary system. These functions may need expanding to cope with additional volumes.
Initial design work did not specify how the P141 relay supply was to be derived at the 11kV distribution substations; and

Project FALCON
Meshed Networks 23
Modelling of the mesh operations (to assess impact) requires an accurate load model. Initial design work did not include provision of LV monitoring at substations associated with the technique.
LP 11.
FALCON established that traditional approaches to Factory Acceptance Testing (FAT) may not be adequate for innovation projects. The use of conventional FAT approaches may necessitate rework at the install / commissioning stages.
Whilst the RMUs were supplied with P141 relays connected and tested, they were tested with overcurrent settings only.
Fuller FAT of the units including primary injection testing of CTs and VTs, with directional protection settings (i.e. tested for the full service requirement) could have highlighted a VT issue before the units left the factory.
FAT was carried out in line with the equipment being standard to the distribution business. However, the addition of the P141 relay with the intent of operating directional protection was not standard, and would have benefited from a fuller FAT approach.
LP 12.
There are potentially significant benefits from considering an alternative to a traditional build-commission-test approach within innovation projects/programmes.
For example, Mesh could have been approached as:
– Model the network (including load modelling) and manually test (i.e. close NOP with standby engineer present in case of network fault) to prove outline benefits case;
– Based on positive outline benefits, specify/develop and install appropriate circuit sectioning/protection arrangements for long term operation; and
– Complete enhanced testing with long term operational equipment.
LP 13.
FALCON demonstrated the importance of establishing measurement and data strategies as part of the programme design phase to help prove the technique hypothesis being trialled.
Modelling of the mesh operations (to assess impact) requires an accurate load model. Initial design work did not include provision of LV monitoring at substations associated with the technique.
LP 14.
Control room interaction with the technique was light. Essentially the trial was carried out as a switching schedule, where the NOP was remotely opened by the control room, once running conditions of the network were checked as required. More complicated control room interaction would be required if this were adopted as a BAU technique.

Project FALCON
Meshed Networks 24
LP 15.
Limited training of operational staff was required/undertaken to allow the trial to take place. Operational notices and warnings of abnormalities were posted physically around the network, and on the Network management System Software via the switching schedules. Additional more widespread training would be required if this were adopted as a BAU technique.
Project FALCON
Meshed Networks 25
SECTION 4
4 Overview of Trial Operations
Project FALCON
Meshed Networks 26
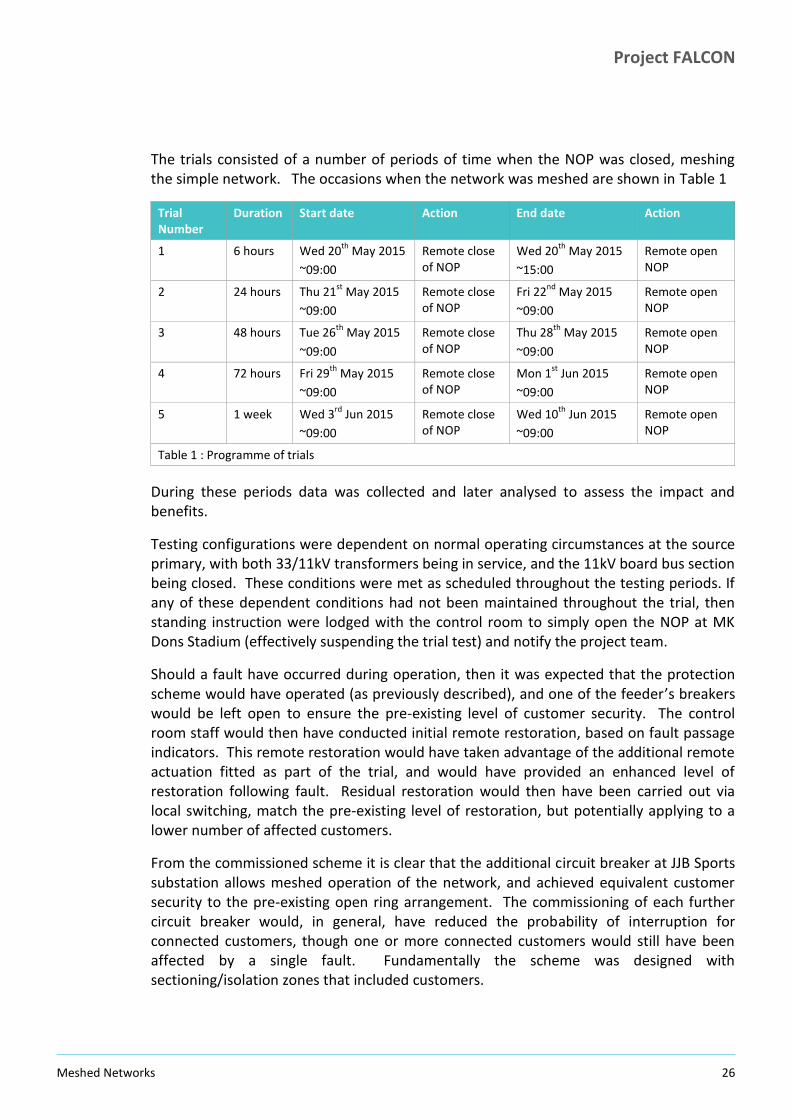
The trials consisted of a number of periods of time when the NOP was closed, meshing the simple network. The occasions when the network was meshed are shown in Table 1
Trial Number
Duration Start date Action End date Action
1 6 hours Wed 20th
May 2015
~09:00
Remote close of NOP
Wed 20th
May 2015
~15:00
Remote open NOP
2 24 hours Thu 21st
May 2015
~09:00
Remote close of NOP
Fri 22nd
May 2015
~09:00
Remote open NOP
3 48 hours Tue 26th
May 2015
~09:00
Remote close of NOP
Thu 28th
May 2015
~09:00
Remote open NOP
4 72 hours Fri 29th
May 2015
~09:00
Remote close of NOP
Mon 1st
Jun 2015
~09:00
Remote open NOP
5 1 week Wed 3rd
Jun 2015
~09:00
Remote close of NOP
Wed 10th
Jun 2015
~09:00
Remote open NOP
Table 1 : Programme of trials
During these periods data was collected and later analysed to assess the impact and benefits.
Testing configurations were dependent on normal operating circumstances at the source primary, with both 33/11kV transformers being in service, and the 11kV board bus section being closed. These conditions were met as scheduled throughout the testing periods. If any of these dependent conditions had not been maintained throughout the trial, then standing instruction were lodged with the control room to simply open the NOP at MK Dons Stadium (effectively suspending the trial test) and notify the project team.
Should a fault have occurred during operation, then it was expected that the protection scheme would have operated (as previously described), and one of the feeder’s breakers would be left open to ensure the pre-existing level of customer security. The control room staff would then have conducted initial remote restoration, based on fault passage indicators. This remote restoration would have taken advantage of the additional remote actuation fitted as part of the trial, and would have provided an enhanced level of restoration following fault. Residual restoration would then have been carried out via local switching, match the pre-existing level of restoration, but potentially applying to a lower number of affected customers.
From the commissioned scheme it is clear that the additional circuit breaker at JJB Sports substation allows meshed operation of the network, and achieved equivalent customer security to the pre-existing open ring arrangement. The commissioning of each further circuit breaker would, in general, have reduced the probability of interruption for connected customers, though one or more connected customers would still have been affected by a single fault. Fundamentally the scheme was designed with sectioning/isolation zones that included customers.

Project FALCON
Meshed Networks 27
SECTION 5
5 Trial Results and Discussion

Project FALCON
Meshed Networks 28
5.1 Trial data Data supporting the trial modelling, analysis and assessment comprised of:
Direct load flow measurement data, providing an overview of trial results and source data for the load model;
Circuit data to construct an IPSA power system model of the trial circuit; and a
Load model.
5.1.1 Data from Trial Monitoring As outlined in Section 3, test data was gathered from three sources, measurement locations are shown on the schematic in Figure 3. Collected trial data was conditioned in the following ways:
Sub.net load and power flow recorded data:
– Raw 10 minute power data was collected direct from the Sub.net monitoring devices and used graphically to show key performance of the circuit during the test periods;
– Data was available from the Sub.net devices for all trials except for two half hour periods. This was during the first test, and related to repairs to two of the Sub.net devices (replacement of SD cards).
– Missing data for these periods has been interpolated from surrounding data. Where this has occurred these values are highlighted in red cells in the master data sheet.
– Raw 10 minute power data was also averaged over standard settlement half hour periods to match metered data time periods.
– The availability of half hour values is shown in Table 11 in Appendix D.
P141 sampled data
– Real and reactive power was sampled from the P141 protection relays. Variable numbers samples per time period were achieved, principally due to the variability of the radio-based Communications network. The target rate was to sample every 10 seconds, and the number of achieved samples are close to this rate in many instances. The availability is shown in Table 12 in Appendix D.
– These sample values where averaged over the standard settlement half hour periods, and the availability of these half-hour values is shown in Table 13 in Appendix D.
– Due to the extensive initial unavailability of data from the JJB and ASDA relays, P141 data for these relays was not used.
– Unavailability of data for four periods on 26th May was experienced, and synthesised values were inserted into the master data sheet as follows:
– Interpolated data was used for the distribution substation P141 relays; and
– Sub.net inserted for P141 relays at Bletchley Primary Substation.

Project FALCON
Meshed Networks 29
Half-hourly settlement metered data
– Half-hourly settlement metering values were available for a number of the distribution substations, but not all. Unavailability of half-hourly settlement data was due to either significant number of non-half-hourly metered connections, or due to the existence of independent distribution networks (and consequential time delays on availability of data).
– The available half-hourly metered data by substation is shown in Table 14 in Appendix D.
Figure 8 : Simple mesh trial circuit schematic showing measurement locations
5.1.2 Estimation of substation loads. Due to not having complete data from any one source, data from all three sources has been used to arrive at a single set of substation load estimates, for use in modelling and analysis, as shown in Table 2.
Bletchley 11kV
Fdr 15 –Dons Fast Food
Fdr 14 –Granby Court
Bletchley 33kV – new switchboard A
Dons Fast Food (946111)
Asda (9461110)
Granby Court (946107)
Peverel Drive (946108)
Sub.net& P141
Sub.net& P141
Sub.netSub.net Sub.net & P141
P141
P141
P141
P141
JJB Sports (946109)
JJB(41D0514)(RMU1)
41D0109 – MK Dons Stadium
(RMU2)

Project FALCON
Meshed Networks 30
Substation Key source data Notes
Granby Court P141 data Power offtake at Granby Court was calculated by subtracting the P141 relay values at Granby Court from the P141 relay monitoring Bletchley Feeder 14.
Peverel Drive P141 data Power offtake at Peverel Drive was calculated by subtracting the P141 relay values at Peverel Drive from the P141 relay monitoring Granby Court.
Crown Estates Meter data Real and reactive power taken directly from metered data.
Grafton Meter data Real and reactive power taken directly from metered data.
Stadium Retail Meter data Real and reactive power taken directly from metered data.
Redmoor Meter data Real and reactive power taken directly from metered data.
Stadium Leisure Synthesis of P141 data, meter data and Sub.net data
Set as the same value as Inter Leisure. Half the value of the Sub.net data for Feeder 14 less (Granby Court, Peverel Drive, Crown Estates, Grafton, Stadium Retail, Redmoor and MK Dons Stadium feed from Feeder 14)
Inter Leisure Synthesis of P141 data, meter data and Sub.net data
As above.
MK Dons Stadium Sub.net data Real and reactive power taken directly from Sub.net data.
JJB Sports Meter data Real and reactive power taken directly from metered data.
Asda Meter data Real and reactive power taken directly from metered data.
Dons Fast Food Meter data Real and reactive power taken directly from metered data.
Table 2 : Overview of data sources for each distribution substation.
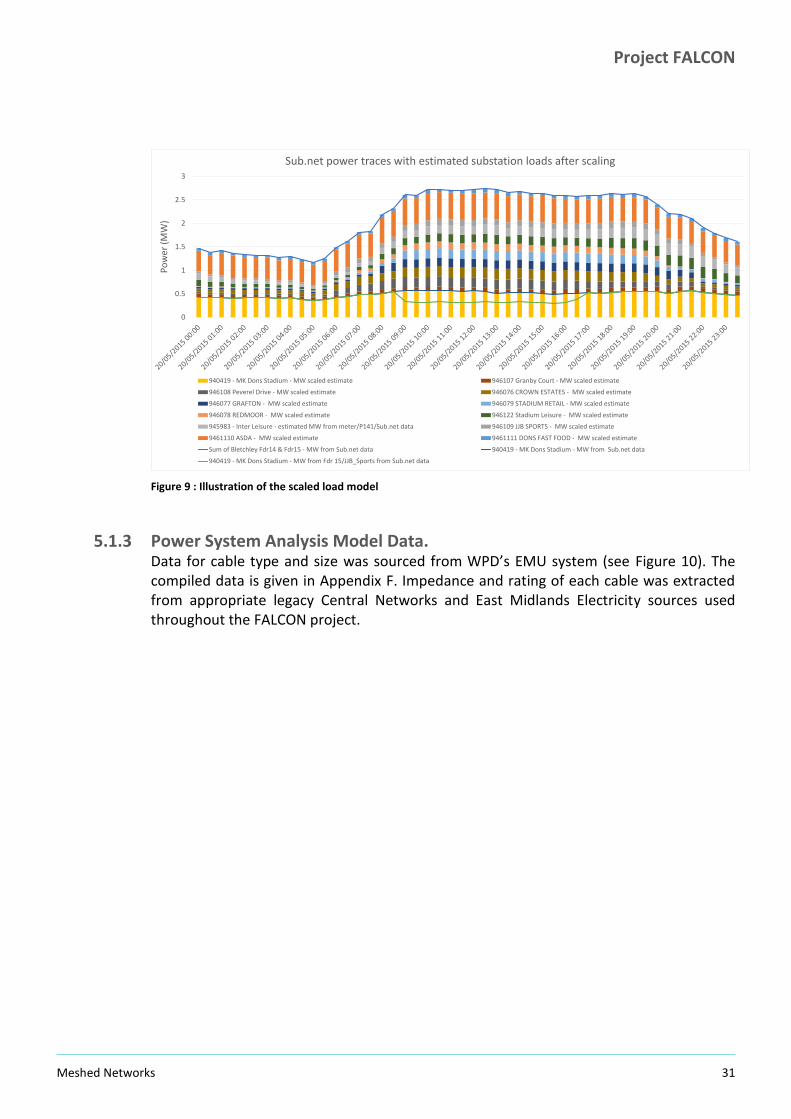
Final estimates of substation loads (both real and reactive) have been arrived by scaling the loads to align with Sub.net feeder power measurements (which have very good agreement to feeder power measurements from P141 relays). An illustration of the scaled load model for the first test in the technique trial (20th May 2015) is shown in Figure 9. Further results of scaling and comparison with pre-scaled values are shown in Appendix D. It should be noted that the load model is an approximation, judged to be appropriate for the purpose, and does not include losses in its formulation.
Project FALCON
Meshed Networks 31
Figure 9 : Illustration of the scaled load model
5.1.3 Power System Analysis Model Data. Data for cable type and size was sourced from WPD’s EMU system (see Figure 10). The compiled data is given in Appendix F. Impedance and rating of each cable was extracted from appropriate legacy Central Networks and East Midlands Electricity sources used throughout the FALCON project.
0
0.5
1
1.5
2
2.5
3
Pow
er (
MW
)Sub.net power traces with estimated substation loads after scaling
940419 - MK Dons Stadium - MW scaled estimate 946107 Granby Court - MW scaled estimate
946108 Peverel Drive - MW scaled estimate 946076 CROWN ESTATES - MW scaled estimate
946077 GRAFTON - MW scaled estimate 946079 STADIUM RETAIL - MW scaled estimate
946078 REDMOOR - MW scaled estimate 946122 Stadium Leisure - MW scaled estimate
945983 - Inter Leisure - estimated MW from meter/P141/Sub.net data 946109 JJB SPORTS - MW scaled estimate
9461110 ASDA - MW scaled estimate 9461111 DONS FAST FOOD - MW scaled estimate
Sum of Bletchley Fdr14 & Fdr15 - MW from Sub.net data 940419 - MK Dons Stadium - MW from Sub.net data
940419 - MK Dons Stadium - MW from Fdr 15/JJB_Sports from Sub.net data

Project FALCON
Meshed Networks 32
Figure 10 : Schematic showing cable sizes
It should be noted that the distance from the primary to the NOP at MK Don’s Stadium Distribution Substation via Don’s fast food is approximately 2.14km while the distance from the primary to the NOP via Granby Court is approximately 1.65km.
The impedances of the cable types are very similar and the X/R ratio of the cables is close to unity.
5.2 Trial Modelling Directly measured source and along-the-circuit power values allowed high level comparison of meshed/radial configurations. However, assessment of additional parameters, such as losses (not reasonably practicable to directly measure), needed to be computed through modelling. The following modelling approach was taken:
Models of the meshed network were established in IPSA using the 11kV schematic diagram to derive connectivity (see Figure 21).
The impedance and rating of the lines/cables given were validated by comparison of the Network design manual and the cable lengths with previously used values as described in the data document.
Demand at each substation node was taken from the trial load model
Power flow, voltage, losses and fault level studies were carried out to investigate the impact of various benefits more fully on the trial’s area network;
Project FALCON
Meshed Networks 33
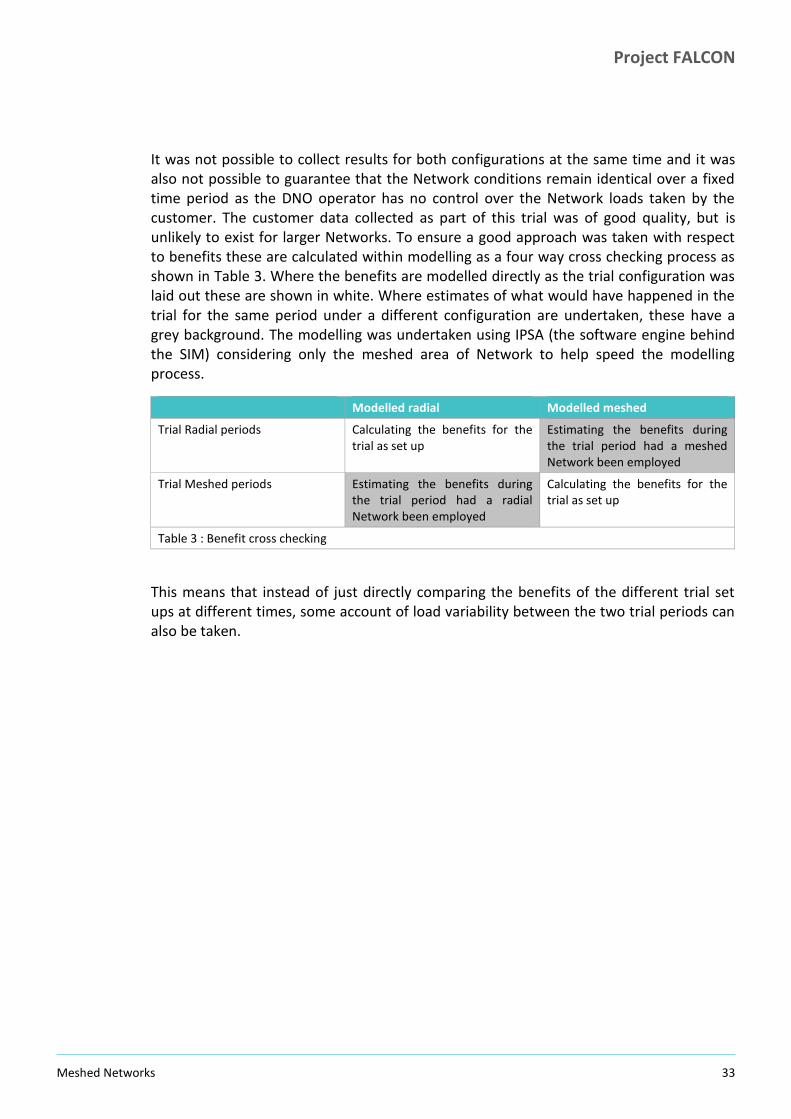
It was not possible to collect results for both configurations at the same time and it was also not possible to guarantee that the Network conditions remain identical over a fixed time period as the DNO operator has no control over the Network loads taken by the customer. The customer data collected as part of this trial was of good quality, but is unlikely to exist for larger Networks. To ensure a good approach was taken with respect to benefits these are calculated within modelling as a four way cross checking process as shown in Table 3. Where the benefits are modelled directly as the trial configuration was laid out these are shown in white. Where estimates of what would have happened in the trial for the same period under a different configuration are undertaken, these have a grey background. The modelling was undertaken using IPSA (the software engine behind the SIM) considering only the meshed area of Network to help speed the modelling process.
Modelled radial Modelled meshed
Trial Radial periods Calculating the benefits for the trial as set up
Estimating the benefits during the trial period had a meshed Network been employed
Trial Meshed periods Estimating the benefits during the trial period had a radial Network been employed
Calculating the benefits for the trial as set up
Table 3 : Benefit cross checking
This means that instead of just directly comparing the benefits of the different trial set ups at different times, some account of load variability between the two trial periods can also be taken.
Project FALCON
Meshed Networks 34
5.3 Key Learning from Trial Operations A complete set of high level result traces from the trial test period is given in Appendix C. This section identifies and discusses key points of learning from the trial tests.
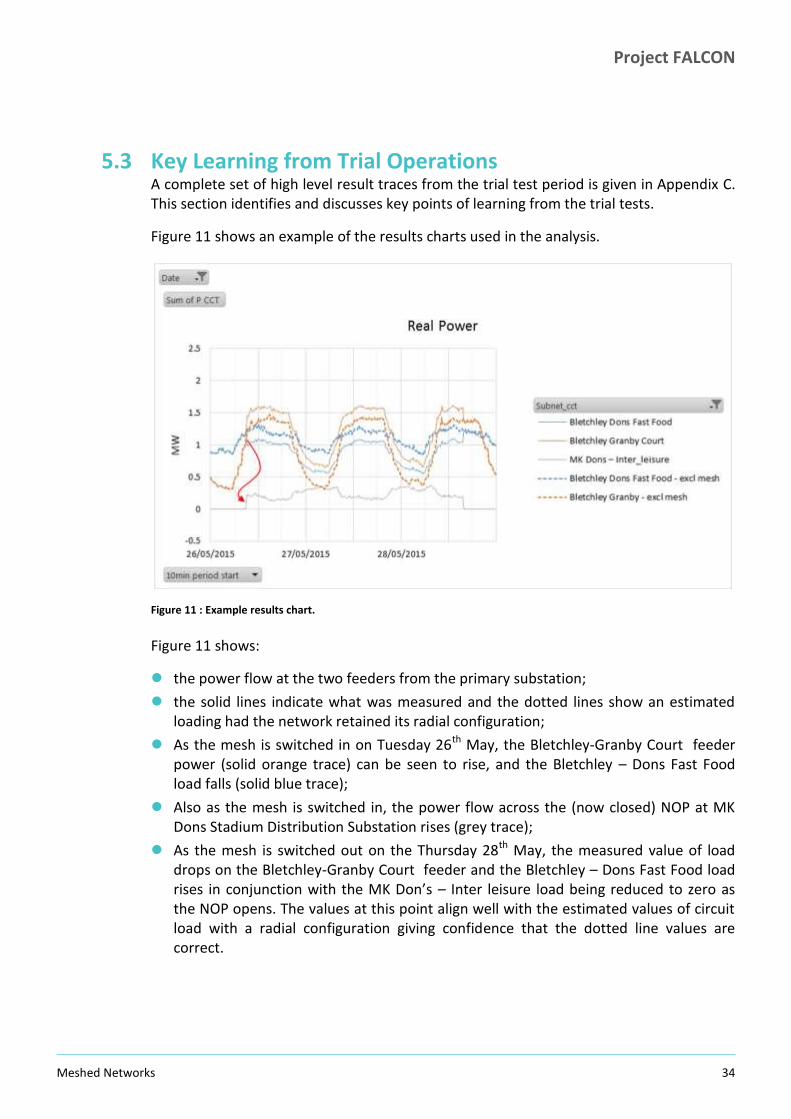
Figure 11 shows an example of the results charts used in the analysis.
Figure 11 : Example results chart.
Figure 11 shows:
the power flow at the two feeders from the primary substation;
the solid lines indicate what was measured and the dotted lines show an estimated loading had the network retained its radial configuration;
As the mesh is switched in on Tuesday 26th May, the Bletchley-Granby Court feeder power (solid orange trace) can be seen to rise, and the Bletchley – Dons Fast Food load falls (solid blue trace);
Also as the mesh is switched in, the power flow across the (now closed) NOP at MK Dons Stadium Distribution Substation rises (grey trace);
As the mesh is switched out on the Thursday 28th May, the measured value of load drops on the Bletchley-Granby Court feeder and the Bletchley – Dons Fast Food load rises in conjunction with the MK Don’s – Inter leisure load being reduced to zero as the NOP opens. The values at this point align well with the estimated values of circuit load with a radial configuration giving confidence that the dotted line values are correct.
Project FALCON
Meshed Networks 35
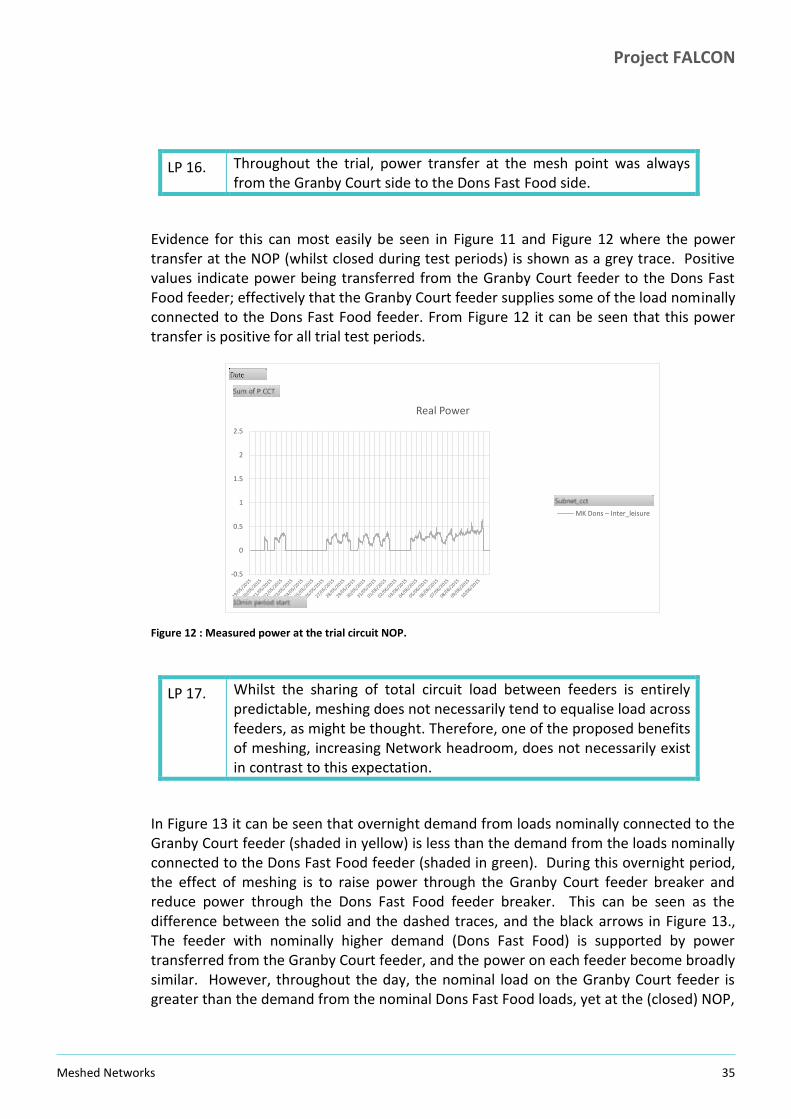
LP 16. Throughout the trial, power transfer at the mesh point was always from the Granby Court side to the Dons Fast Food side.
Evidence for this can most easily be seen in Figure 11 and Figure 12 where the power transfer at the NOP (whilst closed during test periods) is shown as a grey trace. Positive values indicate power being transferred from the Granby Court feeder to the Dons Fast Food feeder; effectively that the Granby Court feeder supplies some of the load nominally connected to the Dons Fast Food feeder. From Figure 12 it can be seen that this power transfer is positive for all trial test periods.
Figure 12 : Measured power at the trial circuit NOP.
LP 17. Whilst the sharing of total circuit load between feeders is entirely predictable, meshing does not necessarily tend to equalise load across feeders, as might be thought. Therefore, one of the proposed benefits of meshing, increasing Network headroom, does not necessarily exist in contrast to this expectation.
In Figure 13 it can be seen that overnight demand from loads nominally connected to the Granby Court feeder (shaded in yellow) is less than the demand from the loads nominally connected to the Dons Fast Food feeder (shaded in green). During this overnight period, the effect of meshing is to raise power through the Granby Court feeder breaker and reduce power through the Dons Fast Food feeder breaker. This can be seen as the difference between the solid and the dashed traces, and the black arrows in Figure 13., The feeder with nominally higher demand (Dons Fast Food) is supported by power transferred from the Granby Court feeder, and the power on each feeder become broadly similar. However, throughout the day, the nominal load on the Granby Court feeder is greater than the demand from the nominal Dons Fast Food loads, yet at the (closed) NOP,
-0.5
0
0.5
1
1.5
2
2.5
Real Power
MK Dons – Inter_leisure

Project FALCON
Meshed Networks 36
power is still transferred from the Granby Court feeder side to the Dons Fast Food side. This creates a greater difference between the loadings of the two feeders, and is not obvious: meshing the circuit during these periods increases utilisation on the source that is already supplying more power.
Figure 13 : Measured power throughout Trial Test 3 highlighting periods of demand from the nominal Granby Court feeder loads and nominal Dons Fast Food Feeder loads.
Although this apparent daytime finding goes against conventional expectation the explanation is straightforward, using an illustrative and simplified network model.
Figure 14 shows the two main loads on the Network at MK Dons and Asda and their relative location along the feeders.
Figure 14 : Sketches showing feeder current contribution to load
The proportion of the load (represented by a current source from each feeder) is shown for both radial and meshed arrangements in Table 4. If it is assumed that the cable types
Overnight
Day time
MK Dons
ASDA
Granby
Court
Dons Fast
Food
Radial Configuration
MK Dons
ASDA
Granby
Court
Dons Fast
Food
Meshed Configuration
1650m 670m
1474m

Project FALCON
Meshed Networks 37
have approximately the same impedance/km (both X and R) then when the Network is meshed the proportion of the current to MK Don’s and ASDA being fed from Granby Court and Don’s Fast Food under the different configurations is as follows:
Radial Meshed
% of load via Granby
% of load via Don’s fast food
% of load via Granby
% of load via Don’s fast food
MK Don’s 0 100% 56% 44%
ASDA 0 100% 39% 61%
Load between Granby and MK Don’s
100% 0% 80% (approx.) 20% (approx.)
Table 4 : Percentage load fed from each substation under different configurations
The peak load between Granby and MK Don’s before meshing is around 1.4MW with a load of around 600kW each at ASDA and MK Don’s. After meshing, this load re-apportions itself according to Table 4 such that the load through Granby Court is calculated to approximately 0.56*0.6+0.39*0.6+0.8*1.4 = 1.7MW with the remaining load being supplied via Don’s fast food (0.44*0.6+0.61*0.6+0.2*1.4 = 0.9MW). These values tie up with the split shown in Figure 15, differences being due to simplifications used in the above calculations.
Figure 15 : Measured power throughout Trial Test 3 highlighting periods relating to load sharing approximations.
This approximation serves to illustrate, for mesh operation, the power supplied at each feeder is related to the magnitude of each load, and the impedance between that load
Approximately 1.7MW
Approximately 0.9 MW

Project FALCON
Meshed Networks 38
and each source. The power at the closed open point is the net value of power flows to each load from each feeder source.
Therefore, whilst the sharing of total circuit load between feeders is entirely predictable, it does not necessarily tend to equalise load across feeders as common expectation implies.
LP 18. Within the trial, although half-hour periods of improvement in capacity headroom were found (the load transfer was still from MK Don’s to Granby Court, but the loading on Granby court was lower than MK Don’s resulting in an improvement to the headroom at MK Don’s), these periods only occurred during minima in daily feeder loading. Therefore no useful improvement in capacity headroom occurred.
Evidence for this finding can be seen in Figure 16, which shows power flow for Trial Test 3, a period of approximately 54 hours during which the NOP was closed. The graph shows:
Over both nights of the trial the load on both (meshed) feeders can be seen to fall to minima, but the larger of the two meshed feeder loads (Granby Court), falls to a lower level than the calculated radial configuration load would have been for Dons Fast Food feeder;
This overnight difference between the higher of the two radial configuration feeder loads, and the higher of the mesh configuration feeder loads is the potential improvement in capacity headroom;
Throughout the day the larger of the mesh configuration feeder loads is greater than the larger of the radial configuration feeder loads, therefore no improvement in capacity headroom occurs with mesh operation.

Project FALCON
Meshed Networks 39
Figure 16 : Measured power throughout Trial Test 3
This result is alternatively shown in Figure 17, where the maximum of the two radial configuration feeder loads at a point in time is plotted (green trace) with the calculated value of potential capacity headroom improvement, as defined above (yellow trace).
Figure 17 : Measured power throughout Trial Test 3
This example from the trial (Figure 17) clearly shows that whilst capacity headroom improvements did occur, the improvement occurred during minima in the daily cyclic shape of load. This timing of when capacity headroom improvements were found (i.e. during cyclic load minima) was seen throughout the trial testing period, with some 290 half-hour periods in total showing capacity improvements (369 periods did not).
Overnight Day time
Maximum of overnight radial
configuration loads
Maximum of overnight mesh
configuration loads
Improvement in capacity headroom
0
0.2
0.4
0.6
0.8
1
1.2
1.4
1.6
MW
Maximum Feeder Power, with Potential Capacity Improvements
Maximum of feeder powers without mesh
Potential Capacity Headroom Improvement
Project FALCON
Meshed Networks 40
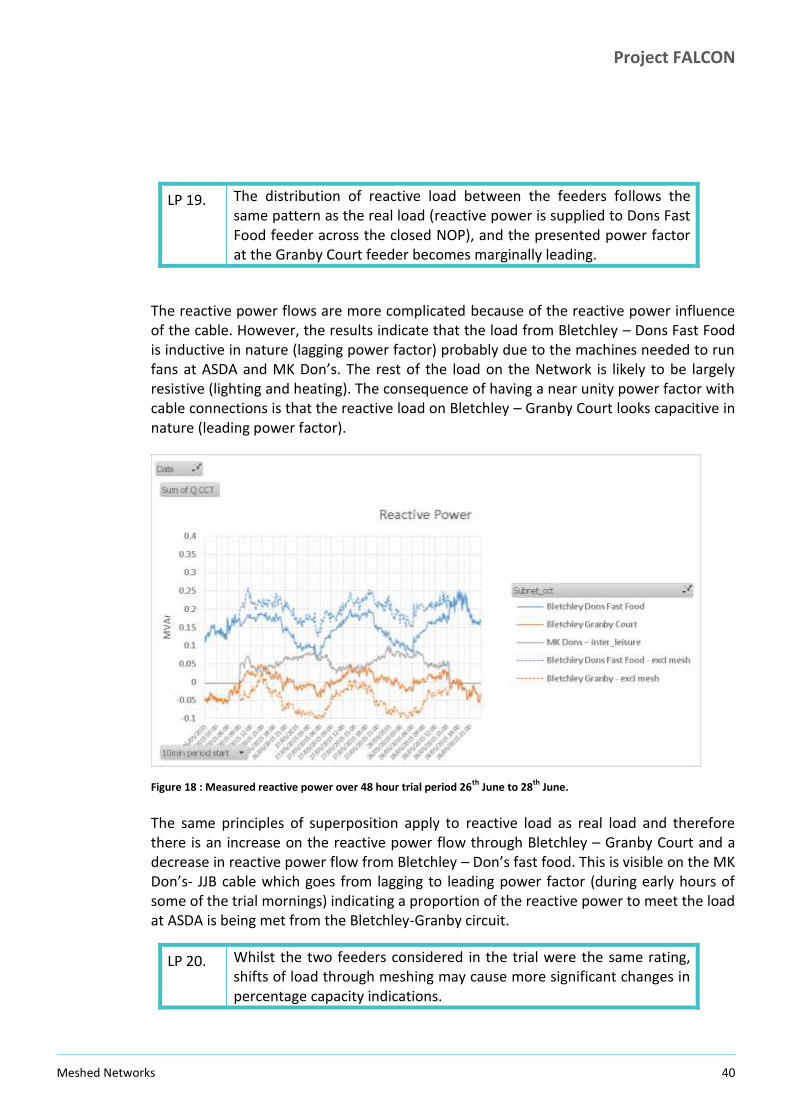
LP 19. The distribution of reactive load between the feeders follows the same pattern as the real load (reactive power is supplied to Dons Fast Food feeder across the closed NOP), and the presented power factor at the Granby Court feeder becomes marginally leading.
The reactive power flows are more complicated because of the reactive power influence of the cable. However, the results indicate that the load from Bletchley – Dons Fast Food is inductive in nature (lagging power factor) probably due to the machines needed to run fans at ASDA and MK Don’s. The rest of the load on the Network is likely to be largely resistive (lighting and heating). The consequence of having a near unity power factor with cable connections is that the reactive load on Bletchley – Granby Court looks capacitive in nature (leading power factor).
Figure 18 : Measured reactive power over 48 hour trial period 26th
June to 28th
June.
The same principles of superposition apply to reactive load as real load and therefore there is an increase on the reactive power flow through Bletchley – Granby Court and a decrease in reactive power flow from Bletchley – Don’s fast food. This is visible on the MK Don’s- JJB cable which goes from lagging to leading power factor (during early hours of some of the trial mornings) indicating a proportion of the reactive power to meet the load at ASDA is being met from the Bletchley-Granby circuit.
LP 20. Whilst the two feeders considered in the trial were the same rating, shifts of load through meshing may cause more significant changes in percentage capacity indications.
Project FALCON
Meshed Networks 41
Table 5 shows the highest % feeder utilisation out of the primary for both meshed and radial configurations, the trend already observed in the graphs is clear at both load extremes:
Maximum load increases on Granby Court Feeder/reduces on Dons Fast Food feeder with mesh configuration;
Maximum load occurs on the Granby Court Feeder with both mesh and radial operation;
Minimum load occurs on the Granby Court feeder with radial configuration, but occurs on the Dons Fast Food feeder with mesh operation.
Trial time period Radial Mesh
Granby Dons Granby Dons
Maximum load with mesh configuration
18.56 15.61 22.3 11.72
Minimum load with mesh configuration
3.94 7.85 7.58 4.83
Maximum load with radial configuration
16.68 12.00 19.30 9.76
Minimum load with radial configuration
3.57 8.26 7.67 4.99
Table 5 : Highest feeder utilisation(1st
branch out of primary substation)
Under the trials, the most heavily loaded feeders (percentage loading) remains the cables straight out the primary, as shown in Table 6. However, this is worth checking in other circuits that may be considered for meshing as the implementation of a meshed Network will increase utilisation on other lines and these may be closer to capacity.
Trial time period Highest branch utilisation Branch
Radial Mesh Radial Mesh
Maximum load with mesh configuration
18.56 22.3 Primary-Granby Primary-Granby
Minimum load with mesh configuration
7.85 7.58 Primary-Dons Primary-Granby
Maximum load with radial configuration
16.68 19.30 Primary-Granby Primary-Granby
Minimum load with radial configuration
8.26 7.67 Primary-Dons Primary-Granby
Table 6 : Highest branch utilisation with actual and assumed network configuration
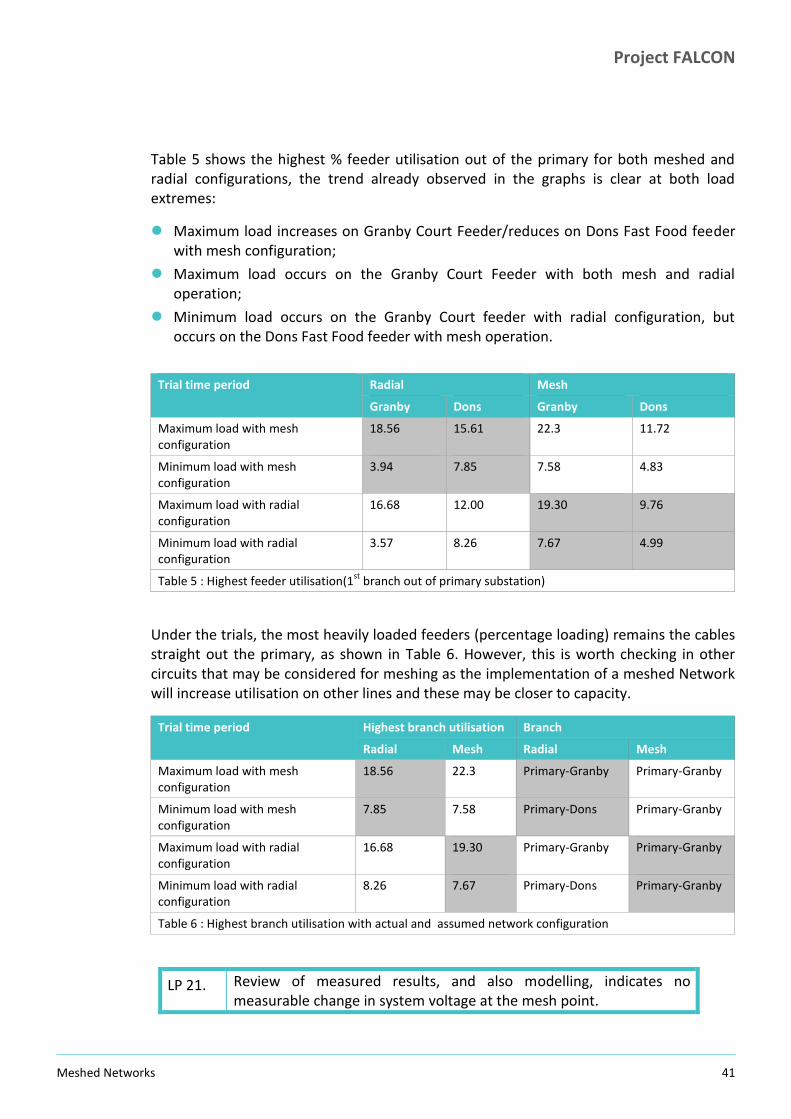
LP 21. Review of measured results, and also modelling, indicates no measurable change in system voltage at the mesh point.
Project FALCON
Meshed Networks 42
The impact of meshing has been considered through modelling and review of measured results. No significant variation in measured voltage was seen at the start and end of meshing periods, as seen in Figure 19.
Figure 19 : Measured voltage over 48 hour trial period 26
th June to 28
th June
Table 7 shows the modelling results and indicates a small calculated increase in voltage at the point of the mesh, which is inherently unmeasurable given the accuracy of the transducers. Overall, the voltage remains at a level that does not noticeably change over the trial.
Trial time period Minimum bus voltage (kV)
Radial Mesh
Maximum load with mesh configuration
11.27 11.28
Minimum load with mesh configuration
11.28 11.29
Maximum load with a radial configuration
11.27 11.28
Minimum load with radial configuration
11.28 11.29
Table 7 : Minimum bus voltage and losses with actual and assumed network configuration
0
0.05
0.1
0.15
0.2
0.25
0.3
0.35
0.4
0
1
2
3
4
5
6
7
26/05/2015 26/05/201512:00
27/05/2015 27/05/201512:00
28/05/2015 28/05/201512:00
MWkV
Voltage MK Dons – Inter_leisure -Sum of Va (kV)
MK Dons – Inter_leisure -Sum of P CCT
Project FALCON
Meshed Networks 43
LP 22. For the trial network, no distinguishable difference was found between losses in mesh and radial configurations.
Estimation of losses on the network suggest that the losses are very low in both mesh and radial configuration (~1.7kWh per half-hour period), and that the difference between the configurations is less than can realistically be distinguished, see Table 8.
Losses (kWh)
Radial Mesh
Total network load of 2.64MW 1.77 1.68
Table 8 : losses with actual and assumed network configuration
LP 23. As expected, fault level rose on the network with mesh configuration; however, this was well within ratings of connected switchgear.
Radial Mesh
Fault level (MVA) 60 75
Table 9 : Minimum bus voltage and losses with actual and assumed network configuration
LP 24. No discernible change occurred in power quality indicators as a result of mesh operation.
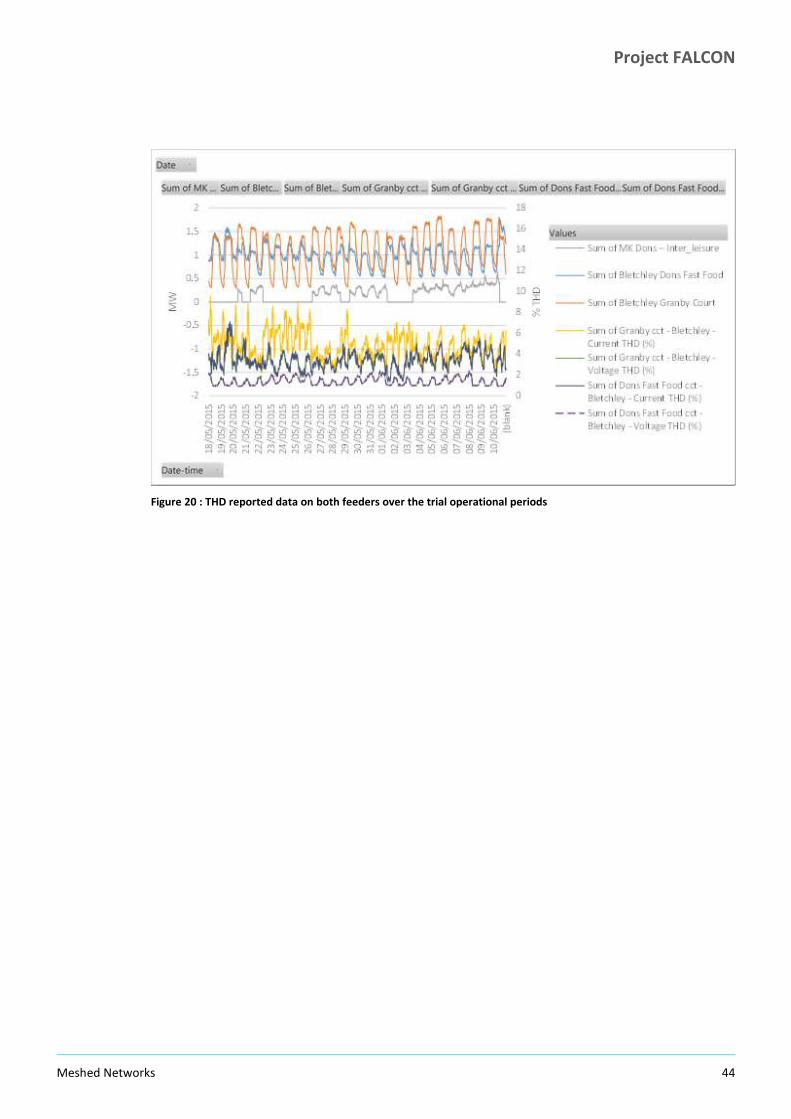
The power quality was recorded through the Sub.net devices. The harmonics up to the 21st were reported along with a total harmonic distortion on both voltage and current. There is no discernible difference in reported Total Harmonic Distortion (THD) difference when the Network is meshed or radial as shown in Figure 20. As the harmonics would be subject to the same Network theory as the fundamental, it is likely that any harmonic load with high harmonic content would be fed from both feeders as a function of their harmonic impedance under a meshed scenario possibly leading to marginal improvement on one feeder, with corresponding marginal reduction on the other feeder reducing the power quality on one feeder.
Project FALCON
Meshed Networks 44
Figure 20 : THD reported data on both feeders over the trial operational periods

Project FALCON
Meshed Networks 45
SECTION 6
6 Cross-technique Comparison4
4
This section is common to all the engineering technique Final Reports.
Project FALCON
Meshed Networks 46
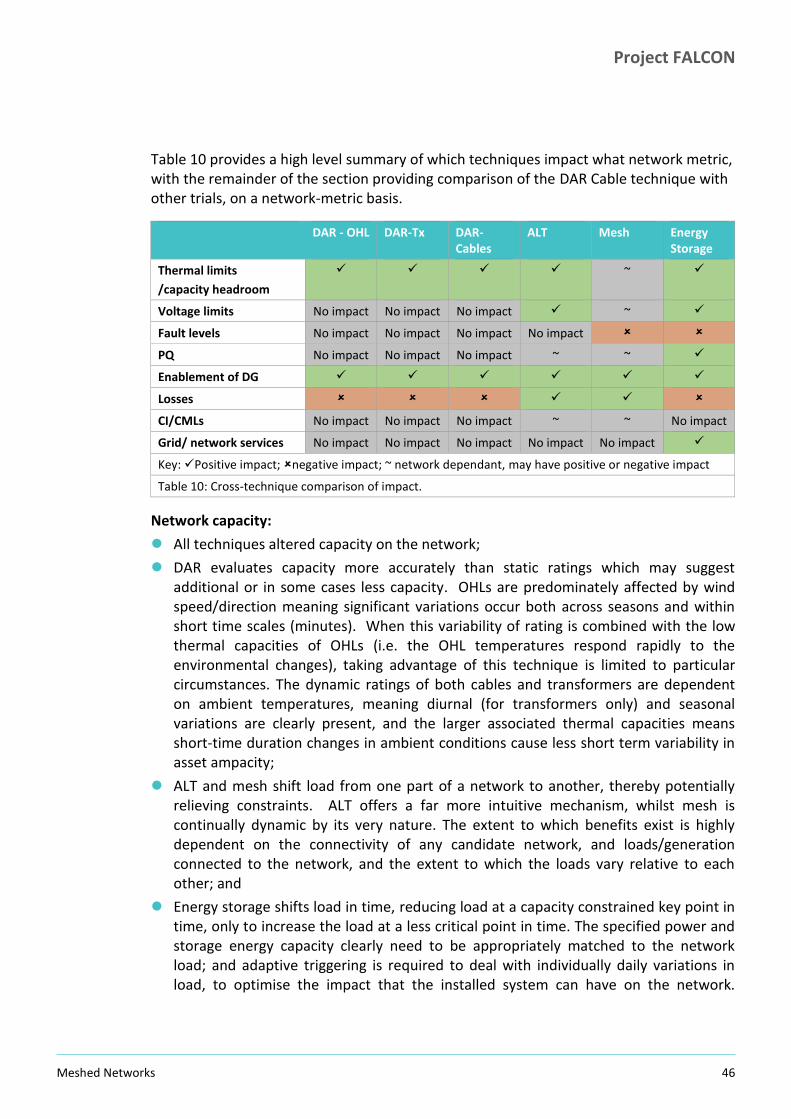
Table 10 provides a high level summary of which techniques impact what network metric, with the remainder of the section providing comparison of the DAR Cable technique with other trials, on a network-metric basis.
DAR - OHL DAR-Tx DAR-Cables
ALT Mesh Energy Storage
Thermal limits
/capacity headroom
~
Voltage limits No impact No impact No impact ~
Fault levels No impact No impact No impact No impact
PQ No impact No impact No impact ~ ~
Enablement of DG
Losses
CI/CMLs No impact No impact No impact ~ ~ No impact
Grid/ network services No impact No impact No impact No impact No impact
Key: Positive impact; negative impact; ~ network dependant, may have positive or negative impact
Table 10: Cross-technique comparison of impact.
Network capacity:
All techniques altered capacity on the network;
DAR evaluates capacity more accurately than static ratings which may suggest additional or in some cases less capacity. OHLs are predominately affected by wind speed/direction meaning significant variations occur both across seasons and within short time scales (minutes). When this variability of rating is combined with the low thermal capacities of OHLs (i.e. the OHL temperatures respond rapidly to the environmental changes), taking advantage of this technique is limited to particular circumstances. The dynamic ratings of both cables and transformers are dependent on ambient temperatures, meaning diurnal (for transformers only) and seasonal variations are clearly present, and the larger associated thermal capacities means short-time duration changes in ambient conditions cause less short term variability in asset ampacity;
ALT and mesh shift load from one part of a network to another, thereby potentially relieving constraints. ALT offers a far more intuitive mechanism, whilst mesh is continually dynamic by its very nature. The extent to which benefits exist is highly dependent on the connectivity of any candidate network, and loads/generation connected to the network, and the extent to which the loads vary relative to each other; and
Energy storage shifts load in time, reducing load at a capacity constrained key point in time, only to increase the load at a less critical point in time. The specified power and storage energy capacity clearly need to be appropriately matched to the network load; and adaptive triggering is required to deal with individually daily variations in load, to optimise the impact that the installed system can have on the network.
Project FALCON
Meshed Networks 47
Energy Storage may complement DAR by providing a mechanism to alter load patterns such that constrained assets might make the best use of available ampacity.
Voltage:
Three of the techniques offer some potential for benefits (ALT, Mesh, ES);
ALT demonstrated the largest benefit (4%), on some of the rural circuits that were trialled, but no significant benefit was found on urban circuits;
Mesh considered a small urban network and for this example there was no significant impact on voltage;
In general the voltage benefit of the ALT and mesh techniques networks will depend on the voltage difference across pre-existing NOPs, and does not directly address voltage issues at the end of branches
The installed energy storage systems achieved little impact. In general, the reactive power capacity in relation to the magnitude and power factor of the adjacent load is modest, and can be expected to be expensive to deliver for this benefit alone.
Fault level:
As is clearly already recognised, introducing generation (including ES) to a network will ordinarily increase fault level, in this instance the ES were small compared to pre-existing fault levels, and so had negligible impact. Meshed networks will also increase fault level due to the reduced circuit impedance. For the mesh technique trial, this was within the ratings of all circuit equipment.
Power Quality (PQ):
Mesh trials showed no discernible impact on power quality. Super-position theory and the feeding of harmonic loads via different sources means that harmonics presently fed from one source could be fed from two sources (depending on Network impedances), however, it is unlikely that larger scale trials will show any marked appreciable benefits as the majority of loads are within limits defined by standards and as such it will be difficult to differentiate small changes;
The installed energy storage equipment did not specifically have functionality aimed at improving PQ. At one site, improvement was noted, however this was a beneficial coincidence arising from the nature of a local (within standards) PQ disturbance and the inductance/capacitance smoothing network in the Energy storage system;
More targeted studies of a network that has a known PQ issue could be identified to further examine the potential of mesh/ALT techniques to beneficially impact this issue.
Enablement of DG:
This was not specifically studied as part of the engineering trials (e.g. interaction between the engineering techniques and DG was not designed into the trials);
Whilst not a direct focus of the FALCON trials, it is clear that DAR systems may offer potential benefit to distributed generation, but is highly dependent on circumstances.

Project FALCON
Meshed Networks 48
For example, OHL DAR can increase export from OH connected wind farms on a windy day; but solar farm output peaks occur on clear summer days when DAR OHL is less likely to provide additional benefit;
ALT may facilitate the connection of more distributed generation. However, this needs to be looked at on a case-by-case basis as the location of the generation along the feeder, in relation to the ratings and load, can have an impact. Where the generation is close to the source (such as in the FALCON ALT OHL trial), there is scope to add a significant amount of generation so that the feeder is able to export at the Primary and also meet the load requirements along this feeder. The nominal location for the open point may well be different between when the generation is running or is off and this may impact other metrics such as losses and voltage regulation if generation operating condition is not considered.
Meshing may facilitate the connection of more distributed generation by providing a second export route in certain scenarios, thus saving on line and cable upgrades. Modelling also indicates that there may be cost savings from reductions in feeder losses when meshing a network with DG connected to one feeder. However, the benefits of reduced losses would have to be compared on a case-by-case basis with the costs of more complex protection required for meshing (potentially necessitating replacement of existing protection relays as well as new relays).
ES systems offer potential benefit to distributed generation. Examples of this include: peak generation lopping - storage of peak energy production (say above connection agreement levels) for later injection to the grid; and storage of energy to allow market arbitrage.
Losses
As discussed in the preceding technique-trial specific section, ALT and Mesh offer some potential, though the magnitude is network specific.
The trialled ES systems increased losses, and DAR will tend to increase losses if higher circuit loads are facilitated.
CIs and CMLs
ALT changes NOP positions and consequently affects numbers of connected customers per feeder. The trial algorithms:
– Increased one feeder numbers by 15% (whilst optimising capacity headroom) on a rural/OHL network; and
– Increased one feeder numbers by 50% (whilst optimising losses/voltage) on an urban/cable network.
Meshing networks does not improve customer security as such; the improvement only occurs if additional automatic sectioning/unitising occurs beyond that offered by the pre-existing NOP. Due to communication system limitations, the implemented trials did not increase the number of sections, essentially maintaining the pre-existing customer security.

Project FALCON
Meshed Networks 49
Grid/network Services: Whilst these trials have demonstrated that frequency response is possible with the ES technique, a marketable service is not fully delivered by the installed equipment. In addition, further work would be required to put DNO owned energy storage on an appropriate commercial basis. Refer to the WPD Solar Store NIA project.
Project FALCON
Meshed Networks 50
SECTION 7
7 Conclusions and Recommendations

Project FALCON
Meshed Networks 51
In summary:
1. Core learning on meshing networks as a technique for enhancing 11kV network capacity were fully explored in this trial
2. High-speed protection communications over the FALCON communications network did not operate as expected.
3. Installation increases complexity of the network, and introduces additional equipment requiring inspection, maintenance and testing requirements;
4. Meshing of a simple (two feeder) network changed loading on the source breakers, but not to reduce load on the more heavily loaded source during peak load periods.
5. Voltage and power quality (PQ) were found to be largely unaffected on this small compact urban network. In general, it may be expected for there to be only marginal change in these respects;
6. A 5% reduction in losses was estimated on this trial network, though this should not generally be assumed to be the case (dependence on relative feeder impedances); and
7. Security/reliability was maintained compared to pre-existing condition, through the installation of a protection relay operating on an overcurrent basis at the trial-installed circuit breaker closest to the NOP. The trial was not able to implement additional sectioning as originally planned due to encountered slower than designed tele-protection signalling on the FALCON communications network; and limits in achievable certainty within conventional protection discrimination (i.e. without interconnection of relays).
It is therefore concluded that, on balance, there were no significant net advantages to running this Network in meshed configuration. Further, it is not recommended at this stage as a technique to be utilised by the DNO for planning purposes at 11kV.
However, it is recommended that the installed infrastructure is retained in a mothballed condition to provide a test environment for any continuing work on high-speed performance of the FALCON communications network.

Project FALCON
Meshed Networks 52
Appendices
Project FALCON
Meshed Networks 53
A Large Format Report Graphics
Figure 21 : Large format 11kV single line diagram of Meshed scheme
Project FALCON
Meshed Networks 54
Figure 22 : Geographic diagram of Meshed scheme

Project FALCON
Meshed Networks 55
B Initial learning objectives A B C
1 Quantify power quality benefits
Quantify changes in system losses
Assess extra security obtained for every extra switchgear
2 Compare types of switchgear required
Costs for implementation Running costs for scheme
3 Viability of protection over IP
Changes to switchgear specification
Requirements for communications – bandwidth/latency/availability
4 Changes to X/R ratio of feeders
Comparison against other techniques
Control/NMS requirements
5 DSR compatibility Are extra skills/knowledge required for planning future changes in the network?
Training requirements
6 Post fault running conditions Quantification of increased utilisation factor
Changes to standard substation package size
7 Conditions for which the system should be disabled
Does the technique protect the network better for all faults?
Can similar benefits be achieved through simpler methods?
8 Does uptake of this technique mean changes to planned network topology?

Project FALCON
Meshed Networks 56
C Trial results
Figure 23 : Real Power for 6 hour trial data Wed 20
th May

Project FALCON
Meshed Networks 57
Figure 24 : Reactive Power for 6 hour trial data Wed 20
th May
Project FALCON
Meshed Networks 58
Figure 25 : Real Power for 24 hour trial data Thur 21
st – Fri 22
nd May

Project FALCON
Meshed Networks 59
Figure 26 : Reactive Power for 24 hour trial data Thur 21
st – Fri 22
nd May

Project FALCON
Meshed Networks 60
Figure 27 : Real Power for 48 hour trial data Tue26
th - Thur 28
th May

Project FALCON
Meshed Networks 61
Figure 28 : Reactive Power for 48 hour trial data Tue26
th - Thur 28
th May
Project FALCON
Meshed Networks 62
Figure 29 : Real Power for 72 hour trial data Fri29
th May - Mon 1
st June
Project FALCON
Meshed Networks 63
Figure 30 : Reactive Power for 72 hour trial data Fri29
th May - Mon 1
st June

Project FALCON
Meshed Networks 64
Figure 31 : Reactive Power for 1 week trial data Wed 3
rd – Wed 10
th June

Project FALCON
Meshed Networks 65
Figure 32 : Reactive Power for 1 week trial data Wed 3
rd – Wed 10
th June
Project FALCON
Meshed Networks 66
D Data Availability
Row Labels
Count of Subnet Bletchley Fdr 14 (Granby Court) - P CCT
Count of Subnet Bletchley Fdr 15 (Dons FF) - P CCT
Count of Subnet MK Dons – JJB_Sports P CCT
Count of Subnet MK_Dons–Inter_leisure P CCT
Count of Subnet JJB946109 P CCT
20/05/2015 48 48 46 46 46
21/05/2015 48 48 48 48 48
22/05/2015 48 48 48 48 48
23/05/2015 48 48 48 48 48
24/05/2015 48 48 48 48 48
25/05/2015 48 48 48 48 48
26/05/2015 48 48 48 48 48
27/05/2015 48 48 48 48 48
28/05/2015 48 48 48 48 48
29/05/2015 48 48 48 48 48
30/05/2015 48 48 48 48 48
31/05/2015 48 48 48 48 48
01/06/2015 48 48 48 48 48
02/06/2015 48 48 48 48 48
03/06/2015 48 48 48 48 48
04/06/2015 48 48 48 48 48
05/06/2015 48 48 48 48 48
06/06/2015 48 48 48 48 48
07/06/2015 48 48 48 48 48
08/06/2015 48 48 48 48 48
09/06/2015 48 48 48 48 48
10/06/2015 48 48 48 48 48
Table 11 : Availability of Sub.net data

Project FALCON
Meshed Networks 67
Date
P141 Bletfr14
P141 Granby 946107
P141 Peverel 946108
P141 JJB 46109
P141 Asda 946110
P141 DonsFastFood 946111
P141 Bletfr15
20-May-15 8583 8572 8577
8534 8592
21-May-15 8509 8411 8499
8048 8474
22-May-15 8526 8335 8465
8161 8485
23-May-15 8596 8586 8600
8513 8597
24-May-15 8446 8250 8388
8088 8438
25-May-15 8605 8577 8613
8594 8608
26-May-15 7589 7512 7578
7548 7586
27-May-15 8551 8389 8551 3183 3166 8543 8562
28-May-15 8568 8438 8546 8093 8375 8513 8550
29-May-15 8493 8251 8453 8201 8163 8463 8510
30-May-15 8468 8422 8427 7420 7871 8222 8449
31-May-15 8425 8294 8388 7076 7681 8173 8380
01-Jun-15 8428 8360 8408 7410 7626 8099 8424
02-Jun-15 8521 8485 8483 8358 8213 8168 8500
03-Jun-15 8577 8565 8577 8505 8443 8445 8575
04-Jun-15 8505 8448 8517 7766 5871 8261 8504
05-Jun-15 8522 8469 8479 7842 7847 8396 8501
06-Jun-15 8542 8558 8560 7989 8323 8386 8531
07-Jun-15 8513 8506 8538 7693 8082 8269 8518
08-Jun-15 8488 8515 8491 7971 5183 8207 8522
09-Jun-15 8461 8389 8440 8294 2783 8318 8493
Table 12 : P141 relay samples achieved.

Project FALCON
Meshed Networks 68
Row Labels
Count of P141 Bletfr14 P CCT
Count of P141Granby946107 P CCT
Count of P141Peverel946108 P CCT
Count of P141 JJB946109 P CCT
Count of P141 Asda946110 P CCT
Count of P141DonsFastFood946111 P CCT
Count of P141 Bletfr15 P CCT
20/05/2015 48 48 48 48 48
21/05/2015 48 48 48 48 48
22/05/2015 48 48 48 48 48
23/05/2015 48 48 48 48 48
24/05/2015 48 48 48 48 48
25/05/2015 48 48 48 48 48
26/05/2015 44 44 44 44 44
27/05/2015 48 48 48 19 19 48 48
28/05/2015 48 48 48 48 48 48 48
29/05/2015 48 48 48 48 48 48 48
30/05/2015 48 48 48 48 48 48 48
31/05/2015 48 48 48 48 48 48 48
01/06/2015 48 48 48 48 48 48 48
02/06/2015 48 48 48 48 48 48 48
03/06/2015 48 48 48 48 48 48 48
04/06/2015 48 48 48 48 48 48 48
05/06/2015 48 48 48 48 48 48 48
06/06/2015 48 48 48 48 48 48 48
07/06/2015 48 48 48 48 48 48 48
08/06/2015 48 48 48 48 45 48 48
09/06/2015 48 48 48 48 45 48 48
10/06/2015 48 48 48 48 42 48 48
Table 13 : Availability of P141 data.
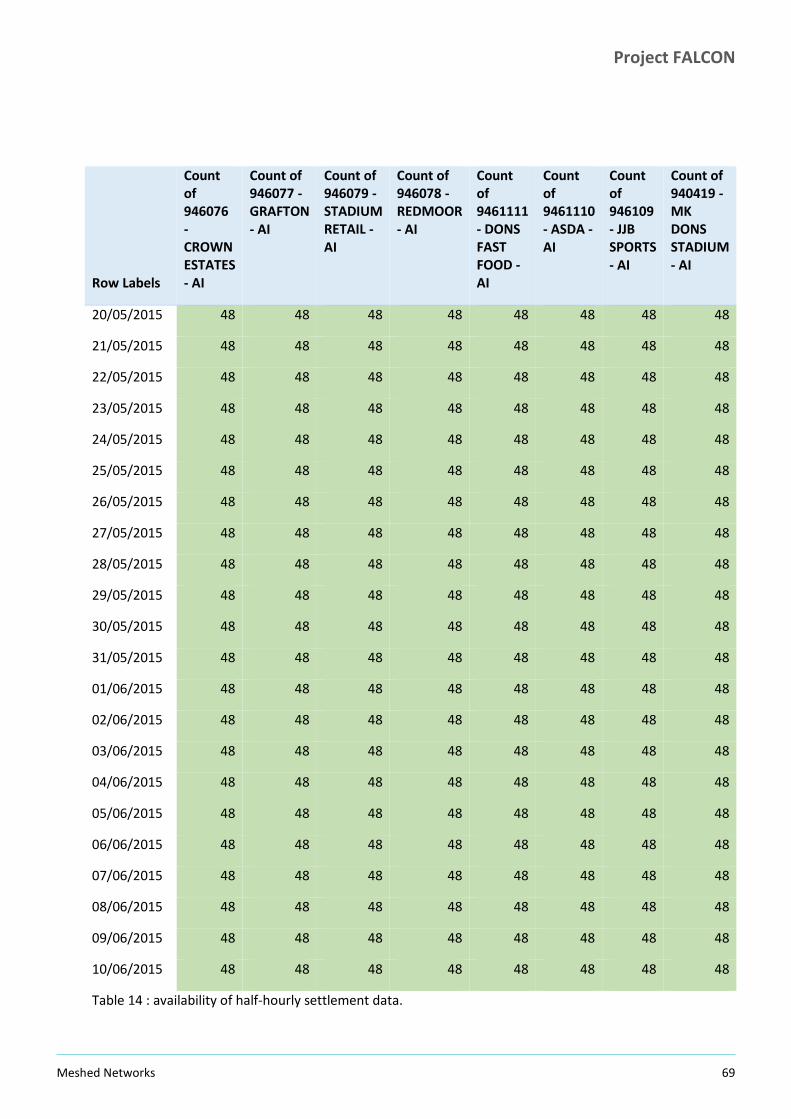
Project FALCON
Meshed Networks 69
Row Labels
Count of 946076 - CROWN ESTATES - AI
Count of 946077 - GRAFTON - AI
Count of 946079 - STADIUM RETAIL - AI
Count of 946078 - REDMOOR - AI
Count of 9461111 - DONS FAST FOOD - AI
Count of 9461110 - ASDA - AI
Count of 946109 - JJB SPORTS - AI
Count of 940419 - MK DONS STADIUM - AI
20/05/2015 48 48 48 48 48 48 48 48
21/05/2015 48 48 48 48 48 48 48 48
22/05/2015 48 48 48 48 48 48 48 48
23/05/2015 48 48 48 48 48 48 48 48
24/05/2015 48 48 48 48 48 48 48 48
25/05/2015 48 48 48 48 48 48 48 48
26/05/2015 48 48 48 48 48 48 48 48
27/05/2015 48 48 48 48 48 48 48 48
28/05/2015 48 48 48 48 48 48 48 48
29/05/2015 48 48 48 48 48 48 48 48
30/05/2015 48 48 48 48 48 48 48 48
31/05/2015 48 48 48 48 48 48 48 48
01/06/2015 48 48 48 48 48 48 48 48
02/06/2015 48 48 48 48 48 48 48 48
03/06/2015 48 48 48 48 48 48 48 48
04/06/2015 48 48 48 48 48 48 48 48
05/06/2015 48 48 48 48 48 48 48 48
06/06/2015 48 48 48 48 48 48 48 48
07/06/2015 48 48 48 48 48 48 48 48
08/06/2015 48 48 48 48 48 48 48 48
09/06/2015 48 48 48 48 48 48 48 48
10/06/2015 48 48 48 48 48 48 48 48
Table 14 : availability of half-hourly settlement data.

Project FALCON
Meshed Networks 70
E Scaled substation loads
Figure 33 : Comparison of Substation real power loads before and after final scaling for 20
th May 2015.
0
0.5
1
1.5
2
2.5
3
Po
wer
(M
W)
Sub.net traces with substation loads before scaling
940419 - MK Dons Stadium - kW from Sub.net data 946107 - Granby Court kW estimate from P141 data 946108 - Peverel DrivekW estimate from P141 data
946076 - CROWN ESTATES - kW from meter data 946077 - GRAFTON - kW from meter data 946079 - STADIUM RETAIL - kW from meter data
946078 - REDMOOR - kW from meter data 946122 - Stadium Leisure - estimated kW from meter/P141/Sub.net data 945983 - Inter Leisure - estimated kW from meter/P141/Sub.net data
946109 - JJB SPORTS - kW from meter data 9461110 - ASDA - kW from meter data 9461111 - DONS FAST FOOD - kW from meter data
Sum of Bletchley Fdr14 & Fdr15 - kW from Sub.net data 940419 - MK Dons Stadium - kW from Sub.net data
0
0.5
1
1.5
2
2.5
3
Po
wer
(M
W)
Sub.net traces with substation loads after scaling
940419 - MK Dons Stadium - kW scaled estimate 946107 Granby Court - kW scaled estimate 946108 Peverel Drive - kW scaled estimate
946076 CROWN ESTATES - kW scaled estimate 946077 GRAFTON - kW scaled estimate 946079 STADIUM RETAIL - kW scaled estimate
946078 REDMOOR - kW scaled estimate 946122 Stadium Leisure - kW scaled estimate 945983 - Inter Leisure - estimated kW from meter/P141/Sub.net data
946109 JJB SPORTS - kW scaled estimate 9461110 ASDA - kW scaled estimate 9461111 DONS FAST FOOD - kW scaled estimate
Sum of Bletchley Fdr14 & Fdr15 - kW from Sub.net data 940419 - MK Dons Stadium - kW from Sub.net data 940419 - MK Dons Stadium - kW from Fdr 15/JJB_Sports from Sub.net data
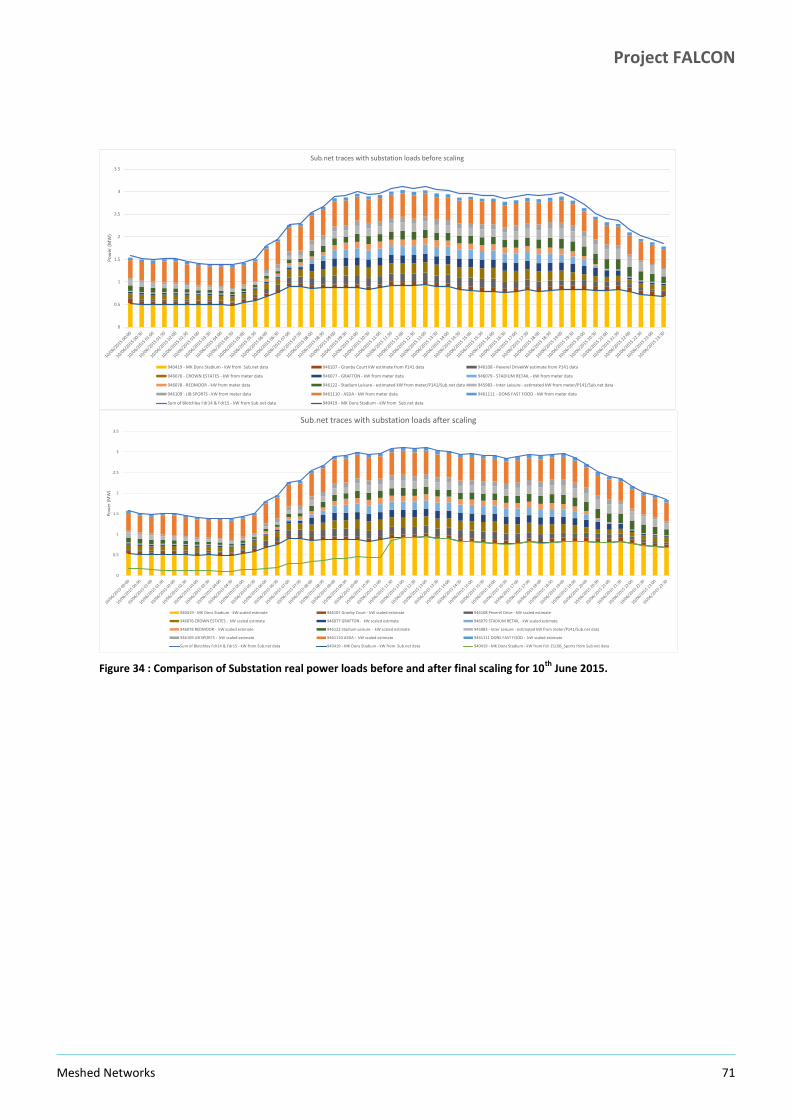
Project FALCON
Meshed Networks 71
Figure 34 : Comparison of Substation real power loads before and after final scaling for 10
th June 2015.
0
0.5
1
1.5
2
2.5
3
3.5
Po
wer
(M
W)
Sub.net traces with substation loads before scaling
940419 - MK Dons Stadium - kW from Sub.net data 946107 - Granby Court kW estimate from P141 data 946108 - Peverel DrivekW estimate from P141 data
946076 - CROWN ESTATES - kW from meter data 946077 - GRAFTON - kW from meter data 946079 - STADIUM RETAIL - kW from meter data
946078 - REDMOOR - kW from meter data 946122 - Stadium Leisure - estimated kW from meter/P141/Sub.net data 945983 - Inter Leisure - estimated kW from meter/P141/Sub.net data
946109 - JJB SPORTS - kW from meter data 9461110 - ASDA - kW from meter data 9461111 - DONS FAST FOOD - kW from meter data
Sum of Bletchley Fdr14 & Fdr15 - kW from Sub.net data 940419 - MK Dons Stadium - kW from Sub.net data
0
0.5
1
1.5
2
2.5
3
3.5
Po
wer
(M
W)
Sub.net traces with substation loads after scaling
940419 - MK Dons Stadium - kW scaled estimate 946107 Granby Court - kW scaled estimate 946108 Peverel Drive - kW scaled estimate
946076 CROWN ESTATES - kW scaled estimate 946077 GRAFTON - kW scaled estimate 946079 STADIUM RETAIL - kW scaled estimate
946078 REDMOOR - kW scaled estimate 946122 Stadium Leisure - kW scaled estimate 945983 - Inter Leisure - estimated kW from meter/P141/Sub.net data
946109 JJB SPORTS - kW scaled estimate 9461110 ASDA - kW scaled estimate 9461111 DONS FAST FOOD - kW scaled estimate
Sum of Bletchley Fdr14 & Fdr15 - kW from Sub.net data 940419 - MK Dons Stadium - kW from Sub.net data 940419 - MK Dons Stadium - kW from Fdr 15/JJB_Sports from Sub.net data

Project FALCON
Meshed Networks 72
Figure 35 : Comparison of Substation reactive power loads before and after final scaling for 20th
May 2015.
-0.2
-0.1
0
0.1
0.2
0.3
0.4
Po
wer
(M
W)
Sub.net traces with substation loads from P141 & metering data - raw
940419 - MK Dons Stadium - kVAr from Sub.net data 946107 - Granby Court kVAr estimate from P141 data 946108 - Peverel DrivekVAr estimate from P141 data
946076 - CROWN ESTATES - kVAr from meter data 946077 - GRAFTON - kVAr from meter data 946079 - STADIUM RETAIL - kVAr from meter data
946078 - REDMOOR - kVAr from meter data 946122 - Stadium Leisure - estimated kVAr from meter/P141/Sub.net data 945983 - Inter Leisure - estimated kVAr from meter/P141/Sub.net data
946109 - JJB SPORTS - kVAr from meter data 9461110 - ASDA - kVAr from meter data 9461111 - DONS FAST FOOD - kVAr from meter data
Sum of Bletchley Fdr14 & Fdr15 - kVAr from Sub.net data 940419 - MK Dons Stadium - kVAr from Sub.net data
-0.2
-0.1
0
0.1
0.2
0.3
0.4
Po
wer
(M
W)
Sub.net traces with substation loads from P141 & metering data - raw
940419 - MK Dons Stadium - kVAr scaled estimate 946107 Granby Court - kVAr scaled estimate 946108 Peverel Drive - kVAr scaled estimate
946076 CROWN ESTATES - kVAr scaled estimate 946077 GRAFTON - kVAr scaled estimate 946079 STADIUM RETAIL - kVAr scaled estimate
946078 REDMOOR - kVAr scaled estimate 946122 Stadium Leisure - kVAr scaled estimate 945983 - Inter Leisure - estimated kVAr from meter/P141/Sub.net data
946109 JJB SPORTS - kVAr scaled estimate 9461110 ASDA - kVAr scaled estimate 9461111 DONS FAST FOOD - kVAr scaled estimate
Sum of Bletchley Fdr14 & Fdr15 - kVAr from Sub.net data 940419 - MK Dons Stadium - kVAr from Sub.net data 940419 - MK Dons Stadium - kVAr from Fdr 15/JJB_Sports from Sub.net data
Sum of all scaled individual substation kVAr
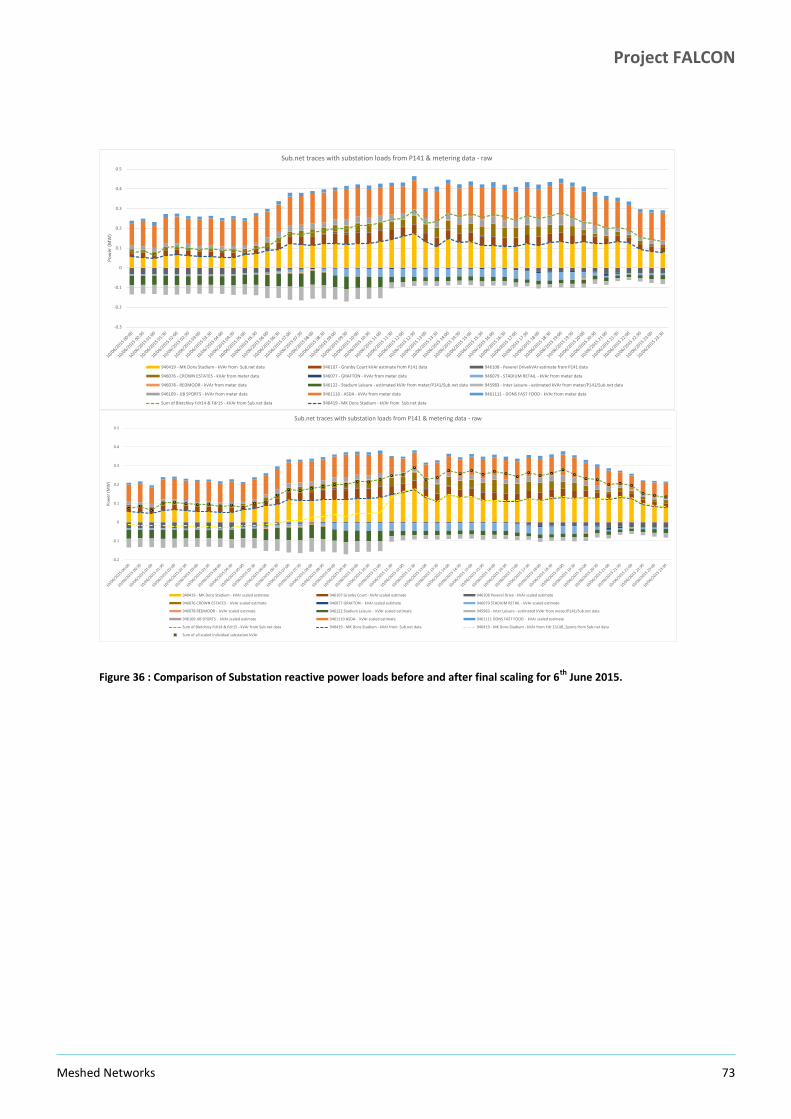
Project FALCON
Meshed Networks 73
Figure 36 : Comparison of Substation reactive power loads before and after final scaling for 6th
June 2015.
-0.3
-0.2
-0.1
0
0.1
0.2
0.3
0.4
0.5
Po
wer
(M
W)
Sub.net traces with substation loads from P141 & metering data - raw
940419 - MK Dons Stadium - kVAr from Sub.net data 946107 - Granby Court kVAr estimate from P141 data 946108 - Peverel DrivekVAr estimate from P141 data
946076 - CROWN ESTATES - kVAr from meter data 946077 - GRAFTON - kVAr from meter data 946079 - STADIUM RETAIL - kVAr from meter data
946078 - REDMOOR - kVAr from meter data 946122 - Stadium Leisure - estimated kVAr from meter/P141/Sub.net data 945983 - Inter Leisure - estimated kVAr from meter/P141/Sub.net data
946109 - JJB SPORTS - kVAr from meter data 9461110 - ASDA - kVAr from meter data 9461111 - DONS FAST FOOD - kVAr from meter data
Sum of Bletchley Fdr14 & Fdr15 - kVAr from Sub.net data 940419 - MK Dons Stadium - kVAr from Sub.net data
-0.2
-0.1
0
0.1
0.2
0.3
0.4
0.5
Po
wer
(M
W)
Sub.net traces with substation loads from P141 & metering data - raw
940419 - MK Dons Stadium - kVAr scaled estimate 946107 Granby Court - kVAr scaled estimate 946108 Peverel Drive - kVAr scaled estimate
946076 CROWN ESTATES - kVAr scaled estimate 946077 GRAFTON - kVAr scaled estimate 946079 STADIUM RETAIL - kVAr scaled estimate
946078 REDMOOR - kVAr scaled estimate 946122 Stadium Leisure - kVAr scaled estimate 945983 - Inter Leisure - estimated kVAr from meter/P141/Sub.net data
946109 JJB SPORTS - kVAr scaled estimate 9461110 ASDA - kVAr scaled estimate 9461111 DONS FAST FOOD - kVAr scaled estimate
Sum of Bletchley Fdr14 & Fdr15 - kVAr from Sub.net data 940419 - MK Dons Stadium - kVAr from Sub.net data 940419 - MK Dons Stadium - kVAr from Fdr 15/JJB_Sports from Sub.net data
Sum of all scaled individual substation kVAr

Project FALCON
Meshed Networks 74
F Cable data From Name To Name Length Cable type
Bletchley Primary 41D5191 Granby Court 248 300 Al PIAS
41D5191 Granby Court 946107 FALCON Unit Granby Court
10 300 Al PIAS
946107 FALCON Unit Granby Court
41D5290 Peverel Drive Afus 337 300 Al PIAS
41D5290 Peverel Drive Afus 946108 FALCON Unit Peverel Drive Bletchley
55 28m of 300 Al PIAS
27m of 3 x 300 1c Al XLPE
946108 FALCON Unit Peverel Drive Bletchley
946076 Crown Estates 565 100m of 300 PIAS
465m of 3 x 300 1c Al XLPE
946076 Crown Estates 946077 Grafton 48 3x 300 1c Al XLPE
946077 Grafton 946079 Stadium Retail 12 3 x 300 1c Al XLPE
946079 Stadium Retail 946078 Redmoor 12 3 x 300 1c Al XLPE
946078 Redmoor 946122 Stadium Leisure 50 3 x 300 1c Al XLPE
946122 Stadium Leisure 945983 Inter Leisure 12 3 x 300 1c Al XLPE
945983 Inter Leisure 41D0109 MK Dons Stadium (RMU 1)
297 3 x 300 1c Al XLPE
41D0109 MK Dons Stadium (RMU 1)
41D0109 MK Dons Stadium (RMU 2)
8 3 x 300 1c Al XLPE
41D0109 MK Dons Stadium (RMU 2)
946109 FALCON Unit JJB Sports Bletchley
321 300 Al XLPE
946109 FALCON Unit JJB Sports Bletchley
41D0514 JJB Sports Bletchley 10 300 Al XLPE
41D0514 JJB Sports Bletchley
946110 FALCON Unit Asda Store Bletchley
329 300 Al XLPE
946110 FALCON Unit Asda Store Bletchley
41D9992 Asda Store Bletchley 10 300 Al XLPE
41D9992 Asda Store Bletchley
946111 FALCON Unit Dons Fast Food Bletchley
266 300 Al XLPE
946111 FALCON Unit Dons Fast Food Bletchley
41D0573 Dons Fast Food 10 300 Al XLPE
41D0573 Dons Fast Food Bletchley Primary 1198 300 Al XLPE
Table 15 : Circuit data

Project FALCON
Meshed Networks 75
Western Power Distribution (East Midlands) plc
Registered in England and Wales No. 2366923
Registered Office: Avonbank, Feeder Road, Bristol BS2 0TB
Western Power Distribution (West Midlands) plc
Registered in England and Wales No. 3600574
Registered Office: Avonbank, Feeder Road, Bristol BS2 0TB
Western Power Distribution (South West) plc
Registered in England and Wales No. 2366894
Registered Office: Avonbank, Feeder Road, Bristol BS2 0TB
Western Power Distribution (South Wales) plc
Registered in Wales No. 2366985
Registered Office: Avonbank, Feeder Road, Bristol BS2 0TB