project identification, evolution, chapter ii conditions and needs, … · ·...
TRANSCRIPT

Kosciuszko Bridge Project II-1 March 2007
Project Identification, Evolution, Chapter II Conditions and Needs, and Objectives This chapter identifies and describes the project’s limits, the history of the corridor and project, and the purpose and need for the project.
A. PROJECT IDENTIFICATION
This section describes the type and location of the Kosciuszko Bridge Project.
A.1. Project Type
The primary objective of the Kosciuszko Bridge Project is the evaluation of possible improvements to the Kosciuszko Bridge, which crosses Newtown Creek between Brooklyn and Queens. The alternatives evaluated in this document include rehabilitation of the existing bridge with construction of a new parallel bridge or replacement of the existing bridge in its entirety. This effort may also include construction of a bikeway/walkway, intersection reconstruction, and safety improvements to the highway and to local streets affected by the project.
A.2. Project Location/Description
The Kosciuszko Bridge carries a 1.1-mile segment of the Brooklyn-Queens Expressway (BQE, Interstate 278) from Morgan Avenue in the borough of Brooklyn (Kings County) to the Long Island Expressway (LIE) interchange in the borough of Queens (Queens County) as shown in Figure II-1, “Project Location.” The Main Span of the bridge carries BQE traffic over Newtown Creek, which forms the border between Brooklyn and Queens in this area. North of the bridge, the BQE connects to the LIE and the Grand Central Parkway, which extends to LaGuardia International Airport and across the Triborough Bridge leading into Manhattan and the Bronx. To the south, the BQE connects to the Williamsburg, Manhattan, and Brooklyn Bridges, as well as the Brooklyn-Battery Tunnel, leading into Manhattan, and continues south to the Gowanus Expressway and across the Verrazano-Narrows Bridge, leading to Staten Island. While the BQE is signed as, and generally recognized as an east-west route, the highway runs in a north-south direction through the project area. As one of New York City’s few north-south interstates, the BQE serves commuter and local traffic as well as a significant amount of truck traffic, which is prohibited from neighboring parkways.
The limits of the project, shown in Figure II-2, “Kosciuszko Bridge Project Limits,” extend from Morgan Avenue in the Greenpoint/Williamsburg neighborhood of Brooklyn to the LIE in the West Maspeth neighborhood of Queens and include the entrance and exit ramps in the area of Vandervoort Avenue in Brooklyn. While the project is focused on the rehabilitation/replacement of the existing structure from reference marker 278IX2M24121 just west of Morgan Avenue to

Draft Environmental Impact Statement Section II.A
Kosciuszko Bridge Project II-2 March 2007
278IX5M34005 at the beginning of the LIE interchange, it will be necessary to do work outside of these limits in order to safely maintain traffic throughout construction. Figure II-3, “Project Segments and Descriptions Used in the DEIS,” shows the segments of the project limits that will be used throughout the Draft Environmental Impact Statement (DEIS) to describe the Kosciuszko Bridge. The through truss (Main Span) is named such because vehicles travel through the truss and was used here to allow greater clearance for ships. The deck trusses on the Brooklyn and Queens Approaches support the roadway from below. See Section II.C.1.o for further explanation of the types of structures that make up the bridge.
Because the bridge crosses over and, at the on- and off-ramps in Brooklyn, interacts with several local streets and intersections, the project also includes some physical changes to streets and intersections immediately adjacent to the highway.
FIGURE II-1: PROJECT LOCATION

Draft Environmental Impact Statement Section II.B
Kosciuszko Bridge Project II-3 March 2007
B. PROJECT EVOLUTION
Originally built in 1939, the Kosciuszko Bridge has been in service for over 65 years, during which time it has been expanded and repaired a number of times.
B.1. Construction of the Kosciuszko Bridge
A bridge across Newtown Creek has existed in the vicinity of the Kosciuszko Bridge as far back as 1811, when the “Penny Bridge” was constructed where present-day Meeker Avenue terminates near Gardner Avenue. Named for the toll that was charged to cross it, this bridge was in operation until the existing bridge, called the “Meeker Avenue Bridge” at the time, was completed and opened August 24, 1939. The following year, in July 1940, Mayor Fiorello LaGuardia renamed the bridge after the Polish-born Revolutionary War hero, Thaddeus Kosciuszko. Built prior to the BQE and the LIE, the bridge connected to Meeker Avenue between Morgan and Kingsland Avenues in Brooklyn and to Laurel Hill Boulevard near 54th Road in Queens.
The first section of the BQE, between the Williamsburg and Kosciuszko Bridges, was completed in 1950, with the rest of the highway completed by 1960. A major reconstruction of the BQE began in 1966 at the BQE-LIE Interchange that created the existing ramp configuration. Another major reconstruction effort began in 1967 which included replacement of the original 220 mm (8-1/2”) thick reinforced concrete slab with a 110 mm (4-1/4”) thick concrete filled steel grid deck; replacement of barriers, railings, lampposts, crossbeams, and the drainage system; and elimination of the two 2.4 m (8’-0”) wide sidewalks. For additional information on the history of the Kosciuszko Bridge and the surrounding area, see Section IV.B.3.d and Appendix M.
B.2. Recent Maintenance Efforts
Over the past two decades, the New York State Department of Transportation (NYSDOT) has spent considerable time and effort maintaining the Kosciuszko Bridge in safe working order. Whenever maintenance or repair efforts are conducted they not only have a financial impact in terms of the tax dollars that must be spent, but they also result in disruption to traffic operations. NYSDOT makes every effort to minimize operational effects by doing work during off-peak hours, but in a dense urban area such as this where there is very little “off-peak” period, every maintenance project results in impacts to traffic, either in the form of congestion delays or detours of vehicles from the highway.
The following list briefly describes the maintenance and repair activities undertaken by NYSDOT over the last two decades. For the specific location of identified spans, see section II.C.1.o.
August 1989 – Repair of cracked fascia stringers in Span 80 and Spans 91 through 100.
April 1990 – Removal of old grease in all expansion bearings to inspect the bearings, and replacement with new grease.
October 1992 – Repair of cracked crossbeam and stringer in Span 86.
November 1992 – Repair of crossbeam in Span 86.

Draft Environmental Impact Statement Section II.B
Kosciuszko Bridge Project II-4 March 2007
December 1993 to December 1996 (Interim Bridge Rehabilitation Project, Contract D254603) – Encasement of reinforced concrete piers with a 200 mm (8”) thick layer of concrete, replacement of deteriorated overlay, and miscellaneous structural steel repairs.
March 1999 – Installation of safety netting in Spans 80 thru 88 and Spans 91 thru 100 to catch falling fractured bolts from crossbeam-to-stringer connections.
September 2000 to December 2003 (Interim Bridge Rehabilitation Project, Contract D258476) – Cleaning, painting and miscellaneous structural steel repairs.
May 2002 – Removal of deteriorated polymer overlay and replacement with SuperPave Hot Mix Asphalt on approximately 45% of roadway area on deck truss and through truss spans.
October 2002 – Emergency repair of a hole that developed in the deck on Span 102 in Queens (eastbound direction).
June 2003 – Emergency repair of cracked box beam between stringers in Span 98.
July 2005 – Repair of the overhead sign structure on Span 97.
July 2005 to December 2006 – Resurfacing and deck repairs for bridge and ramps.
NYSDOT continues to maintain the bridge in safe, working order. However, as can be seen by the list above, doing so is becoming increasingly costly and disruptive. As described in Section II.C.2, a goal of this project is to find a cost-effective solution to the structural problems on the bridge. Continuing to maintain the bridge in the current manner not only fails to address the operational problems on the bridge, but will also require continued frequent maintenance at both significant financial and mobility costs.
B.3. 1995 Traffic Operations Study
Based on the findings of biennial inspections conducted in the 1980s and early 1990s that found the overall condition of the viaduct to be “poor” to “fair,” NYSDOT initiated the Kosciuszko Bridge Traffic Operations Study as part of a long range, comprehensive project to determine how best to address the deteriorated conditions of the bridge while minimizing impacts on motorists and the community during construction. That study, which looked at the same 1.8 km (1.1 mile) segment as this project, considered alternatives to rehabilitate the bridge, with and without the construction of a new adjacent bridge. The project, which involved extensive community outreach, included a significant traffic data collection effort, an origin-destination study, accident analysis and the projection of traffic demand to 2035.
The study found that, while from a structural standpoint, the bridge could be rehabilitated one-third at a time by closing two lanes at a time, the local street network was incapable of handling the diverted traffic. It also found that, without any additional capacity, operating conditions on the existing bridge would continue to deteriorate, resulting in Level of Service (LOS) F conditions on the highway and several ramps. These findings formed the basis of the alternatives development process for this project.

Draft Environmental Impact Statement Section II.B
Kosciuszko Bridge Project II-5 March 2007
Copies of the Kosciuszko Bridge Traffic Operations Study can be obtained by contacting:
Robert Adams, P.E. New York State Department of Transportation Hunters Point Plaza 47-40 21st Street Long Island City, NY 11101 Phone: (718) 482-4683 Email: [email protected]
B.4. Kosciuszko Bridge Project Scoping Process
The scoping process for the Kosciuszko Bridge Project, designed to identify the purpose and need, range of alternatives, and significant issues to be addressed in the DEIS, was conducted by NYSDOT from November 2001 to July 2002. During this process, NYSDOT created a range of opportunities for the public and city, state, and federal agencies to provide input to the project. This included small group briefings and presentations, meetings with elected officials and Community Board representatives, bus tours, open houses, and public scoping meetings. These activities introduced and described the environmental, planning, and engineering procedures to be used in the selection and evaluation of alternatives.
While a full description of scoping activities is provided in Section VII.C, key dates in the scoping process are listed below:
April 17, 2002 – Positive Declaration was published in the New York State Department of Environmental Conservation’s (NYSDEC) Environmental Notice Bulletin
April 25, 2002 – Notice of Intent Published in the Federal Register
May 14, 2002 – Queens Public Scoping Meeting
May 21, 2002 – Brooklyn Public Scoping Meeting
Additional details of the scoping process are provided in Section VII.C. The full text of the Positive Declaration, Notice of Intent, and the Draft and Final Public Scoping Memorandums, as well as a summary of the comments received during the scoping process, are included in Appendix S.

Draft Environmental Impact Statement Section II.C
Kosciuszko Bridge Project II-6 March 2007
C. CONDITIONS AND NEEDS
This section describes the existing and projected future No Build conditions of the Kosciuszko Bridge and explains the need for improvements.
C.1. Transportation Conditions, Deficiencies and Engineering Considerations
The following sections will describe the setting and physical characteristics of the bridge, existing and projected future No Build traffic volumes, analysis of accident patterns, and physical features of the structure, including existing non-standard features.
C.1.a. Functional Classification and National Highway System (NHS)
The Kosciuszko Bridge, as part of the BQE is functionally classified as an Urban Interstate Highway and is on both the Federal-Aid Interstate System and the National Highway System (NHS). The project roadway is not a Qualifying or Access Highway on the National Network of Designated Truck Access Highways. Nor is the project within 1.6 km (1 mile) of a Qualifying Highway.
Neither the Kosciuszko Bridge nor the BQE are part of the 4.9 m (16 ft) vertical clearance network designated by the Department of Defense for the emergency movement of military equipment.
C.1.b. Ownership and Maintenance Jurisdiction
NYSDOT owns and is responsible for maintenance of the Kosciuszko Bridge and its ramps, while the New York City Department of Transportation (NYCDOT) has responsibility for maintenance of the local streets surrounding the Kosciuszko Bridge.
C.1.c. Culture, Terrain and Climatic Conditions
The Kosciuszko Bridge is located within a dense urban area, with a mix of industrial, manufacturing, and residential land uses, as shown in Figure II-4, “General Land Use.” In Brooklyn, the area south of the Kosciuszko Bridge is predominantly industrial and manufacturing from Kingsland Avenue to Newtown Creek, with a few clusters of row houses south of Lombardy Street. There is also a public park, Sergeant William Dougherty Playground, located at the corner of Vandervoort Avenue and Cherry Street. North of the Kosciuszko Bridge, between Kingsland Avenue and Van Dam Street, residential uses dominate with some ground floor retail uses in the properties fronting on Meeker Avenue. East of Van Dam Street, uses are entirely industrial and manufacturing. In Queens, land uses are predominantly manufacturing and industrial with a handful of residential properties scattered throughout the area and Old Calvary Cemetery located to the west of the Kosciuszko Bridge.
In Brooklyn, the project area is generally level terrain, with only minimal changes in topography as the ground tends to slope down from its peak near Porter Avenue (16 m [52’-0”] above Mean High Water [MHW]) toward the bulkhead at Newtown Creek (6 m [20’-0”] above MHW). In Queens, the topography is slightly more undulating, but still slopes down toward the creek (4 m [13’-0”] above MHW) from a peak at 54th Avenue (18 m [59’-0”] above MHW).

Draft Environmental Impact Statement Section II.C
Kosciuszko Bridge Project II-7 March 2007
There are no unusual weather conditions in this area. The Kosciuszko Bridge is located in the northeastern United States where snowstorms frequently occur in the winter months, requiring snow removal and occasionally causing icy conditions.
C.1.d. Control of Access
As part of an interstate highway, access to the Kosciuszko Bridge is limited to vehicles traveling on the BQE or utilizing one of the ramps connecting to the bridge. As shown in Figure II-5, “Access to the BQE within the Project Limits,” in Brooklyn, the Vandervoort Avenue entrance ramp, beginning from Cherry Street just east of Vandervoort Avenue, connects to the eastbound BQE. Also in Brooklyn, the Meeker Avenue/Morgan Avenue exit ramp connects from the westbound BQE to Meeker Avenue near Van Dam Street. In Queens, ramps are provided for connection to and from the eastbound and westbound LIE as well as an entrance ramp to the westbound BQE from 43rd Street.
C.1.e. Existing Highway Section
The existing roadway section on the Kosciuszko Bridge consists of a divided travelway with a total of six through lanes (three eastbound and three westbound). The travelway widens at ramp areas to accommodate acceleration/deceleration lanes. A concrete median barrier separates eastbound and westbound traffic. At the Main Span, lane widths and shoulder widths are narrow and approaching grades are steep. The bridge is constructed of several different structure types along the length of the project, consisting of the Brooklyn Connector, Brooklyn Approach, Main Span and Queens Approach (see Figure II-3, “Project Segments and Descriptions Used in the DEIS,” for segment locations). The structure type and limits of each section are described in Section II.C.1.o. Details of these highway sections are presented in Table II-1. A plan of the existing roadway is shown on Figures II-6 through II-8, “Existing Highway Plan and Profile.” Engineering drawings of the existing conditions are included in Appendix D.
C.1.f. Abutting Highway Segments and Future Plans for Abutting Highway Segments
The bridge abuts the Meeker Avenue viaduct section of the BQE in Brooklyn and the BQE/LIE interchange in Queens. Details of the abutting highway sections of the BQE and adjacent sections of the LIE are provided in Table II-2 and illustrated on Figure II-9, “Abutting Highway Plan and Sections.”
To assure that the work being proposed in this DEIS is consistent with future plans for abutting highway segments, including long range system plans, a list of future projects being planned to take place in both Brooklyn and Queens was provided by the NYSDOT Regional Planning and Program Manager in a Planning Statement dated April 6, 2006. The following are highlights of studies and capital projects that are underway or are to begin shortly in Kings and Queens Counties close to or near the Kosciuszko Bridge Project study area:
KINGS COUNTY
Cadman Plaza Connector to the Brooklyn Bridge (NYCDOT) – Project will include the design of a path over the Brooklyn-bound roadway of the Brooklyn Bridge to link the existing promenade to the bridge with Cadman Plaza Park.
Brooklyn Bridge (NYCDOT) – Project will involve rehabilitation of the bridge.

Draft Environmental Impact Statement Section II.C
Kosciuszko Bridge Project II-8 March 2007
Gowanus Expressway (NYSDOT) – Project will involve a deck replacement, which will keep the expressway in operation until such time an alternative coming out of the EIS process can be advanced.
Brooklyn-Queens Expressway (NYSDOT) – Project will reconstruct/rehabilitate the Park Avenue viaduct section of BQE between Flushing Avenue and Sands Street.
Brooklyn-Queens Expressway Reconstruction (NYSDOT) - Project will reconstruct the cantilevered portion of the BQE beneath the Brooklyn Heights Esplanade between Atlantic Avenue and the Brooklyn Bridge.
QUEENS COUNTY
Roosevelt Avenue over Van Wyck Expressway (NYCDOT) – Project will reconstruct or rehabilitate the Roosevelt Avenue bridge over the Van Wyck Expressway.
Atlantic Avenue/LIRR (NYCDOT) – Project will reconstruct or rehabilitate the Atlantic Avenue bridge over the Long Island Rail Road (LIRR).
Brooklyn Queens Expressway (NYSDOT) – Project will reconstruct the section of BQE from 61st Street to Broadway.
Queens Plaza (New York City Department of City Planning [NYCDCP]) – Project will provide roadway and pedestrian improvements along Queens Plaza in a 30-block area in Long Island City.
Queens East River-North Shore Greenway (NYCDCP/New York City Department of Parks and Recreation [NYCDPR]) – Project will complete the proposed 8.5 mile greenway corridor along the East River, from the Pulaski Bridge to the Flushing Bay Esplanade.
Kew Gardens Interchange/Van Wyck Expressway (NYSDOT) – Project will provide operational and infrastructure improvements to the Kew Gardens Interchange.
Long Island Expressway/Grand Central Parkway/Van Wyck Expressway Interchange (NYSDOT) - Project will improve infrastructure, traffic operations and safety conditions on the expressways, connecting interchange ramps, and service roads in the project area.
None of the projects listed above are in the immediate vicinity of the Kosciuszko Bridge and, therefore, have no effect on the project.

Draft Environmental Impact Statement Section II.C
Kosciuszko Bridge Project II-9 March 2007
TABLE II-1: EXISTING HIGHWAY SECTION
Description Brooklyn Connector Brooklyn Approach Main Span Queens Approach
Right-of-way (ROW) Kingsland Avenue to Morgan Avenue: 50.62 m (166'-1") (within Meeker Avenue right-of-way)
Morgan Avenue to Stewart Avenue: varies 26.82 m (88'-0") to 47.28 m (155'-1") (NYSDOT ROW)
Varies 30.78 m (100'-11") to 48.49 m (159'-1") (NYSDOT ROW)
No ROW defined at Newtown Creek Varies 30.32 m (99'-6") to 78.34 m (257'-0") (NYSDOT ROW)
Mainline Travel Lanes 3 lanes eastbound (EB): 3.66 m (12'-0”) each
3 lanes westbound (WB): 3.66 m (12'-0”) each
3 lanes EB: 3.66 m (12'-0”) each
3 lanes WB: 3.66 m (12'-0”) each
3 lanes EB: 3.30 m (10'-10”) each
3 lanes WB: 3.30 m (10'-10”) each
3 lanes EB: 3.66 m (12'-0”) each
Varies 3 to 4 lanes WB: 3.66 m (12'-0”) each
Fascia Barrier (Width) Concrete Barrier: 0.30 m (1'-0”) Bridge Rail: 0.30 m (1'-0”) Bridge Rail: 0.30 m (1'-0”) Bridge Rail: 0.30 m (1'-0”)
Median Barrier (Width) Concrete Barrier: 0.61 m (2'-0”) Concrete Barrier: 0.61 m (2'-0”) Concrete Barrier: 0.61 m (2'-0”) Concrete Barrier: 0.61 m (2'-0”)
Mainline Structure Width (Fascia to Fascia)
West of ramps: 24.68 m (81'-0")
At ramps: 24.38 m (80'-0")
Varies 25.60 m (84'-0") to 26.20 m (86'-0") 26.13 m (85'-9") Varies 27.37 m (89'-10") to 26.8 m (88'-0")
Mainline Grades Varies 0.640% – 4.320% Varies 3.750% – 4.000% Crest Curve (Approach Grades vary 4.000% – 3.750%)
Varies 3.750% – 2.843%
Horizontal Curvature WB Right Barrier: radius = 330.46 m (1,084'-2")
Median Barrier: radius = 318.21 m (1,044'-4")
EB Right Barrier: radius = 305.82 m (1,003'-4")
WB Right Barrier: radius = 520.29 m (1,707'-10")
Median Barrier: radius = 533.40 m (1,749'-10")
EB Right Barrier: radius = 546.50 m (1,792'-10")
Not Applicable
WB Right Barrier: radius = 1,196.34 m (3,924'-10")
Median Barrier: radius = 1,210.97 m (3,972'-10")
EB Right Barrier: radius = 1,223.77 m (4,014'-10")
Shoulders Paved Shoulders
Left: 0.3 m (1'-0")
Right: 0.76 m (2'-6")
Paved Shoulders
Left: 0.3 m (1'-0")
Right: 1.52 m (5'-0") and varies
Paved Shoulders
Left: 0.3 m (1'-0")
Right: 0.15 m (0'-6")
Paved Shoulders
Left: 0.3 m (1'-0")
Right: 1.52 m (5'-0") and varies
Bikeway/Walkway None None None None
Parking Not Permitted Not Permitted Not Permitted Not Permitted
Clear Zones Varies 0.3 m (1'-0") to 1.22 m (4'-0") with scuppers Varies 0.3 m (1'-0") to 1.80 m (5'-11") with scuppers Varies 0.25 m (0'-10") to 0.30 m (1'-0") with scuppers Varies 0.3 m (1'-0") to 1.80 m (5'-11") with scuppers
Curb 0.25 m (10") high at outer lanes 0.25 m (10”) high at outer lanes 0.25 m (10”) high at outer lanes 0.25 m (10”) high at outer lanes
Access Ramps and Ramp Width
WB Exit to Meeker Avenue: 6.40 m (21'-0")
EB Entrance from Cherry Street: 6.40 m (21'-0")
None None EB LIE Entrance to WB BQE: varies 4.27 m (14'-0") to 6.10 m (20'-0")
WB LIE Entrance to WB BQE: 10.97 m (36'-0")
43rd Street Entrance to WB BQE: varies 4.88 m (16'-0") to 10.97 m (36'-0")
EB BQE Exit to EB LIE: 8.53 m (28'-0")
Ramp Grades Varies 2.857% – 3.663% Not Applicable Not Applicable Varies 0.430% – 3.568%

Draft Environmental Impact Statement Section II.C
Kosciuszko Bridge Project II-10 March 2007
TABLE II-2: ABUTTING HIGHWAY SECTIONS
Description BQE (Brooklyn Connector to Williamsburg Bridge) BQE (LIE Interchange to Queens Boulevard) LIE (BQE to Maurice Avenue) LIE (BQE to Greenpoint Avenue)
Travel Lanes Kingsland Avenue to Manhattan Avenue – 3 lanes eastbound (EB)/3 lanes westbound (WB): 3.66 m (12'-0") each
Manhattan Avenue to Williamsburg Bridge – Varies 3 to 4 lanes EB and WB: 3.66 m (12'-0") each
Varies 3 to 4 lanes WB: 3.66 m (12'-0") each
3 lanes EB: 3.66 m (12'-0") each
3 lanes EB: 3.66 m (12'-0") each
3 lanes WB: 3.66 m (12'-0") each
3 lanes EB: 3.66 m (12'-0") each
Varies 3 to 4 lanes WB: 3.66 m (12'-0") each
Fascia Barrier (Width) Concrete Barrier: varies 0.30 m (1'-0") to 0.76 m (2'-6") Concrete Barrier: 0.33 m (1'-1") Concrete Barrier: 0.41 m (1'-4") Concrete Barrier: 0.41 m (1'-4")
Median Barrier (Width) Concrete Barrier: 0.61 m (2'-0") Concrete Barrier: varies 0.61 m (2'-0") to 0.91 m (3'-0") Concrete Barrier: 0.61 m (2'-0") Concrete Barrier: 0.61 m (2'-0")
Mainline Structure Width
(Fascia to Fascia)
East of Humboldt Street ramps: 24.74 m (81'-2")
At Humboldt Street ramps: 34.93 m (114'-7")
East of LIE ramps: 27.17 m (89'-2")
West of 61st Street ramp: 31.08 m (102'-0")
West of Maurice Avenue ramps: 25.00 m (82'-0") West of LIE ramps: 42.00 m (137'-10")
Mainline Grades Kingsland Avenue to Manhattan Avenue: varies 0.15% to 1.65%
LIE Interchange to 58th Street: varies 0.38% to 0.69% Varies 0.78% to 3.35% Varies 1.00% to 3.59%
Horizontal Curvature WB centerline (C.L.): varies from radius = 471.80 m (1,547'-11") to 2,334.60 m (7,659'-5")
Median Barrier: varies from radius = 698.55 m (2,291'-0") to 4,572.01 m (15,000'-0")
EB C.L.: varies from radius = 685.80 m (2,250'-0") to 3,372.92 m (11,066'-0")
Median Barrier: varies from radius = 582.13 m (1,909'-10") to 1,164.25 m (3,819'-9")
Median Barrier: varies from radius = 198.81 m (652'-3") to 682.80 m (2,240'-2")
Median Barrier: radius = 762.00 m (2,500'-0")
Shoulders Paved Shoulders
Left: 0.30 m (1'-0")
Right: 0.76 m (2'-6") and varies
Paved Shoulders
Left: 0.76 m (2'-6")
Right: 1.07 m (3'-6")
Paved Shoulders
Left: 0.30 m (1'-0")
Right: 3.05 m (10'-0")
Paved Shoulders
Left: 0.30 m (1'-0")
Right: varies 0.0 m (6'-0") to 0.30 m (1'-0")
Bikeway/Walkway None None None None
Parking Not Permitted Not Permitted Not Permitted Not Permitted
Clear Zones 0.30 m (1'-0") and varies with scuppers Varies 0.76 m (2'-6") to 1.07 m (3'-6") Varies 0.30 m (1'-0") to 3.05 m (10'-0") Varies 0.0 m (0'-0") to 0.30 m (1'-0")
Access Ramps and Ramp Width (Curb to Curb)
WB entrance at Humboldt Street: 8.38 m (27'-6")
WB exit at Union Avenue: 5.49 m (18'-0")
EB exit at Humboldt Street: 8.38 m (27'-6")
WB entry at 47th Street: 7.32 m (24'-0") **
WB entry at 61st Street: 7.62 m (25’-0”) **
WB exit at 64th Street: 4.57 m (15’-0”) **
EB exit at 64th Street: 4.57 m (15’-0”) **
EB entry at 48th Street: 7.32 m (24'-0") **
WB exit at 48th Street: 10.66 m (33'-0") **
WB & EB ramps at Maurice Avenue: 4.27 m (14'-0")
WB entry at 40th Street: 4.27 m (14'-0") min and varies
EB exit at 39th Street: 7.32 m (24'-0")
WB exit at 39th Street: 6.71 m (22’-0”)
Ramp Grades Humboldt Street ramps: varies 2.54% to 3.38%
WB exit at Union Avenue: varies 0.19% to 6.00%
WB exit at 47th Street: varies 4.73% to 4.93%
WB entry at 61st Street: varies 2.17% to 4.54%
WB exit at 64th Street: varies 2.05% to 4.88%
EB exit at 64th Street: varies 1.54% to 3.62%
EB entry at 48th Street: varies 1.00% to 2.99%
WB exit at 48th Street: varies 1.00% to 2.99%
WB & EB ramps at Maurice Avenue: 2.67%
WB entry at 40th Street: varies 1.79% to 2.53%
EB exit at 39th Street: varies 2.03% to 3.48%
WB exit at 39th Street: varies 2.23% to 5.39%

Draft Environmental Impact Statement Section II.C
Kosciuszko Bridge Project II-11 March 2007
C.1.g. Speeds and Delay
This section discusses travel speed and delay data within the project’s Traffic Study Areas, including existing conditions and forecasts for the No Build Alternative in 2015 and 2045. Travel speed and delay estimates for the Build Alternatives are presented in Section III.C.2.b.
TRAFFIC STUDY AREAS
For the Kosciuszko Bridge Project, Primary and Secondary Traffic Study Areas, shown in Figure II-10, “Kosciuszko Bridge Project Traffic Study Areas,” were defined to delineate the portion of the surrounding highway and street network that may be affected by the project. The Primary Traffic Study Area includes the highways and streets roughly bounded by the LIE, Grand Street/Grand Avenue, and the East River. The larger Secondary Traffic Study Area extends outward from the Primary Traffic Study Area to Queens Boulevard and Flushing Avenue. The traffic data collection and analysis described throughout this DEIS focus on the Primary Traffic Study Area and key intersections in the Secondary Traffic Study Area.
METHODOLOGY
As part of the project’s extensive traffic data collection effort, described in detail in Appendix B, travel time and delay surveys were conducted on 15 major routes in the study area using the “floating-car method,” in which the test vehicle is driven to “float” with traffic at prevailing speeds along the travel route. The travel time/speed data provides a general measure of prevailing traffic flow along the travel route. The delay data identifies the locations, the types, and the extent of traffic congestion on the travel routes in the study area.
Three runs were completed in each direction during the weekday a.m. (6:00-10:00 a.m.), midday (10:00 a.m.-3:00 p.m.), p.m. (3:00-7:00 p.m.), and Saturday midday (10:00 a.m.-3:00 p.m.) periods. Elapsed time and any en route delays (e.g. accident, signal, vehicle breakdown, etc.) were recorded for each segment along each route. The travel time and delay survey routes are described below and shown in Figure II-11, “Travel Time and Delay Run Routes.”
1. Brooklyn-Queens Expressway - Eastbound (EB) from Tillary Street entrance to exit to Queens Boulevard - Westbound (WB) from exit to Queens Boulevard WB to exit to Tillary Street/Manhattan Bridge
2. Long Island Expressway - EB from Queens Midtown Tunnel (QMT) entrance at toll plaza to exit to Queens Boulevard - WB from Queens Boulevard entrance to exit to Van Dam Street
3. BQE & LIE connections - BQE EB from Vandervoort Avenue entrance to entrance to EB LIE via LIE EB service road - BQE WB from exit to WB BQE via LIE WB service road to exit to Meeker Avenue/Morgan Avenue
4. Queens Midtown Tunnel (QMT) - LIE EB from Manhattan via QMT to Review Avenue via exit to Laurel Hill Boulevard. - LIE WB from Review Avenue via 37th Street/Van Dam Street entrance to Manhattan via QMT
5. Meeker Avenue - EB from Metropolitan Avenue to entrance to BQE after Vandervoort Avenue - WB from BQE exit to Meeker Avenue to Metropolitan Avenue
6. Metropolitan Avenue - EB from Kent Avenue to Vandervoort Avenue - WB from Vandervoort Avenue to Kent Avenue

Draft Environmental Impact Statement Section II.C
Kosciuszko Bridge Project II-12 March 2007
7. Grand Street/Grand Avenue - EB from Marcy Avenue to LIE - WB from LIE to Marcy Avenue
8. Flushing Avenue - EB from Classon Avenue/Rutledge Street to Grand Avenue - WB from Grand Avenue to Classon Avenue/Rutledge Street
9. Greenpoint Avenue - EB from Kent Avenue to Queens Boulevard - WB from Queens Boulevard to Kent Avenue
10. Kent Avenue - Northbound (NB) from Flushing Avenue to Dupont Street - Southbound (SB) from Dupont Street to Flushing Avenue
11. McGuinness Boulevard/Pulaski Bridge - NB from BQE/Meeker Avenue EB to Jackson Avenue - SB from Jackson Avenue to BQE/Meeker Avenue EB
12. Humboldt Street & Kingsland Avenue - Kingsland Avenue NB from Maspeth Avenue to Greenpoint Avenue - Humboldt Street SB from Greenpoint Avenue to Flushing Avenue
13. Vandervoort Avenue - NB from Grand Street to Meeker Avenue/BQE WB - SB from Meeker Avenue/BQE EB to Grand Street
14. Rust Street/56th Road/Review Avenue - EB from Greenpoint Avenue to Grand Avenue - WB from Grand Avenue to Greenpoint Avenue
15. Maurice Avenue/Page Place - EB from Grand Avenue to 69th Street - WB from 69th Street to Grand Avenue
The travel time and delay survey routes along the BQE and LIE extended significantly beyond the project limits in an attempt to identify congestion originating beyond but affecting the study area. This data was also used to calibrate the project’s forecasting model.
EXISTING CONDITIONS
The following sections present the findings of the travel speed and delay analysis for existing conditions. Due to the variation in travel times and travel speeds between segments, average travel times and average travel speeds were computed for each segment to facilitate system-level comparisons. Detailed summaries of individual travel time surveys along these travel routes are provided in Appendix B.
BROOKLYN-QUEENS EXPRESSWAY
The posted speed limit on the BQE within the project limits is 45 mph (72 km/h). However, actual operating speeds in both the eastbound and westbound directions during peak periods are typically lower than the posted limit. The main contributing factor for this condition is the recurring congestion that normally extends from adjacent major interchanges (LIE to the east and Williamsburg Bridge to the west) into the study area. Other predominant factors include the high mainline and ramp traffic volumes, the lane direction/lane distribution (number of lanes provided on the East River bridges into and out of Manhattan) and the existing non-standard features such as narrow travel lanes, steep grades, poor sight distance, short merges and diverges, lack of shoulders, and the deteriorating pavement conditions. Tables II-3 and II-4

Draft Environmental Impact Statement Section II.C
Kosciuszko Bridge Project II-13 March 2007
present the a.m., midday, and p.m. peak hour average travel time and average travel speed for the eastbound and westbound segments on the BQE, respectively.
TABLE II-3: 2002 EXISTING TRAVEL TIME AND SPEEDS - EASTBOUND BQE
Average Travel Time sec (min)
Average Travel Speed km/h (mph)
Highway Segment
Distance Meters (Feet) A.M. Midday P.M. A.M. Midday P.M.
Tillary Street to Flushing Avenue 1,313 (4,309)
73.0 (1.2)
97.0 (1.6)
133.0 (2.2)
64.8 (40.2)
48.7 (30.3)
35.6 (22.1)
Flushing Avenue to Williamsburg Street 819 (2,688)
33.5 (0.6)
97.0 (1.6)
110.0 (1.8)
88.0 (54.7)
30.4 (18.9)
26.8 (16.7)
Williamsburg Street to Metropolitan Avenue
1,043 (3,421)
53.5 (0.9)
93.0 (1.6)
106.0 (1.8)
70.2 (43.6)
40.4 (25.1)
35.4 (22.0)
Metropolitan Avenue to Williamsburg Bridge
256 (840)
9.5 (0.2)
13.0 (0.2)
42.0 (0.7)
97.0 (60.3)
70.9 (44.1)
21.9 (13.6)
Williamsburg Bridge to McGuinness Boulevard
990 (3,247)
79.5 (1.3)
82.0 (1.4)
221.0 (3.7)
44.8 (27.8)
43.4 (27.0)
16.1 (10.0)
McGuinness Boulevard to Vandervoort Avenue
942 (3,089)
72.0 (1.2)
220.0 (3.7)
228.0 (3.8)
47.1 (29.3)
15.4 (9.6)
14.9 (9.2)
Vandervoort Avenue to EB/WB LIE Service Road
1,326 (4,351)
79.0 (1.3)
219.0 (3.7)
154.0 (2.6)
60.4 (37.6)
21.8 (13.5)
31.0 (19.3)
EB/WB LIE Service Road to EB LIE Service Road
338 (1,109)
14.0 (0.2)
19.0 (0.3)
33.0 (0.6)
86.9 (54.0)
64.0 (39.8)
36.9 (22.9)
EB LIE Service Road to Queens Boulevard
1,920 (6,300)
103.0 (1.7)
113.0 (1.9)
128.0 (2.1)
67.1 (41.7)
61.2 (38.0)
54.0 (33.6)
Total/Average 8,947 (29,354)
517.0 (8.6)
953.0 (15.9)
1,155.0 (19.3)
62.3 (38.7)
33.8 (21.0)
27.9 (17.3)

Draft Environmental Impact Statement Section II.C
Kosciuszko Bridge Project II-14 March 2007
TABLE II-4: 2002 EXISTING TRAVEL TIME AND SPEEDS - WESTBOUND BQE
Average Travel Time sec (min)
Average Travel Speed km/h (mph)
Highway Segment
Distance Meters (Feet) A.M. Midday P.M. A.M. Midday P.M.
Queens Boulevard to WB LIE/QMT 1,312 (4,303)
231.0 (3.9)
57.0 (1.0)
247.0 (4.1)
20.4 (12.7)
82.8 (51.5)
19.1 (11.9)
WB LIE/QMT to EB/WB LIE 611 (2,006)
80.5 (1.3)
52.0 (0.9)
125.0 (2.1)
27.3 (17.0)
42.3 (26.3)
17.6 (10.9)
EB/WB LIE to Meeker Avenue/Morgan Avenue
1,099 (3,606)
137.0 (2.3)
105.0 (1.8)
288.0 (4.8)
28.9 (17.9)
37.7 (23.4)
13.7 (8.5)
Meeker Avenue/Morgan Avenue to McGuinness Boulevard
1,284 (4,213)
62.5 (1.0)
66.0 (1.1)
277.0 (4.6)
74.0 (46.0)
70.0 (43.5)
16.7 (10.4)
McGuinness Boulevard to Metropolitan Avenue
439 (1,441)
31.5 (0.5)
39.0 (0.7)
216.0 (3.6)
50.2 (31.2)
40.5 (25.2)
7.3 (4.5)
Metropolitan Avenue to Williamsburg Bridge
517 (1,695)
37.5 (0.6)
44.0 (0.7)
190.0 (3.2)
49.6 (30.8)
42.3 (26.3)
9.8 (6.1)
Williamsburg Bridge to Marcy Avenue 140 (459)
9.0 (0.2)
19.0 (0.3)
56.0 (0.9)
56.0 (34.8)
26.5 (16.5)
9.0 (5.6)
Marcy Avenue to Wythe Avenue/Kent Avenue
1,059 (3,474)
65.0 (1.1)
55.0 (0.9)
435.0 (7.3)
58.6 (36.4)
69.3 (43.1)
8.8 (5.4)
Wythe Avenue/Kent Avenue to Flushing Avenue
848 (2,783)
41.5 (0.7)
62.0 (1.0)
550.0 (9.2)
73.6 (45.7)
49.3 (30.6)
5.6 (3.5)
Flushing Avenue to Tillary Street 1,482 (4,863)
84.5 (1.4)
110.0 (1.8)
808.0 (13.5)
63.1 (39.2)
48.5 (30.1)
6.6 (4.1)
Total/Average 8,791 (28,843)
780.0 (13.0)
609.0 (10.2)
3,192.0 (53.2)
40.6 (25.2)
52.0 (32.3)
9.9 (6.2)
A comparison of travel speeds in the eastbound and westbound directions indicates that most segments in the eastbound direction have higher average travel speeds than the segments in the westbound direction. In addition, average travel speeds in the eastbound direction during the a.m. peak period (62.3 km/h, 38.7 mph) are substantially higher than average speeds in the westbound direction during the a.m. (40.6 km/h, 25.2 mph), midday (52.0 km/h, 32.3 mph), or p.m. (9.9 km/h, 6.2 mph) peak periods. This latter speed in the westbound direction is of particular note since it represents the average speed in the non-peak direction and travel speeds in non-peak directions are typically higher than speeds in peak directions. This low speed is attributed to downstream congestion caused by reduced capacity (lane reversals) at the various East River bridges into Manhattan during the p.m. peak period.
LONG ISLAND EXPRESSWAY
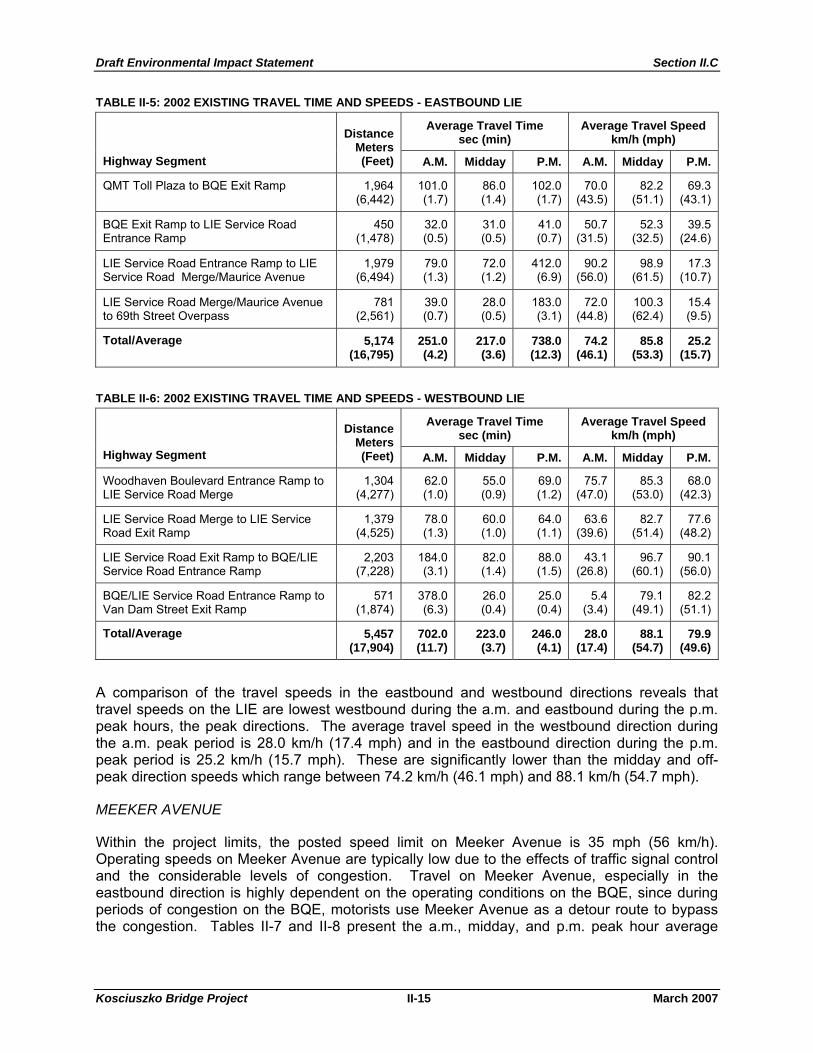
The posted speed limit on the LIE within the project limits is also 45 mph (72 km/h). Due to geometric constraints, ramp connections between the LIE and BQE have lower posted speed limits, typically 30 mph (48 km/h). Operating speeds on the LIE mainline and connections to the BQE are similar to those on the BQE mainline, where speeds are predominantly lower than the posted speeds during each peak period. Tables II-5 and II-6 present the a.m., midday, and p.m. peak hour average travel time and speed for the eastbound and westbound segments on the LIE, respectively.
Draft Environmental Impact Statement Section II.C
Kosciuszko Bridge Project II-15 March 2007
TABLE II-5: 2002 EXISTING TRAVEL TIME AND SPEEDS - EASTBOUND LIE
Average Travel Time sec (min)
Average Travel Speed km/h (mph)
Highway Segment
Distance Meters (Feet) A.M. Midday P.M. A.M. Midday P.M.
QMT Toll Plaza to BQE Exit Ramp 1,964 (6,442)
101.0 (1.7)
86.0 (1.4)
102.0 (1.7)
70.0 (43.5)
82.2 (51.1)
69.3 (43.1)
BQE Exit Ramp to LIE Service Road Entrance Ramp
450 (1,478)
32.0 (0.5)
31.0 (0.5)
41.0 (0.7)
50.7 (31.5)
52.3 (32.5)
39.5 (24.6)
LIE Service Road Entrance Ramp to LIE Service Road Merge/Maurice Avenue
1,979 (6,494)
79.0 (1.3)
72.0 (1.2)
412.0 (6.9)
90.2 (56.0)
98.9 (61.5)
17.3 (10.7)
LIE Service Road Merge/Maurice Avenue to 69th Street Overpass
781 (2,561)
39.0 (0.7)
28.0 (0.5)
183.0 (3.1)
72.0 (44.8)
100.3 (62.4)
15.4 (9.5)
Total/Average 5,174 (16,795)
251.0 (4.2)
217.0 (3.6)
738.0 (12.3)
74.2 (46.1)
85.8 (53.3)
25.2 (15.7)
TABLE II-6: 2002 EXISTING TRAVEL TIME AND SPEEDS - WESTBOUND LIE
Average Travel Time sec (min)
Average Travel Speed km/h (mph)
Highway Segment
Distance Meters (Feet) A.M. Midday P.M. A.M. Midday P.M.
Woodhaven Boulevard Entrance Ramp to LIE Service Road Merge
1,304 (4,277)
62.0 (1.0)
55.0 (0.9)
69.0 (1.2)
75.7 (47.0)
85.3 (53.0)
68.0 (42.3)
LIE Service Road Merge to LIE Service Road Exit Ramp
1,379 (4,525)
78.0 (1.3)
60.0 (1.0)
64.0 (1.1)
63.6 (39.6)
82.7 (51.4)
77.6 (48.2)
LIE Service Road Exit Ramp to BQE/LIE Service Road Entrance Ramp
2,203 (7,228)
184.0 (3.1)
82.0 (1.4)
88.0 (1.5)
43.1 (26.8)
96.7 (60.1)
90.1 (56.0)
BQE/LIE Service Road Entrance Ramp to Van Dam Street Exit Ramp
571 (1,874)
378.0 (6.3)
26.0 (0.4)
25.0 (0.4)
5.4 (3.4)
79.1 (49.1)
82.2 (51.1)
Total/Average 5,457 (17,904)
702.0 (11.7)
223.0 (3.7)
246.0 (4.1)
28.0 (17.4)
88.1 (54.7)
79.9 (49.6)
A comparison of the travel speeds in the eastbound and westbound directions reveals that travel speeds on the LIE are lowest westbound during the a.m. and eastbound during the p.m. peak hours, the peak directions. The average travel speed in the westbound direction during the a.m. peak period is 28.0 km/h (17.4 mph) and in the eastbound direction during the p.m. peak period is 25.2 km/h (15.7 mph). These are significantly lower than the midday and off- peak direction speeds which range between 74.2 km/h (46.1 mph) and 88.1 km/h (54.7 mph).
MEEKER AVENUE
Within the project limits, the posted speed limit on Meeker Avenue is 35 mph (56 km/h). Operating speeds on Meeker Avenue are typically low due to the effects of traffic signal control and the considerable levels of congestion. Travel on Meeker Avenue, especially in the eastbound direction is highly dependent on the operating conditions on the BQE, since during periods of congestion on the BQE, motorists use Meeker Avenue as a detour route to bypass the congestion. Tables II-7 and II-8 present the a.m., midday, and p.m. peak hour average

Draft Environmental Impact Statement Section II.C
Kosciuszko Bridge Project II-16 March 2007
travel time and speed for the eastbound and westbound segments on Meeker Avenue, respectively.
TABLE II-7: 2002 EXISTING TRAVEL TIME AND SPEEDS - EASTBOUND MEEKER AVENUE
Average Travel Time sec (min)
Average Travel Speed km/h (mph)
Roadway Segment
Distance Meters (Feet) A.M. Midday P.M. A.M. Midday P.M.
Manhattan Avenue to McGuinness Boulevard/Humboldt Street
269 (882)
68.0 (1.1)
45.0 (0.8)
55.0 (0.9)
14.2 (8.8)
21.5 (13.4)
17.6 (10.9)
McGuinness Boulevard/Humboldt Street to Kingsland Avenue
396 (1,299)
98.5 (1.6)
36.0 (0.6)
41.0 (0.7)
14.5 (9.0)
39.6 (24.6)
34.8 (21.6)
Kingsland Avenue to Morgan Avenue 200 (655)
23.0 (0.4)
54.0 (0.9)
32.5 (0.5)
31.2 (19.4)
13.3 (8.3)
22.1 (13.7)
Morgan Avenue to Vandervoort Avenue 176 (576)
23.0 (0.4)
70.0 (1.2)
30.5 (0.5)
27.5 (17.1)
9.0 (5.6)
20.7 (12.9)
Vandervoort Avenue to BQE Entrance Ramp
92 (301)
15.5 (0.3)
13.0 (0.2)
8.5 (0.1)
21.3 (13.2)
25.4 (15.8)
38.8 (24.1)
Total/Average 1,132 (3,713)
228.0 (3.8)
218.0 (3.6)
167.5 (2.8)
17.9 (11.1)
18.7 (11.6)
24.3 (15.1)
TABLE II-8: 2002 EXISTING TRAVEL TIME AND SPEEDS - WESTBOUND MEEKER AVENUE
Average Travel Time sec (min)
Average Travel Speed km/h (mph)
Roadway Segment
Distance Meters (Feet) A.M. Midday P.M. A.M. Midday P.M.
BQE Exit Ramp to Apollo Street 95 (312)
32.0 (0.5)
50.0 (0.8)
22.0 (0.4)
10.7 (6.6)
6.8 (4.3)
15.6 (9.7)
Apollo Street to Morgan Avenue 183 (602)
44.5 (0.7)
31.0 (0.5)
19.0 (0.3)
14.8 (9.2)
21.3 (13.2)
34.8 (21.6)
Morgan Avenue to Kingsland Avenue 198 (649)
16.5 (0.3)
20.0 (0.3)
18.0 (0.3)
43.2 (26.8)
35.6 (22.1)
39.6 (24.6)
Kingsland Avenue to McGuinness Boulevard
352 (1,156)
108.0 (1.8)
100.0 (1.7)
85.0 (1.4)
11.7 (7.3)
12.7 (7.9)
14.9 (9.3)
McGuinness Boulevard to Manhattan Avenue
269 (882)
38.5 (0.6)
22.0 (0.4)
45.0 (0.8)
25.1 (15.6)
44.0 (27.3)
21.5 (13.4)
Total/Average 1,098 (3,601)
239.5 (4.0)
223.0 (3.7)
189.0 (3.2)
16.5 (10.3)
17.7 (11.0)
20.9 (13.0)
Comparisons of travel speeds along Meeker Avenue in both the eastbound and westbound directions indicate that speeds remain fairly constant during each of the peak periods. In the eastbound direction average travel speeds range from 17.9 km/h (11.1 mph) in the a.m. peak period to 24.3 km/h (15.1 mph) in the p.m. peak period. Similarly, speeds in the westbound direction did not vary significantly between peak periods ranging between 16.5 km/h (10.3 mph) in the a.m. peak period and 20.9 km/h (13.0 mph) in the p.m. peak period.

Draft Environmental Impact Statement Section II.C
Kosciuszko Bridge Project II-17 March 2007
OTHER MAJOR LOCAL STREETS
The posted speed limit on most major local streets in the study area is 30 mph (48 km/h). Operating speeds on these streets are also usually lower than the posted speeds due to high traffic volumes, turning maneuvers, commercial activities with numerous parking maneuvers, and other factors that impede traffic flow.
85TH PERCENTILE SPEED
The 85th percentile speed, which is often used as a measure of the upper limit of reasonable speeds for a particular location or stretch of roadway, reflects the range of speeds within which most vehicles travel and is an indicator of the adequacy of the design speed of the facility. The 85th percentile speed is typically developed through a spot speed survey, which measures the speed of vehicles at specific locations by the use of a radar gun. Since the BQE is an elevated structure with no overpasses and the Kosciuszko Bridge lacks available space to safely survey highway speed with a radar gun, no spot speed surveys were performed. However, travel time runs were performed in both directions of the BQE during off-peak hours (12 midnight to 3:00 a.m.) when traffic volumes are lower and traffic most resembles free flow conditions. It is estimated that the 85th percentile speed on the BQE in both directions ranges between 84 km/h (52 mph) and 93 km/h (58 mph). This is typical for urban interstates and consistent with other sections of the BQE. According to Section 2.7.1.1A of the NYSDOT Highway Design Manual, the recommended minimum design speed for an urban interstate is 80 km/h (50 mph) and the maximum design speed is 110 km/h (68 mph). The BQE falls within this range.
The 85th percentile speed along westbound and eastbound Meeker Avenue is estimated to be 50 km/h (31 mph) corresponding to the minimum design speed for urban arterials in Central Business District (CBD) areas.
VEHICLE HOURS OF DELAY
Traffic forecasting and analysis for the project was facilitated using the New York Metropolitan Transportation Council (NYMTC) Best Practice Model (BPM), a regional travel demand model, and VISSIM, a micro-simulation model. The BPM was developed to forecast and the VISSIM model to analyze and simulate traffic conditions for the project. For a detailed description of the BPM refer to Section II.C.1.h and Appendix B.
These models were used to predict vehicle hours of delay (VHD) for the regional (BPM) and local (VISSIM) roadway systems. Delay is the additional time experienced by motorists due to interruption in flow, friction caused by high traffic volume and congestion, incidents, and other adverse traffic conditions. Delay can be defined as the difference between actual travel time and free-flow travel time. The total VHD for an area can be calculated by summing the delay experienced by each vehicle during a specified time period. VHD for existing conditions were analyzed for two distinctive areas. The first area analyzed was the BQE project limits from the McGuinness Boulevard/Humboldt Street interchange to the LIE interchange, the core area of the project. This area also included eastbound and westbound Meeker Avenue between the McGuinness Boulevard/Humboldt Street interchange and the entrance and exit ramps near Vandervoort Avenue/Apollo Street. The second area of the analysis is much more comprehensive, covering the project’s entire Primary and Secondary Traffic Study Areas as an entire network.

Draft Environmental Impact Statement Section II.C
Kosciuszko Bridge Project II-18 March 2007
The VHD for the BQE in the core area was obtained from VISSIM. The results indicate a total of 65.61 VHD for the eastbound direction and 97.67 VHD for the westbound direction during the a.m. peak hour. VHD for the same BQE segments during the p.m. peak hour was estimated at 147.64 for the eastbound direction and 253.94 for the westbound direction. VHD for Meeker Avenue was also calculated for the combined eastbound and westbound directions, resulting in 30.02 and 164.19 VHD for the a.m. and p.m. peak hours, respectively.
The VHD for the Primary and Secondary Traffic Study Areas was obtained from the TransCAD subarea model. The analysis incorporated all the highways and local streets in the traffic model. The results indicate a total of 2,708 VHD for the a.m. peak hour and 1,610 VHD for the p.m. peak hour.
FUTURE CONDITIONS
The following section presents projected travel speed and delay analysis for 2015, the project’s estimated time of completion (ETC) and for 2045, the project’s design year for the No Build Alternative. These results are based on calculations made using the VISSIM micro-simulation model with traffic volume projections from the BPM. Future analysis concentrates on peak hours that experience the most critical traffic conditions. Based on existing conditions, the most critical traffic conditions occur in the morning peak hour when the westbound BQE carries the highest traffic volumes, and in the afternoon peak hour when the eastbound BQE carries the highest traffic volumes. Detailed summaries of the results are provided in Appendix B. For projections of travel speeds and delay for the Build Alternatives see Section III.C.2.b.
TRAVEL TIME AND DELAY
Travel time and travel speed projections for the 2015 and 2045 No Build conditions were completed for five BQE segments within the Primary Study Area. Tables II-9 and II-10 present the results of this analysis for the a.m. and p.m. peak hours on the eastbound and westbound BQE, respectively.

Draft Environmental Impact Statement Section II.C
Kosciuszko Bridge Project II-19 March 2007
TABLE II-9: PROJECTED 2015 AND 2045 NO BUILD TRAVEL TIME AND SPEEDS - EASTBOUND BQE
Average Travel Time sec (min)
Average Travel Speed km/h (mph)
2015 2045 2015 2045
Highway Segment
Distance Meters (Feet) A.M. P.M. A.M. P.M. A.M. P.M. A.M. P.M.
Williamsburg Bridge to McGuinness Boulevard
869 (2,851)
94.4 (1.6)
237.1 (4.0)
223.5 (3.7)
228.7 (3.8)
33.1 (20.6)
13.2 (8.2)
14.0 (8.7)
13.7 (8.5)
McGuinness Boulevard to Vandervoort Avenue
1,207 (3,960)
110.2 (1.8)
465.6 (7.8)
333.4 (5.6)
710.7 (11.8)
39.4 (24.5)
9.3 (5.8)
13.0 (8.1)
6.1 (3.8)
Vandervoort Avenue to top of Kosciuszko Bridge
499 (1,637)
33.1 (0.6)
62.0 (1.0)
41.5 (0.7)
72.5 (1.2)
54.2 (33.7)
29.0 (18.0)
43.3 (26.9)
24.8 (15.4)
Top of Kosciuszko Bridge to EB/WB LIE Service Road
595 (1,954)
53.5 (0.9)
85.4 (1.4)
54.8 (0.9)
73.1 (1.2)
40.1 (24.9)
24.8 (15.4)
39.1 (24.3)
29.3 (18.2)
EB/WB LIE Service Road to EB LIE Service Road
338 (1,109)
16.6 (0.3)
33.6 (0.6)
16.8 (0.3)
33.6 (0.6)
73.2 (45.5)
36.2 (22.5)
72.6 (45.1)
36.2 (22.5)
Total/Average 3,508 (11,511)
307.8 (5.1)
884.8 (14.7)
669.9 (11.2)
1,118.7 (18.6)
41.0 (25.5)
14.3 (8.9)
18.9 (11.7)
11.3 (7.0)
TABLE II-10: PROJECTED 2015 AND 2045 NO BUILD TRAVEL TIME AND SPEEDS - WESTBOUND BQE
Average Travel Time sec (min)
Average Travel Speed km/h (mph)
2015 2045 2015 2045
Highway Segment
Distance Meters (Feet) A.M. P.M. A.M. P.M. A.M. P.M. A.M. P.M.
WB LIE/QMT to EB/WB LIE 612 (2,006)
108.7 (1.8)
126.8 (2.1)
109.5 (1.8)
134.2 (2.2)
20.3 (12.6)
17.4 (10.8)
20.1 (12.5)
16.4 (10.2)
EB/WB LIE to top of Kosciuszko Bridge
595 (1,954)
88.2 (1.5)
154.8 (2.6)
95.1 (1.6)
164.4 (2.7)
24.3 (15.1)
13.8 (8.6)
22.5 (14.0)
13.0 (8.1)
Top of Kosciuszko Bridge to Meeker/Morgan Avenue
483 (1,584)
76.1 (1.3)
152.2 (2.5)
80.6 (1.3)
136.8 (2.3)
22.8 (14.2)
11.4 (7.1)
21.6 (13.4)
12.7 (7.9)
Meeker Avenue/Morgan Avenue to McGuinness Boulevard
1,287 (4,224)
114.3 (1.9)
405.6 (6.8)
118.5 (2.0)
423.5 (7.1)
40.5 (25.2)
11.4 (7.1)
39.1 (24.3)
10.9 (6.8)
McGuinness Boulevard to Metropolitan Avenue
306 (1,003)
25.5 (0.4)
180.2 (3.0)
25.1 (0.4)
180.2 (3.0)
43.1 (26.8)
6.1 (3.8)
43.9 (27.3)
6.1 (3.8)
Total/Average 3,283 (10,771)
412.8 (6.9)
1,019.5 (17.0)
428.9 (7.1)
1,039.0 (17.3)
28.6 (17.8)
11.6 (7.2)
27.6 (17.1)
11.4 (7.1)
By the year 2015, travel on the BQE, when compared to current conditions, will be made at slower speeds and will require longer travel times. A comparison of average travel times during the a.m. peak period between 2002 existing conditions and 2015 projected No Build conditions indicates that BQE travel time in the eastbound direction will increase from 4.0 minutes to 5.1 minutes, with average speeds decreasing from 53.9 km/h (33.5 mph) to 41.0 km/h (25.5 mph). Average travel times in the westbound direction during the a.m. peak period are also expected to increase from 5.1 minutes to 6.9 minutes with speeds decreasing from 40.4 km/h (25.1 mph)

Draft Environmental Impact Statement Section II.C
Kosciuszko Bridge Project II-20 March 2007
to 28.6 km/h (17.8 mph). Average travel times in the eastbound p.m. peak period are projected to increase from 10.7 to 14.7 minutes with a speed reduction from 20.2 km/h (12.5 mph) to 14.3 km/h (8.9 mph). Similarly, it is projected that average travel time in the westbound direction, during the p.m. peak period will increase from 15.1 to 17.0 minutes with an average speed reduction from 13.6 km/h (8.5 mph) to 11.6 km/h (7.2 mph). These results indicate that eastbound traffic conditions on the BQE in 2015 will be congested with average travel speeds below 33.1 km/h (20.6 mph) during both a.m. and p.m. peak periods.
Travel projections for 2045 indicate even lower speeds and longer travel times. By 2045 most BQE segments within the project study area will operate over capacity during each of the peak periods. The results indicate that the eastbound direction during the a.m. peak period will experience the greatest increase in travel time between 2015 and 2045. It will take an additional 6.1 minutes (120 percent increase) to travel the same BQE segments with a corresponding speed of 18.9 km/h (11.7 mph). Similarly, but not as severe, it will take an additional 3.9 minutes (27 percent increase) to travel the same BQE segments during the p.m. peak period with an average travel speed of 11.3 km/h (7.0 mph).
VEHICLE HOURS OF DELAY
The decreasing travel speeds and much longer travel times that have been projected for both 2015 and 2045 under the No Build Alternative would result in significant increases in the overall level of travel delays for the project roadways. The 2015 VHD projection for the combined expressways and local streets in the core project area is 403.67 and 724.96 for the a.m. and p.m. peak periods, respectively. These values are expected to increase to 705.20 and 816.33 VHD by the year 2045. VHD for the entire network area will also experience a large increase with 3,475 and 2,048 VHD for the 2015 a.m. and p.m. peak periods and 6,232 and 3,771 VHD for the 2045 a.m. and p.m. peak periods, respectively.
C.1.h. Traffic Volumes
This section summarizes traffic volumes on the limited access highway system and at key study area intersections for existing conditions (2002) and for conditions under the No Build Alternative (2045). Vehicle classification, occupancy and pedestrian volumes at key locations and an origin-destination (O-D) study are also discussed. Appendix B includes additional detail on count locations and data obtained from these efforts. Traffic volume estimates for the Build Alternatives are presented in Section III.C.2.b.
METHODOLGY
Historical traffic data from recent studies performed for projects within the Kosciuszko Bridge Project study area were researched, collected and evaluated. The evaluation focused on the type of data that was available, the limits and time periods of coverage and how recently the data was collected. However, the evaluation revealed that the available studies contained limited information that could be used in this project. Instead, the data collection plan that was used in the development of the Kosciuszko Bridge Traffic Operations Study was followed and further expanded to develop the current data needs of the project.
As part of the project’s extensive data collection program performed during a two-week period from November 11 to November 24, 2002, traffic volume, vehicle classification, occupancy and pedestrian crosswalk counts were collected along the project expressways, ramp connections, and key roadways within the project’s Primary and Secondary Traffic Study Areas.

Draft Environmental Impact Statement Section II.C
Kosciuszko Bridge Project II-21 March 2007
Supplemental traffic data was collected in March 2005 for several locations near the Vandervoort Avenue/Meeker Avenue intersection including the ramps to and from the BQE. Refer to Appendix B for additional details on the data collected.
All traffic counts were performed in accordance with NYSDOT standards as outlined in Engineering Instruction (EI) 01-001 Traffic Monitoring Standards.
The data collection program included the following:
Automatic traffic recorders (ATRs), which use a rubber tube laid across the road to count the number of vehicles passing a specified location, were placed along key expressway and street segments throughout the traffic study area. ATRs record directional traffic volume data in 15-minute increments for a continuous time period. The count program was performed during the second and third weeks of November 2002 and included a total of 74 locations. Most locations were counted for a one-week period. However, to obtain additional data a two-week count was performed at several key locations. In all, the locations surveyed provide comprehensive coverage of the key expressway and roadways segments within the Primary and Secondary Traffic Study Areas. The ATR count locations are shown in Figure II-12, “Automatic Traffic Recorder (ATR) Count Locations.” Appendix B includes a summary table that describes each location.
Manual turning movement counts (TMCs), which record left, right, and through movements at intersection approaches, were performed at 57 locations located within the study area shown in Figure II-13, “Turning Movement Count (TMC) Locations.” For consistency of the data, the turning movement counts were performed during the same two-week period in November 2002 as the ATR counts. To incorporate the varying peaking characteristics of traffic, these counts were performed during the a.m., midday, and p.m. peak periods during one mid-weekday (Tuesday, Wednesday, or Thursday) and on a Saturday during the midday peak period. The data was collected in 15-minute intervals and categorized traffic volumes into three vehicle classes: cars, buses, and trucks. The locations surveyed provide comprehensive coverage of the major intersections within the Primary Traffic Study Area and general coverage of the key intersections within the Secondary Traffic Study Area. Appendix B describes in detail each TMC Location.
Vehicle classification counts were performed at nine key locations along expressway segments and ramp connections on and between the BQE and LIE (see Figure II-14, “Vehicle Classification Count Locations”). The data was collected during each of the project’s peak periods and categorized vehicles into five categories: autos, buses, light-duty gasoline trucks (2 axles), heavy-duty gasoline trucks (3 or more axles) and heavy-duty diesel trucks (3 or more axles).
Vehicle occupancy counts were performed concurrently with the vehicle classification counts at seven expressway segment and ramp locations along the BQE and LIE as shown in Figure II-15, “Vehicle Occupancy Count Locations.” These counts recorded the number of vehicles with occupancies of one, two, and three or more occupants during each of the project’s peak periods.
Pedestrian crosswalk counts were performed concurrently with the turning movement counts at 10 key intersections shown in Figure II-16, “Pedestrian Crosswalk Count

Draft Environmental Impact Statement Section II.C
Kosciuszko Bridge Project II-22 March 2007
Locations.” The counts were conducted using 15-minute intervals during the same weekday a.m. peak, midday, and p.m. peak and Saturday midday peak periods.
Other physical and operational characteristics such as parking maneuvers, bus stop and driveway locations, pedestrian-vehicle interactions, signal timing/phasing, lane striping and utilization, roadway geometrics, and traffic queuing were also measured and recorded.
To supplement the original 2002 data collection effort, additional ATR and TMC data was collected in March 2005. This effort, consisting of 19 ATR and eight TMC locations, provided additional information for the area near the northern section of Vandervoort Avenue and the eastern section of Meeker Avenue. Several of these locations were included in the November 2002 count program and were used to evaluate and compare data from both counts. ATR and TMC locations for the February 2005 count program are shown in Figure II-17, “Supplemental Turning Movement Count and Automatic Traffic Recorder Locations.” Appendix B describes in detail each additional ATR and TMC location.
An O-D survey was also performed as part of the March 2005 supplemental data collection effort. This survey was added to the project to determine travel patterns at the Meeker Avenue intersection with Vandervoort Avenue/Apollo Street and the adjacent BQE entrance and exit ramps.
EXISTING TRAFFIC VOLUMES
The ATR counts recorded 24-hour traffic volumes at each location for seven consecutive days. After applying an axle adjustment factor to adjust the raw traffic volume from the ATR to reflect the various vehicle types present at each count location, the data was then used in the development of peak flow conditions which included: morning, midday and afternoon peak one-hour periods for a typical weekday and a peak one-hour period for a representative weekend day. The Average Daily Traffic (ADT) volumes were also calculated from this ATR data. Applying NYSDOT seasonal traffic volume factors to the ATR count data, the Annual Average Daily Traffic (AADT) volumes for each expressway and roadway segment were estimated. Refer to Appendix B for NYSDOT seasonal adjustment factors.
Since it is not practical to design a roadway to accommodate traffic during the busiest hour of the year, the Design Hourly Volume (DHV) was used as the basis for design. The DHV represents the 30th highest hourly volume on a roadway in a year and was calculated by multiplying the AADT by a constant. Since the DHV is the combined two-way traffic volume, the Directional Design Hourly Volume (DDHV), which represents the peak directional volume of the DHV, also was calculated. Both the DHV and the DDHV were estimated based on actual peak hour and directional distribution percentages obtained from the ATR counts. Table II-11 presents the calculated AADT volumes and the corresponding DHV and DDHV estimates for segments along the BQE, LIE and three major roadways in the study area.

Draft Environmental Impact Statement Section II.C
Kosciuszko Bridge Project II-23 March 2007
TABLE II-11: 2002 EXISTING DESIGN VOLUME ESTIMATES
Location AADT DHV DDHV
BQE at Kosciuszko Bridge 161,880 9,880 5,020
LIE between 48th and 58th Streets 101,080 6,870 3,870
Meeker Avenue between Vandervoort and Morgan Avenues 24,810 1,760 1,010
McGuinness Boulevard between Norman and Nassau Avenues 31,230 2,310 1,380
Metropolitan Avenue between Bushwick Avenue and Olive Street 13,150 1,130 650
The BQE segment at the Kosciuszko Bridge, with a daily vehicle distribution of 79,930 vehicles in the eastbound direction and 81,950 vehicles in the westbound direction corresponding to an AADT volume of 161,880 vehicles, is not only the highest volume segment on the entire BQE but it is also one of the most traveled six-lane roadways in the entire New York City Metropolitan area.
Table II-12 and Figure II-18 show the a.m., midday, and p.m. weekday and Saturday midday peak hour traffic volumes for key segments on the BQE and LIE, major ramp connections and several local roadways in the study area.

Draft Environmental Impact Statement Section II.C
Kosciuszko Bridge Project II-24 March 2007
TABLE II-12: 2002 EXISTING PEAK HOUR VOLUMES AT KEY PROJECT LOCATIONS
Weekday Peak Hour ID
Location Direction A.M. Midday P.M. Saturday
EB 3,350 2,280 3,350 3,550 1 BQE between McGuinness Boulevard and
Vandervoort Avenue/ Apollo Street ramps WB 4,030 3,250 3,810 3,400
EB 4,600 3,450 4,830 4,700 2 BQE between Vandervoort Avenue/Apollo
Street ramp and LIE service road ramps WB 4,990 4,110 4,730 4,150
EB 2,210 2,330 2,990 2,550 3 LIE between 48th Street and 58th Street
WB 3,480 2,720 3,120 2,880
EB 5,030 4,410 6,270 4,950 4 LIE east of Maurice Avenue ramp
WB 6,390 5,500 5,670 5,660
5 BQE entrance ramp at Vandervoort Avenue EB 1,250 1,170 1,480 1,150
6 BQE exit ramp at Meeker Avenue/ Morgan Avenue WB 960 860 920 750
7 BQE exit ramp to LIE service road EB 2,860 1,860 2,540 2,720
8 BQE entrance ramp from LIE service road WB 2,480 2,430 2,650 2,580
EB 991 918 1,048 744 9 Meeker Avenue between McGuinness
Boulevard and Kingsland Avenue WB 700 700 800 575
NB 927 766 640 319 10 McGuinness Boulevard between Norman
Avenue and Nassau Avenue SB 1,024 1,010 1,449 799
EB 305 372 295 324 11 Metropolitan Avenue between Bushwick
Avenue and Olive Street WB 534 327 358 394
EB 525 310 458 390 12 Grand Street between Bushwick Avenue and
Olive Street WB 549 409 481 411
BROOKLYN-QUEENS EXPRESSWAY
The weekday morning peak period on the BQE generally extends from 6:00 to 10:00 a.m. with the predominant flow within the project limits in the westbound direction. The weekday afternoon peak period has a similar four-hour duration extending between 3:00 and 7:00 p.m. with the predominant flow in the eastbound direction. The weekday midday peak period extends from 10:00 a.m. to 3:00 p.m. with substantially lower traffic volumes than the weekday morning and afternoon peaks.
Based on the observed traffic volumes, the following peak hours were determined for the expressway and local street networks:
Expressway network
o Weekday a.m. peak hour 6:45 – 7:45 a.m. o Weekday midday peak hour 1:00 – 2:00 p.m.

Draft Environmental Impact Statement Section II.C
Kosciuszko Bridge Project II-25 March 2007
o Weekday p.m. peak hour 4:45 – 5:45 p.m. o Saturday peak hour 2:00 – 3:00 p.m.
Local street network
o Weekday a.m. peak hour 7:30 – 8:30 a.m. o Weekday midday peak hour 1:00 – 2:00 p.m. o Weekday p.m. peak hour 4:30 – 5:30 p.m. o Saturday peak hour 1:00 – 2:00 p.m.
In the westbound direction, the BQE accommodates its highest traffic volume at the Kosciuszko Bridge, downstream (or west) of the combined entrances from eastbound and westbound service road connections from the LIE and 43rd Street. This westbound BQE traffic reaches its weekday morning peak volume of 4,990 vehicles per hour (vph) between 6:45 and 7:45 a.m. The westbound afternoon peak volume of 4,730 vph occurs between 4:45 and 5:45 p.m. at the same location. Traffic volumes during the midday (10:00 a.m. to 3:00 p.m.) off-peak period in the same direction are relatively lower with peak volumes of 4,110 vph.
In the eastbound direction, the highest traffic volume on the BQE also occurs at the Kosciuszko Bridge downstream (or east) of the Vandervoort Avenue entrance ramp. This eastbound BQE traffic reaches its weekday morning peak volume of 4,600 vph between 6:45 and 7:45 a.m. The eastbound afternoon peak traffic volume of 4,830 vph occurs between 4:45 and 5:45 p.m. at the same location. Traffic volumes during the midday off-peak period are also relatively lower with peak volumes of 3,450 vph.
Peak period traffic volumes on weekends on both the BQE are generally lower than the weekday morning and afternoon peak period volumes but higher than the midday off-peak periods. On the BQE, traffic volumes in the westbound direction reach a high of 4,150 vph and 4,700 vph in the eastbound direction during the Saturday midday peak hour.
LONG ISLAND EXPRESSWAY
The LIE exhibits the same peaking characteristics as BQE traffic with identical peak hours and a predominant flow direction during peak hours. However, due to the extremely high traffic volumes at connections to and from the BQE, traffic volumes on the LIE within the project limits are highest at the eastern end of the study area.
The westbound LIE at 69th Street has a traffic volume of 6,390 vph and 5,670 vph during the morning and afternoon peak hours, respectively. In the eastbound direction, the LIE reaches a weekday morning peak volume of 5,030 vph and an afternoon peak volume of 6,270 vph at the same location. Traffic volumes during the midday off-peak period are relatively lower in both directions with the highest volumes reaching 5,500 vph in the westbound direction and 4,110 vph in the eastbound direction.
Peak period traffic volumes on weekends on the LIE are also generally lower than the weekday morning and afternoon peak period volumes but higher than the midday off-peak periods. The LIE westbound and eastbound volumes during Saturday midday peak hour are 5,660 vph and 4,950 vph, respectively.
LOCAL STREET TRAFFIC
Meeker Avenue is aligned parallel to the BQE within the study area. During normal conditions, Meeker Avenue functions as a major arterial accommodating local eastbound and westbound

Draft Environmental Impact Statement Section II.C
Kosciuszko Bridge Project II-26 March 2007
traffic. At times when the BQE is at capacity or during incidents, Meeker Avenue becomes a BQE bypass for drivers familiar with connections between the BQE and Meeker Avenue. The 2002 two-way AADT for Meeker Avenue between Vandervoort Avenue and Morgan Avenue is 24,810 vehicles (13,910 eastbound and 10,900 westbound). Morning and afternoon peak hour volumes occur between 7:30 and 8:30 a.m. and 4:30 and 5:30 p.m. The morning and afternoon peak hour traffic volumes are 830 and 1,000 vph, respectively, for the eastbound direction and 650 and 760 vph, respectively, for the westbound direction. The Saturday peak hour occurs between 1:00 and 2:00 p.m. with substantially lower peak volumes. Traffic volumes on McGuinness Boulevard were found to be heavy during peak periods since McGuinness Boulevard serves as one of the major connectors between locations in Queens and Brooklyn. Traffic volumes on other arterials in the project such as Metropolitan Avenue and Grand Street/Grand Avenue were found to be moderate to high during peak periods and low during off-peak periods.
VEHICLE CLASSIFICATION
Vehicle classification data for the project was collected at nine locations along the BQE and at each of the 57 TMC locations. BQE data was collected at ramp connections to the LIE and local streets and at segments along the expressway during each of the project’s peak periods. The data was categorized into five vehicle categories: autos, buses, and light-duty, medium-duty, and heavy-duty trucks. Intersection classification data was also collected during each of the project’s peak periods and was categorized into three vehicle categories; autos, trucks and buses.
Table II-13 shows the a.m. and p.m. peak hour vehicle classifications on the BQE and ramp connections.

Draft Environmental Impact Statement Section II.C
Kosciuszko Bridge Project II-27 March 2007
TABLE II-13: 2002 EXISTING VEHICLE CLASSIFICATION ON BQE AND RAMP CONNECTIONS
Vehicle Type (Percent)
A.M. Peak Hour P.M. Peak Hour
ID Location Auto Bus LT MT HT Auto Bus LT MT HT
C1 BQE Eastbound Entrance Ramp at Vandervoort Avenue
80 1 1 10 8 95 0 1 2 2
C2 BQE Eastbound after Entrance Ramp from Vandervoort Avenue
86 0 7 2 5 94 0 4 0 2
C3 BQE Eastbound Exit Ramp to Westbound LIE Service Road
70 2 10 10 8 84 1 10 4 1
C4 BQE Eastbound Exit Ramp to Eastbound LIE Service Road
68 2 13 9 8 76 1 14 6 3
C5 BQE Westbound Entrance Ramp from Westbound LIE Service Road
78 0 10 5 7 83 1 7 5 4
C6 BQE Westbound Entrance Ramp from Eastbound LIE Service Road
62 2 18 8 10 88 2 4 2 4
C7 BQE Westbound Entrance Ramp from 43rd Street/Borden Avenue
89 3 7 0 1 90 1 6 2 1
C8 BQE Westbound before Exit Ramp to Meeker Avenue/ Morgan Avenue
89 0 6 2 3 93 0 5 1 1
C9 BQE Westbound Exit Ramp to Meeker Avenue/Morgan Avenue
81 2 1 9 7 85 0 0 10 5
Note: LT, MT, and HT are light-, medium-, and heavy-duty trucks, respectively.
The data indicate that a larger percentage of trucks use the BQE in the eastbound direction compared to the westbound direction during peak hours. There is also higher truck traffic during the a.m. peak hour compared to the p.m. peak hour. In the eastbound direction during the a.m. peak hour there are approximately 14 percent trucks on the BQE of which seven percent are medium and heavy trucks, but in the p.m. peak hour truck traffic decreases to six percent with only two percent medium and heavy trucks. In the westbound direction, during the a.m. peak hour eleven percent of all vehicles are trucks of which five percent are medium and heavy trucks but again in the p.m. peak hour truck traffic decreases to only seven percent with only two percent medium and heavy trucks.
On the Vandervoort Avenue entrance ramp, there are 19 and 5 percent of trucks in the a.m. and p.m. peak hours, respectively. This truck percentage contributes slightly to the percentage of trucks on the eastbound BQE between Vandervoort Avenue and the LIE interchange, as traffic composition before Vandervoort Avenue has a high percentage of autos. A substantial number of trucks exit the BQE to connect to the LIE, reducing the truck percentage north of the BQE/LIE

Draft Environmental Impact Statement Section II.C
Kosciuszko Bridge Project II-28 March 2007
interchange. As a consequence, ramps connecting the eastbound BQE to the LIE carry a high percentage of trucks, ranging from 28 to 30 percent in the a.m. peak hour and from 15 to 23 percent in the p.m. peak hour. Similarly, in the westbound direction, a high number of trucks enter the BQE via the LIE ramps with percentages that range from 22 to 36 percent in the a.m. peak hour and from 10 to 16 percent in the p.m. peak hour. On the Meeker Avenue/Morgan Avenue exit ramp, there are 17 and 15 percent of trucks in the a.m. and p.m. peak hours, respectively. These relatively high truck percentages on ramps and highway segments, especially medium and heavy trucks, affect traffic conditions and have a significant impact on the highway network, contributing to low travel speeds and congestion.
Additional information on the vehicle classification counts are presented in Appendix B.
Metropolitan Transportation Authority’s New York City Transit (NYCT) and private buses, school buses, and emergency vehicles also operate on the BQE, LIE and local streets within the study area. The NYCT B24 bus route operates on the BQE and Meeker Avenue with 16 to 20 minute headways during the a.m. peak periods, 25-minute headways during the weekday p.m. peak periods, and 30-minute headways during the weekday off-peak periods and the weekend.
VEHICLE OCCUPANCY
Due to the difficulty in obtaining vehicle occupancy data for vehicles on the BQE mainline, data was collected only at each BQE entrance and exit ramp. The data indicates that vehicles entering and exiting the BQE are predominantly occupied by two or less occupants during both the a.m. and p.m. peak hours. Vehicles with three or more occupants account for less than ten percent of peak hour traffic at each of the count locations. Table II-14 shows occupancy data for vehicles entering and exiting the BQE in the project study area. Additional details on vehicle occupancy are presented in Appendix B.
TABLE II-14: VEHICLE OCCUPANCY BY PERCENTAGE – 2002 EXISTING CONDITIONS
Percent occupants per vehicle
A.M. Peak Hour P.M. Peak Hour
ID Location 1 2 3+ 1 2 3+
O1 Eastbound BQE Entrance Ramp from Vandervoort Avenue 69 24 7 80 19 1
O2 Eastbound BQE Exit Ramp to Westbound LIE Service Road 84 14 2 77 21 2
O3 Eastbound BQE Exit Ramp to Eastbound LIE Service Road 85 13 2 77 21 2
O4 Westbound LIE Service Road Exit Ramp to Westbound BQE 68 25 7 74 21 5
O5 Eastbound LIE Service Road Exit Ramp to Westbound BQE 71 20 9 78 20 2
O6 Westbound 43rd St/Borden Ave Entrance Ramp to Westbound BQE 79 17 4 75 18 7
O7 Westbound BQE Exit Ramp to Westbound Meeker Ave/Morgan Ave 84 13 3 89 9 2
PEDESTRIAN AND BICYCLE ACTIVITY
Pedestrians and bicycles are not permitted on the BQE and there are no sidewalks or bicycle lanes within its right-of-way. Concrete sidewalks are provided on both sides of Meeker Avenue for pedestrian use. Pedestrian crosswalks are provided at all major crossings but pedestrian ramps are not provided at all crossings.

Draft Environmental Impact Statement Section II.C
Kosciuszko Bridge Project II-29 March 2007
The pedestrian counts indicate that most of the intersections studied accommodate light pedestrian traffic. Field observations further indicate that most of the pedestrian activity at the busiest intersections is generated by nearby schools. Pedestrian traffic at these locations peaked close to the beginning and ending of school hours. Most pedestrians used designated crosswalks, but many made unsafe mid-block crossings. Table II-15 shows the pedestrian volumes at key intersections in the study. Additional details on the pedestrian counts are presented in Appendix B.
TABLE II-15: 2002 EXISTING PEDESTRIAN VOLUMES AT LOCAL INTERSECTIONS
Approach/Direction
Eastbound Westbound Northbound Southbound
ID Location Peak Hour
South to
North
North to
South
North to
South
South to
North
East to
West
West to
East
West to
East
East to
West
A.M. 8 5 1 23 81 82 33 169 P1 Westbound Meeker Avenue
at Metropolitan Avenue P.M. 6 0 6 4 84 79 31 18
A.M. 3 2 0 3 75 112 36 169 P2 Eastbound Meeker Avenue
at Metropolitan Avenue P.M. 0 2 2 3 81 79 31 18
A.M. 9 11 8 8 3 3 37 14 P3 Eastbound Meeker Avenue
at Humboldt Street P.M. 8 7 5 0 3 4 21 15
A.M. 5 10 1 2 31 13 2 3 P4 Westbound Meeker Avenue
at McGuinness Boulevard P.M. 9 5 5 5 17 17 2 4
A.M. 7 8 15 10 10 84 16 5 P5 Greenpoint Avenue at
McGuinness Boulevard P.M. 11 15 11 25 66 19 8 20
A.M. 7 4 102 63 170 28 45 34 P6a Greenpoint Avenue at
Queens Boulevard P.M. 2 27 23 10 109 84 30 21
A.M. 14 41 51 54 205 34 33 177 P6b Roosevelt Avenue at
Queens Boulevard P.M. 49 10 38 55 122 92 159 149
A.M. 17 25 16 20 3 23 0 1 P7 Grand Avenue and LIE
Westbound Service Road P.M. 8 16 27 19 20 17 0 0
A.M. 19 67 36 22 3 1 16 5 P8 Grand Avenue at LIE
Eastbound Service Road P.M. 36 39 37 44 0 0 8 11
A.M. 12 7 4 12 0 0 2 12 P9 Maurice Avenue at LIE
Westbound Service Road P.M. 3 1 5 10 1 0 7 0
A.M. 10 7 8 13 11 9 0 0 P10 Maurice Avenue at LIE
Eastbound Service Road P.M. 2 1 11 9 2 7 0 0

Draft Environmental Impact Statement Section II.C
Kosciuszko Bridge Project II-30 March 2007
ORIGIN - DESTINATION STUDY
An origin-destination study was performed at the intersection of Meeker Avenue with Vandervoort Avenue/Apollo Street to identify the destinations of vehicles with westbound BQE and westbound Meeker Avenue origins. This intersection has been observed to be highly congested with most vehicle movements within the intersection requiring lane changing maneuvers in very confined areas. Conditions at this location deteriorate further when the vehicle movements include one or more tractor trailers in addition to numerous medium trucks and autos. The study found that a high percentage of vehicles exiting the BQE, and therefore approaching the Vandervoort Avenue/Apollo Street intersection in the left-most lane, travel southbound along Vandervoort Avenue requiring a left turn at the intersection and immediate access to the right lane under the BQE overpass. The study also revealed that during certain periods during the a.m. peak hour there was an influx of medium trucks from westbound Meeker Avenue with eastbound BQE destinations. For these vehicles to access the BQE, they must find immediate access to the left-most lane at the westbound Meeker Avenue approach to Apollo Street or find a way to cut into the left turning lane under the BQE overpass. Typically these movements are congested and are one of the causes for the current intersection failures.
FUTURE NO BUILD DESIGN YEAR TRAFFIC VOLUME FORECASTS
Future No Build traffic volumes on the BQE, LIE and local streets were projected for the 2015 ETC and for the 2045 design year (ETC+30) as directed by Appendix 5 of NYSDOT’s Project Development Manual. Since the Kosciuszko Bridge project is a full reconstruction project, a design year of 30 years after the estimated date of project completion was used for traffic forecasts.
The No Build traffic volume projections were developed based on the BPM. The BPM is a regional travel demand model that is used to predict region-wide transportation system changes which affect individuals’ travel patterns including when and where to travel, which mode to use, and which roadways or transit lines to use. A BPM sub-area model was developed to provide additional accuracy in traffic forecasts for the Kosciuszko Bridge corridor and the roadways within the Secondary Traffic Study Area, by extracting sub-area networks and trip data from the BPM regional model. A discussion of the sub-area network, sub-area trip tables, and sub-area analysis is provided in Appendix B.
Traffic demand for the a.m. and p.m. peak periods was forecasted separately for each of the 2015 and 2045 future No Build year scenarios. The future No Build scenario conditions represent the future-year growth including all committed/programmed highway and transit improvements within the project limits. For future demand forecasting, data that pertains to future land use development, including projects described in Section II.C.1.w, was compiled to validate the forecasts of socio-economic data in the BPM. The transportation networks were also modified to reflect future changes in accessibility. A sequential modeling process was used where the BPM regional model was applied first and then followed by the BPM sub-area model. This sequential process makes it possible to analyze the sub-area traffic patterns in greater detail while capturing the overall effects of improvement alternatives on the regional transportation system. A more detailed description of the traffic forecasting methods is provided in Appendix B.

Draft Environmental Impact Statement Section II.C
Kosciuszko Bridge Project II-31 March 2007
2015 NO BUILD TRAFFIC VOLUME ESTIMATES
Table II-16 and Figures II-19 and II-20 summarize the increase in traffic volumes between the 2002 existing and the 2015 No Build conditions for the a.m. and p.m. peak hours. In 2002 due to capacity constraints and excessive vehicular congestion in the peak directions during peak periods, several of the BQE and some of the LIE segments in the study area are showing signs of approaching capacity limits. A comparison between the existing peak hour volumes and the corresponding forecasted volumes for the 2015 No Build condition, a thirteen year period, indicates that the volume changes on the BQE and LIE segments will range between a three percent decrease and a nine percent increase. The three percent decrease was projected for the eastbound LIE segment between 48th and 58th Streets during the p.m. peak hour and is the result of the merge between the LIE mainline and service road west of Maurice Avenue, a highly congested area during the p.m. peak period. The nine percent increase was projected for the eastbound BQE segment between the McGuinness Boulevard/Humboldt Avenue exit ramp and the Vandervoort Avenue/Apollo Street entrance ramp and is a result of traffic growth and the available capacity on this segment. In the westbound direction, traffic volumes on the BQE at the Kosciuszko Bridge are projected to reach 5,110 vph and 5,020 vph during the a.m. and p.m. peak hours, respectively. In the eastbound direction, the BQE peak hour volumes would also increase reaching 4,820 vph and 5,120 vph in the a.m. and p.m. peak hours, respectively. 2015 traffic volumes on the LIE are also projected to be substantially higher than existing volumes. The westbound LIE before the BQE is projected to reach volumes of 6,500 vph and 5,920 vph during the a.m. and p.m. peak hours, respectively. In the eastbound direction, the LIE would reach a maximum of 5,420 vph in the a.m. peak hour and 6,270 vph in the p.m. peak hour.

Draft Environmental Impact Statement Section II.C
Kosciuszko Bridge Project II-32 March 2007
TABLE II-16: CHANGE IN TRAFFIC VOLUMES AT KEY PROJECT LOCATIONS – 2002 TO 2015
A.M. Peak Hour Volumes P.M. Peak Hour Volumes
ID Location Direction 2002
Existing
2015 No
Build %
Change 2002
Existing
2015 No
Build %
Change
EB 3,350 3,530 5.4 3,350 3,650 9.0 1
BQE between McGuinness Boulevard and Vandervoort Avenue/ Apollo Street ramps WB 4,030 4,120 2.2 3,810 3,940 3.4
EB 4,600 4,820 4.8 4,830 5,120 6.0 2
BQE between Vandervoort Avenue/ Apollo Street ramps and LIE service road ramps WB 4,990 5,110 2.4 4,730 5,020 6.1
EB 2,210 2,380 7.7 2,990 2,900 -3.0 3 LIE between 48th Street and 58th
Street WB 3,480 3,670 5.5 3,120 3,340 7.1
EB 5,030 5,420 7.8 6,270 6,270 0.0 4 LIE east of Maurice Avenue ramp
WB 6,390 6,500 1.7 5,670 5,920 4.4
5 BQE entrance ramp at Vandervoort Avenue EB 1,250 1,290 3.2 1,480 1,470 -0.7
6 BQE exit ramp at Meeker Avenue/ Morgan Avenue WB 960 990 3.1 920 1,080 17.4
7 BQE exit ramp to LIE service road EB 2,860 3,000 4.9 2,540 2,610 2.8
8 BQE entrance ramp from LIE service road WB 2,480 2,570 3.6 2,650 2,750 3.8
EB 991 1,019 2.8 1,048 1,057 0.9 9
Meeker Avenue between McGuinness Boulevard and Kingsland Avenue WB 700 822 17.4 800 1,033 29.1
NB 927 868 -6.4 640 756 18.1 10
McGuinness Boulevard between Norman Avenue and Nassau Avenue SB 1,027 1,124 9.8 1,449 1,527 5.4
EB 305 365 19.7 295 316 7.1 11
Metropolitan Avenue between Bushwick Avenue and Olive Street WB 534 585 9.6 358 470 31.3
EB 525 647 23.2 458 474 3.5 12 Grand Street between Bushwick
Avenue and Olive Street WB 549 636 15.8 481 586 21.8
Most ramps are expected to experience small increases in traffic volume during the a.m. and p.m. peak hours. This is due to the vehicular congestion on the expressways where entering ramp traffic must negotiate highly congested merge areas and exiting traffic must wait to access the exit ramps. A substantial increase in traffic volume would occur at the westbound BQE Meeker Avenue/Morgan Avenue exit ramp during the p.m. peak hour as a result of the congested expressway conditions downstream of the ramp, with motorists choosing to use local streets for travel.
Local streets show small to moderate increases in traffic volumes during both peak hours. These conditions are typical of roadways bordering expressways where the capacity and peak period demand of the expressways and the local streets dictate the growth of traffic on the local

Draft Environmental Impact Statement Section II.C
Kosciuszko Bridge Project II-33 March 2007
streets. This is evident on Meeker Avenue where traffic during the morning peak period is expected to increase significantly in the westbound direction, but only moderately in the eastbound direction. In the westbound direction, Meeker Avenue is expected to be used by motorists bypassing the congestion on the BQE west of the Meeker Avenue/Morgan Avenue exit ramp. In the eastbound direction, traffic is expected to remain on the BQE since travel on Meeker Avenue will be slower due to the extremely congested Vandervoort Avenue entrance ramp to the BQE. The morning and afternoon traffic volumes on Meeker Avenue between Vandervoort Avenue and Morgan Avenue are projected to be 826 and 998 vph for the eastbound direction and 720 and 934 vph for the westbound direction.
2045 NO BUILD TRAFFIC VOLUME ESTIMATES
Table II-17 and Figures II-21 and II-22 summarize the increase in traffic volumes between the 2002 existing and the 2045 No Build conditions for the a.m. and p.m. peak hours.

Draft Environmental Impact Statement Section II.C
Kosciuszko Bridge Project II-34 March 2007
TABLE II-17: CHANGE IN TRAFFIC VOLUMES AT KEY PROJECT LOCATIONS – 2002 TO 2045
A.M. Peak Hour Volumes P.M. Peak Hour Volumes ID
Location Direction 2002
Existing
2045 No
Build %
Change 2002
Existing
2045 No
Build %
Change
EB 3,350 3,800 13.4 3,350 4,070 21.5 1
BQE between McGuinness Boulevard and Vandervoort Avenue/ Apollo Street ramps WB 4,030 4,340 7.7 3,810 4,570 19.9
EB 4,600 5,100 10.9 4,830 5,520 14.3 2
BQE between Vandervoort Avenue/ Apollo Street ramps and LIE service road ramps WB 4,990 5,380 7.8 4,730 5,620 18.8
EB 2,210 2,630 19.0 2,990 3,430 14.7 3 LIE between 48th Street and 58th
Street WB 3,480 4,080 17.2 3,120 3,930 26.0
EB 5,030 6,150 22.3 6,270 6,980 11.3 4 LIE east of Maurice Avenue ramp
WB 6,390 7,070 10.6 5,670 6,610 16.6
5 BQE entrance ramp at Vandervoort Avenue EB 1,250 1,300 4.0 1,480 1,450 -2.0
6 BQE exit ramp at Meeker Avenue/ Morgan Avenue WB 960 1,040 8.3 920 1,050 14.1
7 BQE exit ramp to LIE service road EB 2,860 3,120 9.1 2,540 2,820 11.0
8 BQE entrance ramp from LIE service road WB 2,480 2,730 10.1 2,650 2,930 10.6
EB 991 1,355 36.7 1,048 1,222 16.6 9
Meeker Avenue between McGuinness Boulevard and Kingsland Avenue WB 700 991 41.6 800 1,213 51.6
NB 927 901 -2.8 640 1,110 73.4 10
McGuinness Boulevard between Norman Avenue and Nassau Avenue SB 1,024 1,336 30.5 1,449 1,320 -8.9
EB 305 486 59.3 295 359 21.7 11
Metropolitan Avenue between Bushwick Avenue and Olive Street WB 534 704 31.8 358 699 95.3
EB 525 894 70.3 458 606 32.3 12
Grand Street/Grand Avenue between Bushwick Avenue and Olive Street WB 549 806 46.8 481 746 55.1
Traffic volumes on both expressways and local streets are projected to further increase by the 2045 No Build design year. However, traffic volumes are projected to increase on the expressways at a lower rate than the 2002 to 2015 period and the most significant volume increases are projected for the local streets.
The volume increase on the local streets would occur due to capacity limitations on the expressways where the projected traffic demand cannot be accommodated on the expressways and will remain on the local streets. The projected 2045 No Build westbound and eastbound BQE traffic volumes at the Kosciuszko Bridge will be 5,380 and 5,100 vph during the a.m. peak hour and 5,620 and 5,520 vph in the p.m. peak hour. Similarly, the projected westbound and

Draft Environmental Impact Statement Section II.C
Kosciuszko Bridge Project II-35 March 2007
eastbound LIE traffic volumes east of Maurice Avenue will be 7,070 and 6,150 vph during the a.m. peak hour and 6,610 and 6,980 vph during the p.m. peak hour.
2045 No Build traffic volumes along Meeker Avenue between Vandervoort Avenue and Morgan Avenue in the eastbound and westbound directions are projected to be 980 and 760 vph during the a.m. peak hour and 920 and 920 vph during the p.m. peak hour.
Vehicle composition of traffic on the BQE, LIE and on local streets for both 2015 and 2045 No Build years is projected to remain unchanged from present conditions. Similarly, since the BQE will continue to operate without a High Occupancy Vehicle (HOV) lane, vehicle occupancies are also not projected to change significantly from present conditions.
C.1.i. Level of Service
This section summarizes travel conditions on the expressway, ramps, and key local streets in the traffic study area. LOS is a qualitative measure of operational conditions of a roadway, based on service measures such as speed and travel time, freedom to maneuver, traffic interruptions, comfort, and convenience. Six LOS are defined for each type of facility. Letters designate each level, from A to F, with LOS A representing the best operating conditions and LOS F the worst. Each level of service represents a range of operating conditions and the driver’s perception of those conditions. Additional detail on all Level of Service analyses is included in Appendix B.
METHODOLOGY
Highway Capacity Software (HCS) 2000 version 4.1d and VISSIM Release 4.10 were used to estimate quality of flow in terms of LOS, density, and volume-to-capacity (v/c) ratios for expressway elements including basic freeway segments, weaving segments, ramp roadways, and ramp junctions along the BQE and LIE.
The HCS is based on methodology presented in the Highway Capacity Manual (HCM), Special Report 209, published by the Transportation Research Board and is a widely used traffic/transportation tool that is well adapted for the evaluation of individual segments, ramps and intersections. However, HCS is better suited for traffic conditions that have not fully reached congested conditions. VISSIM is a microscopic model that uses a system approach and analyzes an entire transportation network, as well as individual network links including freeway segments, ramps connections, and local streets. VISSIM also has the ability to analyze traffic conditions that are affected by periods of traffic congestion. Since traffic conditions on the project highways and local streets tend to operate at a high level of congestion during peak periods, the analysis was performed using both HCS and VISSIM.
FREEWAY SEGMENTS
The LOS of a freeway segment is primarily evaluated in terms of density (in passenger cars per kilometer [mile] per lane, pc/km/ln and pc/mi/ln) since the freedom to maneuver within the traffic stream and the proximity to other vehicles are of concern to drivers. Unlike speed, density increases as flow increases up to capacity. Speed and service flow rate (passenger cars per hour per lane, pc/hr/ln) are secondary measures of LOS. The following are the operating characteristics for the six LOS for freeway segments:

Draft Environmental Impact Statement Section II.C
Kosciuszko Bridge Project II-36 March 2007
LOS A – Describes free-flow conditions. Vehicles are almost completely unimpeded in their ability to maneuver within the traffic stream. The effects of incidents are easily absorbed at this level.
LOS B – Represents reasonably free-flow conditions. Free-flow speeds are maintained and the ability to maneuver is only slightly restricted. The general level of physical and psychological comfort provided to drivers is still high and the effects of minor incidents are still easily absorbed.
LOS C – Provides for flow with speeds at or near the free-flow speed of the freeway. Freedom to maneuver is noticeably restricted with the need for more care to make lane changes. Minor incidents may still be absorbed, but the local deterioration in service will be substantial. Queues may start upon any significant blockage.
LOS D – Level at which speeds begin to decline slightly while increasing flows and densities begin to increase more quickly. Freedom to maneuver is more noticeably limited and the driver experiences reduced comfort levels. Even minor incidents can be expected to create queuing.
LOS E – The highest level of density with freeway operating at capacity. Operation is volatile, with no usable gaps and very little room to maneuver. Any disruption or incident can be expected to create a breakdown with extensive queuing. Maneuvering is extremely limited and level of comfort is poor.
LOS F – Describes breakdowns in vehicular flow. Forced flow where volume is less than capacity and stoppages may be short or long in duration with the potential for great delays and long queues.
Detailed basic freeway capacity analyses were performed for ten eastbound and eleven westbound segments along the BQE project limits.
RAMP ROADWAYS AND RAMP JUNCTIONS
The primary measurement of LOS for ramps, either entering or exiting a freeway, is density (in pc/km/ln and pc/mi/ln). Speed (in km/h and mph) in the influence area of the ramp is also used, but only as a secondary measurement. LOS A through E indicates that no breakdowns in traffic flow are apparent.
SIGNALIZED INTERSECTIONS
The quality of flow for a signalized intersection can also be expressed in terms of LOS, which is a function of the amount of delay a driver typically experiences at an intersection, or in terms of v/c ratio, which is often interpreted as a measure of congestion. While both of these measures are necessary to appropriately assess the operating conditions of a signalized intersection, LOS is a better indicator of what drivers perceive as favorable or unfavorable driving conditions. Factors such as long cycle lengths and poor signal progression can contribute to poor LOS values but favorable v/c ratios, while short delays and optimized signal progression can result in the opposite. The HCM defines LOS for signalized intersections as follows:
LOS A – Delays of 0 to 10 seconds; very favorable operating conditions with minimal control delay.

Draft Environmental Impact Statement Section II.C
Kosciuszko Bridge Project II-37 March 2007
LOS B – Delays of 10 to 20 seconds; very favorable operating conditions with minimal control delay.
LOS C – Delays of 20 to 35 seconds; possible longer cycle lengths and occasional cycle failures.
LOS D – Delays of 35 to 55 seconds; perceived as the early stage of congestion at a signalized intersection; upper limit of “acceptable” delay.
LOS E – Delays of 55 to 80 seconds; traffic flow remains predictable but is frequently subjected to cycle failures.
LOS F – Delays longer than 80 seconds; unstable flow may result, possibly leading to stop-and-go conditions.
UNSIGNALIZED INTERSECTIONS
The quality of flow for an unsignalized intersection is dependent on the available gaps in the major street flow through which minor (stop-controlled) street traffic can execute crossing or turning maneuvers. The vehicular conflicts resulting from these maneuvers determine the individual processing capacities for the critical movements through the intersection, which include the left-turn movements from the major streets and all movements from the minor streets. The operational descriptors for unsignalized intersections are similar to those for signalized intersections, but with slightly different delay thresholds. The HCM defines LOS for unsignalized intersections as follows:
LOS A – Delays of 0 to 10 seconds.
LOS B – Delays of 10 to 15 seconds.
LOS C – Delays of 15 to 25 seconds.
LOS D – Delays of 25 to 35 seconds; upper limit of “acceptable” delay.
LOS E – Delays of 35 to 50 seconds.
LOS F – Delays longer than 50 seconds.
EXISTING CONDITIONS
FREEWAY SEGMENTS
Detailed analysis was conducted for both directions of the BQE from Tillary Street to the LIE Interchange and eight eastbound and ten westbound ramps within this section of the BQE. (See Figure II-10, “Kosciuszko Bridge Project Traffic Study Areas,” for the location of noted streets.)
Freeway volume, ramp volume, length of acceleration lane and the free flow speed of ramps at the merge point are the critical variables affecting flow on the expressway, ramps, and the local street system. Since the BQE in the project area is an elevated structure in a highly developed urban area, most of the ramps in the project have steep grades and relatively short

Draft Environmental Impact Statement Section II.C
Kosciuszko Bridge Project II-38 March 2007
acceleration/deceleration areas. The high truck volumes on these ramps further increase the impact of vehicles traveling up the ramps and merging into the expressway.
Eastbound BQE
Table II-18 and Figure II-23, “Existing AM and PM Peak Hour Level of Service – BQE,” show that, in the eastbound direction, the Kosciuszko Bridge, starting from the Vandervoort Avenue entrance ramp, is a bottleneck to otherwise generally acceptable traffic conditions. In the a.m. peak hour, the eastbound BQE operates at LOS D or better in segments from Tillary Street to the Vandervoort Avenue entrance ramp, except for the Metropolitan Avenue exit which operates at LOS E. Segments from the Vandervoort Avenue entrance ramp to the LIE eastbound/westbound service road exit operate at LOS E and F in the a.m. peak hour with densities that range from 26 to 41 pc/km/ln, (41 to 66 pc/mi/ln). Segments between the LIE exit and the Queens Boulevard exit operate at LOS C or better in the a.m. peak hour. In the p.m. peak hour, segments from Tillary Street to the Vandervoort Avenue entrance operate at LOS D or better except for the Williamsburg Bridge exit which operates at LOS E. During the p.m. peak hour, the BQE accommodates extremely high traffic volumes in the eastbound direction causing congestion to occur in most segments between the Vandervoort Avenue entrance and the LIE eastbound/westbound service road exit with LOS F and densities ranging from 49 to 73 pc/km/ln, (80 to 118 pc/mi/ln). Segments from the LIE EB/WB service road exit to the Queens Boulevard exit operate at LOS C or better in the p.m. peak hour.

Draft Environmental Impact Statement Section II.C
Kosciuszko Bridge Project II-39 March 2007
TABLE II-18: EXISTING (2002) EASTBOUND BQE LEVEL OF SERVICE
Segment/ Ramp Number Segment A.M. P.M.
1 From Tillary Street Entrance to Flushing Avenue Exit D D
R1 Flushing Avenue Exit D D
2 From Flushing Avenue Exit to Williamsburg Street Entrance C C
R2 Williamsburg Street Entrance D C
3 From Williamsburg Street Entrance to Metropolitan Avenue Exit D D
R3 Metropolitan Avenue Exit E D
4 From Metropolitan Avenue Exit to Williamsburg Bridge Entrance D C
R4 Williamsburg Bridge Entrance D E
5 From Williamsburg Bridge Entrance to McGuinness Boulevard Exit D D
R5 McGuinness Boulevard Exit D D
6 From McGuinness Boulevard Exit to Vandervoort Avenue Entrance D D
R6 Vandervoort Avenue Entrance E F
7 From Vandervoort Avenue Entrance to top of Kosciuszko Bridge F F
8 Top of Kosciuszko Bridge to LIE EB/WB Service Road (SR) Exit F F
R7 LIE EB/WB SR Exit E F
9 From LIE EB/WB SR Exit to LIE EB SR Entrance C C
R8 LIE EB SR Entrance B A
10 From LIE EB SR Entrance to Queens Boulevard Exit B C
Westbound BQE
Table II-19 and Figure II-23, “Existing AM and PM Peak Hour Level of Service – BQE,” show, that in the westbound direction, conditions on the Kosciuszko Bridge are similarly unacceptable, but areas of poor operation extend beyond the project limits to the exit to the Williamsburg Bridge. During the a.m. peak hour, segments of the BQE from the Queens Boulevard entrance to the LIE eastbound/westbound/43rd Street entrance operate at LOS D or better. Segments from the LIE eastbound/westbound service road/43rd Street entrance to the Williamsburg Bridge exit operate at LOS E or F, except for the Metropolitan Avenue exit which operates at LOS B, with high densities that range from 23 to 46 pc/km/ln, (37 to 74 pc/mi/ln) in the a.m. peak hour. The congestion on these segments is caused by the high traffic volumes from eastbound and westbound LIE service roads merging into the BQE and the limited capacity of the three westbound lanes. From the Williamsburg Bridge exit to the Tillary Street exit, the BQE operates at LOS D or better during the a.m. peak hour. In the p.m. peak hour, segments from the Queens Boulevard entrance to the LIE eastbound/westbound/43rd Street entrance operate at LOS C or better. Similar to the a.m. peak hour, high traffic volumes entering the BQE from the LIE cause segments between the LIE eastbound/westbound/43rd Street entrance and the Metropolitan Avenue exit to also experience traffic congestion during the p.m. peak hour and
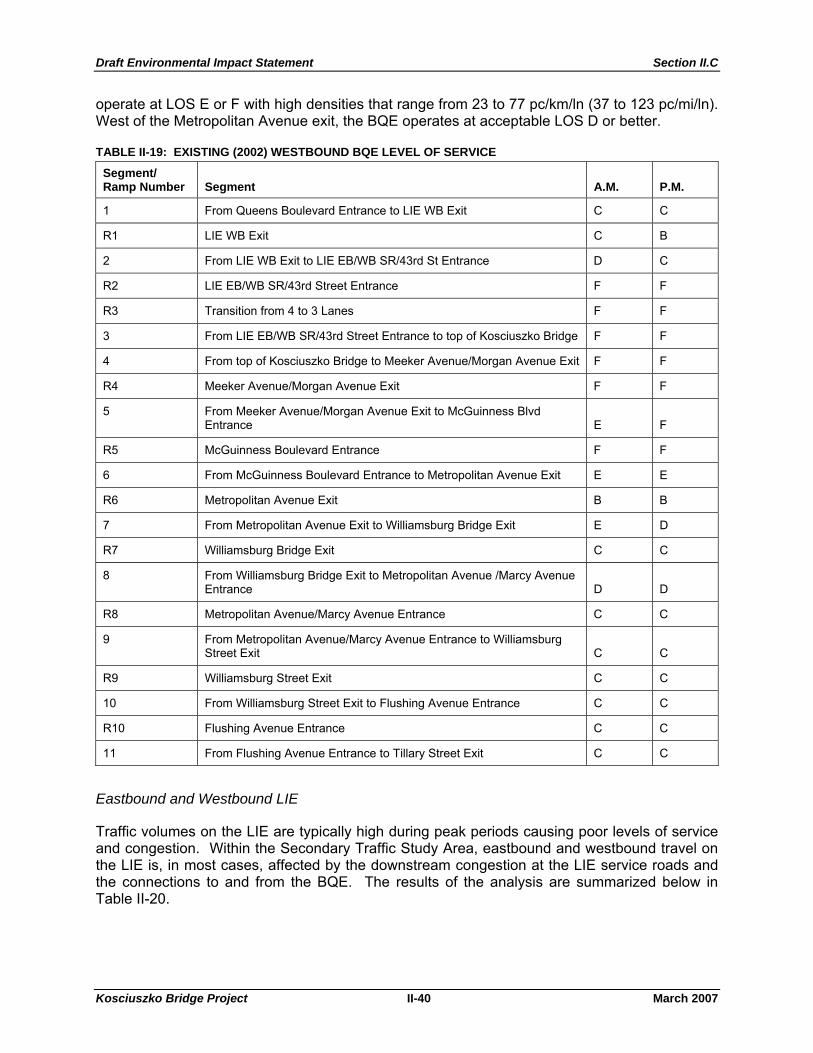
Draft Environmental Impact Statement Section II.C
Kosciuszko Bridge Project II-40 March 2007
operate at LOS E or F with high densities that range from 23 to 77 pc/km/ln (37 to 123 pc/mi/ln). West of the Metropolitan Avenue exit, the BQE operates at acceptable LOS D or better.
TABLE II-19: EXISTING (2002) WESTBOUND BQE LEVEL OF SERVICE
Segment/ Ramp Number Segment A.M. P.M.
1 From Queens Boulevard Entrance to LIE WB Exit C C
R1 LIE WB Exit C B
2 From LIE WB Exit to LIE EB/WB SR/43rd St Entrance D C
R2 LIE EB/WB SR/43rd Street Entrance F F
R3 Transition from 4 to 3 Lanes F F
3 From LIE EB/WB SR/43rd Street Entrance to top of Kosciuszko Bridge F F
4 From top of Kosciuszko Bridge to Meeker Avenue/Morgan Avenue Exit F F
R4 Meeker Avenue/Morgan Avenue Exit F F
5 From Meeker Avenue/Morgan Avenue Exit to McGuinness Blvd Entrance E F
R5 McGuinness Boulevard Entrance F F
6 From McGuinness Boulevard Entrance to Metropolitan Avenue Exit E E
R6 Metropolitan Avenue Exit B B
7 From Metropolitan Avenue Exit to Williamsburg Bridge Exit E D
R7 Williamsburg Bridge Exit C C
8 From Williamsburg Bridge Exit to Metropolitan Avenue /Marcy Avenue Entrance D D
R8 Metropolitan Avenue/Marcy Avenue Entrance C C
9 From Metropolitan Avenue/Marcy Avenue Entrance to Williamsburg Street Exit C C
R9 Williamsburg Street Exit C C
10 From Williamsburg Street Exit to Flushing Avenue Entrance C C
R10 Flushing Avenue Entrance C C
11 From Flushing Avenue Entrance to Tillary Street Exit C C
Eastbound and Westbound LIE
Traffic volumes on the LIE are typically high during peak periods causing poor levels of service and congestion. Within the Secondary Traffic Study Area, eastbound and westbound travel on the LIE is, in most cases, affected by the downstream congestion at the LIE service roads and the connections to and from the BQE. The results of the analysis are summarized below in Table II-20.

Draft Environmental Impact Statement Section II.C
Kosciuszko Bridge Project II-41 March 2007
TABLE II-20: EXISTING (2002) LIE LEVEL OF SERVICE
Segment A.M. P.M.
LIE Eastbound
From Borden Avenue to LIE SR Exit B C
LIE SR Exit (West of Interchange) C C
From LIE SR Exit to EB LIE SR Entrance B A
LIE SR Entrance (West of Interchange) C C
From LIE SR Entrance to Beginning of Contra-flow Bus Lane D N/A
From Beginning of Bus Lane to LIE SR Entrance (3-lane Segment) B N/A
From LIE SR Entrance to End of the 3-lane Segment N/A C
LIE SR Entrance Major Merge (East of Interchange) N/A N/A
Approaching N/A N/A
Departing N/A N/A
End of Three Lanes to Maurice Avenue Entrance C D
Maurice Avenue Entrance C C
From Maurice Avenue Entrance to 60th St Entrance C D
After 60th St Entrance D E
LIE Westbound
Before Maurice Avenue Exit E E
Maurice Avenue Exit E D
Maurice Avenue Exit to LIE SR Exit D D
LIE SR Exit B B
From LIE SR Exit to Beginning of Bus Lane D N/A
Bus Lane Exit D N/A
From Beginning of Bus Lane to Greenpoint /Hunters Point Avenue Exit C N/A
From LIE SR Exit to Greenpoint /Hunters Point Avenue Exit N/A C
Greenpoint/Hunters Point Avenue Exit F* C
Greenpoint/Hunters Point Avenue Exit to EB/WB BQE / WB LIE SR Entrance B B
EB/WB BQE / WB LIE SR Entrance N/A N/A
EB/WB BQE / WB LIE SR Entrance to Van Dam Street Exit C C
Van Dam Street Exit B B
Van Dam Street Exit to Van Dam Street Entrance B B
Van Dam Street Entrance B B
After Van Dam Street Entrance B B Note: *Demand exceeds capacity of the ramp

Draft Environmental Impact Statement Section II.C
Kosciuszko Bridge Project II-42 March 2007
During the a.m. peak hour, the LIE in the westbound direction (the peak direction) between the Maurice Avenue exit ramp and the Van Dam Street entrance ramp operates at LOS D or better with low densities ranging from 8 to 20 pc/km/ln (13 to 32 pc/mi/ln). In the eastbound direction, the LIE between the westbound BQE exit and the Maurice Avenue entrance also operates at LOS D or better with densities ranging between 9 to 16 pc/km/ln (14 to 26 pc/mi/ln).
During the p.m. peak hour, the LIE carries higher traffic volumes in the eastbound direction and, therefore, the densities are higher. The p.m. peak hour analyses indicate that, in the eastbound direction between the entrance from Borden Avenue and the entrance from Maurice Avenue, the LIE operates at LOS D or better with slightly higher densities of 7 to 22 pc/km/ln (11 to 35 pc/mi/ln). However, downstream of the entrance ramps from the service road and Maurice Avenue, LIE traffic operations typically deteriorate which affects the performance of the upstream LIE mainline and service road segments.
SIGNALIZED AND UNSIGNALIZED INTERSECTIONS
Detailed capacity analysis was performed for 2002 existing conditions at 50 signalized and seven unsignalized key intersections within the project study area. All 57 intersections, including four intersections along eastbound and westbound Meeker Avenue, were analyzed for the a.m. and p.m. peak hours, using HCS 2000 Version 4.1.e. Traffic volumes, signal timing, intersection geometry (lane utilization, lane width, parking maneuvers, etc.) and pedestrian crosswalk volumes were field collected and used in the analyses.
Table II-21 and Figure II-24, “Existing Level of Service – Meeker Avenue,” present the results of the four Meeker Avenue intersections. Note that, because eastbound and westbound Meeker Avenue function as separate roadways, their intersections with cross streets were evaluated individually.
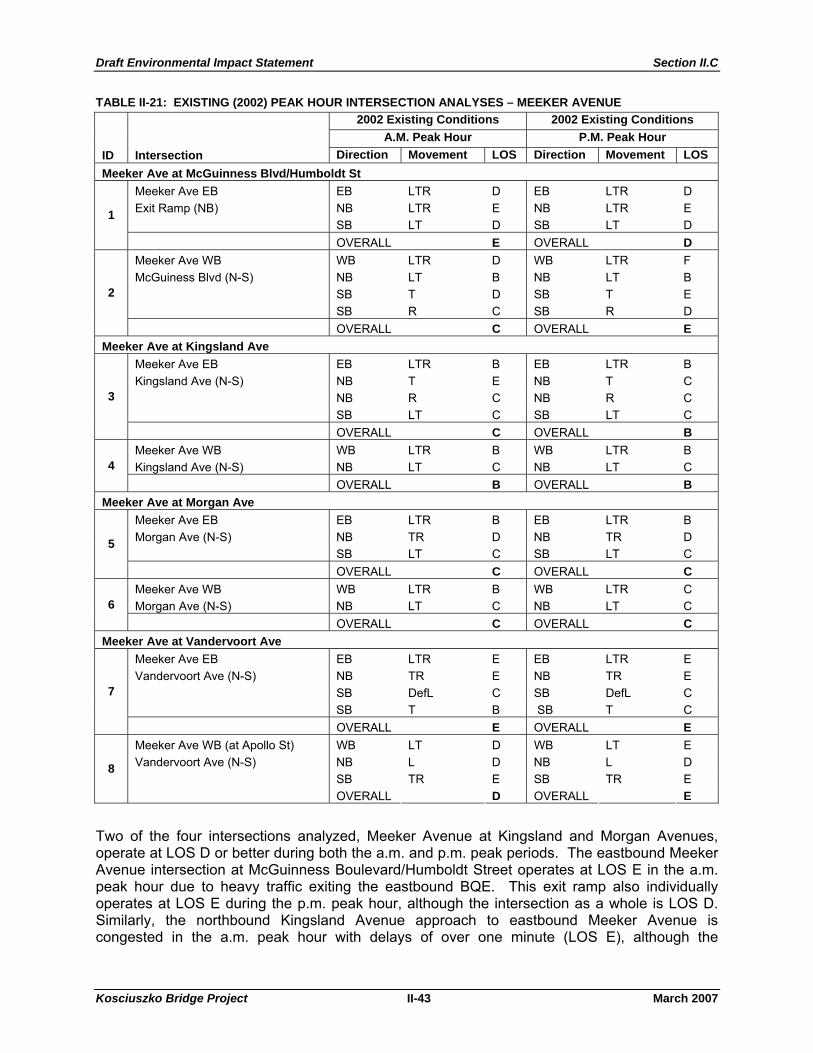
Draft Environmental Impact Statement Section II.C
Kosciuszko Bridge Project II-43 March 2007
TABLE II-21: EXISTING (2002) PEAK HOUR INTERSECTION ANALYSES – MEEKER AVENUE 2002 Existing Conditions 2002 Existing Conditions
A.M. Peak Hour P.M. Peak Hour ID Intersection Direction Movement LOS Direction Movement LOS Meeker Ave at McGuinness Blvd/Humboldt St
Meeker Ave EB EB LTR D EB LTR D Exit Ramp (NB) NB LTR E NB LTR E SB LT D SB LT D
1
OVERALL E OVERALL D Meeker Ave WB WB LTR D WB LTR F McGuiness Blvd (N-S) NB LT B NB LT B SB T D SB T E SB R C SB R D
2
OVERALL C OVERALL E Meeker Ave at Kingsland Ave
Meeker Ave EB EB LTR B EB LTR B Kingsland Ave (N-S) NB T E NB T C NB R C NB R C SB LT C SB LT C
3
OVERALL C OVERALL B Meeker Ave WB WB LTR B WB LTR B Kingsland Ave (N-S) NB LT C NB LT C 4 OVERALL B OVERALL B
Meeker Ave at Morgan Ave Meeker Ave EB EB LTR B EB LTR B Morgan Ave (N-S) NB TR D NB TR D SB LT C SB LT C
5
OVERALL C OVERALL C Meeker Ave WB WB LTR B WB LTR C Morgan Ave (N-S) NB LT C NB LT C 6 OVERALL C OVERALL C
Meeker Ave at Vandervoort Ave Meeker Ave EB EB LTR E EB LTR E Vandervoort Ave (N-S) NB TR E NB TR E SB DefL C SB DefL C SB T B SB T C
7
OVERALL E OVERALL E Meeker Ave WB (at Apollo St) WB LT D WB LT E Vandervoort Ave (N-S) NB L D NB L D SB TR E SB TR E
8
OVERALL D OVERALL E
Two of the four intersections analyzed, Meeker Avenue at Kingsland and Morgan Avenues, operate at LOS D or better during both the a.m. and p.m. peak periods. The eastbound Meeker Avenue intersection at McGuinness Boulevard/Humboldt Street operates at LOS E in the a.m. peak hour due to heavy traffic exiting the eastbound BQE. This exit ramp also individually operates at LOS E during the p.m. peak hour, although the intersection as a whole is LOS D. Similarly, the northbound Kingsland Avenue approach to eastbound Meeker Avenue is congested in the a.m. peak hour with delays of over one minute (LOS E), although the
Draft Environmental Impact Statement Section II.C
Kosciuszko Bridge Project II-44 March 2007
intersection as a whole is LOS C. The Meeker Avenue intersection with Vandervoort Avenue operates at LOS E with at least three movements (eastbound Meeker Avenue, northbound Vandervoort Avenue, and southbound Vandervoort Avenue at eastbound Meeker Avenue) at LOS E during both peak hours.
Other corridors experiencing congestion under existing conditions in the study area include Flushing Avenue, Grand Avenue, Metropolitan Avenue, Greenpoint Avenue, McGuinness Avenue, Van Dam Street, and Jackson Avenue. Signalized intersections currently experiencing poor operating conditions, with total intersection delay higher than 55 seconds and LOS E or F in the a.m. and/or p.m. peak hour include:
Greenpoint Avenue at Humboldt Street;
Greenpoint Avenue at eastbound LIE Service Road;
Eastbound/westbound Queens Boulevard at 69th Street;
Metropolitan Avenue at Morgan Avenue; and
Grand Street at Bushwick Avenue.
Unsignalized intersections with one or more movement operating at LOS E or F in either the a.m. and/or p.m. peak hours include:
Maspeth Avenue at 68th Street/Maurice Avenue;
Grand Avenue at Page Place;
Eastbound/westbound LIE service road at 68th Street;
Borden Avenue at Queens Midtown Tunnel entrance/exit; and
McGuinness Boulevard at Freeman Street.
NO BUILD CONDITIONS
The following section presents the results of the level of service analysis for the 2015 and 2045 No Build conditions. For level of service analyses for the Build Alternatives refer to Section III.C.2.b.
FREEWAY SEGMENTS
Traffic volumes on the study area roadways will continue to increase as long as there is demand and the capacity limits have not been completely met. Therefore, by 2015 traffic conditions on the BQE in both directions are expected to deteriorate. By 2045, traffic conditions would continue to deteriorate in most locations and breakdown conditions would prevail on the BQE. Expressway congestion would be caused by the traffic demand level consistently exceeding capacity in the a.m. and p.m. peak hours. These conditions would affect not only vehicles traveling on the expressway but also would cause additional congestion on the adjacent street network, especially on Meeker Avenue. Vehicle densities in most locations would increase and

Draft Environmental Impact Statement Section II.C
Kosciuszko Bridge Project II-45 March 2007
some segments that would operate acceptably in 2015 would operate at LOS E or worse in 2045.
Eastbound BQE
Table II-22 and Figures II-25, “Existing and No Build AM Peak Hour Level of Service – BQE,” and II-26, “Existing and No Build PM Peak Hour Level of Service – BQE,” show that, in the eastbound direction, by 2015, the bottleneck at the Kosciuszko Bridge would worsen, operating at LOS E or F from McGuinness Boulevard to the LIE Interchange. In 2015 during the a.m. peak hour, conditions at the five eastbound mainline BQE segments from the Tillary Street entrance to the McGuinness Boulevard exit would remain at acceptable LOS D or better. Traffic conditions would deteriorate from the McGuinness Boulevard exit to the LIE eastbound/westbound service road exit and those segments would operate at LOS E or F with higher densities ranging from 44 to 84 pc/mi/ln (27 to 52 pc/km/ln) in the a.m. peak hour. BQE eastbound segments from the LIE eastbound/westbound service road exit to the Queens Boulevard exit would continue operating at LOS C or better with slightly higher densities in the a.m. peak hour. In the p.m. peak hour, traffic conditions would follow a similar pattern as the a.m. peak hour where 2015 conditions would experience a slight deterioration in LOS and densities.

Draft Environmental Impact Statement Section II.C
Kosciuszko Bridge Project II-46 March 2007
TABLE II-22: NO BUILD (2015 AND 2045) EASTBOUND BQE LEVEL OF SERVICE
2015 2045 Segment/ Ramp Number Segment A.M. P.M. A.M. P.M.
1 From Tillary Street Entrance to Flushing Avenue Exit D D E E
R1 Flushing Avenue Exit D D D D
2 From Flushing Avenue Exit to Williamsburg Street Entrance C C D D
R2 Williamsburg Street Entrance D C D D
3 From Williamsburg Street Entrance to Metropolitan Avenue Exit D D E E
R3 Metropolitan Avenue Exit E D F F
4 From Metropolitan Avenue Exit to Williamsburg Bridge Entrance D C D D
R4 Williamsburg Bridge Entrance D E E E
5 From Williamsburg Bridge Entrance to McGuinness Boulevard Exit C F F F
R5 McGuinness Boulevard Exit F F F F
6 From McGuinness Boulevard Exit to Vandervoort Avenue Entrance E F F F
R6 Vandervoort Avenue Entrance F F F F
7 From Vandervoort Avenue Entrance to top of Kosciuszko Bridge F F F F
8 Top of Kosciuszko Bridge to LIE EB/WB SR Exit F E F F
R7 LIE EB/WB SR Exit F F F F
9 From LIE EB/WB SR Exit to LIE EB SR Entrance C C B C
R8 LIE EB SR Entrance B A B A
10 From LIE EB SR Entrance to Queens Boulevard Exit B C C C
By 2045 the BQE from Tillary Street to Flushing Avenue and Williamsburg Street to Metropolitan Avenue would become congested and operate at LOS E during the a.m. and p.m. peak hours. The Metropolitan Avenue exit and segments between McGuinness Boulevard to the LIE eastbound/westbound service road exit are also expected to deteriorate during both peak hours to LOS F with densities ranging from 42 to 67 pc/km/ln (68 to 107 pc/mi/ln) in the a.m. peak hour and 44 to 98 pc/km/ln (72 to 158 pc/mi/ln) in the p.m. peak hour. Other segments would operate at LOS D or better with higher densities compared to 2015 No Build conditions in the a.m. and p.m. peak hours
Westbound BQE
Table II-23 and Figures II-25 and II-26 show, that in the westbound direction, conditions on the Kosciuszko Bridge would similarly deteriorate, but areas of poor operation extend beyond the project limits to the exit to the Williamsburg Bridge. In 2015, the BQE from Queens Boulevard to the LIE eastbound/westbound service road entrance would operate at LOS D or better in both the a.m. and p.m. peak hours. However, traffic conditions would be much worse on the segments from the LIE eastbound/westbound service road entrance to the Williamsburg Bridge

Draft Environmental Impact Statement Section II.C
Kosciuszko Bridge Project II-47 March 2007
exit with densities that range from 24 to 95 pc/km/ln (38 to 154 pc/mi/ln) in the a.m. peak hour, while those segments would continue operating at LOS E or F in the p.m. peak hour with densities ranging from 23 to 68 pc/km/ln (37 to 110 pc/mi/ln). The LIE eastbound/westbound service road entrance with a density of 23 to 68 pc/km/ln (37 to 110 pc/mi/ln) during the a.m. peak hour would experience the highest density in the study area in the year 2015. This is due to the increasing demand and the capacity limitations on the entrance ramp and the BQE mainline. The BQE from the Metropolitan Avenue/Marcy Avenue entrance to the Tillary Street entrance would continue to operate at LOS D or better in both the a.m. and p.m. peak hours.
TABLE II-23: NO BUILD (2015 AND 2045) WESTBOUND BQE LEVEL OF SERVICE
2015 2045 Segment/ Ramp Number Segment A.M. P.M. A.M. P.M.
1 From Queens Boulevard Entrance to LIE WB Exit D C D D
R1 LIE WB Exit B B C C
2 From LIE WB Exit to LIE EB/WB SR/43rd St Entrance D C D E
R2 LIE EB/WB SR/43rd Street Entrance F F F F
R3 Transition from 4 to 3 Lanes F F F F
3 From LIE EB/WB SR/43rd Street Entrance to top of Kosciuszko Bridge F F F F
4 From top of Kosciuszko Bridge to Meeker Avenue /Morgan Avenue Exit F F F F
R4 Meeker/Morgan Avenue Exit F F F F
5 From Meeker/Morgan Avenue Exit to McGuinness Blvd Entrance F F F F
R5 McGuinness Boulevard Entrance F F E E
6 From McGuinness Boulevard Entrance to Metropolitan Avenue Exit E E E F
R6 Metropolitan Avenue Exit B B B B
7 From Metropolitan Avenue Exit to Williamsburg Bridge Exit E E E F
R7 Williamsburg Bridge Exit C C C C
8 From Williamsburg Bridge Exit to Metropolitan Avenue /Marcy Avenue Entrance D E E E
R8 Metropolitan Avenue/Marcy Avenue Entrance C C C C
9 From Metropolitan Avenue/Marcy Avenue Entrance to Williamsburg Street Exit C D D D
R9 Williamsburg Street Exit C C D D
10 From Williamsburg Street Exit to Flushing Avenue Entrance C C C C
R10 Flushing Avenue Entrance C C D C
11 From Flushing Avenue Entrance to Tillary Street Exit C C D D

Draft Environmental Impact Statement Section II.C
Kosciuszko Bridge Project II-48 March 2007
In 2045, the expressway from Queens Boulevard to the LIE eastbound/westbound service road entrance would continue operating at LOS D or better except for the segment between the LIE westbound exit and the LIE eastbound/westbound service road entrance which would become congested and would operate at LOS E in the p.m. peak hour. Traffic conditions would deteriorate on segments from the LIE eastbound/westbound service road entrance to the Williamsburg Bridge exit with LOS E or F in both peak hours and densities ranging from 23 to 98 pc/km/ln (38 to 158 pc/mi/ln) in the a.m. peak hour and 27 to 76 pc/km/ln (44 to 123 pc/mi/ln) in the p.m. peak hour. The segment from the Williamsburg Bridge exit to the Metropolitan Avenue/Marcy Avenue entrance will operate at LOS E in both the a.m. and p.m. peak hours. Segments from the Metropolitan Avenue/Marcy Avenue entrance to the Tillary Street entrance would continue operating at LOS D or better in both peak hours.
SIGNALIZED AND UNSIGNALIZED INTERSECTIONS
Similar to the highway network, as long as there is demand and reserve capacity, traffic volumes on the local streets will also continue to increase. Meeker Avenue will continue to experience traffic increases as the expressway becomes increasingly congested. Table II-24 and Figure II-27, “No Build Level of Service – Meeker Avenue,” summarize the capacity analysis results for the four Meeker Avenue intersections during the a.m. and p.m. peak periods.

TABLE II-24: NO BUILD (2015 AND 2045) INTERSECTION ANALYSES – MEEKER AVENUE 2015 No Build Conditions 2015 No Build Conditions 2045 No Build Conditions 2045 No Build Conditions
A.M. Peak Hour P.M. Peak Hour A.M. Peak Hour P.M. Peak Hour ID Intersection Direction Movement LOS Direction Movement LOS Direction Movement LOS Direction Movement LOS Meeker Ave at McGuinness Blvd/Humboldt St
Meeker Ave EB EB LTR D EB LTR D EB LTR D EB LTR D Exit Ramp (NB) NB LTR D NB LTR E NB LTR F NB LTR F SB LT D SB LT E SB LT F SB LT F 1
OVERALL D OVERALL E OVERALL F OVERALL F Meeker Ave WB WB LTR D WB LTR F WB LTR E WB LTR F McGuiness Blvd (N-S) NB LT C NB LT B NB LT C NB LT C SB T E SB T E SB T F SB T D R D SB R D SB R D SB R D
2
OVERALL D OVERALL E OVERALL F OVERALL F Meeker Ave at Kingsland Ave
Meeker Ave EB EB LTR B EB LTR B EB LTR C EB LTR B Kingsland Ave (N-S) NB T F NB T C NB T F NB T D NB R C NB R C NB R C NB R C SB LT C SB LT C SB LT C SB LT C
3
OVERALL D OVERALL B OVERALL E OVERALL C Meeker Ave WB WB LTR B WB LTR B WB LTR C WB LTR C Kingsland Ave (N-S) NB LT C NB LT C NB LT C NB LT C 4 OVERALL C OVERALL C OVERALL C OVERALL C
Meeker Ave at Morgan Ave Meeker Ave EB EB LTR B EB LTR B EB LTR B EB LTR C Morgan Ave (N-S) NB TR E NB TR D NB TR E NB TR F SB LT C SB LT C SB LT C SB LT C 5
OVERALL C OVERALL C OVERALL C OVERALL D Meeker Ave WB WB LTR B WB LTR D WB LT C WB LT C Morgan Ave (N-S) NB LT D NB LT C NB LT D NB LT C 6 OVERALL C OVERALL D OVERALL C OVERALL C
Meeker Ave at Vandervoort Ave Meeker Ave EB EB LTR E EB LTR E EB LTR F EB LTR D Vandervoort Ave (N-S) NB TR F NB TR E NB TR F NB TR F SB DefL C SB DefL C SB DefL C SB DefL C SB T B SB T C SB T B SB T C
7
OVERALL E OVERALL E OVERALL F OVERALL F Meeker Ave WB (at Apollo St) WB LT E WB LT F WB LT E WB LT F Vandervoort Ave (N-S) NB L D NB L D NB L D NB L E SB TR E SB TR E SB TR E SB TR E 8
OVERALL E OVERALL F OVERALL E OVERALL F
Draft Environm
ental Impact Statem
ent
Section II.C
Kosciuszko B
ridge Project II-49
March 2007

Draft Environmental Impact Statement Section II.C
Kosciuszko Bridge Project II-50 March 2007
Under 2015 No Build conditions, two of the four intersections, Meeker Avenue at Kingsland Avenue and at Morgan Avenue, would continue to operate at an acceptable level (LOS D or better) during the a.m. and p.m. peak hours and would, except for eastbound Meeker Avenue at Kingsland Avenue in the a.m. peak hour, remain acceptable in 2045. However, by 2015 two individual approaches to these intersections would have become unacceptable; in the a.m. peak hour the northbound Kingsland Avenue approach to Meeker Avenue would operate at LOS F and the northbound Morgan Avenue approach to Meeker Avenue would operate at LOS E. By 2045, the northbound Morgan Avenue approach would also be unacceptable (LOS F) in the p.m. peak hour.
The Meeker Avenue intersection with McGuinness Boulevard/Humboldt Street would be LOS E in the p.m. peak hour in 2015, but deteriorate to LOS F for both peak hours by 2045. Two approaches to this intersection would experience particularly severe delay in 2045: vehicles using the eastbound exit ramp at this intersection would experience over four minutes of delay and vehicles entering the intersection on westbound Meeker Avenue would experience over two and a half minutes of delay.
The Meeker Avenue intersection at Vandervoort Avenue/Apollo Street would also deteriorate between 2002 and 2045, reaching LOS E or F for both peak hours. In particular, the westbound Meeker Avenue approach to the intersection will experience increased delay in the p.m. peak hour, from under one minute in 2002, to over two minutes by 2015. The eastbound Meeker Avenue approach, with current delays just over a minute in the a.m. peak hour, will degrade to nearly three minutes of delay by 2045. Finally, northbound Vandervoort Avenue which currently experiences delays of less than one and a half minutes, will, by 2045, experience delays over three minutes.
In 2015, the results of the capacity analysis indicate that 20 of the 50 analyzed signalized intersections in the Secondary Traffic Study Area would operate with a total intersection control delay in excess of 55 seconds (LOS E or F) in the a.m. and/or p.m. peak hours, an increase of 10 intersections over existing conditions. By 2045, the number of intersections at LOS E or F would increase to 40 of the 50 analyzed.
C.1.j. Non-Standard Features and Non-Conforming Features
This section describes the existing non-standard and non-conforming features of the BQE within the project limits. Section II.C.1.k describes the link between these features and identified safety issues.
NON-STANDARD FEATURES
As defined in the NYSDOT Highway Design Manual, non-standard features are those features, which do not meet the applicable design criteria for certain critical design elements. The design criteria are based on the functional classification of the highway, traffic volumes, operating speed, terrain, and other factors. There are 17 critical design elements:
1. design speed
2. lane width
3. shoulder width

Draft Environmental Impact Statement Section II.C
Kosciuszko Bridge Project II-51 March 2007
4. bridge roadway width
5. grade
6. horizontal curvature
7. superelevation
8. stopping sight distance
9. lateral clearance
10. vertical clearance
11. pavement cross slope
12. rollover
13. structural capacity
14. level of service
15. control of access
16. pedestrian accommodations
17. median width
The design criteria adopted by NYSDOT for the project is based on a design speed of 100 km/h (62 mph). The speed limit for the mainline BQE is currently posted at 45 mph (72 km/h). The geometric features of the Brooklyn Connector, Brooklyn Approach, Main Span and Queens Approach were reviewed based on the design criteria described in the NYSDOT Highway Design Manual and listed in Section III.A.2. Non-standard features were identified and are listed on Table II-25. Plan and profile drawings detailing non-standard features are included in Appendix D.

Draft Environmental Impact Statement Section II.C
Kosciuszko Bridge Project II-52 March 2007
TABLE II-25: SUMMARY OF NON-STANDARD FEATURES
Roadway Non-Standard Features of Existing Conditions
Brooklyn Connector
Insufficient EB & WB Left Shoulders = 0.30 m (1'-0”) from Sta. 0+757 to 1+392
Insufficient EB Right Shoulder = 0.76 m (2'-6") from Sta. 0+720 to 1+311
Insufficient WB Right Shoulder = 0.76 m (2'-6") from Sta. 0+720 to 1+305
Insufficient Horizontal Stopping Sight Distance EB Right Lane = 80.0 m (262'-6”) from Sta. 1+029 to 1+120
Insufficient Horizontal Stopping Sight Distance WB Left Lane = 74.0 m (242'-9”) from Sta. 1+029 to 1+120
Brooklyn Approach
Insufficient EB & WB Right Shoulders = 1.52 m+/- (5'-0” +/-) from Sta. 1+392 to 1+830
Insufficient EB & WB Left Shoulders = 0.30 m (1'-0”) from Sta. 1+392 to 1+830
Insufficient Horizontal Stopping Sight Distance EB Left Lane = 95.7 m (314'-0”) from Sta. 1+453 to 1+723
Insufficient Horizontal Stopping Sight Distance WB Right Lane = 118.6 m (389'-1”) from Sta. 1+453 to 1+723
Grades vary 3.688% to 4.320% from Sta. 1+329 to 1+994 Brooklyn Ramps
WB BQE Exit Ramp Insufficient WB BQE Exit Ramp Right and Left Shoulder = 0.15 m (0'-6”) from Sta. 1+139 to 1+325
EB BQE Entrance Ramp Insufficient EB BQE Entrance Ramp Right and Left Shoulder = 0.15 m (0'-6”) from Sta. 1+139 to 1+325
Main Span
Insufficient EB & WB Lane Width = 3.30 m (10'-10") from Sta. 1+830 to 1+922
Insufficient EB & WB Left Shoulder = 0.30 m (1'-0”) from Sta. 1+830 to 1+922
Insufficient EB & WB Right Shoulder = 0.15 m (0’-6”) from Sta. 1+830 to 1+922
Grades vary 3.750% to 4.000% from Sta. 1+830 to 1+922 Insufficient Vertical Stopping Sight Distance 95.18 m (312'-3”) from
Sta. 1+830 to 1+922
Queens Approach
Insufficient EB & WB Right Shoulders = 1.52 m+/- (5'-0”+/-) from Sta. 1+922 to 2+460
Insufficient EB & WB Left Shoulders = 0.30 m (1'-0”) from Sta. 1+922 to 2+460
Insufficient Horizontal Stopping Sight Distance EB Left Lane = 143.9 m (472'-1”) from Sta. 1+923 to 2+254
Insufficient Horizontal Stopping Sight Distance WB Right Lane = 179.5 m (588'-11”) from Sta. 1+995 to 2+264
Queens Ramps
EB LIE Ramp to Laurel Hill Boulevard
Radius of Right Edge of Pavement = 60.9 m (199'-10”)
EB LIE Entrance Ramp
(Between Laurel Hill Boulevard Gore and 43rd Street Entrance Ramp Gore)
Radii vary = 60.9 m (199’-10”') to 67.1 m (220'-2”) Ramp Width Varies between 4.3 m (14'-1”) and 6.1 m (20'-0”) Insufficient Left Shoulder Reduces to 0.61 m (2'-0”) at Gore
Sta.2+586 +/- Insufficient Horizontal Stopping Sight Distance Right Lane = 39.7 m
(130’-3”) from Sta. 2+700 to 2+740 43rd Street Entrance Ramp to EB
LIE Entrance Ramp
(Gore Area and Merge)
Insufficient Left and Right Shoulders at Gore: Less than 1.0 m (3'-6”)

Draft Environmental Impact Statement Section II.C
Kosciuszko Bridge Project II-53 March 2007
Roadway Non-Standard Features of Existing Conditions
WB LIE Entrance Ramp/EB LIE Entrance Ramp
(Gore Area Only)
Insufficient Left and Right Shoulders on Both Ramps at Gore: Less than 0.61 m (2'-0”) Sta. 2+560+/-
WB LIE Entrance Ramp/WB BQE Mainline
(Gore Area Only)
Insufficient Left and Right Shoulders on Ramp and Mainline at Gore: Less than 0.61 m (2'-0”) Sta. 2+520 +/-
EB BQE Mainline Right Shoulder Reduces to 0.61 m (2'-0”) Left Shoulder Reduces to 0.61 m (2'-0”)
WB BQE Mainline Insufficient Horizontal Stopping Sight Distance WB Left Lane = 97.0 m (318’-3”) from Sta. 2+490 to 2+142
In general, the existing BQE within the project limits has insufficient shoulders (both right and left), insufficient stopping sight distance (the distance a driver needs to be able to see in order to stop before reaching a stationary object, such as a stopped vehicle), and steep grades. Likewise, most ramps within the project limits have insufficient shoulders. Also, non-standard vertical clearance exists under the bridge in Brooklyn at Vandervoort Avenue (4.3 m [14’-2”]) and in Queens at 54th Road (4.1 m [13’-4”]) and 54th Avenue (4.3 m [14’-0”]). Section II.C.1.k describes the effect of these deficiencies on vehicle safety.
NON-CONFORMING FEATURES
Non-conforming elements are those which do not conform to normally accepted engineering practice and are not critical design elements. Examples of non-conforming features include inadequate acceleration and deceleration lane lengths, short weaving sections and inadequate climbing lane lengths. Such undesirable elements may have a considerable effect on the safety and operation of the roadways within the corridor.
Non-conforming features were identified at different locations on the existing highway section. Insufficient acceleration lengths exist at the eastbound BQE Vandervoort Avenue entrance ramp [38 m (124′-8")] and the westbound BQE entrance ramp from the LIE [27 m (88′-7")]. Insufficient deceleration length exists at the westbound BQE exit ramp at Apollo Street [20 m (65′-7")]. Insufficient offset to the barriers exist at the Brooklyn Connector, Brooklyn and Queens Approaches, and the Main Span in the exiting condition. This offset is as low as 0.2 m (8”) when the standard minimum should be 0.6 m (2’-0”) and bicycle accommodations are not provided on the existing bridge.
C.1.k. Safety Considerations, Accident History and Analysis
An accident history analysis was performed to identify locations with a high number of accidents, accident patterns, accident types and conditions, and the severity of the accidents. The analysis was based on reported vehicle accidents for the two-year period from May 1999 to April 2001. This period represents the most complete data available at the time the analysis was conducted and is representative of travel patterns and accident data over the past few years. Since no geometric or physical improvements have been made to this segment of the BQE since 2001, and no significant development has been created in the area that could have a significant effect on travel patterns on the BQE, analyzing more recent data would lead to the same conclusions made using the data for the May 1999 to April 2001 period.

Draft Environmental Impact Statement Section II.C
Kosciuszko Bridge Project II-54 March 2007
This analysis encompasses segments of the BQE between Manhattan Avenue and the LIE interchange and Meeker Avenue between McGuinness Boulevard/Humboldt Street and Vandervoort Avenue/Apollo Street. Within these limits, seven entrance/exit ramps, four in the eastbound direction and three in the westbound direction, also were analyzed.
Accidents are generally classified into two categories: reportable and non-reportable. An accident is classified as reportable if:
The amount of the vehicular damage exceeds $1,000;
A personal injury occurs; or
A motorist accident report is filed.
The location, type, time and severity of accidents help identify contributing causes or roadway deficiencies. Mitigating measures can be investigated and applied to rectify geometric deficiencies and help reduce future accident risks. A majority of accidents can be attributed to a number of factors, including, but not limited to, the following:
Existing non-standard and non-conforming geometry such as inconsistent lane widths; short weaving sections; inadequate acceleration and deceleration lane lengths; and insufficient vertical and horizontal stopping sight distance;
Operational deficiencies such as capacity constraints; speed; and poor signage, drainage and/or lighting;
Natural elements such as sun glare and weather; and
Motorist behavior such as aggressiveness and roadway unfamiliarity.
Reportable accidents are documented in “Police Accident Report” and/or “Report of Motor Vehicle Accident” forms prepared by local police precincts and later provided to the NYSDOT Traffic and Safety Division for input into a NYSDOT database of accident records. The State Accident Surveillance System (SASS) and Centralized Local Accident Surveillance System (CLASS) are the databases for accidents occurring on state routes and local streets, respectively. Detailed data in the accident reports include the date and time of the accident; number and type of vehicles involved; number of injuries or fatalities; weather, pavement and lighting conditions; driver information; approximate location of the accident; vehicle travel direction; contributing factors; and a description and drawing of the accident.
The SASS accident database is referenced to the highway milepost reference marker (RM) system. For this project, data was gathered for the eastbound BQE from RM 278IX2M23117 (near Manhattan Avenue in Brooklyn) to RM 278IX5M33006 (at the LIE interchange in Queens) and for the westbound BQE from RM 278IX5M34006 (at the LIE interchange in Queens) to RM 278IX2M24118 (near McGuinness Boulevard/Humboldt Street in Brooklyn).
All available traffic accident records within the project limits for the analysis period were obtained from the SASS and CLASS databases. For analysis purposes each accident on the BQE was assigned to a 0.16 km (0.1 mi) segment of roadway and accidents on ramps were assigned to the ramp. The accident records for the BQE mainline and ramps within the study area are summarized in Table II-26. Accidents on Meeker Avenue were assigned to the nearest

Draft Environmental Impact Statement Section II.C
Kosciuszko Bridge Project II-55 March 2007
intersection, identified by a node number. Accident records for Meeker Avenue are summarized in Table II-27.

Draft Environmental Impact Statement Section II.C
Kosciuszko Bridge Project II-56 March 2007
TABLE II-26: TWO-YEAR ACCIDENT SUMMARY – HIGHWAY AND RAMPS Time of Day Accidents Percent Surface Accidents Percent 6 am- 10 am 123 15.2% Dry 634 78.2% 10 am- 4 pm 282 34.8% Wet 103 12.7% 4 pm- 7 pm 132 16.3% Mud 1 0.1% 7 pm- 12 am 131 16.2% Snow/Ice 16 2.0% 12 am- 6 am 121 14.9% Slush 3 0.4% Unspecified 22 2.7% Unknown 54 6.7% Total 811 100.0% Total 811 100.0% Day of Week Accidents Percent Weather Accidents Percent Sunday 77 9.5% Clear 559 68.9% Monday 123 15.2% Cloudy 111 13.7% Tuesday 121 14.9% Rain 65 8.0% Wednesday 137 16.9% Snow 12 1.5% Thursday 133 16.4% Sleet/Hail/Freezing Rain 7 0.9% Friday 114 14.1% Fog/Smog/Smoke 1 0.1% Saturday 106 13.1% Unspecified 56 6.9% Total 811 100.0% Total 811 100.0% Time of Year Accidents Percent Accident Type Accidents Percent Winter (Dec-Feb) 233 28.7% Rear End 470 58.0% Spring (Mar-May) 153 18.9% Overtake 261 32.2% Summer (Jun-Aug) 195 24.0% Right Angle 1 0.1% Fall (Sep-Nov) 230 28.4% Left Turn 0 0.0% Total 811 100.0% Right Turn 1 0.1% Fixed Object 37 4.6% Accident Severity Accidents Percent Head On 0 0.0% Fatal 1 0.1% Sideswipe 2 0.2% Injury 237 29.2% Pedestrian 0 0.0% Property Damage Only 166 12.2% Bicycle 1 0.1% Non-Reportable 407 58.4% Parked Vehicle 0 0.0% Total 811 100.0% Backing 1 0.1% Run Off Road 1 0.1% Light Condition Accidents Percent Driveway 0 0.0% Day 418 51.5% Other 36 4.4% Dawn 13 1.6% Unknown 0 0.0% Dusk 15 1.8% Total 811 100.0% Dark-Road Lighted 254 31.3% Type of Vehicle Vehicle Percent Dark-Road Unlighted 5 0.6% Passenger Cars 1432 83.9% Unknown 106 13.1% Commercial Vehicles 274 16.1% Total 811 100.0% Total 1706 100.0% Summary of Accident Severity by Year 1999 2000 2001 Total Fatal 0 1 0 1 Injury 89 112 36 237 Property Damage Only 39 93 34 166 Non-Reportable 136 227 44 407 Total 264 433 114 811
Note: Accident data is for May 1, 1999 through April 30, 2001
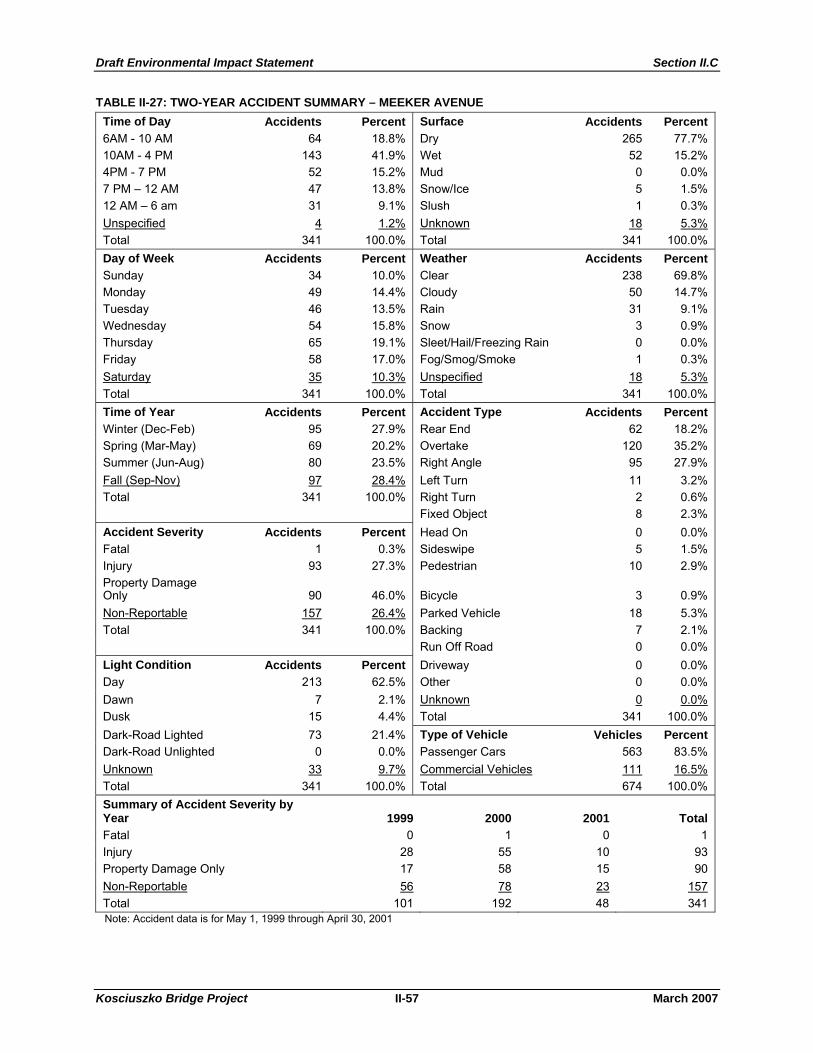
Draft Environmental Impact Statement Section II.C
Kosciuszko Bridge Project II-57 March 2007
TABLE II-27: TWO-YEAR ACCIDENT SUMMARY – MEEKER AVENUE Time of Day Accidents Percent Surface Accidents Percent 6AM - 10 AM 64 18.8% Dry 265 77.7% 10AM - 4 PM 143 41.9% Wet 52 15.2% 4PM - 7 PM 52 15.2% Mud 0 0.0% 7 PM – 12 AM 47 13.8% Snow/Ice 5 1.5% 12 AM – 6 am 31 9.1% Slush 1 0.3% Unspecified 4 1.2% Unknown 18 5.3% Total 341 100.0% Total 341 100.0% Day of Week Accidents Percent Weather Accidents Percent Sunday 34 10.0% Clear 238 69.8% Monday 49 14.4% Cloudy 50 14.7% Tuesday 46 13.5% Rain 31 9.1% Wednesday 54 15.8% Snow 3 0.9% Thursday 65 19.1% Sleet/Hail/Freezing Rain 0 0.0% Friday 58 17.0% Fog/Smog/Smoke 1 0.3% Saturday 35 10.3% Unspecified 18 5.3% Total 341 100.0% Total 341 100.0% Time of Year Accidents Percent Accident Type Accidents Percent Winter (Dec-Feb) 95 27.9% Rear End 62 18.2% Spring (Mar-May) 69 20.2% Overtake 120 35.2% Summer (Jun-Aug) 80 23.5% Right Angle 95 27.9% Fall (Sep-Nov) 97 28.4% Left Turn 11 3.2% Total 341 100.0% Right Turn 2 0.6%
Fixed Object 8 2.3% Accident Severity Accidents Percent Head On 0 0.0% Fatal 1 0.3% Sideswipe 5 1.5% Injury 93 27.3% Pedestrian 10 2.9% Property Damage Only 90 46.0% Bicycle 3 0.9% Non-Reportable 157 26.4% Parked Vehicle 18 5.3% Total 341 100.0% Backing 7 2.1% Run Off Road 0 0.0% Light Condition Accidents Percent Driveway 0 0.0% Day 213 62.5% Other 0 0.0% Dawn 7 2.1% Unknown 0 0.0% Dusk 15 4.4% Total 341 100.0% Dark-Road Lighted 73 21.4% Type of Vehicle Vehicles Percent Dark-Road Unlighted 0 0.0% Passenger Cars 563 83.5% Unknown 33 9.7% Commercial Vehicles 111 16.5% Total 341 100.0% Total 674 100.0% Summary of Accident Severity by Year 1999 2000 2001 Total Fatal 0 1 0 1 Injury 28 55 10 93 Property Damage Only 17 58 15 90 Non-Reportable 56 78 23 157 Total 101 192 48 341
Note: Accident data is for May 1, 1999 through April 30, 2001

Draft Environmental Impact Statement Section II.C
Kosciuszko Bridge Project II-58 March 2007
Over the two-year analysis period, a total of 1,152 accidents were reported in the 2.7 km (1.7 mi) long study limits. Of these, 689 occurred on the mainline BQE roadway, 122 occurred on ramps, and 341 occurred on Meeker Avenue. Of the 689 mainline accidents, 380 and 309 occurred in the eastbound and westbound directions, respectively. Of the 122 ramp accidents, 62 occurred on the three exit ramps and 60 occurred on the four entrance ramps. On Meeker Avenue, 204 and 137 accidents were reported eastbound and westbound, respectively.
A total of 330 accidents (29%) resulted in injuries. Of these, 213 occurred along mainline expressway segments, 24 occurred on entrance/exit ramps and 93 occurred at Meeker Avenue intersections. Two fatalities were reported; one on the westbound BQE entrance ramp at McGuinness Boulevard and the other on westbound Meeker Avenue at Kingsland Avenue.
Transportation facilities are grouped into various categories to compare accidents among similar facilities. Average accident rates on New York State highways by facility type were obtained from the NYSDOT Traffic and Safety Division for the period between June 1, 2000 and May 31, 2002. Accident rates for each mainline segment, ramp, and intersection were calculated and compared to the corresponding statewide rate. For highway segments, accident rates are expressed as accidents per million vehicle kilometers (accidents/MVK) [accidents per million vehicle miles (accidents/MVM)]. For comparison with the statewide average accident rates, the mainline accident rates on the segments of the BQE were computed as follows:
Number of Accidents per Year x 1,000,000 Rate per MVK (MVM) = AADT x 365 x Section Length [in km (mi)]
Accident rates for ramps are expressed in million entering vehicles (MEV) and are calculated using the following equation:
Number of Accidents per Year x 1,000,000 Rate per MEV = AADT x 365
Similarly, intersection accident rates are expressed in MEV and are calculated using the following equation:
Number of Accidents per Year x 1,000,000 Rate per MEV = 24-Hour Intersection Volume x 365
Tables II-28, II-29, II-30, and II-31 and Figures II-28, “Eastbound BQE Mainline Accident Rates,” II-29, “Westbound BQE Mainline Accident Rates,” II-30, “BQE Ramps Accident Rates,” and II-31, “Meeker Avenue Accident Rates,” summarize the calculated accident rates for the eastbound and westbound BQE mainline, ramps, and Meeker Avenue intersections within the study area and the corresponding statewide average accident rates. The Statewide averages are classified by “facility type.” The 0.68 MVK rate on the BQE is for an urban controlled-access four-lane divided roadway and applies to the section of roadway in the vicinity of the entrance from the eastbound LIE, which consists of two lanes in each direction. The 1.11 MVK rate is for an urban controlled-access six-lane divided roadway and applies to the remainder of the BQE within the study area, which consists of three lanes in each direction. Similarly, the 0.15 MEV rate is for an exit ramp merging with three or more lanes; the 0.11 MEV rate is for an entrance ramp merging with two lanes; and the 0.07 MEV rate is for an entrance ramp merging with three or more lanes.

Draft Environmental Impact Statement Section II.C
Kosciuszko Bridge Project II-59 March 2007
TABLE II-28: ACCIDENT RATES – EASTBOUND BQE
Computed Accident Rate
Statewide Accident Rate Reference
Marker Segment Location Accidents MVK MVM MVK MVM
278I-X2M2-3117 Near Manhattan Avenue 78 8.30 13.36 1.11 1.78
278I-X2M2-3118 Near McGuinness Boulevard/Humboldt Street 67 9.02 14.52 1.11 1.78
278I-X2M2-3119 Near North Henry Street 8 1.08 1.73 1.11 1.78
278I-X2M2-3120 Near Monitor Street 7 0.94 1.52 1.11 1.78
278I-X2M2-3121 Near Sutton Street 7 0.94 1.52 1.11 1.78
278I-X2M2-3122 Between Morgan Avenue and Hausman Street 16 2.16 3.47 1.11 1.78
278I-X2M2-3123 Near Vandervoort Avenue 21 2.83 4.55 1.11 1.78
278I-X2M2-3124 Near Varick Avenue 7 0.94 1.52 1.11 1.78
278I-X2M2-3125 Near Stewart Avenue 9 0.92 1.48 1.11 1.78
278I-X2M2-3126 Near Gardner Avenue 4 0.41 0.66 1.11 1.78
278I-X2M2-3127 Near Scott Avenue 25 2.55 4.11 1.11 1.78
278I-X5M3-3000 On the Kosciuszko Bridge 43 4.39 7.06 1.11 1.78
278I-X5M3-3001 Near 56th Road 3 0.31 0.49 1.11 1.78
278I-X5M3-3002 Between 56th Road and 55th Avenue 1 0.10 0.16 1.11 1.78
278I-X5M3-3003 Near 54th Drive 3 0.31 0.49 1.11 1.78
278I-X5M3-3004 At the Exit to the Eastbound LIE Service Road 64 6.53 10.51 1.11 1.78
278I-X5M3-3005 Before the Entrance from the Eastbound LIE 8 2.17 3.49 0.68 1.09
278I-X5M3-3006 After the Entrance from the Eastbound LIE 9 2.44 3.93 0.68 1.09

Draft Environmental Impact Statement Section II.C
Kosciuszko Bridge Project II-60 March 2007
TABLE II-29: ACCIDENT RATES – WESTBOUND BQE
Computed Accident Rate
Statewide Accident Rate Reference
Marker Segment Location Accidents MVK MVM MVK MVM
278I-X5M3-4006 Near the LIE 3 0.72 1.15 0.68 1.09
278I-X5M3-4005 Before the Entrance from the Westbound LIE 5 1.19 1.92 0.68 1.09
278I-X5M3-4004 After the Entrance from the Westbound LIE 22 2.19 3.52 1.11 1.78
278I-X5M3-4003 Near 54th Drive 9 0.90 1.44 1.11 1.78
278I-X5M3-4002 Between 56th Road and 55th Avenue 3 0.30 0.48 1.11 1.78
278I-X5M3-4001 Near 56th Road 12 1.19 1.92 1.11 1.78
278I-X5M3-4000 On the Kosciuszko Bridge 74 7.37 11.86 1.11 1.78
278I-X2M2-4127 Near Scott Avenue 12 1.19 1.92 1.11 1.78
278I-X2M2-4126 Near Gardner Avenue 10 1.00 1.60 1.11 1.78
278I-X2M2-4125 Near Stewart Avenue 6 0.60 0.96 1.11 1.78
278I-X2M2-4124 Near Varick Avenue 14 1.66 2.67 1.11 1.78
278I-X2M2-4123 After the Exit to Meeker Avenue/Morgan Avenue 48 5.70 9.17 1.11 1.78
278I-X2M2-4122 Between Morgan Avenue and Hausman Street 15 1.78 2.87 1.11 1.78
278I-X2M2-4121 Near Sutton Street 23 2.73 4.39 1.11 1.78
278I-X2M2-4120 Near Monitor Street 8 0.95 1.53 1.11 1.78
278I-X2M2-4119 Near North Henry Street 7 0.83 1.34 1.11 1.78
278I-X2M2-4118 Near Meeker Avenue/McGuinness Boulevard Entrance Ramp 38 4.51 7.26 1.11 1.78

Draft Environmental Impact Statement Section II.C
Kosciuszko Bridge Project II-61 March 2007
TABLE II-30: ACCIDENT RATES – RAMPS
Reference Marker Ramp Location Accidents
Computed Accident
Rate (MEV)
Statewide Accident
Rate (MEV)
Eastbound
278I-X2MR-15A1 Exit Ramp to Humboldt Street/McGuinness Boulevard 30 2.45 0.15
278I-X2MR-15B1 Entrance Ramp from Meeker Avenue/Vandervoort Avenue 31 2.10 0.07
278I-X5MR-01A1 Exit Ramp to Eastbound LIE Service Road 19 0.50 0.15
278I-X5CR-02H2 Entrance Ramp from Eastbound LIE Service Road 1 0.12 0.11
Westbound
278I-X5CR-02G2 Entrance Ramp from Westbound LIE Service Road/ Eastbound LIE Service Road/43rd Street 19 0.52 0.11
278I-X2MR-15C1 Exit to Meeker Avenue/Morgan Avenue 13 1.29 0.15
278I-X2MR-15D1 Entrance Ramp from McGuinness Boulevard 9 0.76 0.07

Draft Environmental Impact Statement Section II.C
Kosciuszko Bridge Project II-62 March 2007
TABLE II-31: ACCIDENT RATES – LOCAL STREETS
Reference Node Number Description of Intersection Accidents
Computed Accident
Rate (MEV)
Statewide Accident
Rate (MEV)
Eastbound
22424 McGuinness Boulevard at Eastbound Meeker Avenue 44 1.71 0.35
22425 North Henry Street at Eastbound Meeker Avenue 16 1.35 0.35
22426 Monitor Street at Eastbound Meeker Avenue 3 0.29 0.07
22427 Kingsland Avenue at Eastbound Meeker Avenue 30 1.89 0.35
22428 Morgan Avenue at Eastbound Meeker Avenue 51 3.58 0.35
22429 Vandervoort Avenue at Eastbound Meeker Avenue 58 2.64 0.35
22430 Entrance Ramp at Eastbound Meeker Avenue 1 0.06 0.24
22431 Porter Avenue at Cherry Street 1 0.32 0.27
Westbound
21407 Apollo Street at Westbound Meeker Avenue 40 2.65 0.35
21409 Hausman Street at Westbound Meeker Avenue 4 0.45 0.07
21417 Driggs Avenue at Westbound Meeker Avenue 2 0.23 0.07
21412 Morgan Avenue at Westbound Meeker Avenue 44 3.88 0.35
21415 Sutton Street at Westbound Meeker Avenue 8 0.91 0.16
21370 Kingsland Avenue at Westbound Meeker Avenue 16 1.20 0.35
21418 Engert Avenue at Westbound Meeker Avenue 0 0.00 0.07
21375 Monitor Street at Westbound Meeker Avenue 5 0.57 0.16
21419 North Henry Street at Westbound Meeker Avenue 9 0.84 0.35
21384 Russell Street at Westbound Meeker Avenue 8 0.81 0.16
22439 Entrance Ramp at McGuinness Boulevard/Westbound Meeker Avenue 1 0.03 0.35
Below are descriptions of the locations where the statewide average rate was exceeded, followed by a discussion of accident patterns and causes.
BQE EASTBOUND DIRECTION
Near Manhattan Avenue (RM 278I-X2M2-3117) – This location experienced 78 accidents and had an accident rate of 8.30 accidents/MVK (13.36 accidents/MVM), which is 7.5 times the statewide average. Of the 78 accidents, 47 (60.3%) were rear-end accidents and 22 (28.2%) involved overtaking.
Near McGuinness Boulevard/Humboldt Street exit (RM 278I-X2M2-3118) – This location experienced 67 accidents during the two-year study period and had an accident rate of 9.02 accidents/MVK (14.52 accidents/MVM), which is 8.1 times the statewide average.

Draft Environmental Impact Statement Section II.C
Kosciuszko Bridge Project II-63 March 2007
Of these, 44 (65.6%) were rear-end accidents and 17 (25.4%) were attributable to overtaking.
Between Morgan Avenue and Hausman Street (RM 278I-X2M2-3122) – There were total of 16 accidents in this section of highway, with an accident rate of 2.16 accidents/MVK (3.47 accidents/MVM), which is 1.9 times the statewide average. Twelve (75.0%) of the accidents were rear-end accidents and the remaining four (25.0%) were overtaking accidents.
Near Vandervoort Avenue (RM 278I-X2M2-3123) – There were 21 accidents at this location during the study period, with an accident rate of 2.83 accidents/MVK (4.55 accidents/MVM). This is 2.6 times the statewide average. Fourteen (66.7%) of the accidents were rear-end accidents and four (19.0%) were overtaking accidents.
Near Scott Avenue (RM 278I-X2M2-3127) – There were 25 accidents at this location, with an accident rate of 2.55 accidents/MVK (4.11 accidents/MVM), which is 2.3 times the statewide average. Sixteen (64.0%) of the accidents were rear-end accidents and eight (32.0%) were overtaking accidents.
On the Kosciuszko Bridge (RM 278I-X2M2-3000) – There were 43 accidents at this location, with an accident rate of 4.39 accidents/MVK (7.06 accidents/ MVM). This is 4.0 times the statewide average. Of the accidents at this location, 25 (58.1%) involved rear-end accidents and 12 (27.9%) involved overtaking accidents.
At the exit to the eastbound LIE service road (RM 278I-X2M2-3004) – This location had a total of 64 accidents during the two-year study period. This corresponds to 6.53 accidents/MVK (10.51 accidents/MVM), which is 5.9 times the statewide average. Of these, 29 (45.3%) were overtaking accidents and 28 (43.8%) were rear-end accidents.
Before the entrance from the eastbound LIE (RM 278I-X2M2-3005) – This location experienced a total of eight accidents and had an accident rate of 2.17 accidents/MVK (3.49 accidents/MVM), which is 3.2 times the statewide average. Five (62.5%) of the accidents were rear-end accidents and three (37.5%) were attributed to overtaking.
After the entrance from the eastbound LIE (RM 278I-X2M2-3006) – This section of highway experienced nine accidents during the study period, with an accident rate of 2.44 accidents/MVK (3.93 accidents/MVM), which is 3.6 times the statewide average. Of the nine accidents, five (55.6%) were overtaking accidents and four (44.4%) were rear-end accidents.
Of the 380 accidents within the eastbound BQE study area during the analysis period, 331 (87.1%) occurred at the above nine locations. Of these, 195 (58.9%) were rear-end accidents and 104 (31.4%) were attributed to overtaking. In addition there were 17 (5.1%) accidents involving fixed objects. Rear-end and overtaking accidents can generally be attributed to congestion and result from driver behavior problems such as following too closely, unsafe lane changing, and driver inattention. Traffic congestion during peak periods may encourage drivers to follow too closely and accelerate and slow down frequently. In addition, non-standard horizontal and vertical sight distance and non-standard lane and shoulder widths on the bridge can contribute to these types of accidents. Fixed object accidents can generally be attributed to the absence of adequate shoulder widths on either side of the highway. A description of non-standard features on the BQE mainline is included in Section II.C.1.j.

Draft Environmental Impact Statement Section II.C
Kosciuszko Bridge Project II-64 March 2007
BQE WESTBOUND DIRECTION
Near the LIE (RM 278I-X5M3-4006) – There were three accidents at this location during the two-year study period, corresponding to an accident rate of 0.72 accidents/MVK (1.15 accidents/MVM). This is slightly above the statewide average accident rate. Two (66.7%) of the accidents were rear-end accidents. The remaining one (33.3%) was due to overtaking.
Before the entrance from the westbound LIE (RM 278I-X5M3-4005) – The five accidents at this location correspond to an accident rate of 1.19 accidents/MVK (1.92 accidents/MVM), which is 1.8 times the statewide average. Of the accidents at this location, three (60.0%) were overtaking accidents and two (40.0%) were rear-end accidents.
After the entrance from the westbound LIE (RM 278I-X5M3-4004) – There were 22 accidents at this location during the study period, with an accident rate of 2.19 accidents/MVK (3.52 accidents/MVM), which is 2.0 times the statewide average. Fourteen (63.6%) of the accidents were rear-end accidents; seven (31.8%) were overtaking accidents.
Near 56th Road (RM 278I-X5M3-4001) – This location experienced 12 accidents, with an accident rate of 1.19 accidents/MVK (1.92 accidents/MVM), which is just slightly higher than the statewide average. Eight (66.7%) of the accidents were rear-end accidents. The remaining four (33.3%) accidents were attributable to overtaking.
On the Kosciuszko Bridge (RM 278I-X5M3-4000) – This location had a total of 74 accidents during the two-year study period, with an accident rate of 7.37 accidents/MVK (11.86 accidents/ MVM), which is 6.6 times the statewide average. Of the 74 accidents, 44 (59.5%) were rear-end accidents and 28 (37.8%) were overtaking accidents.
Near Scott Avenue (RM 278I-X2M2-4127) – During the study period there were 12 accidents at this location with an accident rate of 1.19 accidents/MVK (1.92 accidents/MVM). This is slightly above the statewide average accident rate. Seven (58.3%) of the accidents were rear-end accidents and four (33.3%) were due to overtaking.
Near Varick Avenue (RM 278I-X5M3-4124) – This location experienced 14 accidents during the study period. This corresponds to an accident rate of 1.66 accidents/MVK (2.67 accidents/MVM), which is 1.5 times the statewide average. Of the accidents at this location, six (42.9%) were rear-end accidents and five (35.7%) were attributable to overtaking.
After exit to Meeker Avenue/Morgan Avenue (RM 278I-X5M3-4123) – During the study period there were 48 accidents at this location, with an accident rate of 5.70 accidents/MVK (9.17 accidents/MVM). This is 5.1 times the statewide average. Of the 48 accidents, 29 (60.4%) were rear-end accidents and nine (18.8%) were overtaking accidents.
Near Morgan Avenue (RM 278I-X5M3-4122) – This location experienced 15 accidents during the two-year period. This corresponds to an accident rate of 1.78 accidents/MVK

Draft Environmental Impact Statement Section II.C
Kosciuszko Bridge Project II-65 March 2007
(2.87 accidents/MVM), which is 1.6 times the statewide average. Ten (66.7%) of the accidents were rear-end accidents and three (20.0%) were attributable to overtaking.
Near Sutton Street (RM 278I-X5M3-4121) – There were 23 accidents at this location, with an accident rate of 2.73 accidents/MVK (4.39 accidents/MVM), which is 2.5 times the statewide average. Fourteen (60.9%) of the accidents were rear-end accidents and five (21.7%) were due to overtaking.
Near Meeker Avenue/McGuinness Boulevard entrance (RM 278I-X5M3-4118) – This location experienced 38 accidents, with an accident rate of 4.51 accidents/MVK (7.26 accidents/MVM), which is 4.1 times the statewide average. Of the 38 accidents at this location, 22 (57.9%) were rear-end accidents and 14 (36.8%) were due to overtaking.
Of the 309 accidents within the westbound BQE study area during the study period, 266 (86.1%) occurred at the above 11 locations. Similar to the numbers on the eastbound BQE, 151 (59.1%) were rear-end accidents, 79 (31.1%) were attributed to overtaking, and 13 (5.1%) were fixed object accidents. As noted above, rear-end and overtaking accidents can generally be attributed to congestion and resultant driver behavior problems. In addition, non-standard horizontal and vertical sight distance and non-standard lane and shoulder widths on the bridge can contribute to these types of accidents. Fixed object accidents can generally be attributed to the absence of adequate shoulder widths on either side of the highway.
RAMPS
Eastbound exit to Meeker Avenue and McGuinness Boulevard/Humboldt Street (RM 278I-X2MR-15A1) – This ramp experienced 30 accidents during the two-year study period. This corresponds to an accident rate of 2.45 accidents/MEV, which is 16.3 times the statewide average. Of the accidents at this location, 18 (60.0%) were rear-end accidents, eight (26.7%) were overtaking accidents, and three (10.0%) were fixed object accidents.
Eastbound entrance from Vandervoort Avenue (RM 278I-X2MR-15B1) – During the study period, this ramp experienced 31 accidents and had an accident rate of 2.10 accidents/MEV, which is 30 times the statewide average. Fifteen (48.4%) were due to overtaking and 14 (45.2%) were rear-end accidents. The remaining two accidents (3.2% each) were right-angle and fixed object accidents.
Eastbound exit to LIE service road (RM 278I-X2MR-01A1) – The 19 accidents on this ramp correspond to an accident rate of 0.50 accidents/MEV, which is 3.3 times the statewide average. Twelve of the accidents (63.2%) were overtaking accidents and seven (36.8%) were rear-end accidents.
Eastbound entrance from the LIE (RM 278I-X2MR-02H2) – The one rear-end accident at this location corresponds to an accident rate of 0.12 accidents/MEV, slightly above the statewide average.
Westbound entrance from the LIE (RM 278I-X5CR-02G2) – There were 19 accidents on this ramp, with an accident rate of 0.52 accidents/MEV, which is 4.7 times the statewide average. Ten (52.6%) of the accidents were rear-end type accidents and nine (47.4%) were overtaking accidents.

Draft Environmental Impact Statement Section II.C
Kosciuszko Bridge Project II-66 March 2007
Westbound exit to Meeker Avenue/Morgan Avenue (RM 278I-X2MR-15C1) – During the two-year study period, there were 13 accidents on this ramp, with an accident rate of 1.29 accidents/MEV. This is 8.6 times the statewide average. Six (46.2%) of the 13 accidents were rear-end accidents. The cause of the remaining seven (53.8%) was listed as “other.”
Westbound entrance from Meeker Avenue/McGuinness Boulevard (RM 278I-X2MR-15D1) – There were nine accidents on this ramp during the two-year study period, with an accident rate of 0.76 accidents/MEV. This is 10.9 times the statewide average. Five (55.6%) of the accidents were rear-end accidents, two (22.2%) were overtaking accidents, one (11.1%) was a fixed object accident, and one (11.1%) was listed as “other.” One accident at this location resulted in a fatality.
All of the ramps within the study area experienced accident rates that exceed the statewide average. Of the 122 accidents, 61 (50.0%) were rear-end accidents and 46 (37.7%) were attributed to overtaking. On ramps, rear-end and overtaking accidents can generally be attributed to congestion and driver behavior such as improper and unsafe lane changes, following too closely and unsafe speed.
MEEKER AVENUE INTERSECTIONS - EASTBOUND DIRECTION
Meeker Avenue at Humboldt Street (Node 22424) – There were 44 accidents at this intersection during the study period, with an accident rate of 1.71 accidents/MEV, which is 4.9 times the statewide average. Of these, 30 (68.2%) were overtaking accidents. The remaining accidents consisted of five (11.4%) rear-end, four (9.1%) right-angle, two parked vehicle accidents, and one (2.3%) each of left-turn, fixed-object and backing accidents.
Meeker Avenue at North Henry Street (Node 22425) – There were 16 accidents at this intersection with an accident rate of 1.35 accidents/MEV. This is 3.9 times the statewide average. Eight (50.0%) were overtaking accidents, five (31.3%) were rear-end accidents, and eight (50.0%) were overtaking accidents. The remaining three accidents included one (6.3%) each of right-angle, left-turn and pedestrian accidents.
Meeker Avenue at Monitor Street (Node 22426) – There were three accidents at this intersection, with an accident rate of 0.29 accidents/MEV, which is 4.1 times the statewide average. The accidents included two (66.7%) overtaking accidents and one (33.3%) parked vehicle accident.
Meeker Avenue at Kingsland Avenue (Node 22427) – There were 30 accidents at this intersection during the two-year study period, with an accident rate of 1.89 accidents/MEV. This is 5.4 times the statewide average. They involved 11 (36.7%) overtaking, seven (23.3%) rear-end, and four (13.3%) right angle accidents. There were two (6.7%) fixed-object and one (3.3%) each of backing, sideswipe, and parked vehicle accidents. In addition there were two pedestrian accidents and one bicycle accident.
Meeker Avenue at Morgan Avenue (Node 22428) – There were 51 accidents at this location, with an accident rate of 3.58 accidents/MEV, which is 10.2 times the statewide average. The accidents included 29 (56.9%) right-angle, 11 (21.6%) overtaking, and 10 (19.6%) rear-end, accidents. In addition, there was one pedestrian accident.

Draft Environmental Impact Statement Section II.C
Kosciuszko Bridge Project II-67 March 2007
Meeker Avenue at Vandervoort Avenue (Node 22429) – There were 58 accidents at this intersection, with an accident rate of 2.64 accidents/MEV, which is 7.5 times the statewide average. Of the 58 accidents, 20 (34.5%) were overtaking accidents, 19 (32.8%) were right-angle accidents and 11 (19.0%) were rear-end accidents, The remaining eight accidents included four (6.9%) sideswipe accidents, two (3.4%) left-turn accidents, and one (1.7%) each of right-turn and parked vehicle accidents.
Meeker Avenue at Varick Avenue (Node 22431) – There was one accident at this intersection, corresponding to an accident rate of 0.32 accidents/MEV, 1.2 times the statewide average. The accident involved a parked vehicle.
Of the total 204 accidents on the eight eastbound Meeker Avenue intersections during the study period, 203 (99.5%) occurred at the above seven intersections. The majority of accidents were overtaking (82 accidents, 40.4%), right-angle (57 accidents, 28.1%) and rear-end (38 accidents, 18.7%). These types of accidents at local street intersections are generally attributable to driver behaviors resulting from congestion, such as following too closely, excessive lane changing maneuvers to pass slower vehicles, and running through red traffic signals causing accidents with crossing traffic.
MEEKER AVENUE INTERSECTIONS - WESTBOUND DIRECTION
Meeker Avenue at Apollo Street (Node 21407) – During the study period, there were 40 accidents at this intersection, corresponding to an accident rate of 2.65 accidents/MEV, which is 7.6 times the statewide average. Nineteen (47.5%) of the accidents were overtaking accidents and seven (17.5%) were right angle accidents. The remaining accidents included three (7.5%) each left-turn, parked vehicle and backing accidents, two (5.0%) rear-end accidents, and one (2.5%) right-turn accident. Two (5.0%) of the 40 accidents involved pedestrians.
Meeker Avenue at Hausman Street (Node 21409) – There were four accidents at this location, with an accident rate of 0.45 accidents/MEV, which is 6.4 times the statewide average. Two accidents (50.0%) were backing accidents, one (25.0%) was an overtaking accident, and one (25.0%) accident involved a parked vehicle.
Meeker Avenue at Driggs Avenue (Node 21417) – There were two accidents at this intersection, corresponding to an accident rate of 0.23 accidents/MEV, which is 3.3 times the statewide average. Both were right-angle accidents.
Meeker Avenue at Morgan Avenue (Node 21412) – There were 44 accidents at this intersection during the study period. This corresponds to an accident rate of 3.88 accidents/MEV, which is 11.1 times the statewide average. The accidents included 21 (47.7%) right angle accidents, eight (18.2%) overtaking accidents, and seven (15.9%) rear-end accidents. The remaining accidents included three (6.8%) each of left-turn and fixed object accidents and one (2.3%) parked vehicle. There was one accident involving a bicycle.
Meeker Avenue at Sutton Street (Node 21415) – This intersection experienced a total of eight accidents during the study period and had an accident rate of 0.91 accidents/MEV, which is 5.7 times the statewide average. Of the eight accidents, three (37.5%) were rear-end accidents and two (25.0%) were overtaking accidents. The remaining three involved a pedestrian, a bicycle and a parked vehicle.

Draft Environmental Impact Statement Section II.C
Kosciuszko Bridge Project II-68 March 2007
Meeker Avenue at Kingsland Avenue (Node 21370) – During the two-year study period, there were 16 accidents at this location. This corresponds with an accident rate of 1.20 accidents/MEV, which is 3.4 times the statewide average. There were five (31.3%) each of rear-end and right-angle accidents; two (12.5%) each of overtaking and left-turn accidents; and one (6.3%) accident involving a parked vehicle. The remaining accident involved a pedestrian and resulted in a fatality.
Meeker Avenue at Monitor Street (Node 21375) – This intersection experienced a total of five accidents, with an accident rate of 0.57 accidents/MEV. This is 3.6 times the statewide average. Three (60.0%) of the accidents were rear-end accidents and two (40.0%) were overtaking accidents.
Meeker Avenue at North Henry Street (Node 21419) – There were nine accidents at this location during the study period, with an accident rate of 0.84 accidents/MEV, which is 2.4 times the statewide average. Four (44.4%) of the accidents were rear-end accidents, two (22.2%) were right-angle accidents, and the remaining three were one each of overtaking, fixed object and parked vehicle accidents.
Meeker Avenue at Russell Street (Node 21384) – There were eight accidents at this location corresponding to an accident rate of 0.81 accidents/MEV, which is 5.1 times the statewide average. Of the accidents at this location, four (50.0%) involved a parked vehicle and two (25.0%) involved pedestrians. The remaining two included an overtaking accident and a fixed-object accident.
In the westbound direction, there are 11 intersections within the study area. Of the 137 accidents during the study period, 136 (99.3%) occurred at the above nine intersections. The majority of these included 37 (27.2%) right-angle accidents, 36 (26.5%) overtaking accidents, and 24 (17.6%) rear-end accidents. In addition there were 12 (8.8%) accidents involving a parked vehicle. As noted above, rear-end, right angle, and overtaking accidents at intersections, as well as accidents involving parked vehicles, are generally caused by driver behavior resulting from congestion.
HIGH ACCIDENT LOCATIONS
The SASS monitors the 25,750 km (16,000 mi) state highway system. It merges accident, traffic and highway data to produce a list of High Accident Locations (HALs) on state highways. A HAL is defined by NYSDOT as a “segment having an actual accident rate that exceeds the statewide average accident rate for a similar type of facility to such an extent as to suggest that some other factor, other than pure chance, may be contributing to the accident experience.” The threshold for inclusion on the HAL list includes six accidents within the most recent two years measured on a 0.5 km (0.3 mi) segment of highway advancing in 0.16 km (0.1 mi) increments. In addition, the accident rate must exceed the statewide average for a similar type of facility at the 90 percent confidence level.
A Priority Investigation Location (PIL) identifies a segment of highway where the accident rate exceeds the statewide average rate to such an extent that some external factors may be contributing to the accident occurrences. PILs, which are a subset of the HALs, are flagged for detailed investigation by NYSDOT. For an urban highway section to be identified as a PIL it must experience 20 or more accidents within a two-year period, and the accident rate must exceed the statewide average for a similar type of facility at the 99.9 percent confidence level.

Draft Environmental Impact Statement Section II.C
Kosciuszko Bridge Project II-69 March 2007
The accident rate is based on highway sections that are a minimum of 0.5 km (0.3 mi) in length and advance in 0.16 km (0.1 mi) increments.
During the study period, the following eastbound segments of the BQE within the study area have been identified as PILs:
A 0.5 km (0.3 mi) segment between RM 278I-X2M2-3117 and RM 278I-X2M2-3119
A 1.1 km (0.7 mi) segment between RM 278I-X2M2-3120 and RM 278I-X2M2-3126
A 0.5 km (0.3 mi) segment between RM 278I-X5M3-3000 and RM 278I-X5M3-3002
A 0.8 km (0.5 mi) segment between RM 278I-X5M3-3002 and RM 278I-X5M3-3006
In the westbound direction, one segment of the BQE has been identified as a PIL:
A 0.8 km (0.5 mi) segment between RM 278I-X2M2-4127 and RM 278I-X2M2-4123
Safety Deficient Locations (SDLs) have the same threshold criteria as HALs, but they exclude locations meeting the PIL threshold. Within the study period, no SDLs were identified within the eastbound BQE study area. The following segments of the westbound BQE have been identified as SDLs:
A 0.3 km (0.2 mi) segment between RM 278I-X5M3-4006 and RM 278I-X5M3-4005
A 0.5 km (0.3 mi) segment between RM 278I-X5M3-4005 and RM 278I-X5M3-4003
A 0.2 km (0.1 mi) segment at RM 278I-X5M3-4000
A 0.5 km (0.3 mi) segment between RM 278I-X2M2-4122 and RM 278I-X2M2-4120
A 0.3 km (0.2 mi) segment between RM 278I-X2M2-4119 and RM 278I-X2M2-4118
Details of the accident analyses are located in Appendix B, and include tabulations for accidents reviewed; total mainline, ramp and local street accidents analyzed by travel direction, reference marker or reference node; and number and location of injuries and fatalities.
The details of each accident, including date and time of day, accident type, number and type of vehicles involved, severity, weather, lighting and pavement condition, contributing factors and a brief description of the accident were summarized and are assembled in Appendix B. These data were used to prepare collision diagrams for all reportable accidents occurring in the study area. The diagrams graphically depict essential accident patterns including accident type and location. The collision diagrams prepared for accidents occurring on the highway, ramps, and local streets also are found in Appendix B.
C.1.l. Pavement and Shoulder Conditions
Mainline and shoulder pavements between the west and east abutments (spans 1 through 103) consist of polymer concrete overlays on structure bridge decks. The existing deck type varies along the bridge. The Brooklyn Connector (spans 1 through 78) has a reinforced concrete deck slab. The Brooklyn and Queens Approaches as well as the Main Span consist of a 110 mm

Draft Environmental Impact Statement Section II.C
Kosciuszko Bridge Project II-70 March 2007
(4.5”) thick concrete filled steel grating. Spans 101 through 103 of the LIE Interchange are reinforced concrete deck slabs similar to that of the Brooklyn Connector.
The at-grade concrete base slabs of the Queens ramps and the BQE mainline beyond the east abutment have an asphalt concrete overlay and the Brooklyn ramps have a polymer overlay. The Meeker Avenue viaduct consists of a concrete deck slab with an integral wearing course.
Because of the deteriorating pavement conditions on the BQE, NYSDOT recently completed a resurfacing project, replacing the overlay on the full length of the project limits. This overlay provides a high quality riding surface and has eliminated the pot holes, cracks, and exposed rebar and steel grating that previously created safety concerns. However, until the deck is fully rehabilitated or replaced, water leakage at the joints will continue to accelerate deterioration of such overlay efforts.
C.1.m. Guide Railing, Median Barrier, Impact Attenuators
A combination of guide railing, median barrier, fascia barrier, and bridge rail exists within the project limits. See Figures II-32, “Median Barrier,” II-33, “Fascia Barrier,” II-34, “Bridge Rail,” and II-35, “Guide Rail," for photographs of existing conditions. The location of each treatment is described below:
A concrete median barrier is provided throughout the project limits. The median barrier separates the eastbound and westbound roadways for the entire length of the viaduct and is bolted to the reinforced concrete deck slab and concrete filled steel grid. Visual field observations have shown that the median barrier is generally in poor condition.
A half section concrete fascia barrier with a one rail aluminum railing on top is provided adjacent to the right lanes of the Brooklyn Connector and the Brooklyn ramps. Visual field observations have shown that the fascia barrier is generally in good condition.
A four rail bridge railing is provided adjacent to the right lanes on the Brooklyn and Queens Approaches and the Main Span. In areas, a metal snow shield is also attached to the bridge rail. Visual field observations have shown that the bridge rail is generally in good condition.
A corrugated beam guide rail is provided on both sides of the eastbound BQE to eastbound LIE ramp and on the eastbound LIE to westbound BQE ramp. Visual field observations have shown that the guide rail is in poor condition.
Impact attenuators are not provided at ramp connections or gore areas within the project limits.

Draft Environmental Impact Statement Section II.C
Kosciuszko Bridge Project II-71 March 2007
FIGURE II-32: MEDIAN BARRIER
FIGURE II-33: FASCIA BARRIER

Draft Environmental Impact Statement Section II.C
Kosciuszko Bridge Project II-72 March 2007
FIGURE II-34: BRIDGE RAIL
FIGURE II-35: GUIDE RAIL

Draft Environmental Impact Statement Section II.C
Kosciuszko Bridge Project II-73 March 2007
C.1.n. Traffic Control Devices
Traffic control devices on the BQE include pavement markings, directional signs, and regulatory signs which regulate, warn or guide expressway traffic. Within the project limits there are no unusual or sophisticated devices such as ramp entrance metering signals, reversible lanes, or Bus/HOV lanes. All ramps intersect with local streets at traffic signals and access to entrance ramps is clearly delineated.
The general condition of the overhead and bridge-mounted signs is satisfactory. The reflective surfacing is also satisfactory. The ground-mounted signs have minor damage, and some reference markers appear to be missing or are damaged.
Signalized intersections along Meeker Avenue have not yet been connected to the NYCDOT Vehicular Traffic Control System (VTCS), thus they continue to operate mechanically. Traffic signals have clear displays. Pavement markings, in general, are in good condition except the pedestrian crossings, which need to be restriped. Regulatory signs for speed and parking are provided along the roadway.
C.1.o. Structures
This section describes the existing structures that comprise the Kosciuszko Bridge and summarizes their condition based on recent inspections.
DESCRIPTION OF EXISTING STRUCTURES
The Kosciuszko Bridge (Bridge Identification Number [BIN] 1-07569-9) carries the BQE across Newtown Creek and is located between Morgan Avenue in Brooklyn and the LIE/BQE interchange in Queens. The bridge has 103 spans and is 1,689.7 m (5,543′-7″) long. The bridge is constructed of several different structure types along the length of the project, consisting of the Brooklyn Ramps, Brooklyn Connector, Brooklyn Approach, Main Span, Queens Approach, and LIE/BQE interchange. Details of the structures are described in Table II-32 and illustrated in Figures II-36 through II-38, “Existing Structure Plan and Elevation,” and Figures II-39 and II-40, “Existing Structure Sections.”

TABLE II-32: DETAILS OF EXISTING STRUCTURES
Location/BIN Spans Features Crossed Length Superstructure Type Substructure Type
Vandervoort Avenue Entrance Ramp (VA)
BIN 1-07569- B
25 Varick Avenue 173 m (567’-7”)
Reinforced concrete deck slab Concrete piers on spread footings with concrete closure walls with brick veneer (except at street crossings)
Meeker Avenue/ Morgan Avenue Exit Ramp (AS)
BIN 1-07569- A
25 Varick Street 173 m (567’-7”)
Reinforced concrete deck slab Concrete piers on spread footings with concrete closure walls with brick veneer (except at street crossings)
Brooklyn Connector
BIN 1-07569-9
1 through 78
Morgan Avenue Vandervoort Avenue Varick Avenue
534.7 m (1754’-3”)
Reinforced concrete deck slab (spans 1-7, 9-30, 32-70, 72-78)
Concrete rigid frame (spans 8 and 71)
Prestressed concrete box beam (spans 30 and 31)
Concrete piers on spread footings with concrete closure walls with brickveneer (except at street crossings)
Brooklyn Approach
BIN 1-07569-9
79 through 88
Stewart Avenue Gardner Avenue Scott Avenue
475.7 m (1560’-8”)
Steel Warren deck truss with concrete filled steel grating
Concrete piers on spread footings (bents 78 through 84)
Concrete piers on pile foundations (bents 85 through 87)
Main Span
BIN 1-07569-9
89 Newton Creek 91.4 m (300’-0”)
Steel Warren through truss with concrete filled steel grating
Steel pier on spread footing (bent 88)
Steel pier on pile foundation (bent 89)
Queens Approach
BIN 1-07569-9
90 through 100
LIRR 56th Road 54th Road
506.6 m (1662’-0”)
Steel Warren deck truss with concrete filled steel grating
Concrete piers on pile foundations (bents 90 through 93)
Concrete piers on spread footings (bents 94 through 100)
LIE/BQE Interchange
BIN 1-07569-9
101 through 103
54th Avenue 79.9 m (261’-11”)
Reinforced Concrete Deck Slab (span 101)
Composite Concrete Deck and Steel stringers (spans 102 & 103)
Concrete piers on spread footings
Draft Environm
ental Impact Statem
ent
Section II.C
Kosciuszko B
ridge Project II-74
March 2007

Draft Environmental Impact Statement Section II.C
Kosciuszko Bridge Project II-75 March 2007
The horizontal and vertical geometry of the existing structure includes several non-standard features that result in poor driving conditions. The width of the structure is insufficient to carry the required number of travel lanes or to provide adequate lane widths or shoulder widths. Also, steep grades exist on the Brooklyn and Queens approaches to the Main Span and there are several locations at which there is inadequate sight distance resulting in a high accident rate. Additional information relating to the existing bridge section and non-standard features are included in Sections II.C.1.e and II.C.1.j, respectively.
The Kosciuszko Bridge spans over Newtown Creek, several local streets, and three tracks of the LIRR. The vertical clearance under the bridge at each crossing is shown in Table II-33. Note the vertical clearance at Vandervoort Avenue, 54th Road, and 54th Avenue does not meet the 4.4 m (14'-5") minimum clearance established in the design criteria adopted for the project.
TABLE II-33: EXISTING VERTICAL CLEARANCE UNDER THE KOSCIUSZKO BRIDGE
Crossing Minimum Clearance
Morgan Avenue 4.7 m +/- (15'-4"+/-)
Vandervoort Avenue 4.3 m +/- (14'-2"+/-)
Varick Street 6.4 m +/- (21'-0"+/-)
Stewart Avenue 8.8 m +/- (29'-0"+/-)
Gardner Avenue 15.5 m +/- (51'-0"+/-)
Newtown Creek 38.0 m +/- (124'-6"+/-)
LIRR Tracks 22.6 m +/- (74'-0"+/-)
54th Road 4.1 m +/- (13'-4"+/-)
54th Avenue 4.3 m +/- (14'-0"+/-)
STRUCTURAL CONDITION
The bridge was originally completed in 1939 and underwent extensive rehabilitation between 1967 and 1972 and again between 1993 and 1995. The 1967 rehabilitation included the replacement of the deck slab with a concrete filled steel grating, the elimination of the sidewalks on the approaches and Main Span, roadway widening, and the repair of the concrete piers. Under the 1993–1996 Interim Bridge Rehabilitation Project the concrete piers were rehabilitated by removing and replacing the deteriorated surface concrete, and providing jacketing concrete around the entire column. Several truss members and the north face of the west abutment were also repaired under this contract. Numerous other repair projects have been completed over the last two decades and are described in more detail in Section II.B.2.
The information in this section, relating to the structure’s condition and vulnerability, is a summary of the findings presented in the 2002 Biennial Inspection Report, 1995 Diving Inspection Report, Steel Details Vulnerability Assessment by Iffland Kavanagh Waterbury (1996-1997), Concrete Details Vulnerability Assessment by Frederic R. Harris Inc. (1999-2000), Collision Vulnerability Assessment by Weidlinger Associates Inc. (1997), Structural Integrity Evaluation Report by Iffland Kavanagh Waterbury (1999), and the Addendum to the 1999 Structural Integrity Evaluation Report by Frederic R. Harris Inc. (2000).

Draft Environmental Impact Statement Section II.C
Kosciuszko Bridge Project II-76 March 2007
Despite these interim repairs the structural condition of the bridge is deteriorating. The 2002 Biennial Inspection Report indicates that several structural elements of the bridge exhibit severe deterioration and require repair or full replacement. The longitudinal joint under the median barrier between the eastbound and westbound roadways, as well as all of the transverse roadway joints have failed, allowing water leakage through the deck and to the structural members below. This water leakage has led to the severe deterioration of the deck along the entire length of the project. The superstructure of the Brooklyn Connector requires replacement due to potholes, cracks, and spalls with exposed rebar on the top side of the deck and extensive map cracking and water and rust stains on the underside of the deck. The deck on the approach trusses and Main Span, which is concrete filled steel grid flooring, is severely deteriorated. As described in Section II.C.1.l, without full rehabilitation or replacement overlays such as the one that was recently applied to the bridge will deteriorate in an accelerated manner, requiring frequent repair. Full replacement of the damaged and misaligned median barrier, all roadway joints, the deck slab, and all cross beams beneath the deck is required. This water leakage has also caused corrosion in many of the steel stringers and floorbeams requiring extensive repairs to several members. In addition, several of the concrete columns along the length of the project exhibit areas of hollow sounding concrete with cracks and spalls in the pier cap beams, which also require repair.
In order to comply with the state seismic design policy all expansion and fixed bearings need to be replaced with elastomeric type bearings. The foundations of the steel piers (piers 88 and 89), which support the Main Span, are exposed to water on three sides and are protected from ship and ice damage by timber fenders and dolphins. A diving inspection was performed in 1995 and the foundations were found to be in sound condition but the timber fenders and dolphins require replacement.
NYSDOT uses a flagging system to identify bridge deficiencies that require attention. Safety flags indicate a condition which presents a clear and present danger to vehicular or pedestrian traffic but no danger of structural failure. A yellow structural flag indicates a potentially hazardous condition or an incident of actual failure of a non-critical structural component where such failure may reduce the redundancy of the bridge but would not result in a structural collapse. The Meeker Avenue/Morgan Avenue exit ramp in Brooklyn has one active safety flag and the mainline has thirteen active safety flags and thirteen active yellow structural flags. The conditions at the bridge’s active safety flags include broken light fixtures and bridge rail connections, and areas of concrete delamination and hollow concrete in overhangs of the Brooklyn Connector. The majority of the bridge’s active yellow structural flags have been issued due to cracks in the crossbeams.
The Biennial Inspection Report provides a general recommendation, summarizing the structure’s overall condition (with 7 being new condition). The rating is calculated so that the condition of the most important members has a greater influence on the general recommendation than that of the less important members. Based on the 2002 Biennial Inspection Report the general recommendation for the structure is 4, which indicates that there is moderate deterioration of primary and secondary members and the substructure, and that considerable rehabilitation is required.
In addition to a condition rating, vulnerability ratings are assigned to the bridge. The vulnerability ratings indicate the likelihood and consequence of a structural failure and establish what corrective actions need to be taken and with what urgency these actions need to occur. Table II-34 shows the six categories in which vulnerability assessments are performed and their respective ratings for the Kosciuszko Bridge. Items recommended for the Safety Program

Draft Environmental Impact Statement Section II.C
Kosciuszko Bridge Project II-77 March 2007
(vulnerability rating 2) are in need of evaluation and appropriate action within one to two years. Items receiving this rating (in addition to those receiving the more severe Safety Priority rating) also require the completion of a Structural Integrity Evaluation. Recommendations for Capital Action Program (vulnerability rating 3) indicate that action is warranted.
TABLE II-34: VULNERABILITY RATINGS
Category Vulnerability Rating Recommended Program
Hydraulics Not Available —
Overload 3 (Capital Action Program)
Steel Details 2 (Safety Program)
Collision 2 (Safety Program)
Concrete Details 3 (Capital Action Program)
Seismic Not Available —
Both the concrete details and overload vulnerability ratings are 3, which indicates that the structure is vulnerable to failure from extreme loads or from events that are possible but not likely to occur. This type of vulnerability can be tolerated until a normal capital action program is implemented. The Concrete Details Vulnerability Assessment (1999-2000) recommends immediate repair to the superstructure of spans 8, 31 and 75 and also calls for the repair of the hollow sounding concrete areas in the concrete piers. Improving the low operating rating would remediate the structure’s vulnerability with respect to overload. The as-inspected load rating for the superstructure was performed by Iffland Kavanagh Waterbury in 1990. The controlling inventory rating of the existing structure is MS18 (HS 20). This rating indicates that a three axle truck weighing a maximum of 36 tons can safely utilize the existing structure for an indefinite period of time. There is no posted loading on the bridge.
Both the steel details and the collision vulnerability ratings are 2, which indicates that the structure is vulnerable to failure from loads that may occur and action should be taken to reduce the structure’s vulnerability. The Collision Vulnerability Assessment Report (1997) recommends that the vertical clearance be increased under the bridge at 54th Road and 54th Avenue (spans 100 and 103). The recommendations from the Steel Details Vulnerability Report (1997) include the retrofit of the welded connections between the crossbeams and the steel deck, between the crossbeams and the stringers on the Brooklyn and Queens Approaches and Main Span, and between the truss members connected by rivets on both the Brooklyn and Queens Approaches.
C.1.p. Hydraulics of Bridges and Culverts
The location of the piers and the height of the Main Span above Newtown Creek provide sufficient clear area for Newtown Creek to flow beneath the bridge without affecting the hydraulics of the creek. The relationship between the bridge, Newtown Creek and flood elevations established for the area are summarized below:
The 100-year flood elevation is 2.5 meters (8 feet) above mean sea level measured in National Geodetic Vertical Datum (NGVD);

Draft Environmental Impact Statement Section II.C
Kosciuszko Bridge Project II-78 March 2007
The depth of Newtown Creek at the bridge crossing varies from 1.2 m (4′-0″) to 8.5 m (28′-0″) NGVD. The width of the creek (shoreline to shoreline) varies from 84.9 m (279′-0″) to 89.3 m (293′-0″) on the west and east sides of the bridge, respectively;
A lateral opening of 76.2 m (250′-0″) is provided (pier foundation to pier foundation) through which the creek flows; and
The elevation of the travelway above the creek is 42.1 m (138′-1″) at the center of the creek and 41.5 m (136′-2″) at the piers. The bottom of the truss is 39.4 m (129’-3″) at the center of the creek and 37.9 m (124′-6″) at the piers.
Similarly, the creek does not appear to be affecting the foundation system of the bridge. Based on diving inspections performed in 1995, there were no visible signs of scour that would affect the pile or foundation integrity. The pier foundation on the Brooklyn side of the creek is a spread footing extending approximately 16.5 m (54′-0″) below grade or 6.1 m (20′-0″) below the lowest elevation of the creek bed. The pier on the Queens side of the creek is supported by a pile foundation. The piles extend approximately 27.7 m (91′-0″) below grade or 17.4 m (57′-0″) below the lowest elevation of the creek bed. Both piers are configured so that one face and two sides of each foundation are exposed to the creek, the remaining face is land bound.
C.1.q. Drainage Systems
The drainage for the structure consists of three separate systems that collect storm water run-off from the deck and discharge it to New York City Department of Environmental Protection (NYCDEP) storm sewers or Newtown Creek. These systems and the amount of storm water run-off (calculated by multiplying the deck area by a coefficient of run-off of 0.9 and a storm intensity of 168 mm [6.6”] of rainfall/hour) from each drainage system are described below:
The drainage for the Brooklyn Connector between Morgan Avenue and Porter Avenue (spans 1 – 52) consists of roadway scuppers, drain pipes and collection pipes that connect underground to a NYCDEP storm sewer located beneath Meeker Avenue. The total estimated storm run-off from this deck area is 0.83 m3/s (29.3 cubic feet per second [cfs]);
The drainage between the LIE and 54th Road (spans 100 –103), the at-grade ramp areas, and Laurel Hill Boulevard consists of scuppers, catch basins, drain pipes, and collection pipes that connect underground to NYCDEP storm sewers located beneath Laurel Hill Boulevard and 43rd Street. The total estimated storm run-off from these areas is 2.32 m3/s (82.0 cfs); and
The deck drainage for the Brooklyn Approach, Main Span and Queens Approach (spans 79 – 100) originally consisted of roadway scuppers, drain gutters beneath expansion joints and drain pipes located in the center of the concrete piers which connected to an underground pipe system that discharged to Newtown Creek. During the 1967 reconstruction project, the gutters under expansion joints and drain pipe systems for the Brooklyn Approach, Main Span and Queens Approach were demolished and the downspouts in the center of the columns were abandoned. As a result deck storm water run-off is collected in scuppers and downspouts and free-falls off the bridge onto local streets below, flowing overland to the creek. The total estimated storm run-off from this deck area and a portion of the Brooklyn Connector between Porter Avenue and Stewart Avenue is 1.19 m3/s (42.0 cfs).

Draft Environmental Impact Statement Section II.C
Kosciuszko Bridge Project II-79 March 2007
C.1.r. Soil and Foundation Conditions
The general geology of eastern Brooklyn and western Queens, including the study area is Pleistocene soil deposits associated with glacial and post-glacial geologic events. There is evidence that the Wisconsin glacier advancing in a southerly direction deposited, as a plow pushes, soil materials (moraine) in a berm known as the terminal moraine. The soil materials are mixtures of sand, gravel, silt, clay, cobbles and boulders. As the glacier receded the meltwater deposited stratified granular soils that exist at shallow locations along the alignment. Subsequent glaciation overrode and consolidated the stratified deposits and first moraine and also deposited soil material known as glacial till in depressions between the moraine deposits. These deposits are dense to very dense heterogeneous soil mixtures with cobbles and boulders.
Based on the findings of geotechnical studies and boring information prepared for the project, groundwater is located within 0.61 m (2′-0″) of the MHW elevation at Newtown Creek. See Section II.C.1.o for existing foundation information. See Section III.C.2.i for further information regarding the soil properties and its potential impact on the design and construction of the alternatives.
C.1.s. Utilities
The utilities carried on the viaduct include electrical supply for street lighting, a police emergency telephone system, and communications and power for a variable message system (VMS). The VMS is controlled by the Joint Traffic Operation Center made up of NYSDOT, NYCDOT and the New York City Police Department (NYPD) with operations managed in Long Island City. This VMS is part of an overall system, which serves the western Queens sub-region including the BQE, LIE, Grand Central Parkway, and the Van Wyck Expressway.
Utilities serving the adjacent developed properties are located within the right-of-way of at-grade streets that parallel and/or cross beneath the bridge. Based on a review of record drawings those utilities include:
City-owned storm sewers, sanitary sewers and water mains under the jurisdiction of NYCDEP Bureau of Water Supply and Waste Water Collection;
Gas and both underground and overhead electric distribution systems under the jurisdiction of KeySpan and Consolidated Edison;
Both underground and overhead telephone/communication systems under the jurisdiction of Verizon;
Underground cable facilities under the jurisdiction of Cablevision; and
The Buckeye fuel pipeline.
Figures showing the location of existing utilities are included in Appendix D.
C.1.t. Railroads
The Montauk Branch of LIRR passes under the bridge on the Queens side of Newtown Creek and terminates at the Long Island City Yard. Three tracks, which carry both passenger and

Draft Environmental Impact Statement Section II.C
Kosciuszko Bridge Project II-80 March 2007
freight trains, cross under the bridge. LIRR communication cables run overhead, parallel to the tracks.
New York & Atlantic Railway operates freight trains on these tracks Monday through Saturday from Long Island City to the Fresh Pond Yard. Typically service consists of two locomotives and ten to fifteen freight cars at approximately 6:00 a.m. and again at approximately 12:00 p.m. LIRR operates passenger trains on these tracks Monday through Friday, serving Long Island City and Jamaica. The typical service consists of one locomotive and four or five passenger cars. Between ten and twelve passenger trains travel on these three tracks each weekday.
The existing minimum vertical clearance under the bridge at the railroad is approximately 22.6 m (74'-0") and the minimum horizontal clearance between the centerline of track and the closest bridge column is approximately 6.1 m (20'-0").
C.1.u. Visual Environment
This section discusses the existing visual environment of the project area including the existing visual resources of the area, established districts, key viewpoints, and user groups within the project area. A more comprehensive discussion of the visual environment and visual impacts is provided in Appendix J, Visual Resource Assessment (VRA).
PROJECT AREA
The project area for this analysis encompasses the areas adjacent to the bridge that are viewed by motorists, residents, and workers from adjacent streets, residences, and industrial areas and while traveling over the bridge. These views include the approach and Main Span trusses, structural columns and closure walls. Visual districts within the project area were also established. These areas include the Kosciuszko Bridge and other areas adjacent to the bridge where changes in land use, topography and development levels are distinguishable by motorists traveling across the bridge. The limits of the visual resources study area and established districts are illustrated in Figure II-41, “Visual Districts”. These districts include:
Bridge District – includes the Kosciuszko Bridge itself, an elevated structure that extends from Morgan Avenue in Brooklyn to the LIE/BQE interchange in Queens. Throughout the 1.1-mile corridor that encompasses this district the bridge consists of the Brooklyn Connector (concrete viaduct), the Brooklyn Approach (deck truss), the Main Span (through truss) over Newtown Creek, and the Queens Approach (deck truss). Throughout the corridor, the bridge varies from six to eight lanes in width. Access ramps are provided to/from Vandervoort Avenue in Brooklyn and to/from the LIE in Queens.
Residential/Commercial District of Greenpoint and East Williamsburg – includes the communities of Greenpoint and East Williamsburg, which border the western limit of the project area. They consist of established, densely populated residential communities with supporting commercial businesses.
Newtown Creek Industrial Area District – includes areas located in both the Boroughs of Brooklyn and Queens that are adjacent to or near the shorelines of Newtown Creek. It is essentially a flat area with varied land uses, but predominately supports manufacturing, industrial, warehouse, storage yards, freight forwarding and some evidence of commercial and residential uses. Above ground storage tanks and railroad tracks are also notable features within this district.

Draft Environmental Impact Statement Section II.C
Kosciuszko Bridge Project II-81 March 2007
Newtown Creek Waterway District - includes Newtown Creek as it separates the Boroughs of Brooklyn and Queens and passes beneath the Main Span of the Kosciuszko Bridge.
Old Calvary Cemetery District – includes a large, open parcel of land that slopes slightly toward the BQE and is located in the northwest quadrant of the project area. This land consists entirely of the cemetery’s grassy areas with trees and monuments and narrow asphalt access roads.
VISUAL CHARACTER OF THE PROJECT AREA
The visual character of the project area consists of an urban setting which includes: the Kosciuszko Bridge; the grassy hillside of Old Calvary Cemetery; varying size rooftops of rectilinear buildings within the manufacturing/industrial area; Newtown Creek; flat vacant land along the shoreline of Newtown Creek; and a mixed-use residential/commercial neighborhood. Motorists using the BQE would have unobstructed views of changes between districts and distant views of the Brooklyn, Manhattan and Queens Skylines. Aerial photographs depicting the bridge in relation to existing facilities are provided in Figures II-42 through II-47:
FIGURE II-42: AERIAL VIEW OF THE BROOKLYN APPROACH LOOKING SOUTHWEST
FIGURE II-43: AERIAL VIEW OF THE BROOKLYN APPROACH AND WESTBOUND EXIT RAMP
FIGURE II-44: AERIAL VIEW OF THE BROOKLYN CONNECTOR (CONCRETE VIADUCT AND CLOSURE WALL) AT VARICK AVENUE
FIGURE II-45: AERIAL VIEW OF THE MAIN SPAN ABOVE NEWTOWN CREEK LOOKING EAST

Draft Environmental Impact Statement Section II.C
Kosciuszko Bridge Project II-82 March 2007
FIGURE II-46: AERIAL VIEW OF QUEENS APPROACH LOOKING NORTHEAST
FIGURE II-47: AERIAL VIEW OF QUEENS APPROACH LOOKING EAST
Visual Quality of Project Area
The project area is a densely populated urban environment with diverse uses. Reflecting the industrial history of the area, the dominant uses include: single story manufacturing and industrial buildings; open truck and storage yards and parking areas; and vacant land adjacent to Newtown Creek. To the west and north, the older residential neighborhoods of Greenpoint and East Williamsburg in Brooklyn are very dense with small, attached buildings and only a few community parks. The uniformity of building type and architecture within these residential areas provides some visual appeal.
The open green space within Old Calvary Cemetery and Sergeant William Dougherty Playground provides limited relief for viewers from the surrounding hardscape, very limited streetscape amenities (e.g., trees, planting areas, pavers, benches) are typically not present within the project area. The area beneath the bridge is inaccessible to the public as it used for private and leased storage of automotive related uses. In Brooklyn, a visually unattractive waste transfer station exists beneath and adjacent to the bridge. Newtown Creek separates and provides some visual relief from the industrial areas of Brooklyn and Queens.
KEY VIEWPOINTS
Twelve key viewpoints within the five districts were selected as representative of views from the bridge, project area, and visual districts:
Viewpoint 1 – View from the westbound Queens approach looking toward the Kosciuszko Bridge Main Span (Bridge District)
Viewpoint 2 – View from the westbound Queens approach looking toward the Manhattan and Brooklyn skylines (Bridge District)
Viewpoint 3 – View from the eastbound Brooklyn approach looking toward the Kosciuszko Bridge Main Span (Bridge District)
Viewpoint 4 – View from the eastbound Brooklyn approach looking toward the south in Brooklyn (Bridge Visual District)

Draft Environmental Impact Statement Section II.C
Kosciuszko Bridge Project II-83 March 2007
Viewpoint 5 – View from Old Calvary Cemetery (Queens) looking southeast at the Queens approach and Kosciuszko Bridge Main Span (Old Calvary Cemetery District)
Viewpoint 6 – View from Laurel Hill Boulevard (Queens) looking south towards the Queens Approach and Kosciuszko Bridge Main Span (Old Calvary Cemetery District)
Viewpoint 7 – View from 56th Road and 43rd Street (Queens) of the Kosciuszko bridge Main Span (Residential/Commercial District)
Viewpoint 8 – View from the Newtown Creek waterway looking northwest at the Brooklyn approach and Kosciuszko Bridge Main Span (Newtown Creek Waterway District)
Viewpoint 9 – View from the intersection of Anthony Street and Vandervoort Avenue in (East Williamsburg) looking north at the Brooklyn Connector (Newtown Creek Industrial Area District)
Viewpoint 10 – View from the westbound exit ramp looking southwest along Meeker Avenue toward Apollo Street (Residential/Commercial District)
Viewpoint 11 – View from the intersection of Meeker Avenue and Morgan Avenue looking northeast along the Brooklyn Connector (Residential/Commercial District)
Viewpoint 12 – View from the intersection of Hausman Street and Meeker Avenue looking east along the Brooklyn Connector (Residential/Commercial District).
The twelve viewpoints were considered to be the most representative within the project area due to their accessibility and likelihood of impact to the most number of viewer groups. The locations of these viewpoints are shown in Figure II-48, “Key Viewpoints.” It is noted that the twelve viewpoints are only representative of many viewpoints within the viewshed of the project area, particularly the Kosciuszko Bridge and Old Calvary Cemetery. In addition, views from the two large visual districts, Old Calvary Cemetery and Newtown Creek, have views of the Kosciuszko Bridge that would vary greatly with proximity and angle. Visual effects would change as a viewer group moved closer to or further away from the bridge.

Draft Environmental Impact Statement Section II.C
Kosciuszko Bridge Project II-84 March 2007
Viewpoint 1 – View from the westbound Queens Approach toward the Main Span (Bridge District)
The first viewpoint selected is from a motorist’s perspective while traveling westbound on the Queens Approach toward the Main Span. This view was selected because of the high number of motorists whose views of the travelway and bridge will be affected with the bridge widening, elevation changes and removal of the Main Span through truss (shown in Figure II-49, “Viewpoint 1”).
Viewpoint 2 – View from the westbound Queens Approach looking toward the Brooklyn and Manhattan skylines (Bridge District)
The second viewpoint selected is from the westbound Queens Approach (near the Main Span) looking toward the Manhattan skyline. It is from the perspective of a motorist, within the Bridge Visual District. This view would be lowered for motorists under Alternatives BR-2, BR-3 and BR-5 (shown in Figure II-50, “Viewpoint 2”).
This view would become visible to a new user group of pedestrians and bicyclists.
FIGURE II-49: VIEWPOINT 1
FIGURE II-50: VIEWPOINT 2

Draft Environmental Impact Statement Section II.C
Kosciuszko Bridge Project II-85 March 2007
Viewpoint 3 – View from the eastbound Brooklyn Approach toward the Main Span (Bridge District)
The third viewpoint selected is from the perspective of a motorist traveling eastbound on the Brooklyn Approach toward the Main Span. This view includes details of the Main Span through truss, lighting and bridge rail treatments, as well as the relationship of the eastbound and westbound travelways. Motorists’ views of the travelway and bridge would be affected by the bridge widening, elevation changes and removal of the Main Span through truss (shown in Figure II-51, “Viewpoint 3").
Viewpoint 4 – View from the eastbound Brooklyn Approach looking south (Bridge District)
The fourth viewpoint selected is from the eastbound Brooklyn Approach (near the Main Span) looking in the southwest direction toward Brooklyn. While this perspective is not readily available to motorists, pedestrians or bicyclists, it illustrates a perspective that would be visible under the Build Alternative RA-5 (shown in Figure II-52, “Viewpoint 4”). Under RA-5, the bikeway/walkway would be constructed adjacent to the eastbound (eastern) side of the Main Span.
FIGURE II-51: VIEWPOINT 3
FIGURE II-52: VIEWPOINT 4

Draft Environmental Impact Statement Section II.C
Kosciuszko Bridge Project II-86 March 2007
Viewpoint 5 – View from Old Calvary Cemetery (Queens) looking southeast at the Queens Approach and Main Span (Old Calvary Cemetery District)
The fifth viewpoint, from Old Calvary Cemetery, is a westbound elevation (side) view of the Queens Approach and Main Span. The viewer observes a panoramic view of the bridge including profile. The views would be affected by profile changes, through truss and deck truss removal, and column locations (shown in Figure II-53, “Viewpoint 5”).
FIGURE II-53: VIEWPOINT 5
Viewpoint 6 – View from Laurel Hill Boulevard (Queens) looking south towards the Queens Approach and Main Span (Old Calvary Cemetery District)
The sixth viewpoint selected is from Laurel Hill Boulevard directly adjacent to the Queens Approach. A viewer from Old Calvary Cemetery or motorist traveling on Laurel Hill Boulevard would have close views of the existing concrete columns, deck truss, and at-grade streets and a distant view of the Main Span through truss. This view will be affected by the horizontal and vertical alignment of the alternatives, the relationship between the new bridge and Laurel Hill Boulevard, structure type, column locations, surface treatments, and landscape amenities
provided (shown in Figure II-54, “Viewpoint 6”).
FIGURE II-54: VIEWPOINT 6

Draft Environmental Impact Statement Section II.C
Kosciuszko Bridge Project II-87 March 2007
Viewpoint 7 – View from 56th Road and 43rd Street (Queens) of the Main Span (Newtown Creek Industrial Area District)
The seventh viewpoint selected is a southwest elevation view of the Main Span through truss, approaches, existing concrete columns and steel piers, from a motorist, pedestrian, and worker perspective from the Newtown Creek Industrial Area District. This view will be affected by the horizontal and vertical alignment of the alternatives, the structure type, column locations, and design treatments incorporated in the Build Alternatives (shown in Figure II-55, “Viewpoint 7”).
Viewpoint 8 – View from the Newtown Creek waterway looking northwest at the Brooklyn and Queens Approaches and Main Span (Newtown Creek Waterway District)
The eighth viewpoint selected is a distant view of the approach deck truss, Main Span through truss and steel piers from a boater’s perspective from the Newtown Creek Waterway District. The view would be affected by structure type, profile, and column spacing (shown in Figure II-56, “Viewpoint 8”).
FIGURE II-55: VIEWPOINT 7
FIGURE II-56: VIEWPOINT 8

Draft Environmental Impact Statement Section II.C
Kosciuszko Bridge Project II-88 March 2007
Viewpoint 9 – View from the Intersection of Meeker Avenue and Vandervoort Avenue (in East Williamsburg) looking North at the Brooklyn Connector (Residential/Commercial District of Greenpoint and East Williamsburg)
The ninth viewpoint selected is a north view of the Brooklyn Connector at Vandervoort Avenue from a motorist, pedestrian, and park user perspective within the Residential/Commercial District of Greenpoint and East Williamsburg. The roadway is also seen in elevation beyond the sycamore shade trees of Sergeant William Dougherty Playground as the road continues east. The effects of the design alternatives on Vandervoort Avenue and the playground and the widening of the Brooklyn Connector will be more visible from this viewpoint than the others
selected for analysis (shown in Figure II-57, “Viewpoint 9”).
Viewpoint 10 – View from the Meeker Avenue/Morgan Avenue exit ramp looking southwest along Meeker Avenue toward Apollo Street (Residential/Commercial District of Greenpoint and East Williamsburg)
The tenth viewpoint selected is of the closure walls along the Brooklyn Connector, at Van Dam and Apollo Streets, at-grade streets and adjacent residences from a resident, pedestrian or motorist perspective from the Residential/Commercial District of Greenpoint and East Williamsburg. Residents have the longest duration of view and are therefore most sensitive to the view due to visibility and the time it takes to travel through this viewpoint. The view would be affected by the structure type, closure wall treatment, abutment and parapet
FIGURE II-57: VIEWPOINT 9
FIGURE II-58: VIEWPOINT 10

Draft Environmental Impact Statement Section II.C
Kosciuszko Bridge Project II-89 March 2007
treatment, at-grade intersection re-alignments, streetscape amenities, and the creation of additional landscape buffer areas adjacent to the residences (shown in Figure II-58, “Viewpoint 10”).
Viewpoint 11 – View from the intersection of Meeker Avenue and Morgan Avenue looking northeast along the Brooklyn Connector (Residential/Commercial District of Greenpoint and East Williamsburg)
The eleventh viewpoint selected is of the closure walls along the Brooklyn Connector at Morgan Avenue, at-grade streets, and adjacent businesses from the perspective of a motorist, pedestrian and resident within the Residential/Commercial District of Greenpoint and East Williamsburg. This view would be affected by the structure type, closure wall treatment, abutment, and parapet treatment, widening of the Brooklyn Connector over Meeker Avenue, and streetscape amenities (shown in Figure II-59, “Viewpoint
11”).
Viewpoint 12 – View from the intersection of Hausman Street and Meeker Avenue Looking East along the Brooklyn Connector (Residential/Commercial District of Greenpoint and East Williamsburg)
The twelfth viewpoint selected is of the Brooklyn Connector adjacent to the residences looking east on Meeker Avenue from Hausman Street. It is from the perspective of a motorist, pedestrian and resident within the Residential/Commercial District of Greenpoint and East Williamsburg. This view would be affected by the structure type, closure wall treatment, abutment and parapet treatment, widening of the Brooklyn Connector toward the residences, and
streetscape amenities (shown in Figure II-60, “Viewpoint 12”).
FIGURE II-59: VIEWPOINT 11
FIGURE II-60: VIEWPOINT 12

Draft Environmental Impact Statement Section II.C
Kosciuszko Bridge Project II-90 March 2007
C.1.v. Provisions for Pedestrians and Bicyclists
Provisions for pedestrians and bicyclists within the project area are limited to at-grade streets and sidewalks within the industrial areas of Brooklyn and Queens on both sides of Newtown Creek and the Brooklyn residential neighborhoods of Greenpoint and East Williamsburg. Based on review of the New York City Bicycle Map, 56th Road and Review Avenue are the only designated routes in the vicinity of the bridge and are recommended as areas where sufficient street width for bicyclists is available and where vehicular traffic is light.
Pedestrian and bicycle access across the bridge is not provided, and therefore persons crossing Newtown Creek must use the Greenpoint Avenue Bridge located approximately 1.2 km (0.75 mi) northwest of the Kosciuszko Bridge or the Grand Avenue Bridge located approximately 2.1 km (1.3 mi) southeast of the Kosciuszko Bridge.
In Brooklyn, Meeker Avenue, Thomas Street, Cherry Street and Anthony Street provide at-grade pedestrian access via sidewalks parallel to the bridge. Access beneath the bridge is provided at Kingsland Avenue, Morgan Avenue, Vandervoort Avenue, Varick Avenue, Stewart Avenue, Gardner Avenue and Scott Avenue. Sidewalk pedestrian ramps are only found at the Meeker Avenue/Varick Avenue intersection and the Meeker Avenue/Stewart Avenue intersection. However, due to poor sidewalk conditions and/or lack of sidewalks at certain locations, handicapped accessibility is very limited parallel to and underneath the bridge.
In Queens, 43rd Street and Laurel Hill Boulevard provide at-grade pedestrian access via sidewalks parallel to the bridge between the LIE and 56th Road. Access beneath the bridge is provided at 56th Road, 54th Road and 54th Avenue. Access from the residential community of Woodside to the industrial area is provided from 43rd Street, which passes beneath the LIE to a pedestrian bridge connection between 43rd Street and Laurel Hill Boulevard. Sidewalk pedestrian ramps are provided at the following intersections: 43rd Street/56th Road, 43rd Street/54th Road, 43rd Street/54th Avenue and Laurel Hill Boulevard/54th Avenue. However, due to poor sidewalk condition and/or the lack of sidewalks at certain locations, handicapped accessibility is very limited parallel to and underneath the bridge. Underneath the bridge, handicapped accessibility can be found at 54th Avenue and 56th Road.
Pedestrian access to Newtown Creek is limited. Streets in Brooklyn terminate west of the creek and in Queens, access across the at-grade LIRR tracks is limited to 43rd Street, in Queens. There is no handicapped accessibility to Newtown Creek in either Brooklyn or Queens.
C.1.w. Planned Development for Area
Planned and proposed residential, retail, and commercial development projects in Brooklyn and Queens were identified that could potentially affect traffic within the Kosciuszko Bridge Project study area. Each project is shown in Figure II-61, “Planned Developments,” and Table II-35, which also includes the expected year of completion and estimated traffic generation for the project, where available.

Draft Environmental Impact Statement Section II.C
Kosciuszko Bridge Project II-91 March 2007
TABLE II-35: PLANNED DEVELOPMENT IN PROJECT AREA
Project Name Completion
Year Design Year Peak Hour Trips Generated
(Peak Hour)
Brooklyn
DSNY Truck-to-Rail Waste Transfer Facilities n.a. 2025 No net increase
Greenpoint/Williamsburg Waterfront Rezoning 2005 2013 953 (5 p.m. – 6 p.m.)
Kent Avenue/Franklin Street Reconstruction 2006 n.a. n.a.
Flushing Avenue Reconstruction 2007 n.a. n.a.
Newtown Creek Water Pollution Control Plant 2013 n.a. n.a.
Grand Street Bridge Replacement 2013 n.a. n.a.
Queens
DSNY Truck-to-Rail/Barge Waste Transfer Facility n.a. 2025 No net increase
Cross Harbor Freight Movement Project – Maspeth Intermodal Yard Site n.a. 2025 174 (4:30 p.m. – 5:30 p.m.)
Phelps Dodge Site Redevelopment n.a. n.a. n.a.
Grand Avenue Bus Depot 2006 n.a. 540 (2:30 p.m. – 3:30 p.m.)
Queens West n.a. n.a. n.a.
Hunters Point Subdistrict Rezoning 2004 2014 45 (p.m. Peak Hour1)
MTA Revenue Handling Facility n.a. n.a. n.a.
MTA East Side Access Project 2012 2020 0
Sunnyside Yard Pedestrian Bridge n.a. n.a. 0
Area-Wide
NYCDOT Truck Route Study n.a. n.a. 0 Notes: The Phelps Dodge Site Redevelopment and the Cross Harbor Intermodal Site are mutually exclusive.
Estimates for peak hour trip generation are for the “design year” of each project. 1 Specific time period for p.m. peak hour not provided in project documentation.
BROOKLYN
NEW YORK CITY DEPARTMENT OF SANITATION’S SOLID WASTE MANAGEMENT PLAN
As part of their Solid Waste Management Plan (SWMP), the New York City Department of Sanitation (DSNY) proposes to enter into long term (20 year) contracts with either one or two private waste companies in Brooklyn and one private transfer station in Queens. All three sites are located within the Kosciuszko Bridge Project Traffic Study Area.
The Comprehensive Solid Waste Management Plan, published in September 2006, identified Allied Waste Services, located at 72 Scott Avenue/598 Scholes Street and Waste Management, located at 215 Varick Avenue, as potential truck-to-rail transfer facilities. The plan proposes that one or both of the facilities would be utilized. The facility (or facilities) would accept DSNY-

Draft Environmental Impact Statement Section II.C
Kosciuszko Bridge Project II-92 March 2007
managed waste as well as some commercial waste. The waste would be transported to the facility via DSNY and private collection vehicles, processed, and loaded into containers. Containerized waste would leave the site on railcar via LIRR.
Each of the proposed facilities is currently operating as a private transfer station. The Allied Waste System site would require an expansion of its current permitted capacities. However, any proposed expansion would require a corresponding reduction in capacity at other facilities within the same service district.
The Draft Comprehensive Solid Waste Management Plan, published in October 2004, proposed the use of the Waste Management transfer facility located at 485 Scott Avenue, immediately adjacent to and partially underneath the Kosciuszko, as a truck-to-barge transfer facility. However, based on negotiations with Waste Management, this facility is no longer under consideration for that use. It is, however, expected to continue to operate as a private transfer facility.
GREENPOINT/WILLIAMSBURG WATERFRONT REZONING
In 2005, the New York City Planning Commission rezoned a 184-block area that is currently zoned primarily for manufacturing and industrial uses to allow for a mix of residential and light industrial uses. The city has proposed residential densities as high as R-8 (max floor area ratio [FAR] 6.02). NYCDCP’s analysis projects that the reasonable worst case development scenario would result in the creation of approximately 8,257 dwelling units, and approximately 31,323 m2 (337,160 ft2) of retail/commercial space.
According to NYCDCP’s DEIS, by 2013, the projected development would generate a net of 734 vehicle trips in the AM peak hour (8 a.m. – 9 a.m.), 362 vehicle trips in the midday (12 p.m. – 1 p.m.), and 953 vehicle trips in the PM peak hour (5 p.m. – 6 p.m.).
KENT AVENUE/FRANKLIN STREET RECONSTRUCTION
The New York City Department of Design and Construction (DDC) is responsible for the design and reconstruction of the Franklin Street/Kent Avenue corridor through Greenpoint and Williamsburg, Brooklyn. The project is approximately 5 km (3 mi) in length from the BQE to Commercial Street at the north end of Franklin Street. The roadway is a 12.2 m (40 ft) wide designated local truck route and carries one northbound and one southbound lane of traffic. Parking is generally permitted on both sides of the street. According to the Greenpoint-Williamsburg Rezoning Final Environmental Impact Statement, Franklin Street carries two-way traffic volumes of approximately 610 vehicles per hour in the a.m. peak hour, 640 vehicles per hour in the midday peak hour, and 790 vehicles per hour in the p.m. peak hour, south of Greenpoint Avenue. The project is expected to be completed by the fall of 2006. Once completed, this reconstruction project is expected to have no effect on traffic volumes or patterns.
FLUSHING AVENUE RECONSTRUCTION
DDC is reconstructing Flushing Avenue from Navy Street to Cypress Avenue. The capital construction project involves installation or reconstruction of the following: distribution water mains, hydrants, combined sewer, sanitary sewer, storm sewer, trunk water main, catch basins, curbs, sidewalks, pedestrian ramps, roadway pavement, traffic lights, street lighting, trees, and landscaping/urban design. Temporary vehicular access restrictions are expected to occur.

Draft Environmental Impact Statement Section II.C
Kosciuszko Bridge Project II-93 March 2007
Construction is to be staged in order to minimize disruptions in the area. The project is expected to be completed by the winter of 2007. Once completed, this reconstruction project is expected to have no effect on traffic volumes or patterns.
NEWTOWN CREEK WATER POLLUTION CONTROL PLANT
NYCDEP is currently involved in the major expansion and upgrade of an existing 36-acre water pollution control plant to a 53-acre site. Work began in August of 2003 to expand the plant’s capacity in order to comply with mandated federal Clean Water Act requirements. When completed in approximately 2013, this reconstruction project is expected to have no effect on traffic volumes or patterns.
GRAND STREET BRIDGE REPLACEMENT
NYCDOT plans to replace the Grand Street Bridge, which carries Grand Street in Brooklyn over Newtown Creek into Queens, where it becomes Grand Avenue. The existing bridge is extremely narrow, preventing two large vehicles from crossing the bridge in opposite directions at the same time. The replacement project is currently in preliminary design with an anticipated build year of 2013. The replacement bridge will include two standard-width lanes, improving operations in the immediate area. However, this improvement is expected have no significant effect on traffic volumes or patterns in the study area.
QUEENS
NEW YORK CITY DEPARTMENT OF SANITATION SOLID WASTE MANAGEMENT PLAN
As described above for Brooklyn, DSNY’s SWMP proposes to enter into long term (20 year) contracts with either one or two private waste companies in Brooklyn and one private transfer station in Queens. All three sites are located within the Kosciuszko Bridge Project Traffic Study Area.
As described in the SWMP, the Waste Management facility located at 30-58 Review Avenue in Queens would operate as either a truck-to-truck-to-rail or truck-to-barge transfer station, exporting containerized waste. A truck-to-barge facility would function similarly to the truck-to-rail transfer facilities described above. The truck-to-truck-to-rail transfer station would require the use of the Maspeth intermodal rail yard, one and a half miles away where the containers would be loaded onto railcars.
The proposed facility is currently operating as a private transfer station. The Waste Management site would require an expansion of its current permitted capacities. However, any proposed expansion would require a corresponding reduction in capacity at other facilities within the same service district. In the case of the Queens Waste Management site, as described in the plan, offsets must be achieved in Brooklyn Community District 1 or Queens Community District 12.
CROSS HARBOR FREIGHT MOVEMENT PROJECT – MASPETH INTERMODAL YARD SITE
The New York City Economic Development Corporation proposes to build a new rail-truck intermodal facility along Newtown Creek in Queens, utilizing the former Phelps Dodge site and several adjacent properties immediately to the east of the Kosciuszko Bridge as part of their plan to construct a new rail tunnel under New York Harbor connecting Jersey City and Brooklyn.

Draft Environmental Impact Statement Section II.C
Kosciuszko Bridge Project II-94 March 2007
If a single-track rail tunnel is built, the yard will encompass 108 acres. If a double-track tunnel is built, the yard will occupy 160 acres and also include an estimated 186,000 m2 (2 million ft2) container storage building. Either concept of the yard would be located immediately adjacent to the bridge to the east and it is possible that the design of new bridge structures could be affected.
The single tunnel alternative is projected to generate 54 trips (48 trucks) during the a.m. peak hour and 66 trips (54 trucks) during the p.m. peak hour. The double tunnel alternative is projected to generate 146 trips (130 trucks) in the a.m. peak and 174 trips (144 trucks) in the p.m. peak. The project proposes a number of mitigation measures, such as re-striping lanes, elimination of parking lanes and signal timing modifications. The DEIS for this project was published in April 2004.
PHELPS DODGE SITE REDEVELOPMENT
Following a multi-year cleanup effort led by NYSDEC, the former Phelps Dodge site (see Section IV.B.3.i for additional details) is planned for redevelopment by Sagres Partners. Sagres Partners is currently developing the site for manufacturing, distribution, warehousing and retail uses. Construction of a 7,000 m2 (75,000 ft2) warehouse is complete and other parcels are currently under development. The remaining undeveloped parcels, if developed to the maximum density allowed under the area’s M3-1 zoning, could house up to 160,000 m2 (1.7 million ft2) of additional building space. Construction of the Cross Harbor Freight Movement Project intermodal yard would acquire all property on this site. Because it is assumed that the intermodal yard would generate more trips than this redevelopment project, that project’s trip generation potential was used in the traffic forecasting.
GRAND AVENUE BUS DEPOT
The Metropolitan Transportation Authority’s NYCT is constructing a 51,000 m2 (550,000 ft2) bus maintenance facility at the corner of Grand Avenue and 49th Street. The facility, scheduled to be completed by January 2007, will be a multi-story complex operating 24 hours a day, 365 days a year. The depot will store approximately 200 standard 12.2 m (40 ft) buses, with 175 buses used on a daily basis to service 10 existing bus routes. Five of the bus routes serve the study area while the remaining routes travel through the study area to access the facility.
Buses will enter the depot on 49th Street and exit onto Grand Avenue. The entrance and exit for employee parking will be on 47th Street. The facility will house approximately 1,200 employees working various shifts, with a maximum of 743 at any one time. Parking for 160 vehicles will be provided on the roof with additional parking provided in vacant bus bays. Buses and employees traveling to and from the site have the potential to affect traffic on Grand Avenue and other study area streets. According to The Metropolitan Transportation Authority’s (MTA) 2002 Environmental Report for the project, the depot would generate a total of 242 inbound and 38 outbound vehicle trips (cars and buses) in the a.m. peak hour (6:45-7:45 a.m.), and 249 inbound and 291 outbound vehicle trips in the p.m. peak hour (2:30-3:30 p.m.).
QUEENS WEST
Queens West Development Corporation, a subsidiary of New York State’s Empire State Development Corporation, is currently developing a mixed use community along the waterfront in Hunters Point, Queens. The total development would include 550,000 m2 (5.9 million ft2) of residential, 220,000 m2 (2.4 million ft2) of commercial, 24,600 m2 (265,000 ft2) of retail, and

Draft Environmental Impact Statement Section II.C
Kosciuszko Bridge Project II-95 March 2007
4,800 parking spaces. In 2004, Queens West Development Corporation received waterfront permits from the Army Corps of Engineers and NYSDEC to repair waterfront bulkheads, remove derelict structures, and build public piers and walkways. Traffic generation forecasts were not available for this project.
HUNTERS POINT SUBDISTRICT REZONING
NYCDCP rezoned 43 blocks in the Hunters Point area of Long Island City. The rezoning maintains much of the existing mixed uses (residential and light manufacturing). NYCDCP projects the creation of approximately 300 new residential units over a ten-year period. Zoning changes would allow a wide range of commercial uses, including stores, restaurants, printers, and artist studios.
The Environmental Assessment Statement (EAS) projects that the additional development will result in the generation of 38 a.m. peak hour vehicle trips, 23 midday peak hour vehicle trips, and 45 p.m. peak hour vehicle trips. Most pedestrian trips in the area are conducted by subway. The EAS does not include a detailed traffic analysis (such as expected distributions), because it does not meet the New York City Environmental Quality Review Act (CEQR) threshold of 50 peak hour vehicle trips generated.
MTA REVENUE HANDLING FACILITY
MTA is planning a new 10,000 m2 (110,000 ft2) revenue handling facility with 24-hour operations in Maspeth, Queens. Traffic generation forecasts were not available for this project.
MTA EAST SIDE ACCESS PROJECT
The East Side Access (ESA) project will connect LIRR’s Main and Port Washington lines in Queens to a new LIRR terminal beneath Grand Central Terminal in Manhattan. A new tunnel will be constructed under Amtrak’s Sunnyside Yard connecting the eastern end of the 63rd Street Tunnel under the East River with LIRR’s Main Line and Port Washington tracks and their connections at the Harold Interlocking. In order to access the 63rd Street Tunnel a construction access shaft near Northern Boulevard as well as a large cut-and-cover excavation in the northern part of Sunnyside Yard is required. A new station at Queens Boulevard along LIRR’s mainline (into Penn Station) will also be constructed. Construction of the Queens tunnel and the connections to the Harold Interlocking is scheduled to be completed by 2012. When operational, this project is expected to have no effect on traffic within the project’s traffic study area.
SUNNYSIDE YARD PEDESTRIAN BRIDGE
The MTA is currently acquiring funds for a feasibility study that will evaluate the construction of a new pedestrian connection between the Queensboro Plaza station, the Queens Plaza station and the new LIRR Sunnyside Yard station that will be built as part of the ESA project. Once complete, this project is expected to have no impact on traffic operations in the study area.

Draft Environmental Impact Statement Section II.C
Kosciuszko Bridge Project II-96 March 2007
AREA-WIDE
NYCDOT TRUCK ROUTE STUDY
NYCDOT is undertaking a study of the existing truck route network within the five boroughs. The goal of this initiative is to coordinate engineering, education, information, and enforcement efforts so that trucks remain on designated truck routes until reaching their destination, and so that they do not inappropriately utilize residential streets. Improvements resulting from this study could include better signage, improved truck route enforcement, enhanced outreach to the trucking industry, as well as better management of the truck route network.
C.1.x. System Elements and Conditions
The BQE is a vital link in the interstate system and the New York City arterial network. The BQE is also an integral part of the regional transportation plan for maintaining mobility in the area.
With the LIE at the eastern terminus and the Williamsburg Bridge at the western terminus, this section of the BQE is one of the most heavily traveled and congested sections in the BQE system. The recurrent congestion that is present during peak periods in both travel directions is the most pressing problem in this section of the BQE. This condition is indicative of expressway conditions in the area and throughout the region.
Since the BQE is the only north-south mixed-traffic, limited-access interstate traversing Brooklyn and Queens, it is anticipated that the expressway would not serve as a construction detour to other projects. It is also anticipated that the construction of this project would not require the detour of traffic to alternate routes. Any construction on the Kosciuszko Bridge would be coordinated with other projects planned for the area and the BQE, including the "triple cantilever" section in Brooklyn Heights and the Gowanus Expressway.
C.1.y. Environmental Integration
In 1998, NYSDOT implemented an Environmental Initiative to foster a new ethic in the department. NYSDOT has moved from a policy of simple regulatory compliance to one where NYSDOT is now using its engineering and construction capabilities to become an important part of the state's efforts to enhance its environment. As a result of the initiative, NYSDOT now incorporates major contributions to the improvement of New York's environment as a part of its normal work, often with little or no additional dollar cost.
NYSDOT Engineering Instruction (EI) 99-026 states that it shall be the practice of the Department of Transportation to:
Plan, design, construct and maintain facilities that meet transportation needs while proactively protecting, conserving, restoring and enhancing important natural and man-made resources.
Seek opportunities to cooperatively advance Federal, State and local environmental policies, programs and objectives as part of the department’s work through close and systematic coordination with the public and concerned agencies and groups.

Draft Environmental Impact Statement Section II.C
Kosciuszko Bridge Project II-97 March 2007
Demonstrate leadership by piloting the development and implementation of improved methods for environmental protection and enhancement.
Employ safe and appropriate Context Sensitive Design measures to ensure that project designs reflect community values as understood through proactive outreach with local stakeholders.
Physical improvements completed under the Environmental Initiative generally fall into one of two categories:
1. Dedicated Environmental Benefit Projects – These projects are typically constructed within NYSDOT right-of-way and are related to the department’s mission. Projects of this type may include measures to improve water quality and wetlands, protect wildlife habitat, enhance transportation corridors, or promote eco-tourism. These projects are incorporated into NYSDOT capital projects and are completed entirely at NYSDOT’s expense.
2. Environmental Betterments – These projects are typically completed in joint development with either another public agency or with a private organization. Under this program, environmental projects that are funded by local agencies or groups can be incorporated into NYSDOT projects. These environmental enhancements can benefit from the economies of scale realized by large public works projects as well as utilize some of the design or construction-management experience of the department.
The Kosciuszko Bridge Project has a number of opportunities for both types of environmental enhancements described above.
Each Build Alternative includes the construction of new parks, improvements to existing parks, and streetscaping improvements in both Brooklyn and Queens. For details of these proposed improvements, see Sections III.C.2.m and IV.B.3.f.
C.2. Needs
This section evaluates and correlates the features, conditions and deficiencies from Section II.C.1 to identify and describe the need for the project and the objectives that guided development of the project alternatives.
C.2.a. Project Level Needs
The Kosciuszko Bridge carries over 160,000 vehicles each day, far more than for which it was designed. This has resulted in a number of safety and operational design deficiencies and, over time, has caused a number of structural problems.
SAFETY
Central in the mission of NYSDOT is to provide a safe transportation system for its users. As described in Section II.C.1, the design of the existing highway within the project limits results in an elevated accident rate – as much as six and a half times the statewide average for similar facilities during the period analyzed. In all, 20 locations on the BQE, every ramp analyzed, and 16 out of 19 Meeker Avenue intersections analyzed experienced accident rates higher than the statewide average. Accidents involving injuries accounted for 29 percent of all accidents on the

Draft Environmental Impact Statement Section II.C
Kosciuszko Bridge Project II-98 March 2007
BQE and its ramp connections in the study area. There also were two fatalities during the two-year study period – one on the BQE and one on Meeker Avenue. The following sections describe the features of the existing highway and the safety problems they cause.
INSUFFICIENT SHOULDERS
Throughout the project limits, the shoulders on the BQE and ramps are insufficient to provide safe refuge for disabled vehicles. While the standard is 3.0 m (10 ft), the right shoulder of the BQE ranges from 1.52 m (5’-0”) on the Brooklyn and Queens Approaches to as little as 152 mm (6”) on the Main Span. Throughout the project limits, the left shoulder is 0.3 m (1’-0”), instead of the standard 1.2 m (4 ft). Similar conditions apply on the ramps, where shoulders are generally 0.61 m (2’-0”) or less. With frequent accidents on the bridge (see Section II.C.1.k), disabled vehicles are forced to remain in travel lanes, which impedes traffic flow and endangers the occupants of the disabled vehicle and other vehicles on the BQE.
NARROW LANES
The travel lanes on the Main Span of the Kosciuszko Bridge narrow from standard 3.6 m (12 ft) wide lanes on the approaches to 3.3 m (10’-10”). The reduced lane widths, combined with non-standard shoulders and sight distances are the main contributing factors for the frequency of accidents at this location. Of the accidents reported at this location over a two-year period for the eastbound and westbound directions, 93 percent were attributed to rear-end and overtaking collisions. These two types of accidents are good indicators of non standard conditions where traffic is either being forced to slow down or make last-second lane changes.
INSUFFICIENT ACCELERATION/DECELERATION LANES
While not a critical design element, insufficient acceleration/deceleration lanes increase the likelihood of accidents as vehicles are forced to merge into or out of traffic traveling at a significantly different speed. The existing acceleration lanes at the Vandervoort Avenue entrance ramp (38 m± [124′-8"]) and the westbound BQE entrance ramp from the LIE (27 m [88′-7"]) are 15 and 11 percent, respectively, of the recommended 255 m (838’-7”). Likewise the existing deceleration lane at the Meeker Avenue/Morgan Avenue exit ramp (20 m± [65′-7"]) is 15 percent of the recommended 135 m (443’-11”).
Due to physical constraints, it is unlikely that standard acceleration/deceleration lanes can be provided. However, such drastically insufficient acceleration/deceleration lanes have a clear effect on accidents. The Vandervoort Avenue entrance ramp has an accident rate 30 times the statewide average for similar entrance ramps. The westbound entrance ramp from the LIE and exit ramp to Meeker Avenue have accident rates of five and nine times the state average for similar ramps, respectively.
NON-STANDARD STOPPING SIGHT DISTANCE
Sight distance is the length of the roadway ahead that is visible to a driver. Stopping sight distance combines this distance with the design speed of the roadway to determine how far in advance a driver must see an obstruction (e.g. a disabled vehicle in his or her path) in order to stop before hitting it. Two types of stopping sight distance exist: horizontal and vertical. Because of the curving nature of the BQE in this area and the lack of shoulders (which provide a broader field of vision), much of the project limits have insufficient horizontal stopping sight distance. Additionally, the bridge has an insufficient vertical stopping sight distance at the Main

Draft Environmental Impact Statement Section II.C
Kosciuszko Bridge Project II-99 March 2007
Span of the bridge, which, as described above (“Narrow Lanes” section), contributes to the high accident rate at this location. Combined with frequent obstructions in the form of accidents and inconsistent traffic flow caused by congestion, this insufficient stopping sight distance can lead to additional accidents on the highway.
STRUCTURAL
Built in 1939, the Kosciuszko Bridge is over 65 years old and has been subjected to significantly higher traffic volumes than it was designed to carry. When it was built the Kosciuszko Bridge connected Meeker Avenue in Brooklyn, a 4-lane arterial, to Laurel Hill Boulevard, also a 4-lane arterial. With the construction of the BQE a decade later, the Kosciuszko Bridge became an integral part of the interstate highway system and today carries over 160,000 vehicles across Newtown Creek each day.
This change in use over the last half century has taken its toll on the structure. Despite a series of interim repairs over the last fifteen years (see Section II.B.2), the structural condition of the Kosciuszko Bridge is deteriorating. The most recent inspection report indicates that several structural elements of the bridge exhibit severe deterioration and require repair or full replacement. The failure of the longitudinal joint under the median barrier and all the transverse joints has allowed water to leak through the deck causing its deterioration and corrosion of many of the steel members below. Finally, several of the concrete columns supporting the bridge show signs of deterioration in the form of hollow sounding concrete and cracks and spalls in the pier cap beams. The 2002 Biennial Inspection Report evaluated the structure and concluded that there is moderate deterioration of primary and secondary members and the substructure, and that considerable rehabilitation is required.
A separate evaluation considered the vulnerability of the structure to failure and the consequences of that failure. Both the steel details and collision vulnerability assessments found that the structure is vulnerable to failure from loads or events that could occur and that action should be taken to reduce these vulnerabilities. Specifically, welded connections between the crossbeams and the steel deck and between the crossbeams and the stringers on the approach spans and the Main Span were found to be vulnerable. Fatigue evaluation of the truss members connected by rivets on the approach spans shows that retrofit may be required to prevent fatigue cracking, but there has been no evidence of fatigue cracking of the truss members to date. Additionally, the vertical clearance under the bridge at 54th Road (4.1 m [13'-4"]) and 54th Avenue (4.3 m [14'-0"]) in Queens is insufficient for large trucks.
The structural condition of the Main Span and Approach Spans is such that complete replacement of the deck, crossbeams and stringers is required in order to rehabilitate the structure. The structural condition of the Brooklyn Connector requires complete replacement of the superstructure. Due to the nature of the monolithic reinforced concrete structure of the Brooklyn Connector, replacement of the substructure will be required to replace the superstructure. Additional details on the existing structure are provided in Section II.C.1.o.
OPERATIONAL
The expressway and local street network in the Kosciuszko Bridge Project study area currently operate with appreciable delay during peak hours. Most locations on the mainline BQE operate at LOS D or worse during both peak hours, with LOS E or F prevailing at seven locations during the a.m. peak hour and six locations during the p.m. peak hour. Six BQE ramps also operate at

Draft Environmental Impact Statement Section II.C
Kosciuszko Bridge Project II-100 March 2007
LOS E or F during both the a.m. and p.m. peak hours. In addition, many turning movements and approaches along Meeker Avenue currently operate at unacceptable levels of service.
By 2015, operating conditions are expected to deteriorate with more locations operating at unacceptable levels of service. Delays and travel time would increase as demand for the already congested highway facilities grows. Further deterioration in level of service and travel time is expected by 2045. Additional highway and ramp elements would operate at LOS E or F and existing areas of poor operation would worsen. Additional details on existing level of service are provided in Section II.C.1.i.
At a system level, VHD along the BQE/Meeker Avenue network would deteriorate from existing levels. Based on the VISSIM simulation performed for the project, the existing a.m. peak hour VHD (193 VHD for all directions combined) would deteriorate to 403.7 and 705.2 VHD by 2015 and 2045, respectively. Similarly, deterioration from the existing p.m. peak hour condition of 565.8 VHD to 725.0 and 816.3 VHD is expected by 2015 and 2045, respectively.
The poor operating conditions on the bridge result from both capacity and geometric deficiencies. Many of the factors discussed above related to safety concerns also contribute to operational problems: insufficient shoulders and acceleration/ deceleration lanes, narrow lanes, and non-standard stopping sight distance, all contribute to slow speeds and congestion. In addition, with medium and heavy trucks representing as much as 18 percent of vehicles entering the BQE during peak hours within the project limits, the grade of the existing roadway, over 4% in some areas, compounds these operational problems. Large trucks entering the highway have difficulties accelerating on such grades and, combined with the insufficient acceleration lanes, are unable to smoothly merge with highway traffic, forcing all traffic to slow.
To improve operating conditions, significant operational improvements, including additional capacity, would be required.
ENVIRONMENTAL/COMMUNITY
In 1998, NYSDOT implemented an Environmental Initiative to foster a new ethic in the department. NYSDOT has moved from a policy of simple regulatory compliance to one where the department is now using its engineering and construction capabilities to become an important part of the state's efforts to enhance its environment. As a result of the initiative, NYSDOT now incorporates major contributions to the improvement of New York's environment as a part of its normal work, often with little or no additional dollar cost.
The Greenpoint community in Brooklyn and the West Maspeth community in Queens both provide opportunities for enhancements to be incorporated into each of the Build Alternatives under consideration. Both areas are underserved by passive and active recreation facilities and are lacking in visual quality and streetscaping amenities. Additionally, with the removal of the pedestrian walkway from the existing bridge in 1967, non-motorized connections across Newtown Creek are limited. That reconstruction effort also disconnected the drainpipes on most of the bridge from the underground sewer line that carried the stormwater to Newtown Creek; today the drainpipes release the water onto the ground where it flows across the ground to the creek.

Draft Environmental Impact Statement Section II.C
Kosciuszko Bridge Project II-101 March 2007
C.2.b. Area or Corridor Level Needs
MODAL INTERRELATIONSHIP
The BQE is part of an interstate highway system that serves, complements, and augments other transportation modes in the region including air travel, waterborne travel and shipping, truck freight movement, and mass transit.
As the roadway access route in western Brooklyn and Queens to the Grand Central Parkway and Van Wyck Expressway, the BQE also serves a large number of the 65 million passengers per year that fly in or out of LaGuardia and John F. Kennedy Airports. In Brooklyn, the BQE also provides access to the new Brooklyn Cruise Terminal in Red Hook. Opened in April 2006, the new terminal, expected to receive about 40 ships with expectations for significant increases in future years, represents a new, vital transportation mode in the region as well as providing significant economic activity.
The predominant mode of freight movement in the project area as well as New York City is by truck. The BQE is one of the few primary north-south highways in Brooklyn and Queens that also permits trucks, connecting the Verrazano Bridge and southern Brooklyn to the LIE and the Triborough Bridge. This makes the BQE a critical link between port facilities in New Jersey, southern and northern Brooklyn, Queens, and Long Island (via the LIE). Regionally, it provides a critical link to Connecticut, New England, and to parts south of New York City.
The vehicle classification data depicts how vital this route is with trucks representing 14 percent of all vehicles traveling over the Kosciuszko Bridge in the a.m. peak hour and 11 percent of vehicles on the bridge in the p.m. peak hour. In addition to facilitating freight movement passing through the area, it also provides access to the commercial and industrial businesses in the immediate area that are a destination for a portion of this truck traffic.
New York City is making efforts to reduce the demand for freight movement by truck. In 2002, the New York City Economic Development Corporation began a study considering the construction of a rail freight tunnel across New York Harbor with a major intermodal yard to be built in Maspeth adjacent to the Kosciuszko Bridge. While that study concluded that a significant number of truck traffic could be removed from the region’s roadways, due to the intermodal yard’s location near the Kosciuszko Bridge it would not reduce, and would likely increase, the demand for freight movement on this segment of the BQE.
The BQE is also utilized by the local community in the project area for daily work commutes as well as discretionary trips. While the Greenpoint/Williamsburg community is served by two NYCT subway lines, the “L” and “G” lines, the 1995 Kosciuszko Bridge Traffic Operations Study found that no expansion of the existing subway system could alleviate the need for improvements to the Kosciuszko Bridge due to different user needs and other factors.
The bridge also serves as a bus route for the B24, operated by NYCT. This route provides service between Williamsburg and Greenpoint in Brooklyn, and Sunnyside in Queens. Through its route the B24 connects to the “J,” “M,” “Z,” “L,” “G,” and “7” subway lines. The B24 travels along Meeker Avenue between Kingsland and Vandervoort Avenues and over the Kosciuszko Bridge, subject to the severe congestion and delays described in Section II.C.1.g. Despite the subway and bus services available in Brooklyn, the 1993 Kosciuszko Bridge origin-destination survey revealed that more than 60% percent of the Kosciuszko Bridge mainline motorists could not make their trips by using public transportation. For the remaining 40% percent of the trips,

Draft Environmental Impact Statement Section II.C
Kosciuszko Bridge Project II-102 March 2007
the motorists did not use public transportation because of less privacy and comfort, lack of park and ride facilities, and the need for transfers.
SYSTEM NEEDS
The Kosciuszko Bridge is a vital link in the region’s transportation system. It provides access to major employment sites and complements the regional roadway network, including the LIE and Gowanus Expressway. The high level of use combined with capacity deficiencies and nonstandard and nonconforming features (e.g., steep grades, lack of shoulders, and short acceleration/deceleration lanes) make the Kosciuszko Bridge and its approaches currently unable to accommodate traffic volumes at an acceptable level of service during the peak periods. This segment of the BQE, therefore, represents a deficient link within the larger urban expressway system.
As demand for travel in the metropolitan region, including the project corridor, continues to grow, adequate capacity and geometrics need to be provided to accommodate future demands and avoid further deterioration of traffic operations. As such, this project is responding to existing and future needs and would promote a more dependable highway linkage within the region’s transportation system.
MOBILITY NEEDS
Mobility represents the ease of traveling between two points (e.g., residence and workplace) and will be negatively affected by congestion and traffic delays. It is anticipated that traffic volumes in the project area will increase significantly in the future. Without proper mitigation, congestion and delays will continue to increase, hindering the movement of people and goods within the Kosciuszko Bridge corridor. Each of the Build Alternatives analyzed in this document are anticipated to at least maintain its role as a vital link in the region.
No Transportation System Management (TSM) and Transportation Demand Management (TDM) plans have been prepared in the Kosciuszko Bridge corridor. However, two ongoing projects would implement Intelligent Transportation System (ITS) improvements along the BQE, including the western Queens ITS and the Brooklyn Advanced Traffic Management System (ATMS) projects. These ITS projects are expected to provide marginal capacity improvements from existing roadways and reduce traffic delays and congestion. However, while economical and prudent, these improvements are only marginal and will not address the corridor’s long term needs.
SOCIAL DEMANDS AND ECONOMIC DEVELOPMENT
As described in Section II.C.1.w, a number of public and private projects are planned for the area. These include the rezoning of the Greenpoint/Williamsburg waterfront area, the Cross Harbor Freight Movement Project’s proposed intermodal yard, a NYCT bus depot, and the potential for up to two truck-to-barge/rail waste transfer stations. Each of these projects will add traffic to the local streets and the BQE, contributing to the general trend of growth in traffic volumes. As described in Section II.C.1.h, traffic volumes on the BQE are expected to rise with or without any improvements to the Kosciuszko Bridge. As the region’s economy and population continue to grow, the demand for the efficient movement of goods and people will also increase. By 2045, the project’s design year, peak hour volumes on the BQE are expected

Draft Environmental Impact Statement Section II.C
Kosciuszko Bridge Project II-103 March 2007
to increase 14 to 22 percent over 2002 levels. Without improvements to the Kosciuszko Bridge, the existing operational and safety problems described above will continue to grow.
C.2.c. Transportation Plans
STATEWIDE/REGIONAL PLANS
As the federally-designated metropolitan planning organization (MPO) for the region, NYMTC has responsibility for regional transportation planning activities. Two primary documents drive this planning process: the Regional Transportation Plan (RTP) and the Transportation Improvement Program (TIP).
The RTP is a long-range plan for transportation improvements in the region. The current RTP has a planning horizon of 25 years (2005-2030). In addition to identifying a handful of projects expected to re-shape the regional transportation system (e.g., a new passenger rail tunnel from New Jersey to Manhattan, construction of the Second Avenue Subway, etc.) the plan presents a number of guiding principles for planning throughout the region. While the Kosciuszko Bridge Project is not specifically noted in the RTP, the project’s goals and objectives, described in Section II.D, are in harmony with many of these guiding principles, including:
Improving the reliability and convenience of the transportation system;
Improving safety;
Encouraging local involvement in project planning;
Enhancing quality of life by providing environmentally-responsible movement of people, goods, and vehicles;
Employing best practices in the planning, design, deployment, and operation of transportation services and facilities; and
Assuring that the transportation system can accommodate existing and anticipated demand for movement of people and goods.
The TIP documents the region’s transportation improvements that are eligible for federal funding. As required by the federal government, the TIP is a comprehensive, medium-range program adopted by NYMTC that prioritizes these transportation improvements over the course of five years; the current TIP includes federal fiscal years 2006 to 2010. NYMTC must demonstrate that implementation of the projects listed in the TIP collectively conform to the air quality milestones and budgets required under the Clean Air Act. Before federal funds can be spent on a project, it must be listed on an approved TIP. The 2006-2010 TIP includes final design and right-of-way acquisition for the reconstruction of the Kosciuszko Bridge from McGuinness Boulevard in Brooklyn to 59th Avenue in Queens. Prior to construction of any Build Alternatives, this listing must be revised.
CONGESTION MANAGEMENT PROCESS
The region served by NYMTC, consisting of New York City, Long Island, and Lower Hudson Valley, is a federally-designated Transportation Management Area (TMA). As a TMA, NYMTC is required by federal regulations (23 CFR 500.109) to develop and implement a regional

Draft Environmental Impact Statement Section II.C
Kosciuszko Bridge Project II-104 March 2007
Congestion Management Process (CMP) as an integral part of its ongoing regional planning process. As defined by the Federal Highway Administration (FHWA), roadway congestion is “the level at which transportation system performance is no longer acceptable due to traffic interference.” As a result, the CMP serves as a systematic planning process for measuring, reporting and managing roadway congestion on a region-wide basis.
In the NYMTC report titled Congestion Management Process 2005 Status Report, the segment of the BQE carried by the Kosciuszko Bridge is classified as an “Extremely Congested Highway” link. As such, one of the goals of the project is to “improve mobility, safety and access, and reduce congestion within the study area” for all modes of transportation (see Section II.D), which is consistent with the goals and components of a CMP.
The following congestion management strategies are being implemented as part of this project:
Highway Strategies (Geometric Design Improvements);
Bicycle and Pedestrian Strategies (New Sidewalks and Bicycle Lanes); and
Access Management Strategies (Collector-Distributor Roads).
HIGHWAY STRATEGIES (GEOMETRIC DESIGN IMPROVEMENTS)
All of the Build Alternatives would include the addition of auxiliary lanes, connecting the entrance and exit ramps in Brooklyn with the corresponding ramps in Queens, to improve the merging and diverging of traffic. All new bridges associated with the Build Alternatives would include standard travel lane and shoulder widths, and be built at a lower elevation to eliminate the non-standard vertical stopping sight distance at the crest of the bridge, resulting in improved sight lines. For all of the Build Alternatives, a second lane would be added to the Vandervoort Avenue entrance ramp in Brooklyn to improve operations by allowing a greater volume of vehicles to efficiently enter the highway.
BICYCLE AND PEDESTRIAN STRATEGIES (NEW SIDEWALKS AND BICYCLE LANES)
Four of the five Build Alternatives would include new bicycle and pedestrian facilities. The new bikeway/walkway would expand the New York City bike path network by creating a new north-south connection, linking the neighborhoods in Brooklyn and Queens and providing a dedicated location for alternative means of transportation. It would connect to Meeker Avenue near Van Dam Street in Brooklyn and to the existing pedestrian walkway over Laurel Hill Boulevard in Queens.
ACCESS MANAGEMENT STRATEGIES (COLLECTOR-DISTRIBUTOR ROADS)
The proposed improvements in four of the five Build Alternatives include the separation of eastbound BQE traffic to create a collector-distributor roadway for LIE-bound traffic and vehicles entering the BQE from the Vandervoort Avenue entrance ramp in Brooklyn. In Queens, the collector-distributor roadway would reconnect with the mainline BQE and provide a ramp for vehicles (primarily those that entered on the entrance ramp) to continue on the BQE. The separation of eastbound traffic between vehicles wishing to stay on the BQE and those wishing to exit to the LIE would reduce merging and weaving of traffic on the bridge.

Draft Environmental Impact Statement Section II.C
Kosciuszko Bridge Project II-105 March 2007
INTELLIGENT TRANSPORTATION SYSTEMS
Although not directly included as part of this project, some ITS and TSM strategies that would be utilized to manage congestion on the BQE and Meeker Avenue corridors include the following:
Highway Information Systems and
Traffic Signal Coordination.
Highway Information Systems
As described in Section II.C.2.b, two ongoing NYSDOT projects would implement ITS improvements along the BQE corridor that would provide travelers with real-time information that can be used to make trip and route choice decisions.
Traffic Signal Coordination
Since the proposed improvements to the BQE associated with each of the Build Alternatives would likely attract additional vehicles to the highway, with many accessing it via Meeker Avenue, NYSDOT would coordinate with the NYCDOT to implement signal timing improvements at the intersections along Meeker Avenue between McGuiness Boulevard/Humboldt Street and Vandervoort Avenue. The signal timing and phasing improvements, combined with the second lane addition on the Vandervoort Avenue entrance ramp, should alleviate congestion by improving traffic flow and minimizing stops along this busy arterial roadway.

Draft Environmental Impact Statement Section II.D
Kosciuszko Bridge Project II-106 March 2007
D. PROJECT OBJECTIVES
NYSDOT, working with the project’s Stakeholders Advisory Committee (SAC), has established a series of goals and objectives that proposed alternatives should seek to achieve. Any alternative being considered will be evaluated against these goals and objectives, balancing the needs of the project with a broad range of social, economic, and environmental concerns. The following goals and objectives have been developed for the project.
TRANSPORTATION GOAL
Goal: For all modes of transportation, improve mobility, safety and access, and reduce congestion within the study area.
Objectives:
Improve traffic operations in the corridor, reducing delays and increasing efficiency and reliability.
Reduce the frequency and severity of traffic accidents in the corridor by eliminating non-standard elements on the bridge and associated highway sections and ramps.
Minimize diversion of highway auto and truck traffic to local streets, both during construction and long-term.
Substantially conform to established design criteria to ensure safe operation and a smooth flow of traffic.
Be consistent with regional transportation plans in the I-278 corridor and any related highway, transit or freight plans potentially affected by decisions in the project corridor.
Provide cost-effective solutions to problems in the corridor related to both capital construction costs and operation and maintenance expenses.
Eliminate infrastructure deficiencies.
Provide a secure transportation infrastructure.
Improve opportunities for pedestrian/bicycle travel in the corridor.
Increase the effectiveness of mass transit in the corridor.
Address the needs of emergency response personnel and vehicles.
Enhance opportunities for the efficient movement of freight.
SOCIAL, ECONOMIC AND ENVIRONMENTAL GOALS
Goal: Protect and/or enhance the environment, including natural resources and open space.

Draft Environmental Impact Statement Section II.D
Kosciuszko Bridge Project II-107 March 2007
Objectives:
Protect and enhance existing open space and parkland.
Look for opportunities to create parks and open space in order to mitigate project consequences.
Minimize adverse noise impacts and meet federal and state air quality standards.
Protect existing wetlands and waterways.
Avoid impacts to federal and state rare, threatened, and endangered species and other animal life.
Protect public recreational facilities and minimize adverse impacts on their operation during construction.
Protect against adverse visual and light impacts.
Goal: Protect and/or enhance the integrity of residential neighborhoods.
Objectives:
Protect residences and minimize adverse impacts on residential properties during construction.
Improve pedestrian safety.
Ensure that project impacts do not disproportionately affect one neighborhood over another.
Preserve the integrity of neighborhoods.
Protect and preserve community character.
Goal: Maintain the viability of institutional and business communities.
Objectives:
Protect commercial and industrial establishments and minimize adverse impacts on their operation during construction.
Protect institutional facilities (religious, educational, etc.) and minimize adverse impacts on their operation during construction.
Ensure safe pedestrian and vehicular access to institutions and businesses during construction.
Goal: Protect and/or enhance cultural, historic and archaeological resources.

Draft Environmental Impact Statement Section II.D
Kosciuszko Bridge Project II-108 March 2007
Objectives:
Protect and/or mitigate adverse impacts on cultural and historic resources that have been locally designated; identified as eligible for the State or Federal Register; or listed on the State or Federal Register.
Avoid disturbances to archaeological resources.
Goal: Recognize the interrelationships between land use and transportation.
Objectives:
Consider the impact on land use created by any transportation improvement.
Be consistent with existing and committed transportation, community development, and land use plans and projects.
PUBLIC PARTICIPATION GOAL
Goal: Provide an open, inclusive, transparent and responsive EIS process that includes a proactive, comprehensive and ongoing public participation program.
Objectives:
Create a process that embraces the principles of context sensitive design, fosters innovation and considers all ideas.
Create a process that meets or exceeds federal and state requirements.
Ensure that important but tangential issues that cannot be addressed by the EIS process are directed to the appropriate entity for action.
Create a process in which data are accessible and in which any models used are understandable and the assumptions are clearly defined. [This could include conducting modeling workshops.]
Provide a variety of forums to solicit broad public participation from a wide range of perspectives.
Ensure that opportunities for public input are widely communicated.
Facilitate cross-communication between agencies, groups and individuals.
Develop written and graphic project materials that can be understood by the broadest possible audience.