project in chemistry: 15p chemical …...2 abstract nitrocellulose is the main component in many...
TRANSCRIPT

Project in Chemistry: 15p
Chemical Characterisation of Nitrocellulose
Kim Aarseth Larsson
2015-01-09
Supervisor: Bert van Bavel

1
Sammanfattning Nitrocellulosa är den viktigaste komponenten i många typer av ammunition, drivmedel och
sprängämnen. Principerna för produktionen av nitrocellulosa har inte förändrats mycket sedan
det börjades produceras industriellt för detta ändamål på 1800 talet. Karaktären av
nitrocellulosa har en stor inverkan på slutproduktens egenskaper. Syftet med denna studie var
att utveckla en metod som skulle kunna karaktärisera och skilja mellan nitrocellulosa från
olika tillverkare för att kunna relatera karaktären av nitrocellulosa till egenskaperna hos
ammunition, drivmedel och sprängämnen. Proverna löstes i aceton och analyserades med
GC/MS och data analyserades med multivariabel statistik. FTIR användes också för att
karakterisera nitrocellulosan. Resultaten för båda proverna visade mycket små skillnader när
kromatogram och spektra analyserades. Denna studie visar att GC/MS och FTIR inte är
lämpliga för denna typ av karaktärisering. Skillnaderna i data var inte tillräckliga för att kunna
skilja proverna från varandra.

2
Abstract
Nitrocellulose is the main component in many types of ammunition, propellants and
explosives. The principles of production for nitrocellulose have not changed much since the
19th century when it started being industrially produced for this purpose. The character of the
nitrocellulose has a large effect on the end products abilities. The aim of this study was to
develop a method that would be able to characterise and distinguish between nitrocellulose
from different manufacturers to be able to relate the character of the nitrocellulose to the
properties of ammunition, propellants and explosives. Samples were dissolved in acetone and
analysed by GC/MS and data were then analysed by multivariable statistics. FTIR was also
used to characterise the nitrocellulose. Results from both methods showed very small
differences when chromatograms and spectra were analysed. This study shows that GC/MS
and FTIR are not suitable for this type of characterisation. The differences between the data
were not sufficient to be able to separate the samples from each other.

3
Index
1. Introduction .................................................................................................................................. 4
1.1. Nitrocellulose ........................................................................................................................ 4
1.2. Analytical techniques ............................................................................................................ 6
1.4. Objective ............................................................................................................................... 7
2. Method ......................................................................................................................................... 7
2.1. Samples ............................................................................................................................... 14
2.2. GC/MS .................................................................................................................................. 7
2.3. FTIR ...................................................................................................................................... 8
3. Results and analysis ..................................................................................................................... 8
3.1 Gas chromatography .............................................................................................................. 8
3.2. Mass spectrometry ................................................................................................................ 9
3.3 Multivariable statistical evaluation ........................................................................................ 9
3.4. FTIR .................................................................................................................................... 13
4. Discussion .................................................................................................................................. 14
4.1. Problems during the project ................................................................................................ 14
4.2. Further experiments ............................................................................................................ 15
4. Conclusion ................................................................................................................................. 15
5. Consideration ............................................................................................................................. 16
6. References .................................................................................................................................. 18
7. Apendix ...................................................................................................................................... 20

4
1. Introduction
1.1. Nitrocellulose
Nitrocellulose, also known as cellulose nitrate, is a nitrated cellulose ester polymer that is used as the
main compound in many types of ammunition, propellants and explosives as well as a wide range of
other materials.
Braconnot discovered in 1833 that mixing nitric acid with carbohydrates yielded inflammable
materials which he called “xyloidines” (Miles 1955). This material was of much lower purity,
probably only containing 5-6% nitrogen compared to nitrocellulose that Schönbein later produced
and called guncotton (Urbanski 1965). Schönbein was the first one to see the potential in using
nitrocellulose in explosive material (Miles 1955). In the beginning the application of nitrocellulose
was limited and it took several years before its use as a reliable explosive.
Nitrocellulose has been industrially produced since the 19th century. Even if the process has changed
to become more automatic the manufacturing principle has not changed much in the last hundred
years. Mixing cellulose with a sulfonitric mixture of sulphuric acid, nitric acid and water is still the
common way to produce nitrocellulose with high nitrogen content. Nitrocellulose is similar to the
cellulose in structure. It is produced through nitrification of one, two or three of the hydroxyl groups
that are connected to carbons C2, C3, and C6 of the cellulose (see Figure 1). Each cellulose monomer
have three hydroxyl groups that can be substituted. This gives nitrocellulose the chemical formula
[C6H7O2(OH)3-x(ONO2)x]n, where x is the number of hydroxyl groups substituted by nitro groups and
n is the number om monomers. The nitrogen level of nitrocellulose is often described/measured in
degree of substitution (D.S.) which gives a number that represents the average number of hydroxyl
groups that has been substituted. The following equation can be used to calculate D.S.
Equation 1. 𝐷. 𝑆. =3.6 × nitrogencontent(%)
31.13 − nitrogencontent(%)
The theoretical maximum substitution would yield a D.S. of 3 which equates to a nitrogen content of
14.1 %. The highest reported nitrification is a D.S. of 2.9 (≈13.9% of nitrogen content) (Miles 1955,
Selwitz 1988).
Figure 1. Chemical structure of nitrocellulose
with nitrogen content of 12.2%. The figure
also shows the distribution of hydroxyl and
nitrogen on carbon C2 (López-López, de la
Ossa et al. 2010).

5
The amount of nitrogen in the nitrocellulose affects the properties, such as solubility, viscosity and
flammability. At low amounts of nitrogen the solubility in ether-alcohol increases when the nitrogen
levels increases, peaking at 11 – 12% (see table 1). Higher amounts of nitrogen decreases in solubility
and amounts nearing the theoretical maximum (14.1%) of nitrogen groups have a very low level of
solubility in ether-alcohol. At these high amounts the nitrocellulose is commonly dissolved in acetone,
etylacetate or ether-alcohol.
Table 1. Table showing the relationship between nitrogen content and
solubility in ether-alcohol.
D.S. Amount
of nitrogen
Solubility
in ether-alcohol
1.0 6.8% <10%
2.0 11.1% 100%
3.0 14.1% <1%
Different methods are used to achieve different degrees of substitution since different levels of
nitrogen contents are used in the industries. Lower amount of nitrate nitrocellulose are used in a wide
variants of products such as lacquer, plastic film and ink while higher percentage of nitrogen are used
in propellants and explosive materials.
Especially the military applications requires a reliable product that behave as expected, and as such
thorough quality controls are done. There are however two major difficulties in achieving this. The
first is that cellulose, which nitrocellulose is produced from, is a natural product. Its characteristics
are therefore affected by numerous variables, such as its geographical origin and the season of the
year it is grown. The type of plant the cellulose is refined from also affects the characteristics of the
end product. In table 2 is some examples of differences between different celluloses (table 2 is
borrowed from Chemistry and technology of explosives Vol. II by Urbanski, 1965). The
characteristics of the nitrocellulose have large effect on the ballistic properties of ammunitions and
propellants (Fernández de la Ossa et al. 2012, Johansson 2009).
Table 2. Different origin of celluloses molecular weight and degree
of polymerization.
Origin of
cellulose
Molecular
weight
Degree
of polymerization
Unbleached cotton 1,500,000 9200
Purified linters 1,500,000 – 500,000,000 10,000 - 3000
Nettle fibre 1,760,000 10,800
Ramie fibre 1,840,000 11,300
Sulphite pulp 400,000 2900
The second problem is the way nitrification of the cellulose is controlled. Nitrogen content of the
nitrocellulose is monitored by taking out samples from the reaction chamber during production for
measurements. Other characteristics, e.g. density and viscosity, are measured on the end product.
Different batches often have to be mixed to achieve consistency in characteristics. The problem, that
off-line measurements results in, has been approached by trying to develop a mathematical model to
calculate the ideal batch time for the cellulose before nitrification (Barbosa, et al. 2005). The current
standard method used to measure the nitrogen content of the nitrocellulose only measures the amount

6
of nitrogen per mass of nitrocellulose, it does not take in consideration how the nitrogen is distributed
(MIL-DTL-244B 1996, MIL-STD-286C 1991).
1.2. Analytical techniques
The study of nitrocellulose is a complicated task given its high chemical and structural complexity. A
wide range of techniques are being used for the analysis of this ester polymer. Here follows different
techniques commonly used for characteristic studies of nitrocellulose.
1.2.1. SEC
Size-exclusion chromatography (SEC) is an effective technique for analysing the polymeric
characterisations of nitrocellulose. An effective set-up to use when analysing nitrocellulose is a SEC
with triple detection (refractometry, viscometry and lightscattering) (Fernández de la Ossa, et al.
2011). SEC with simple detection system (refractometry) have been used to analyse the polymeric
properties of nitrocellulose using polystyrene standards as a substitute (Fernández de la Ossa et al.
2011).
It has been demonstrated that the molecular weight reproducibility of data acquired by analysing
nitrocellulose with SEC has a low reproducibility when comparing between different research teams
(Fernández de la Ossa et al. 2012). In a study nine laboratories from eight different countries used the
same SEC method to analyse nitrocellulose with nitrogen content of 11.6 – 13.5%. The result was
that the main cause of the low reproducibility was differences in the drying process of the
nitrocellulose and the lack of a definition of similar and good baseline in the obtained chromatograms
(Fernández de la Ossa et al. 2012). This shows the complexity of generating reliable data when
analysing nitrocellulose by SEC.
1.2.2. FTIR
Fourier transform infrared spectroscopy (FTIR) is a common method for analysing nitrocellulose. It
has been used to analyse the morphologic and thermal properties of nitrocellulose as well as the
degradation of it (e.g., Kovalenko et al. 1994, Phillips et al. 1955, Schroeder et al 2001). By observing
a decrease in the NO2 signal and an increase in the OH- signal using FTIR and 13C-nuclear magnetic
resonance (NMR) spectroscopy showed that highly nitrated nitrocellulose is not resistant to
biodegradation (Tarasova et al. 2005). Using FTIR has also been proposed as a method to do
quantitative analyses of nitrogen content in nitrocellulose (Gensh et al. 2011). A study of triple-bas
gunpowder that used scanning electron microscope (SEM) and micro-reflectance FTIR was able to
show among others that only 10µm of the top layer was affected in the ignition process (Schroeder et
al. 2001).
1.2.3. GC/MS
Gas chromatography (GC), alone or coupled to a mass spectrometer (MS), has commonly been used
to analyse degradation of nitrocellulose that has been thermally treated (Fernández de la Ossa et al.
2011, Katoh et al. 2005). A study of fractions from pyrolysis of gunpowder by GC/MS showed that
nitrocellulose was the main source of by-products. (Cropek et al. 2001b). The same study also showed
that when thermally treated, nitrocellulose produced almost no heavy weight fractions. GC/MS has
also been applied in characterising emissions of energetic material and energetic waste, there among
analysing the incineration of nitrocellulose fines (Cropek et al. 2001a).
The common system used when studying the characteristics using GC/MS is to have a pyrolysis
chamber installed to the injector (Fernández de la Ossa et al. 2011). This setup transports the gases
produced from pyrolysis directly into the injector. This method is very effective to look at the
characteristic of by-products and samples does not have to be dissolved but it does not give any data
of the complete nitrocellulose molecule.

7
1.4. Objective
The objective is to establish a method that allows the characterisation of nitrocellulose and to be able
to differentiate between nitrocellulose with different properties. That information could then be used
to find correlations between the characteristics of nitrocellulose and properties of ammunition and
explosives.
2. Method
2.1. Samples
The nitrocellulose samples were received from Eurenco Bofors AB. The nitrocellulose samples were
from two different manufacturers, one from Finland and one from France.
2.2. GC/MS
Gas chromatograph was chosen for this project due to its high sensibility and reproducibility which
are key qualities for this project. Samples were analysed with an Agilent HP 6890 Gas
Chromatography System coupled to an Agilent HP 5973 Mass Spectrometer and an Agilent HP 7683
Injector tower with Agilent HP 7683 Autosampler. The separation was carried out using an Agilent
DB-5MS (30m × 0.250mm, 0.25µm film thickness). The initial temperature was set to start at 90 ˚C
because of the boiling point of the solvents and then raise to a final temperature of 350 ˚C which was
the maximum of this GC system. The scan range of the mass detector was set to scan for 30.0-500.0
amu. For a more specific description of the temperature program and mass spectrometry parameters
see appendix table A1. The tune profile (Figure A1) and tune scan (Figure A2) have been included in
the appendix.
A series of solvents where tested to see if acetone could be avoided as solvent (see table 3).
Unfortunately no other solvent then acetone was able to dissolve a satisfactory amount of
nitrocellulose. Acetone was therefore used as the solvent for all analysis carried out with GC/MS.
Chromatogram and mass spectrometry data were analysed using MassLynx V4.1 software. Peak areas
were analysed statistically using SIMCA V13.0.3.
Table 3. Observed solubility of nitrocellulose in different solvents.
Solvent Observed solubility of nitrocellulose
Toluene Did not dissolve and some slurry was produced
Propanol Did not dissolve
Metanol Did not dissolve
Acetone Fully dissolved
Etanol Did not dissolve and some slurry was produced
Methylene chloride Did not dissolve and some slurry was produced
Hexane Did not dissolve and a lot of slurry was produced
Acetonitrile Most dissolved and some slurry was produced
Ethyl acetate Fully dissolved but liquid became gelatinous
Less than 1gm of each of the nitrocellulose samples were heated in a tin can until ignition. The cans
were then swabbed with acetone which were then collected in glass vails. These samples were
analysed with the same temperature program as the samples that were not thermally treated.

8
2.3. FTIR
Nitrocellulose samples were also analysed by comparing FTIR spectra. The spectra were acquired
with a PerkinElmer Spectrum Two FTIR – UATR (Universal Attenuated Total Reflectance). A lithium
tantalate detector was used with an applied scan range of 4000-450 cm-1. PerkinElmer Spectrum
V10.03.07.0112 software was used to analyse the spectra.
3. Results and analysis
3.1 Gas chromatography
The chromatogram from the Finish and French samples showed high similarity, as seen in figure 2.
Higher concentrations of nitrocellulose would be needed to detect any possible differences between
the Finish and the French nitrocellulose that could be used to characterise them. Unfortunately,
because of the gelatinous effect of nitrocellulose it would not be possible to analyse such high
concentrations with the GC/MS system used in this study (Miles 1955). Another option would be to
further optimise the temperature program but further separation in the presence of the viscous
nitrocellulose, was not expected to improve the results.
Figure 2. Total ion chromatogram showing the similarity of two samples of French and two
samples of Finish nitrocellulose. The x-axis shows the retention time in minutes and on the y-
axis the signal intensity is showed in percent of the highest peak. Full scan 50-500 at 3.09
scans/sec. GC conditions described in text.
The Finish and the French thermally treated samples also showed a very high similarity towards one
and other. When the chromatograms of the thermally treated and untreated nitrocellulose samples
are compared there are some differences but also a lot of similarities as seen in figure 3. Most of the
difference are between retention times 4.10 – 6.50. The peak at 5.71 is not present in the thermally
treated samples while the other peaks seem to have shifted slightly to a lower retention time.

9
Figure 3. Total ion chromatogram of the Finish and French samples both thermally treated and
not. The Finish sample that was not thermally treated is shown as the purple line and the
thermally treated as the black line, the French sample that was not thermally treated is shown
as the green line and the thermally treated as the red line. The x-axis is the retention time in
minutes and on the y-axis the signal intensity is showed in percent of the highest peak which is
set as 100%. Full scan 50-500 at 3.09 scan/sec. GC conditions described in text.
3.3 Multivariable statistical evaluation
When peak areas of selected peaks at different retention times were analysed by using multivariable
statistics (SIMCA) no distinct difference could be observed between the Finish and the French
nitrocellulose. Peak areas that had a shift in retention time, see figure 3, were interpreted as the
same peaks. The score plot of the principle component analysis (PCA) is given in figure 7. The
variation between the sample occasion (5, 6, B) is larger than the variation of between the Finish
and French nitrocellulose. For a complete list of peaks and areas that were analysed see appendix
table A2. All data was normalised in SIMCA by scaling to unit variance.

10
Figure 4. Score plot of peak areas of the thermally treated samples and samples that
were not thermally treated. Samples of the Finish nitrocellulose are marked as Fin and
samples of the French as Fra. The samples that were thermally treated before analysed
are marked with a B at the end. Model statistics are given in table 4.
Table 4
R2VX R2VX(cum) Q2VX Q2 limit Q2VX(cum)
PC 1 0.798866 0.798866 0.573872 0.230769 0.573872
PC 2 0.134362 0.933229 0.121646 0.266667 0.625709
The loading plot given in figure 8 clearly shows the configuration of all peaks except for the peak at
5.71 minutes (min). This peak indicates the difference between the thermally threated samples and
the untreated nitrocellulose as can be seen in the corresponding score plot (figure 7). In PC2 a
difference between the early (5-6 min.) and the later (>7 min.) elating compounds can be seen. And
although the differences are minimal (13% PC2). Finish samples are always located below the French
samples. Including more MS data might highlight this differences.

11
Figure 5. Loading plot of peak areas from the Finish and French samples. The
number at each score point is the retention time of the peak. Showing different
GC/MS peaks labeled with their retention times.
3.2. Mass spectrometry
The fraction patterns from the Finish and French nitrocellulose showed high similarity as seen in
figure 4. This was to be expected since the chromatogram of the samples seen in figure 2 showed
such similarity. The nitrocellulose were fractioned into light weight molecules. Fractions with an m/z
over 100 was very scarce or very large, molecules with an m/z >500 could not be detected with the
system used. The results were the same for the samples that were thermally treated. This was expected
of the thermally treated samples since previous studies have shown that when nitrocellulose is ignited
very small amounts of heavy weight species are produced (Cropek et al. 2001b).

12
Figure 6. Mass spectra of peaks at 4.21 min elution time. Top spectrum is from a Finish sample
and bottom spectrum is from a French sample. The fractions of the different nitrocellulose are
very similar and shows no apparent differences in the mass ratios.
The mass spectra were identical when the peaks of the thermally treated samples were compared to
the samples that were not thermally treated, for an example see figure 5. Which shows that there is a
shift in retention times of the early peaks in the chromatogram between the samples. The reason for
this shift of retention time is unknown. It could be speculated that in the samples that are not thermally
treated the early peaks have a slightly longer retention time because of gelatinous effect and that the
gelatinous effect does not occur when samples that are thermally treated are dissolved in acetone.
Figure 7. Mass spectra from French thermally treated sample with retention time 4.15 min (top
spectrum) and sample not thermally treated with retention time 4.21 min (bottom spectrum).
These retention times correspond to the largest peaks from each chromatogram, as seen in figure
3. The peaks seem to be the same species as the mass spectra are identical.

13
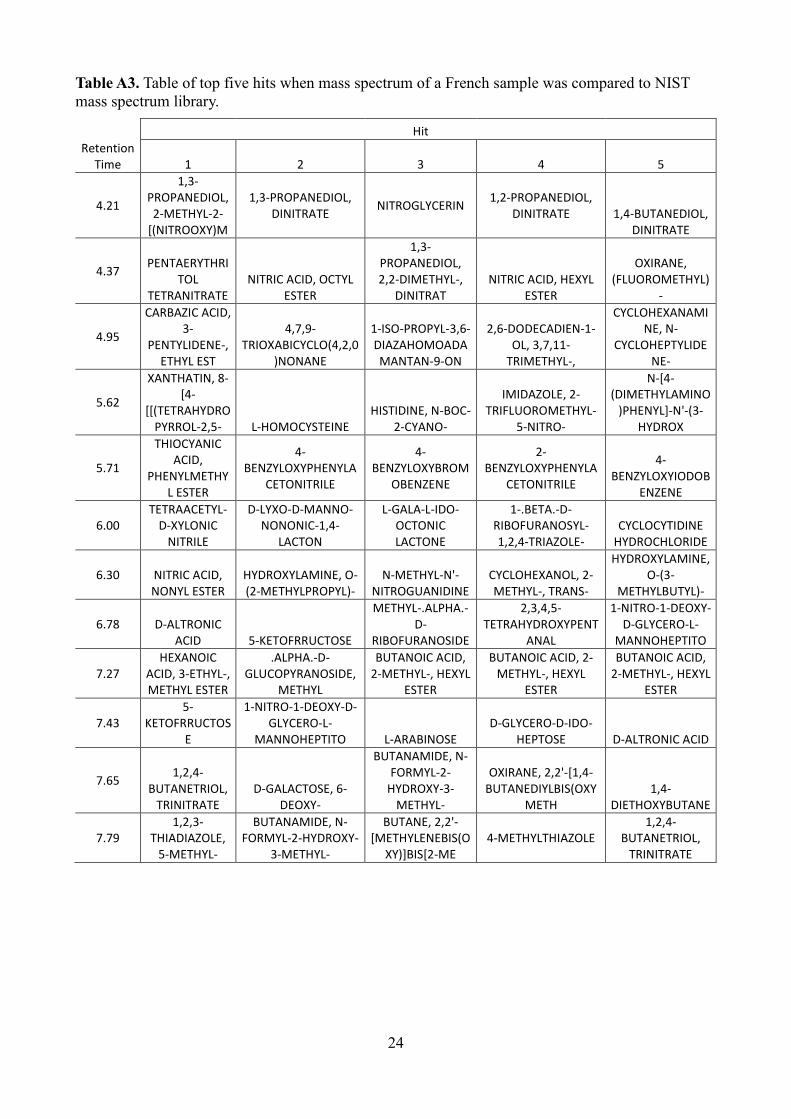
Mass spectrum of the untreated French nitrocellulose sample showed in figure 4 and 5 was compare
to NIST mass spectra library. The results did not show nitrocellulose but showed the presences of
nitro groups, the five top results are listed in table 4, all containing nitro groups. The resemblance of
the nitrocellulose sample and 1,3-propanediol, 2-methyl-2-[(nitrooxy)metyl]-,dinitrate (ester) (the top
result from table 4) are showed in figure 6. If this compound was to be subjected pyrolysis it would
emit several of the gases seen in studies of pyrolysis of nitrocellulose, e.g. nitrous oxide, carbon
dioxide and nitric oxide (Cropek et al. 2001b). Mass spectra of each peak of the same French was
analysed and compared to NIST mass spectra library (see appendix figure A3 for a complete list of
top hits).
Table 4
Hit Compound Name
1 1,3-PROPANEDIOL, 2-METHYL-2-
[(NITROOXY)METYL]-,DINITRATE (ESTER)
2 1,3-PROPANEDIOL, DINITRATE
3 NITROGLYCERIN
4 1,2-PROPANEDIOL, DINITRATE
5 1,4-BUTANEDIOL, DINITRATE
Figure 8. Delta spectrum of French spectrum from figure 4 and
spectrum of top hit from table 4.
3.4. FTIR
While only small differences were seen using GC/MS, FTIR was used to characterise the
nitrocellulose. The FTIR Spectra of the two nitrocellulose samples were very similar as seen in figure
9. Comparison showed a similarity >98% making it very difficult to characterise nitrocellulose from
different manufacturers. Due to the high similarity of the two different nitrocellulose and time
restraints no further attempts were made to characterise nitrocellulose with FTIR.
The spectra corresponds well with earlier studies on nitrocellulose using FTIR (López-López et al.
2010). The three most intense peaks (1660, 1280 and 840 cm-1) are due to antisymmetric and
symmetric stretching of NO2 and valance stretching of NO. The small group of peaks with lower
intensity in the range of 1200 – 950 cm-1 are the effect of the different vibrations of the CO group
(Kovalenko et al. 1994).

14
Figure 9. FTIR spectra of nitrocellulose from two different
producers. The orange line is the result from the Finish
manufacturer’s nitrocellulose and the blue from the French.
4. Discussion
To date there are no published data of characterisation of nitrocellulose by GC/MS where
nitrocellulose has not been thermally treated. Analysing nitrocellulose that has been subjected to
pyrolysis gives much information of the by-products of nitrocellulose but very little of the complete
nitrocellulose polymer. The results from the GC/MS method used in this study did unfortunately not
show any complete monomers or polymers in the mass spectra generated by it. However, the results
still show consistency with published data as many of the species that were identified when mass
spectra where compared to NIST library would yield the same gases if ignited as found when
analysing nitrocellulose by GC/MS coupled to a pyrolysis chamber (Cropek 2001b).
The reason that the nitrocellulose from the Finish and French manufacturers show such high similarity
when analysed with both GC/MS and FTIR could be that there is a very small variation between
nitrocellulose samples. However, it seems very unlikely that nitrocellulose produced at different
places should end up almost identical. The manufactory procedure, environment, cellulose and other
raw materials would have to be identical. For an ester polymer such as nitrocellulose this is highly
improbable, especially considering how that batches often need to be mixed to achieve some
consistency.
One explanation would be that there are polymerisation problem and other species than nitrocellulose
present in the samples that hides the peaks of the nitrocellulose. Another explanation could be that
the peaks that represents the difference are not intense enough and higher concentrations would be
needed to observe differences using GC/MS.
4.1. Safety percussions
The nitrocellulose samples were stored in room temperature (RT) in a secured cabinet. Small amounts
of water was added to each sample to prohibit spontaneous combustion. Fume hoods and safety
apparels were used when samples and solvents were handled.
4.2. Problems during the project
Several technical problems were encountered with the GC/MS system which set the project back
several weeks. The initial test-runs of the samples with acetone as solvent looked promising. When
the first measured samples were run systematic contaminating peaks where obscuring the spectra of
40
50
60
70
80
90
100
40
00
38
68
37
36
36
04
34
72
33
40
32
08
30
76
29
44
28
12
26
80
25
48
24
16
22
84
21
52
20
20
18
88
17
56
16
24
14
92
13
60
12
28
10
96
96
48
32
70
05
68
Tran
spar
ecy
(%)
Wavenumber cm-1

15
the nitrocellulose. The origin of the peaks are not clear but appeared to be silica when analysed. The
contaminating peaks disappeared after column, and liner model were changed.
It was also discovered that any sample dissolved in acetone could only be analysed ones.
Contaminating peaks of what seemed to be silica when analysed would appear if the same sample
was loaded to the GC/MC system multiple times. This was also observed in the blank acetone samples
as seen in figure 10. The silica membrane on the caps to the vails could be the source of the
contamination if a piece of silica membrane is pulled down into the acetone and dissolves every time
the injector needle takes a sample. This is supported by the fact that the contaminating peaks area
became larger for every time a sample was analysed, seen in figure 10.
Figure 10. Gas chromatogram of acetone. Top chromatogram is from first time the acetone is
analysed. The bottom chromatogram shows the same sample of acetone analysed for the second
time two days later.
4.3. Further experiments
If the study were to be continued more replicates should be done to get better statistical significance.
Another method that was speculated but not carried out due to time restraints was to do a solid phase
microextraction (SPME) of the nitrocellulose and analyse by GC/MS. A factor that has to be
addressed before performing this experiment would be the risk of thermal activation of the
nitrocellulose when heated, which could cause an explosion when in a closed vessel.
It would be interesting to analyse the samples by LC/MS which is more compatible with macro
molecules such as nitrocellulose.
5. Conclusion
It is the conclusion of this paper that it is not preferable to use GC/MS or FTIR to characterise
nitrocellulose from different manufacturers. There are several aspects that lead to this conclusion.
The chromatograms of the different nitrocellulose samples showed much similarity.
As mentioned before, due to time limitation and technical problems the sample group of this analysis
is small. However, the high similarity between the samples strongly supports this conclusion.

16
6. Consideration
Nitrocellulose is a very stable pollutant and has a high resistance to biodegradation. The effect of
nitrocellulose pollution and how to minimize the effects of it is a problem that is being researched
(e.g., Ganev 2001, Kim et al. 1997, Liu 2003, Cropek et al. 2001a). A better understanding of the
correlation between characteristics of nitrocellulose and the properties of ammunition, propellants
and explosives manufactured from it could lead to the development of safer products. Not only safer
ammunition, propellants and explosives but also better ignition yarn which is used in fire exits. Other
products could also benefit from a better understanding of the characteristics of nitrocellulose, e.g.,
lacquers, glue and plastics. It would also help with the development of a more efficient manufacturing
processes which would have environmental benefits.
The increase of terrorism in recent years demands new methods to investigate these types of crimes.
Better characterisation of nitrocellulose would help in identification and tracking of ammunition and
explosives. Qualitative analyses of nitrocellulose are not common, and have rarely been published to
date. The only analytical tools used in qualitative studies of highly nitrated nitrocellulose are ion-
mobility spectrometry (IMS), mass spectroscopy (MS), liquid chromatograph (LC) and vibrational
spectroscopy (Fernández de la Ossa et al. 2011). There has been a large progress since the new
millennium, making it possible to characterise and identify highly-nitrated nitrocellulose in
explosives (Fernández de la Ossa et al. 2011).

17
7. Acknowledgment
I would like to take this opportunity to thank my advisor Bert van Bavel for all his help, advice and
suggestions.
I would also like to thank everybody that works in the MTM laboratory for making me feel so
welcomed.

18
8. References
Barbosa, I. V. M., D. M. Merquior and F. C. Peixoto (2005). "Continuous modelling and kinetic
parameter estimation for cellulose nitration." Chemical Engineering Science 60(19): 5406-5413.
Cropek D. M., J.M. Day, P.A. Kemme (2001a). Incineration By-Products of AA2, NC Fines and NG
Slums (retrieved in November 2014, from
http://oai.dtic.mil/oai/oai?verb=getRecord&metadataPrefix=html&identifier=ADA395160
Cropek D. M., P.A. Kemme, J.M. Day (2001b). Pyrolytic Decomposition Studies of AA2, a
Double-Base Propellant (retrieved in November 2014, from
http://oai.dtic.mil/oai/oai?verb=getRecord&metadataPrefix=html&identifier=ADA399586).
Fernández de la Ossa, M. Á., M. López-López, M. Torre and C. García-Ruiz (2011). "Analytical
techniques in the study of highly-nitrated nitrocellulose." TrAC Trends in Analytical Chemistry
30(11): 1740-1755.
Fernández de la Ossa M. Á., M. Torre, and C. García-Ruiz (2012). "Nitrocellulose in propellants:
characteristics and thermal properties." Advances in Materials Science Research 7: 201-220.
Ganev, R. (2001). "Utilisation of waste nitrocellulose powders and environmental pollution in their
destruction." Waste management & research : the journal of the International Solid Wastes and
Public Cleansing Association, ISWA 19(6): 533-538.
Gensh, K. V., P. V. Kolosov and N. G. Bazarnova (2011). "Quantitative analysis of cellulose nitrates
by Fourier transform infrared spectroscopy." Russian Journal of Bioorganic Chemistry 37(7): 814-
816.
Johansson, S.-E. (2009). Allt om krut och lite till. Karlskoga, Nordic Ballistics.
Katoh, K., L. Le, M. Kumasaki, Y. Wada, M. Arai and M. Tamura (2005). "Study on the
spontaneous ignition mechanism of nitric esters (I)." Thermochimica Acta 431(1–2): 161-167.
Kim B. J., Park J. K., Clapp, L. W. (1997). Characterization of Nitrocellulose Fines in Wastewater
and Development of Pollution Prevention Strategy (retrieved in January 2015 from
http://oai.dtic.mil/oai/oai?verb=getRecord&metadataPrefix=html&identifier=ADA335562
Kovalenko, V. I., R. M. Mukhamadeeva, L. N. Maklakova and N. G. Gustova (1994).
"Interpretation of the IR spectrum and structure of cellulose nitrate." Journal of Structural
Chemistry 34(4): 540-547.
Liu, H.-L. (2003). "Waste Minimization At A Nitrocellulose Manufacturing Facility." International
Journal of Environmental Studies 60(4): 353-361.
López-López, M., M. Á. F. de la Ossa, J. S. Galindo, J. L. Ferrando, A. Vega, M. Torre and C.
García-Ruiz (2010). "New protocol for the isolation of nitrocellulose from gunpowders: Utility in
their identification." Talanta 81(4): 1742-1749.
MIL-STD-286C (1991). Military standard propellants, solid: sampling, examination and testing
(retrieved in Januare 2015 from http://everyspec.com/MIL-STD/MIL-STD-0100-0299/MIL-STD-
286C_8618/

19
MIL-DTL-244B (1996) Detail specification: nitrocellulose (retrieved in Januare 2015 from
http://everyspec.com/MIL-SPECS/MIL-SPECS-MIL-DTL/MIL-DTL-244B_14692/)
Miles, F. D. (1955). Cellulose nitrate, the physical chemistry of nitrocellulose, its formation and
use. London: 39A Welbeck Street, W.1, Published for Imperial Chemical Industries by Oliver and
Boyd.
Phillips, R. W., C. A. Orlick and R. Steinberger (1955). "The kinetics of the thermal decomposition
of nitrocellulose." Journal of Physical Chemistry 59(10): 1034-1039.
Schroeder, M. A., R. A. Fifer, M. S. Miller, R. A. Pesce-Rodriguez, C. J. S. McNesby and G. Singh
(2001). "Condensed-phase processes during combustion of solid gun propellants. I. Nitrate ester
propellants." Combustion and Flame 126(1): 1569-1576.
Selwitz, C. (1988). Cellulose nitrate in conservation. Marina del Rey, Calif., USA, Getty
Conservation Institute.
Tarasova, N. B., O. E. Petrova, D. A. Faizullin and M. N. Davydova (2005). "FTIR-spectroscopic
studies of the fine structure of nitrocellulose treated by Desulfovibrio desulfuricans." Anaerobe
11(6): 312-314.
Urbanski, T. (1965). Chemistry and technology of explosives. Poland, Pergamon Press ; Warszawa :
PWN, Polish Scientific Publishers.
20
9. Apendix
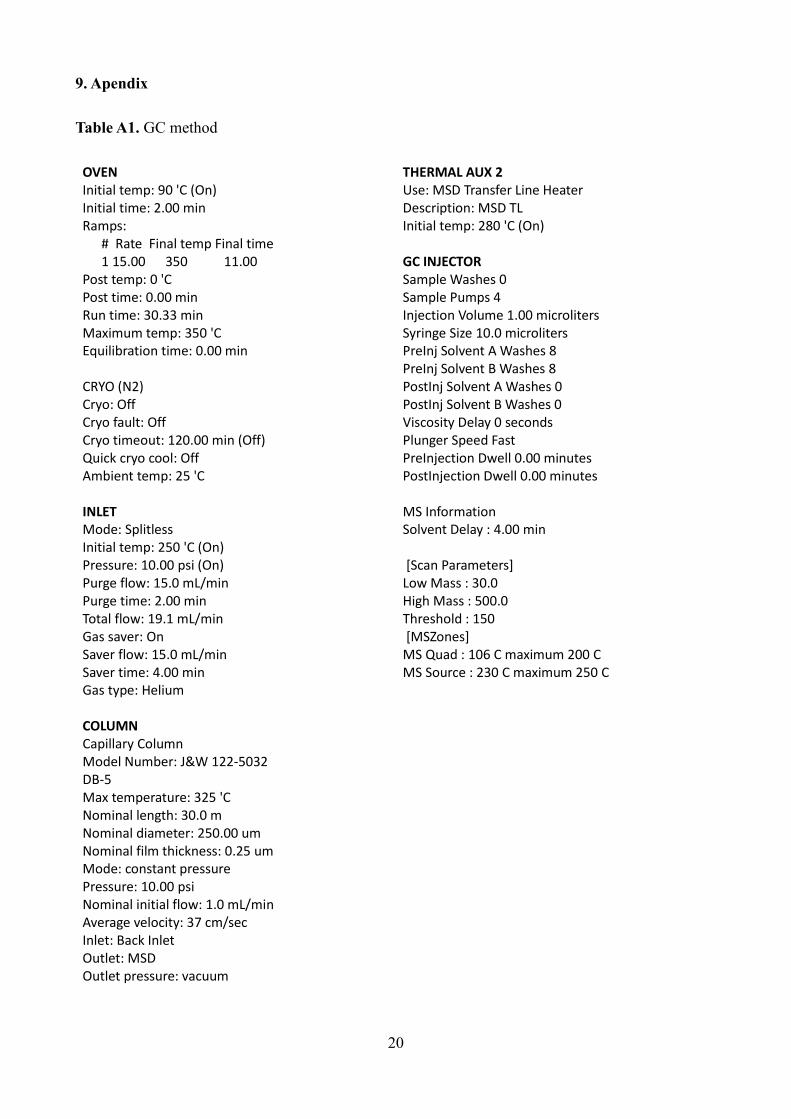
Table A1. GC method
OVEN Initial temp: 90 'C (On) Initial time: 2.00 min Ramps:
# Rate Final temp Final time 1 15.00 350 11.00
Post temp: 0 'C Post time: 0.00 min Run time: 30.33 min Maximum temp: 350 'C Equilibration time: 0.00 min CRYO (N2) Cryo: Off Cryo fault: Off Cryo timeout: 120.00 min (Off) Quick cryo cool: Off Ambient temp: 25 'C INLET Mode: Splitless Initial temp: 250 'C (On) Pressure: 10.00 psi (On) Purge flow: 15.0 mL/min Purge time: 2.00 min Total flow: 19.1 mL/min Gas saver: On Saver flow: 15.0 mL/min Saver time: 4.00 min Gas type: Helium COLUMN Capillary Column Model Number: J&W 122-5032 DB-5 Max temperature: 325 'C Nominal length: 30.0 m Nominal diameter: 250.00 um Nominal film thickness: 0.25 um Mode: constant pressure Pressure: 10.00 psi Nominal initial flow: 1.0 mL/min Average velocity: 37 cm/sec Inlet: Back Inlet Outlet: MSD Outlet pressure: vacuum
THERMAL AUX 2 Use: MSD Transfer Line Heater Description: MSD TL Initial temp: 280 'C (On) GC INJECTOR Sample Washes 0 Sample Pumps 4 Injection Volume 1.00 microliters Syringe Size 10.0 microliters PreInj Solvent A Washes 8 PreInj Solvent B Washes 8 PostInj Solvent A Washes 0 PostInj Solvent B Washes 0 Viscosity Delay 0 seconds Plunger Speed Fast PreInjection Dwell 0.00 minutes PostInjection Dwell 0.00 minutes MS Information Solvent Delay : 4.00 min [Scan Parameters] Low Mass : 30.0 High Mass : 500.0 Threshold : 150 [MSZones] MS Quad : 106 C maximum 200 C MS Source : 230 C maximum 250 C

21
Figure A1. Tune profile of GC/MS

22
Figure A2. Tune scan of GC/MS

23
Table A2. Table of intergraded peak area of nitrocellulose samples. Sample that were thermally
treated ends with a B.
Peak area
Retention Time
Mass used for area Finish 5 Finish 6 French 5 French 5 Finish B French B
4.21 31 2867 3683 6079 3019 920 1192
4.38 56 415 546 905 463 93 155
4.95 55 895 787 1364 862 620 873
5.62 46 357 393 954 397 143 229
5.71 91 1368 2830 2396 3657 - -
6.00 43 205 148 301 199 - -
6.30 55 98 78 134 93 88 135
6.78 46 637 513 1107 594 127 411
7.27 57 304 301 396 290 171 163
7.43 61 1062 1204 2151 1161 481 486
7.64 71 971 970 1315 809 335 446
7.79 71 156 189 277 149 104 109
24
Table A3. Table of top five hits when mass spectrum of a French sample was compared to NIST
mass spectrum library.
Hit
Retention Time 1 2 3 4 5
4.21
1,3-PROPANEDIOL, 2-METHYL-2-
[(NITROOXY)M
1,3-PROPANEDIOL, DINITRATE
NITROGLYCERIN 1,2-PROPANEDIOL,
DINITRATE 1,4-BUTANEDIOL, DINITRATE
4.37 PENTAERYTHRI
TOL TETRANITRATE
NITRIC ACID, OCTYL ESTER
1,3-PROPANEDIOL, 2,2-DIMETHYL-,
DINITRAT NITRIC ACID, HEXYL
ESTER
OXIRANE, (FLUOROMETHYL)
-
4.95
CARBAZIC ACID, 3-
PENTYLIDENE-, ETHYL EST
4,7,9-TRIOXABICYCLO(4,2,0
)NONANE
1-ISO-PROPYL-3,6-DIAZAHOMOADAMANTAN-9-ON
2,6-DODECADIEN-1-OL, 3,7,11-
TRIMETHYL-,
CYCLOHEXANAMINE, N-
CYCLOHEPTYLIDENE-
5.62
XANTHATIN, 8-[4-
[[(TETRAHYDROPYRROL-2,5- L-HOMOCYSTEINE
HISTIDINE, N-BOC-2-CYANO-
IMIDAZOLE, 2-TRIFLUOROMETHYL-
5-NITRO-
N-[4-(DIMETHYLAMINO
)PHENYL]-N'-(3-HYDROX
5.71
THIOCYANIC ACID,
PHENYLMETHYL ESTER
4-BENZYLOXYPHENYLA
CETONITRILE
4-BENZYLOXYBROM
OBENZENE
2-BENZYLOXYPHENYLA
CETONITRILE
4-BENZYLOXYIODOB
ENZENE
6.00 TETRAACETYL-
D-XYLONIC NITRILE
D-LYXO-D-MANNO-NONONIC-1,4-
LACTON
L-GALA-L-IDO-OCTONIC LACTONE
1-.BETA.-D-RIBOFURANOSYL-1,2,4-TRIAZOLE-
CYCLOCYTIDINE HYDROCHLORIDE
6.30 NITRIC ACID, NONYL ESTER
HYDROXYLAMINE, O-(2-METHYLPROPYL)-
N-METHYL-N'-NITROGUANIDINE
CYCLOHEXANOL, 2-METHYL-, TRANS-
HYDROXYLAMINE, O-(3-
METHYLBUTYL)-
6.78 D-ALTRONIC ACID 5-KETOFRRUCTOSE
METHYL-.ALPHA.-D-
RIBOFURANOSIDE
2,3,4,5-TETRAHYDROXYPENT
ANAL
1-NITRO-1-DEOXY-D-GLYCERO-L-
MANNOHEPTITO
7.27 HEXANOIC
ACID, 3-ETHYL-, METHYL ESTER
.ALPHA.-D-GLUCOPYRANOSIDE,
METHYL
BUTANOIC ACID, 2-METHYL-, HEXYL
ESTER
BUTANOIC ACID, 2-METHYL-, HEXYL
ESTER
BUTANOIC ACID, 2-METHYL-, HEXYL
ESTER
7.43 5-
KETOFRRUCTOSE
1-NITRO-1-DEOXY-D-GLYCERO-L-
MANNOHEPTITO L-ARABINOSE D-GLYCERO-D-IDO-
HEPTOSE D-ALTRONIC ACID
7.65 1,2,4-
BUTANETRIOL, TRINITRATE
D-GALACTOSE, 6-DEOXY-
BUTANAMIDE, N-FORMYL-2-
HYDROXY-3-METHYL-
OXIRANE, 2,2'-[1,4-BUTANEDIYLBIS(OXY
METH 1,4-
DIETHOXYBUTANE
7.79 1,2,3-
THIADIAZOLE, 5-METHYL-
BUTANAMIDE, N-FORMYL-2-HYDROXY-
3-METHYL-
BUTANE, 2,2'-[METHYLENEBIS(O
XY)]BIS[2-ME 4-METHYLTHIAZOLE
1,2,4-BUTANETRIOL,
TRINITRATE