project: kerosene vale ash dam and dry ash repository · 3.3 kvad/r seepage and subsurface seepage...
TRANSCRIPT

Project: Kerosene Vale Ash Dam and Dry Ash Repository KVAR Stage 2 Water Quality Assessment February, 2012 to March, 2013
Reference: 208562
Prepared for: EnergyAustralia NSW
Revision: 6
16 January 2014
Project 208562| File KVAD Stage 2A Water Quality Assessment 2013 Final Report.docx
| 16 January 2014 | Revision 6
Document Control Record
Document prepared by:
Aurecon Australia Pty Ltd
ABN 54 005 139 873
Level 2, 116 Military Road Neutral Bay NSW 2089
PO Box 538 Neutral Bay NSW 2089 Australia T F E W
+61 2 9465 5599 +61 2 9465 5598 [email protected] aurecongroup.com
A person using Aurecon documents or data accepts the risk of:
a) Using the documents or data in electronic form without requesting and checking them for accuracy against the original hard copy version.
b) Using the documents or data for any purpose not agreed to in writing by Aurecon.
Report Title KVAR Stage 2 Water Quality Assessment February, 2012 to March, 2013
Document ID Project Number 208562
File Path P:\ENERGY\7053\Mount Piper & Wang WQ 2440\Wang\KVAD Stage 2 seepage Diversion effects 2012 &2013\2013 Report\KVAD Stage 2A Water Quality Assessment 2013 draft Report.docx
Client EnergyAustralia NSW Client Contact Nino Di Falco
Rev Date Revision Details/Status Prepared by Author Verifier Approver
0 9 September 2013 Initial Draft BRH BRH PF GM
1 29 November, 2013 Draft for Hydrogeology Internal Review BRH BRH IF GM
2 3 December, 2013 Draft for Internal Review BRH BRH PF GM
3 14 December 2013 Draft for approval BRH BRH PF GM
4 18 December 2013 Draft with additional comments BRH BRH PF GM
5 20 December 2013 Draft for EnergyAustralia NSW Comments
BRH BRH PF GM
6 16 January 2014 Final Report BRH BRH PF GM
Current Revision 6
Page i
Contents 1. Introduction 1
1.1 Background 1
1.2 Aims and Objectives 4
1.3 Previous Report 4
1.4 Scope 5
1.5 Information provided by EnergyAustralia NSW 5
1.6 Data Quality 6
2. Surface and Groundwater Quality Monitoring 8
2.1 Monitoring Design for Differentiation of Water Quality Sources 8
2.1.1 Groundwater Monitoring 8
2.1.2 Surface Water Monitoring 8
2.1.3 Sampling in Upper Sawyers Swamp Creek 9
2.1.4 Other data considerations 10
2.2 KVAR Site Monitoring and Runoff Management 10
2.3 Tracers for Dry Ash leachates 11
2.4 Groundwater Levels 11
2.5 Climatic Conditions 12
2.6 Methods 12
2.7 Guidelines 12
2.7.1 Receiving Waters 15
2.7.2 Early Warning of Water Quality Changes 16
2.8 Control Charts 16
3. Effects of Seepage Collection Diversion and Return Systems on Sawyers Swamp Creek Water Quality and Trace Metals 18
3.1 Springvale Mine Water Quality 18
3.2 Sawyers Swamp Creek Ash Dam Pump-back System Water Quality 20
3.3 KVAD/R Seepage and Subsurface Seepage Collection and Diversion Effects 23
3.4 Lidsdale Cut 26
4. Stage 1 and Stage 2 Dry Ash Placement Effects on Gr oundwater Quality 29
4.1 Groundwater Flow Directions 29
4.2 Sawyers Swamp Creek Ash Dam Water Quality 32
4.3 SSCAD Groundwater Quality 34
4.4 KVAD and KVAR Groundwater Quality 36
4.5 Lidsdale Cut 39
Page ii
4.6 Sawyers Swamp Creek 42
4.7 Overall Effects of Groundwater Seepage from Ash Placements on Sawyers Swamp Creek Receiving Waters 43
5. Discussion 45
6. Conclusions 47
7. Recommendations 48
8. References 49
Tables Table 1: Pre-dry Ash Placement Water Quality Baseline 90th Percentile at Background and
Receiving Water Sites and resulting Guidelines or Goals for KVAD/R Groundwater, Lidsdale Cut and Sawyers Swamp Creek
Table 2: Typical Springvale Coal Mine Water Quality Table 3: Summary of Average Water Quality in SSCAD for Pre-placement and Post-Stage
2 Periods and the V-notch Seepage Compared to Sawyers Swamp Creek Up- and Downstream of the V-notch, Dump Creek Background and Surface Water Guidelines or Goals
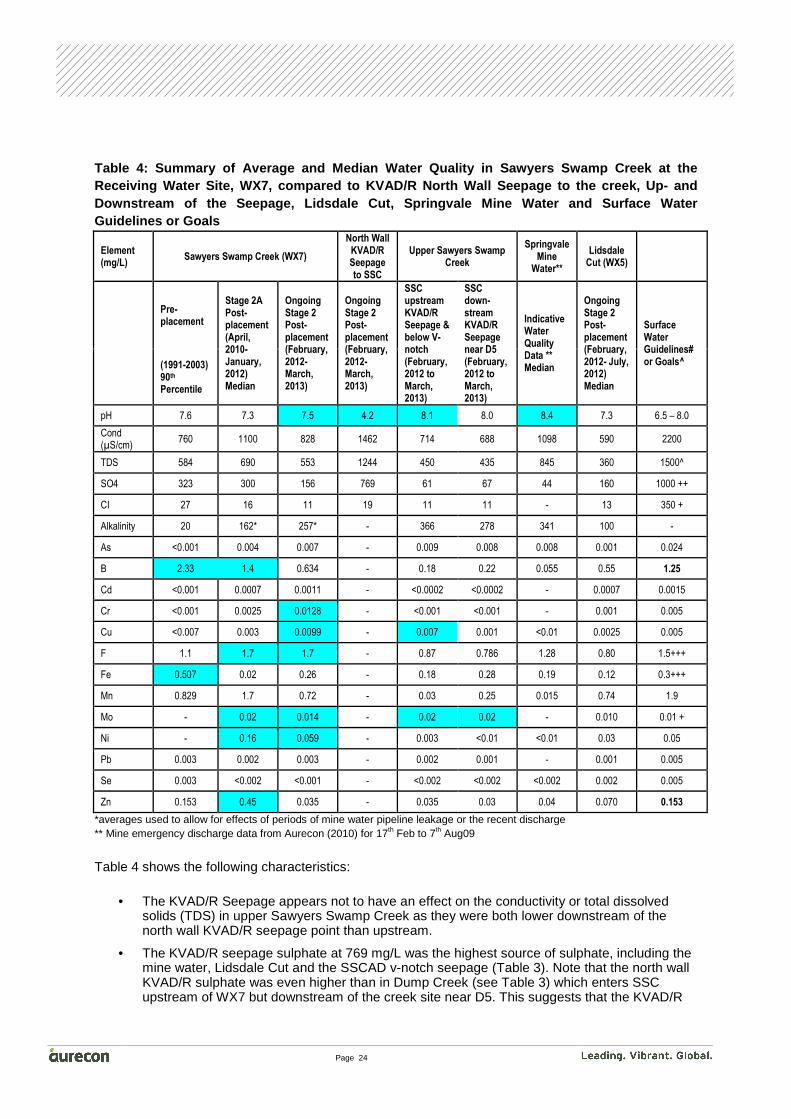
Table 4: Summary of Average and Median Water Quality in Sawyers Swamp Creek at
the Receiving Water Site, WX7, compared to KVAD/R North Wall Seepage to the creek, Up- and Downstream of the Seepage, Lidsdale Cut, Springvale Mine Water and Surface Water Guidelines or Goals
Table 5: Median Water Quality for SSCAD V-notch Seepage and Seepage affected Groundwater bores during Post-Stage 1 and Post-Stage 2 Compared to the Groundwater Background, Seepage Bore WGM1/D4 Baseline and Groundwater Guidelines or Goals
Table 6: Median Water Quality for Dry Ash KVAD/KVAR Groundwater Seepage Bores during Post-Stage 1, Initial Stage 2 and Stage 2A Compared to Current Groundwater Background Bore WGM1/D2 and Bore WGM1/D5 Baseline and Groundwater Guidelines or Goals
Table 7: Median Lidsdale Cut Water Quality during Stage 1 and Capping and Stage 2 Dry Ash Placement periods compared to the current Groundwater Quality at Bore WGM1/D5 and relative to the Pre-placement Baseline 90th Percentile and Groundwater Guidelines or Goals
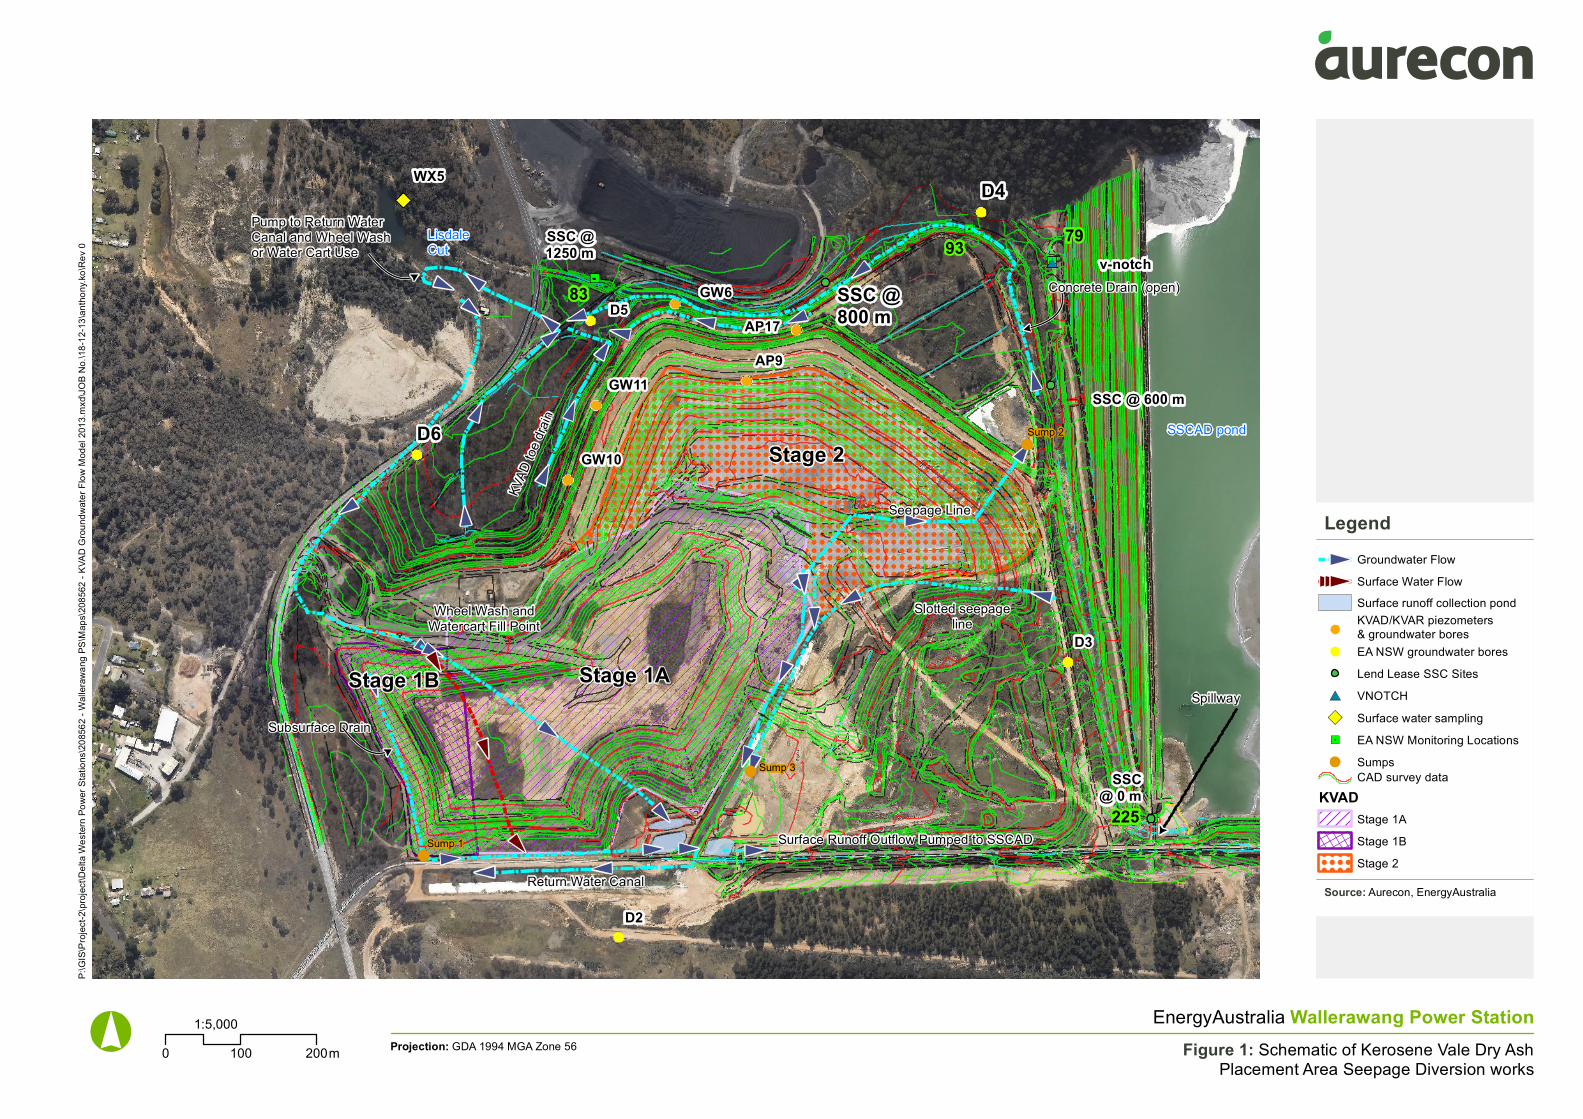
Figures Figure 1: Schematic of Kerosene Vale Dry Ash Placement Area Seepage Diversion works
Page iii
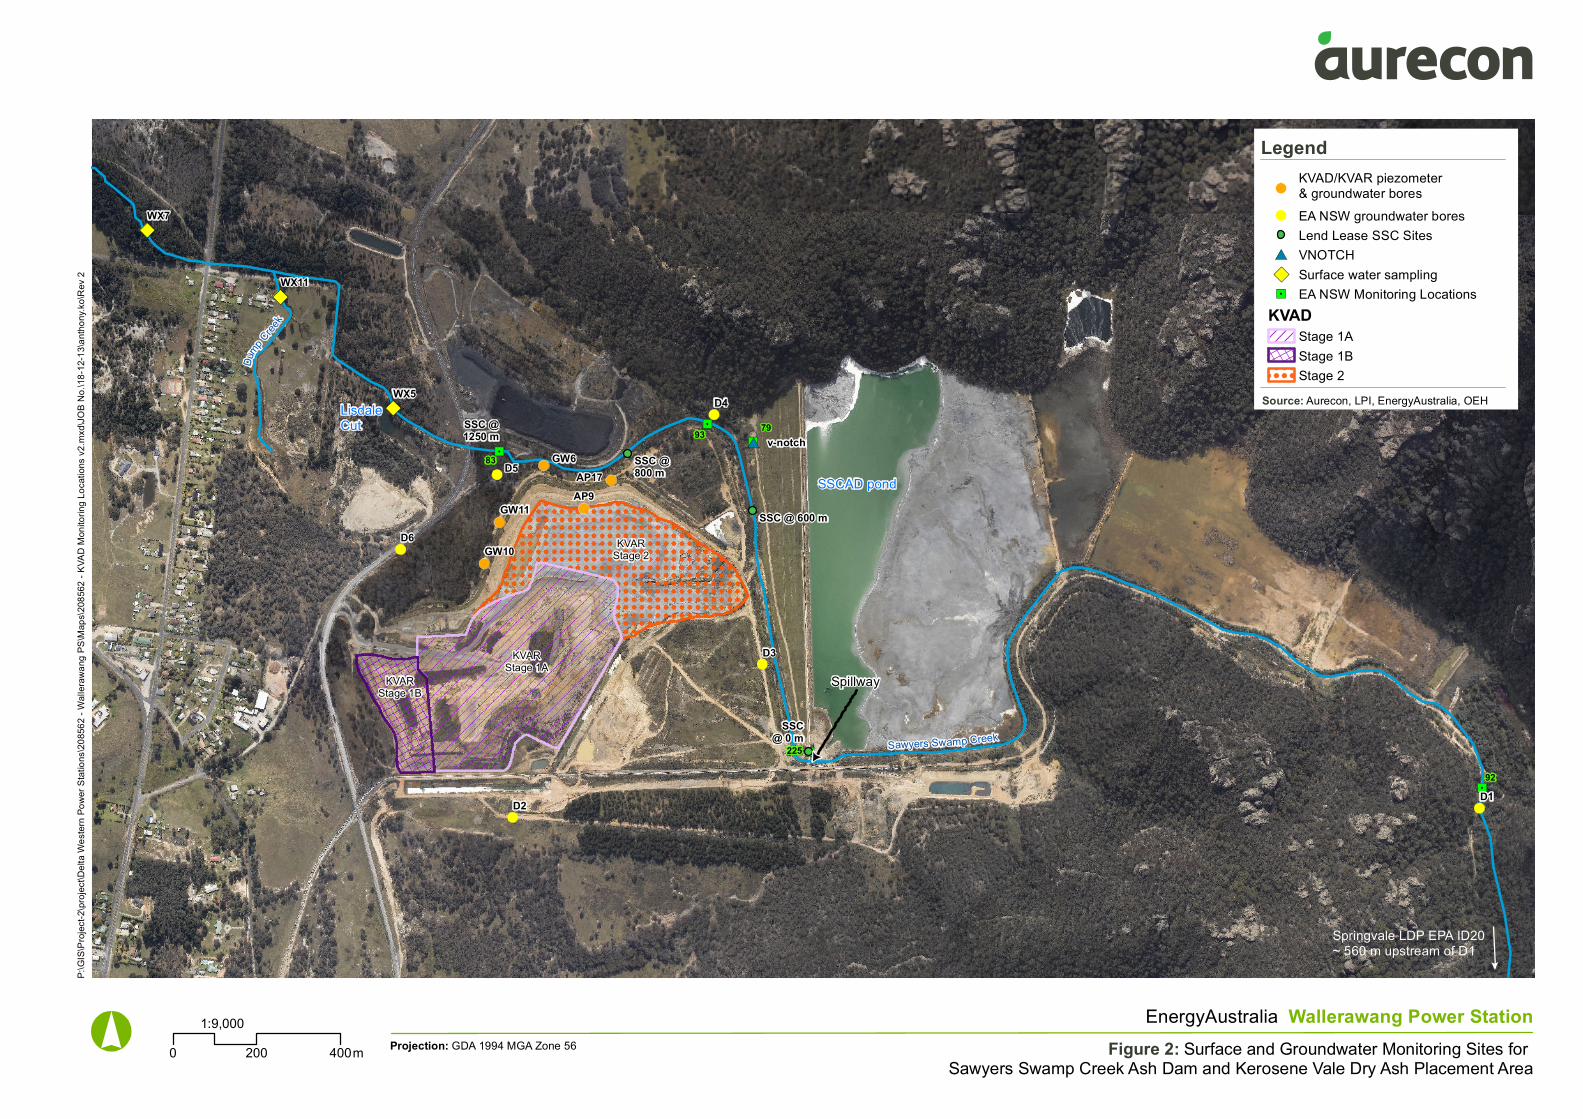
Figure 2: Surface and Groundwater Monitoring Sites for Sawyers Swamp Creek Ash Dam and Kerosene Vale Dry Ash Placement Area
Figure 3: Sawyers Swamp Creek Conductivity and Alkalinity Variations from February, 2010 to March, 2013 at sites upstream and downstream of the v-notch (downstream site is upstream of KVAD seepage). Conductivity data is shown from before and after August, 2012
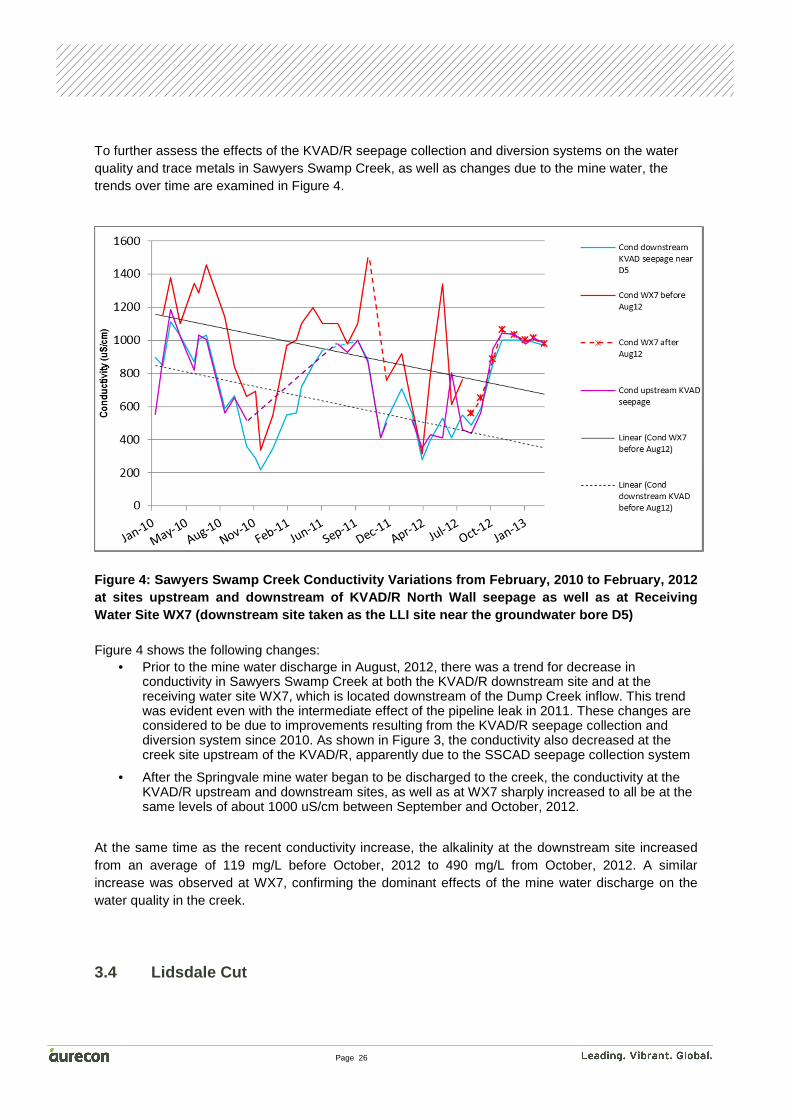
Figure 4: Sawyers Swamp Creek Conductivity Variations from February, 2010 to February, 2012 at sites upstream and downstream of KVAD/R North Wall seepage as well as at Receiving Water Site WX7 (downstream site taken as the LLI site near the groundwater bore D5)
Figure 5: Lidsdale Cut (WX5) Conductivity compared to KVAD Seepage Detection Bores D5 and D6 Conductivity and the KVAD Groundwater Level decrease at Piezometer APA10 from October, 2010 to March, 2013
Figure 6: Kerosene Vale Ash Dam and Stage 1 and Stage 2 Dry Ash Repository Groundwater Level (RL m) Contours with Inferred Flow Directions (from sketch provided by Lend Lease Infrastructure to EnergyAustralia NSW)
Figure 7: Sawyers Swamp Creek Ash Dam Long-term Trends in Conductivity, Sulphate, Boron and Trace Metals
Figure 8: Sawyers Swamp Creek Ash Dam Seepage Detection Bore WGM1/D4 Long-term Trends in Conductivity, Sulphate and Boron
Figure 9: Kerosene Vale Ash Dam Seepage Detection Bore WGM1/D5 Long-term Trends in Conductivity, Sulphate and Boron (Periods for Stage 1 placement and capped since 2003; Stage 2A, including initial Stage 2 since April 2009; Blocked toe drains and Subsurface drain seepage are shown)
Figure 10: Lidsdale Cut Long-term Trends in Conductivity, Sulphate and Boron from 2001 to June, 2012 Compared to the Pre-Stage I Baselines (Periods for Blocked toe drains from April, 2007 and KVAR Stage 2 Sub-surface drains from October, 2010 are shown)
Figure 11: Sawyers Swamp Creek Long-term trends in Conductivity, Sulphate and Boron in relation to baseline and goals and the SSCAD Conductivity (halved) and Periods shown for the blocked KVAD toe drains, Springvale Mine water discharge and pipeline leak, SSCAD pump-back and KVAD/R seepage collection and diversion to Lidsdale Cut
Attachments Attachment 1: Lithgow Rainfall Data from January, 2000 to March, 2013 (mm/month) from
Bureau of Meteorology Attachment 2: Wallerawang Power Station Ash Dam, Surface Water and Groundwater Quality
Stage 2 Data from February, 2012 to March, 2013
Page iv

Page | v
Summary
Aurecon was engaged by EnergyAustralia NSW to assess: • The changes, if any, in surface and groundwater quality due to the seepage collection and
diversion systems at: o the Sawyers Swamp Creek Ash Dam (SSCAD) v-notch pump-back system o sub-surface drains in the Kerosene Vale Ash Dam (KVAD) under the dry ash
Kerosene Vale Ash Repository (KVAR) o diversion of the KVAD groundwater to Lidsdale Cut via the unblocked KVAD toe
drains o diversion of the Lidsdale Cut discharge from Sawyers Swamp Creek (SSC) to the
Sawyers Swamp Creek Ash Dam (SSCAD) • The effects of the Stage 1 and Stage 2A dry ash placements on surface and groundwater
receiving waters with the effects of the local coal mining and the Springvale Mine water discharge taken into account.
The assessment of surface and groundwater quality found that the seepage collection and diversion systems have reduced the salinity (conductivity), sulphate and trace metals in the local groundwater bores at the KVAD/R such that, other than the local mineral effects, the water quality and trace metals met the local/ANZECC (2000) guidelines. The resulting conditions in Lidsdale Cut were greatly improved so that all the elements met the local/ANZECC (2000) guidelines. These reductions provided evidence that the Stage 1 and Stage 2 dry ash placements are not measurably affecting the groundwater quality.
This, together with the local KVAD/R seepage and more detailed measurements in Sawyers Swamp Creek, indicated no significant effects on the creek receiving waters. In addition, although the seepage from the SSCAD was found to influence the salinity (conductivity) in Sawyers Swamp Creek, the creek salinity was decreasing and there was no significant effect on the trace metals.
In contrast with the improved water quality and trace metals in the groundwater and Lidsdale Cut, the water quality at the Sawyers Swamp Creek receiving water site was elevated in trace metals. This appeared to be associated with mine spoil groundwater seepage into the creek after a heavy rainfall event.
Since mid- to late 2012, the Springvale Mine water inflows have altered the water quality and trace metal concentrations in Sawyers Swamp Creek, thereby compromising future assessments of the SSCAD and KVAD/R effects on the creek. It is recommended that the SSCAD and KVAD/R seepages, Sawyers Swamp Creek and the mine water continue to be monitored so that the effects of the mine water and local background conditions are not assigned by others to the ash placement activities.

Page 1
1. Introduction Wet slurry ash placement from Wallerawang Power Station was originally deposited in the Kerosene Vale Ash Dam (KVAD). When the KVAD was full of ash, wet ash placement was directed to the Sawyers Swamp Creek Ash Dam (SSCAD) and ultimately the KVAD was capped with clay. Ash placement in the SSCAD was ultimately ceased1 and dry ash was placed on top of the clay capping of the KVAD.
In 2002, Delta Electricity (now EnergyAustralia NSW) obtained approval for conversion of the wet slurry ash placement process at Wallerawang Power Station to dry ash. The dry placement is called the Kerosene Vale Ash Repository (KVAR). Stage 1 of the placement was completed and capped in February, 2009. Approval was obtained for further placement in the Stage 2 Area at the KVAR in November, 2008. The Stage 2 Area placement began in April, 2009 and its second phase began on 19th January, 2012. This placement is ongoing. During the Stage 2 dry ash placement, EnergyAustralia NSW installed seepage collection and diversion systems underneath the KVAR and reinstated the KVAD toe drains to minimise effects on the local groundwater and Sawyers Swamp Creek. These works are described in the next Section. Aurecon has been engaged by EnergyAustralia NSW to assess the combined effects of the Stage 1 and Stage 2 dry ash placements on surface and groundwater quality in receiving waters, including the current reporting period from February, 2012 to March, 2013. The study is to take into account the potential benefits of the seepage collection and diversion works described in the next Section, as well as any influences of Springvale Mine water inflows and other, non-ash related, catchment inputs to SSC, as well as the local background conditions.
1.1 Background With placement of dry ash on top of the KVAD, seepage from the KVAD to Sawyers Swamp Creek (SSC) increased. As a result, it became necessary to install a new sub-surface drain in the area under the KVAR placement to collect and divert seepage to Lidsdale Cut by connection to the existing KVAD toe drains that feed onto Lidsdale Cut. Installation was completed in October, 2010. The works undertaken involved unblocking of the KVAD toe drains, which had been identified in a previous report as affecting the local groundwater quality. The seepage collection and diversion system was designed to lower the groundwater table in the KVAD to at least 1 metre below the clay capping, which forms the base of the KVAR’s dry ash placement. The groundwater level decrease was to minimise seepage from the KVAD to Sawyers Swamp Creek. A schematic of the seepage diversion system is shown in Figure 1. The subsurface drains are underneath the eastern section of the stage 2 area of the KVAR. Subsurface drains were not required in the north-western section of Stage 2 because seepage from the KVAD drains to the toe drains at the base of the dam wall. The toe drains on the western side of Stage 2 extend along the area near the internal bores GW10 and GW11. On the north side, the
1 Energy Australia NSW still have the capability to use the Sawyers Swamp Creek Ash Dam for the placement of economiser grit, mill rejects, residual ash from the wash down system and emergency ash placement if necessary.
Page 2
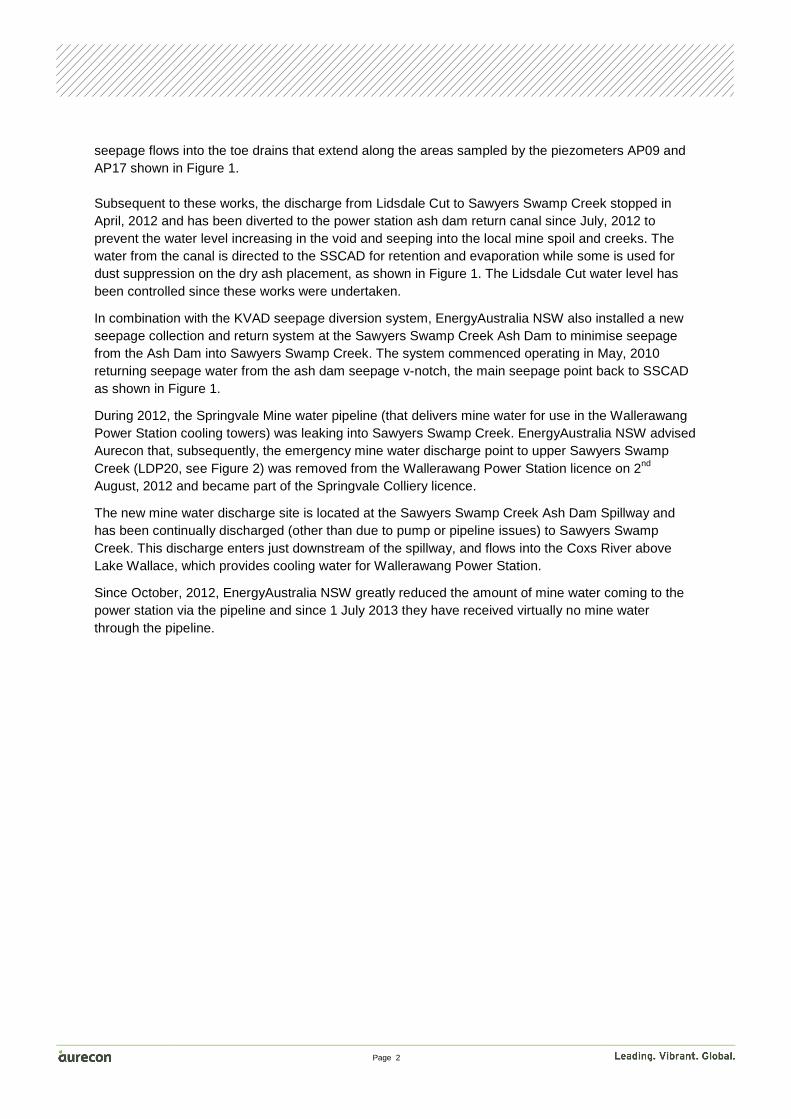
seepage flows into the toe drains that extend along the areas sampled by the piezometers AP09 and AP17 shown in Figure 1. Subsequent to these works, the discharge from Lidsdale Cut to Sawyers Swamp Creek stopped in April, 2012 and has been diverted to the power station ash dam return canal since July, 2012 to prevent the water level increasing in the void and seeping into the local mine spoil and creeks. The water from the canal is directed to the SSCAD for retention and evaporation while some is used for dust suppression on the dry ash placement, as shown in Figure 1. The Lidsdale Cut water level has been controlled since these works were undertaken.
In combination with the KVAD seepage diversion system, EnergyAustralia NSW also installed a new seepage collection and return system at the Sawyers Swamp Creek Ash Dam to minimise seepage from the Ash Dam into Sawyers Swamp Creek. The system commenced operating in May, 2010 returning seepage water from the ash dam seepage v-notch, the main seepage point back to SSCAD as shown in Figure 1.
During 2012, the Springvale Mine water pipeline (that delivers mine water for use in the Wallerawang Power Station cooling towers) was leaking into Sawyers Swamp Creek. EnergyAustralia NSW advised Aurecon that, subsequently, the emergency mine water discharge point to upper Sawyers Swamp Creek (LDP20, see Figure 2) was removed from the Wallerawang Power Station licence on 2nd August, 2012 and became part of the Springvale Colliery licence.
The new mine water discharge site is located at the Sawyers Swamp Creek Ash Dam Spillway and has been continually discharged (other than due to pump or pipeline issues) to Sawyers Swamp Creek. This discharge enters just downstream of the spillway, and flows into the Coxs River above Lake Wallace, which provides cooling water for Wallerawang Power Station.
Since October, 2012, EnergyAustralia NSW greatly reduced the amount of mine water coming to the power station via the pipeline and since 1 July 2013 they have received virtually no mine water through the pipeline.
SSCAD pond
LisdaleCut
Spillway
Slotted seepageline
Seepage Line
Concrete Drain (open)
KVAD
toe
drai
n
Pump to Return WaterCanal and Wheel Wash or Water Cart Use
Wheel Wash andWatercart Fill Point
Subsurface Drain
Return Water Canal
Surface Runoff Outflow Pumped to SSCAD
SSC@ 0 m
SSC @ 600 m
SSC @800 m
SSC @1250 m
D2
D3
D4
D5
D6
GW6
GW10
GW11
AP17
AP9
v-notch
WX5
225
7993
83
Stage 2
Stage 1AStage 1B
Sump 1
Sump 3
Sump 2
Figure 1: Schematic of Kerosene Vale Dry AshPlacement Area Seepage Diversion works
EnergyAustralia Wallerawang Power Station
Source: Aurecon, EnergyAustralia
Legend
0 100 200m
P:\G
IS\P
roje
ct-2
\pro
ject
\Del
ta W
este
rn P
ower
Sta
tions
\208
562
- Wal
lera
wan
g PS
\Map
s\20
8562
- K
VAD
Gro
undw
ater
Flo
w M
odel
201
3.m
xd\J
OB
No.
\18-
12-1
3\an
thon
y.ko
\Rev
0
1:5,000Projection: GDA 1994 MGA Zone 56
Groundwater Flow
Surface Water Flow
Surface runoff collection pond
EA NSW groundwater bores
Lend Lease SSC Sites
VNOTCH
Surface water sampling
EA NSW Monitoring Locations
Sumps
KVADStage 1A
Stage 1B
Stage 2
CAD survey data
KVAD/KVAR piezometers& groundwater bores
Page 4
1.2 Aims and Objectives EnergyAustralia NSW has advised Aurecon that they have completed their annual review of the Development Consent conditions of approval for KVAR Stage 2 and require an understanding of any changes in the water quality in Sawyers Swamp Creek following the implementation of the KVAR and SSCAD seepage collection and diversion works and diversion of the Lidsdale Cut discharge to the SSCAD, and confirmation that the KVAR is not interfering with local surface and groundwater quality.
One of the primary objectives of the design and operation of the KVAR is to have no adverse impact on the local ground or surface water quality. More specifically, this means that leachates from the dry ash placement should not increase concentrations of the various water quality characteristics in the receiving waters by more than the locally derived guidelines (based on the 90th percentile of the background, pre-placement sites) or the ANZECC (2000) guidelines for protection of aquatic life, whichever is higher. As indicated in previous reports, it has been necessary to establish local guidelines for some elements, due to the effects of mineralisation (coal bearing strata) in the ash placement area. The ANZECC (2000) guideline default trigger values and the locally derived guidelines are shown in Table 1, Section 2.7.
1.3 Previous Report The previous report (Aurecon, 2012) found that the initial KVAR Stage 2 Area dry ash placement was having insignificant or undetectable effects on surface or groundwater quality, including selenium, in receiving waters due to:
• limited rainfall infiltration into the groundwater due to the dry ash itself and compaction by machinery
• collection of the dry ash rainfall runoff and diversion to the SSCAD via the return canal
• placement of the dry ash on the clay capping of the KVAD and its limited permeability
• the sub-surface drain under the KVAR:
o lowered the groundwater table, which kept the KVAR placement dry
o reduced effects of the KVAD seepage on the local groundwater quality
• benefits of unblocking KVAD toe drains
• attenuation of selenium in ash leachate due to uptake by local soils or mine spoil
• effects of Springvale Mine water leaking from the pipeline into Sawyers Swamp Creek
• the highly mineralised nature of the catchment.
The seepage collection and diversion systems that had been installed at that time had reduced the salinity (conductivity), sulphate and trace metals in the KVAD local groundwater seepage to Sawyers Swamp Creek and in Lidsdale Cut. These reductions provided evidence that the Stage 1 and Stage 2A dry ash placements are not measurably affecting the surface and groundwater quality. Potential effects on the water quality at the Sawyers Swamp Creek receiving water site could not be confirmed due to leaks from the Springvale Mine water pipeline and other, non-ash related, catchment inputs into the creek. Further monitoring was recommended to assess the situation once the Springvale Mine water leak had been stopped from entering the creek.
Page 5
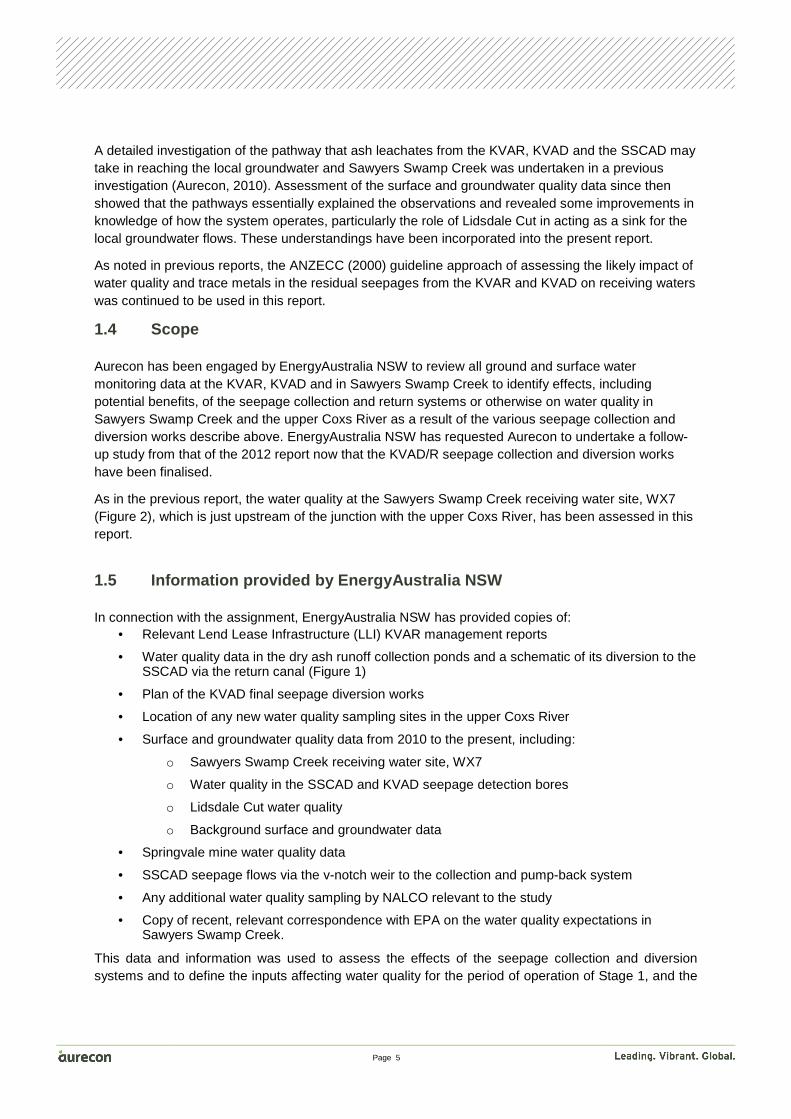
A detailed investigation of the pathway that ash leachates from the KVAR, KVAD and the SSCAD may take in reaching the local groundwater and Sawyers Swamp Creek was undertaken in a previous investigation (Aurecon, 2010). Assessment of the surface and groundwater quality data since then showed that the pathways essentially explained the observations and revealed some improvements in knowledge of how the system operates, particularly the role of Lidsdale Cut in acting as a sink for the local groundwater flows. These understandings have been incorporated into the present report.
As noted in previous reports, the ANZECC (2000) guideline approach of assessing the likely impact of water quality and trace metals in the residual seepages from the KVAR and KVAD on receiving waters was continued to be used in this report.
1.4 Scope Aurecon has been engaged by EnergyAustralia NSW to review all ground and surface water monitoring data at the KVAR, KVAD and in Sawyers Swamp Creek to identify effects, including potential benefits, of the seepage collection and return systems or otherwise on water quality in Sawyers Swamp Creek and the upper Coxs River as a result of the various seepage collection and diversion works describe above. EnergyAustralia NSW has requested Aurecon to undertake a follow-up study from that of the 2012 report now that the KVAD/R seepage collection and diversion works have been finalised.
As in the previous report, the water quality at the Sawyers Swamp Creek receiving water site, WX7 (Figure 2), which is just upstream of the junction with the upper Coxs River, has been assessed in this report.
1.5 Information provided by EnergyAustralia NSW In connection with the assignment, EnergyAustralia NSW has provided copies of:
• Relevant Lend Lease Infrastructure (LLI) KVAR management reports
• Water quality data in the dry ash runoff collection ponds and a schematic of its diversion to the SSCAD via the return canal (Figure 1)
• Plan of the KVAD final seepage diversion works
• Location of any new water quality sampling sites in the upper Coxs River
• Surface and groundwater quality data from 2010 to the present, including:
o Sawyers Swamp Creek receiving water site, WX7
o Water quality in the SSCAD and KVAD seepage detection bores
o Lidsdale Cut water quality
o Background surface and groundwater data
• Springvale mine water quality data
• SSCAD seepage flows via the v-notch weir to the collection and pump-back system
• Any additional water quality sampling by NALCO relevant to the study
• Copy of recent, relevant correspondence with EPA on the water quality expectations in Sawyers Swamp Creek.
This data and information was used to assess the effects of the seepage collection and diversion systems and to define the inputs affecting water quality for the period of operation of Stage 1, and the

Page 6
current operations of the Stage 2 placement, and their effects on local surface and groundwater quality.
1.6 Data Quality The data contained in this report was provided by EnergyAustralia NSW and LLI. Examination of the data provided for the SSCAD showed that a data transfer error had occurred in the previous report. Accordingly, the data in Attachment 2 includes the previously provided data for the SSCAD from April, 2010 to January, 2012, as well as the current data from February, 2012 to March, 2013. The EnergyAustralia NSW and LLI data was checked for outliers using the ANZECC (2000) protocol. In accordance with the protocol, outliers of three times the standard deviation from the mean were removed from the dataset, provided that no environmental changes had occurred that could account for such a significant change. Outliers have an asterisk next to the data in Attachment 2, thereby stopping the result from being used in statistical analyses by Excel. As the database covers a long period of observations, it is likely that apparent changes in concentrations for trace metals such as silver, cadmium, chromium, copper and mercury may in fact be due to changes in the accuracy or detection limits of the analytical techniques used. The OEMP requires the existing monitoring program to continue, with the addition of low detection limit analysis for trace metals (to ensure that the detection limit is lower than guideline values). All of the metals tested, except for silver, met these criteria. As the laboratory has not been able the test at the required detection limit, and in the absence of any reason to suppose that silver might be an issue in this case, it is suggested that silver be removed from the sampling program.
SSCAD pond
LisdaleCut
Spillway
SSC@ 0 m
SSC @ 600 m
SSC @800 m
SSC @1250 m
D1D2
D3
D4
D5
D6
GW6
GW10
GW11
AP17
AP9
v-notch
WX7
WX11
WX5
225
7993
83
92
KVARStage 2
KVARStage 1A
KVARStage 1B
Dum
p Creek
Sawyers Swamp Creek
Figure 2: Surface and Groundwater Monitoring Sites for Sawyers Swamp Creek Ash Dam and Kerosene Vale Dry Ash Placement Area
EnergyAustralia Wallerawang Power Station
0 200 400m
P:\G
IS\P
roje
ct-2
\pro
ject
\Del
ta W
este
rn P
ower
Sta
tions
\208
562
- Wal
lera
wan
g PS
\Map
s\20
8562
- K
VAD
Mon
itorin
g Lo
catio
ns v
2.m
xd\J
OB
No.
\18-
12-1
3\an
thon
y.ko
\Rev
2
1:9,000Projection: GDA 1994 MGA Zone 56
LegendKVAD/KVAR piezometer& groundwater bores
EA NSW groundwater boresLend Lease SSC SitesVNOTCHSurface water samplingEA NSW Monitoring Locations
KVADStage 1AStage 1BStage 2
Source: Aurecon, LPI, EnergyAustralia, OEH
Springvale LDP EPA ID20~ 560 m upstream of D1
Page 8
2. Surface and Groundwater Quality Monitoring This Section provides an overview of the groundwater and surface water quality monitoring at the KVAD and KVAR used for assessment of effects, if any, of leachates on the local surface and groundwater quality. Due to the local inputs from coal mining activities in the area, the assessment takes into account the background conditions and provides the locally derived and ANZECC (2000) guideline trigger values, which apply as assessment criteria to the receiving waters. The discharge of Springvale Mine water to Sawyers Swamp Creek has also been taken into account.
2.1 Monitoring Design for Differentiation of Water Quality Sources The locations of the surface and groundwater sampling sites for the various ash dams and repositories are shown in Figure 2 and are described in this Section. Surface and groundwater quality monitoring is undertaken by EnergyAustralia NSW for assessment of the environmental performance of the KVAR ash placement as well as seepage effects from the KVAD and SSCAD.
The assessment of the KVAR effects on receiving water sites depends upon separating the effects of leachates from the KVAD, which is beneath the KVAR, local coal mine inputs and leachates and runoff effects, if any, from the KVAR itself. To do this, groundwater bore locations were established to provide baseline conditions well before dry ash placement began and the bores are located up- and down-gradient of the KVAD/R, as well as for the SSCAD.
The water quality monitoring is undertaken to confirm that the local/ANZECC (2000) guidelines (as applicable) are met in the groundwater bores D5 and D6 and in Sawyers Swamp Creek at WX7 and to enable contingency actions and investigations to be initiated in a timely manner if these limits are approached.
2.1.1 Groundwater Monitoring
The up-gradient bores (WGM4/D1 and D2) allow for the effects of various local sources of groundwater flowing into the KVAD/R and SSCAD areas. The down-gradient bores (WGM4/D3 and D4) are located for detection of the SSCAD seepage and bores WGM4/D5 and D6 are the seepage detection bores for the KVAD/R. These down-gradient bores also sample the combined effects of the local up-gradient inputs as well as those from the SSCAD and the KVAD and the KVAR. Details of the monitoring design were set out in Aurecon (2012).
In addition, Figure 6 indicates that the groundwater at bore D4 mainly flows to Sawyers Swamp Creek. However, as the groundwater seepage is expected to be slower than that from the much higher hydraulic head in the SSCAD, the SSCAD seepage effects on the creek, if any, would be expected to override any groundwater effects. 2.1.2 Surface Water Monitoring The surface water monitoring sites comprise:
• Lidsdale Cut (WX5), which discharged to Sawyers Swamp Creek until April, 2012
Page 9
• The final receiving water site, WX7, in Sawyers Swamp Creek, which is downstream of Lidsdale Cut and the local background site, WX11, in Dump Creek and upstream of the junction with Sawyers Swamp Creek and the upper Coxs River (Figure 2).
Site WX7 is the receiving waters where the local/ANZECC (2000) freshwater guideline trigger values apply for assessment of seepage effects from KVAD, KVAR, Lidsdale Cut and SSCAD. Site WX5, samples local coal mine groundwater seepage, surface runoff and the KVAD toe drains, which previously entered Sawyers Swamp Creek but has been pumped to the SSCAD since July, 2012. EnergyAustralia NSW has been unable to monitor the water quality in the Lidsdale Cut void since July, 2012 due to drawdown of the void water level by the pumps that direct the water to the SSCAD. 2.1.3 Sampling in Upper Sawyers Swamp Creek As recommended in the previous report, monitoring at selected sites in the creek (Figure 2) has been undertaken by EnergyAustralia NSW and the ash dam contractor (LLI) has continued to monitor at all five sites shown in Figure 2. The sites labelled “@” are monitored by LLI but only limited water quality data, such as conductivity, is collected. EnergyAustralia NSW samples at numbered sites, eg 93, which have detailed monitoring, including conductivity, alkalinity and trace metals and sampling began in June, 2012. To put the creek sampling sites into context of the location of the SSCAD v-notch, it should be noted that site SSC@600m is about 165 m upstream, and there are two sites downstream at Site 93 (165 m downstream) and at Site SSC@800m (about 300m downstream), see Figure 2. The water quality data for the two downstream sites was combined to assess the effects, if any, of the SSCAD seepage on the creek. Conductivity was the only characteristic consistently monitored and it was used to indicate changes in water quality due to the pump-back system. A change in alkalinity at Site 93 was used as a tracer for effects of the mine water discharge. EnergyAustralia NSW added a new site in Sawyers Swamp Creek, upstream of the SSCAD, site 92, which is the creek background water quality site. This site is also the original Delta Electricity upstream site, WX1, which has not been sampled since March, 1992, so the data for this site during the current reporting period has been added to Attachment 2 in Part 3. The EnergyAustralia NSW monitoring is more detailed than that of LLI, including conductivity, alkalinity and trace metals. Sampling began in June, 2012. The ash dam contractor has continued to monitor at their four sites shown in Figure 2, but only limited water quality data, such as pH, conductivity and sulphate, is collected. The following sites are sampled in Sawyers Swamp Creek and used in this report. This includes sites sampled by EnergyAustralia NSW and LLI:
• Site 92, in Sawyers Swamp Creek, upstream of the SSCAD
• SSC upstream @ 0m, located immediately downstream of the Sawyers Swamp Creek Ash Dam Spillway, where the Sawyers Swamp Creek bypass water re-enters the creek. Since August, 2012 it also includes the Springvale Mine water discharge that enters the creek at the same location. It is labelled as SSC at SSCAD Spillway in the water quality graphs in Section 3.

Page 10
• SSC@600m upstream of the SSCAD V-notch (not sampled by EnergyAustralia NSW)
• Site 79, the main SSCAD seepage point v-notch.
• SSC@800m downstream of the V-notch and upstream of the KVAR north wall seepage pond,the EnergyAustralia NSW site 93 is located downstream of the V-notch.
• SSC@1250m downstream of the KVAD seepage pond.
The following notes and assumptions apply to these monitoring sites:
• The v-notch upstream site, SSC@600m, is about 165 m upstream
• Monitoring at the v-notch, site 79, began in February, 2010 to define the concentrations of water quality and trace metals seeping from the SSCAD to Sawyers Swamp Creek. It is assumed that concentrations in the v-notch are representative of the concentrations in all the seepage from under the dam wall into the creek as shown in Section 4, Figure 6. It is also likely that the seepage under the dam wall is at a slower rate than that in the v-notch
• The two sites downstream of the v-notch are Site 93 (165 m downstream of the v-notch) and at Site SSC@800m (about 300m downstream of the v-notch), see Figure 2. These sites are also used as the upstream sites for the KVAD north wall seepage pond. SSC@800m is about 100m upstream of the seepage pond
• The water quality and trace metal concentrations in the KVAD north wall seepage pond are assumed to be representative of all the seepage from under the KVAR placement into Sawyers Swamp Creek that was not possible to collect by the KVAD toe drains
• KVAD/R downstream site, SSC @1250m, is downstream of the northern section of the original KVAD dam wall.
These data, together with the routine, long-term Sawyers Swamp Creek data collected by EnergyAustralia NSW at the receiving water site, WX7, were used to identify any further improvements, above that found in the previous report, or otherwise, in water quality in Sawyers Swamp Creek as a result of the many changes mentioned above. 2.1.4 Other data considerations In addition to the many changes in seepage collections and diversions, the Springvale Mine water discharge has further complicated the assessment of effects of the KVAR. Accordingly, this report has taken into account the effects of these changes on the water quality in Sawyers Swamp Creek, as well as the local groundwater. In addition, a series of high rainfall events occurred during summer, or late summer, in 2010/11, 2011/12 and 2012/13 and the effects of these events on the local water quality have been taken into account. The potential for water quality changes due to the seepage collection and diversion systems are assessed in Section 3 using changes in conductivity at the various sampling sites in the upper Sawyers Swamp Creek and at the WX7 receiving water site. These changes then allowed assessment of the cause of changes in trace metal concentrations. Effects of the KVAR Stage 2 placement on surface water quality and trace metal changes are assessed against the environmental goals, and according to the ANZECC guidelines, and discussed in Section 5.
2.2 KVAR Site Monitoring and Runoff Management Rainfall runoff from the KVAR dry placement area is collected by an ash perimeter drain which directs the runoff to a Collection Pond. Some of the collected water is reused for dust suppression by
Page 11
spraying on the dry ash deposit. The collection pond is normally kept at a low level by continually pumping water to the power station return canal to prevent it from spilling into Sawyers Swamp Creek (Figure 2). Water quality data for the runoff collection ponds is shown in Attachment 2 Section 7. EnergyAustralia NSW’s contractor for ash placement at the KVAR, Lend Lease Infrastructure Services has installed piezometers at the site for sampling the groundwater height and water quality (bores GW6, 10 and 11 and AP9 and AP17, shown in Figure 2). This data, together with the water quality monitoring in Sawyers Swamp Creek from the SSCAD spillway to near the north-west side of the KVAR, was used for assessment of the potential improvements in water quality due to the seepage collection and diversion works.
2.3 Tracers for Dry Ash leachates As mentioned in previous reports, the main trace metals and elements of interest in the rainfall runoff from the KVAR ash placement area are selenium, sulphate, boron, nickel and zinc. The background conditions in Sawyers Swamp Creek, upstream of the SSCAD (site 92) shows that aluminium is naturally elevated in the area and averaged 0.71 mg/L during 2012/13 (Attachment 2, Section 7), so it is not used as a tracer for the dry ash placement. These elements, except selenium, are also present in the local mineralised coal geology of the area and are mainly due to the placement of mine spoil and chitter in the catchment. Chitter contains pyrites, which release sulphate and trace metals into the local groundwater and surface waters. Hence, selenium is used here as a tracer of the direct effects of the previous wet ash systems in the KVAD and SSCAD, as well as for the current dry ash placement on the local surface and groundwater. Long-term trends in surface and groundwater quality generally use conductivity to trace salinity effects, which in the mineralised area, tends to follow that of sulphate. Sulphate and boron trends are used to show changes due to coal mining activities and selenium concentrations are used as an indicator of flyash management effects. Selenium concentrations are examined for trends if they consistently exceed the ANZECC (2000) guideline of 0.005 mg/L. Boron is used to monitor the effects of coal mining activities and can be used to represent potential effects of other trace metals.
2.4 Groundwater Levels The water level in each groundwater bore is monitored to allow identification of the direction of water movement in the areas from up-gradient of the ash placement areas to Lidsdale Cut. The data are also used to confirm that the groundwater level in the KVAD is not reaching the dry ash placement above it. Bores WWGM1/D5 and D6 are situated down-gradient of the ash placement and up-gradient of the Lidsdale Cut to provide early detection of leachates from the KVAR placement area. Effects of the KVAR on groundwater level changes at these bores are also monitored. The monitoring data are shown in spread-sheet format in Attachment 2, including the minimums, maximums, means and post-dry ash median as well as the estimated baseline (pre-placement 90th percentile) and environmental goal concentrations. The data are also summarised in Tables in the body of the report.

Page 12
2.5 Climatic Conditions
The average annual rainfall at the Lithgow gauge over the period of KVAR ash placement from 2003 to March, 2013 increased from that during the previous reporting period to 797 mm/year (Attachment 1), which is 92% of the long-term average annual rainfall of 863 mm/year. During the period February, 2012 to March, 2013, the monthly average rainfall of 79 mm/month, was above the long-term average of 72 mm/month due to above average rainfall events in February/March, 2012 and 2013. Since the Stage 2A placement began in April, 2010, there has been a series of wet summers due to above average rainfall events. These occurred in summer 2010/11 (November, 2010 to January, 2011 with a total of 401mm), 2011/12 (February/March, 2012 with a total of 342 mm) and a similarly high rainfall event in February/March, 2013 with a total of 297 mm (see Attachment 1).
2.6 Methods Routine surface and groundwater water quality monitoring in the area is undertaken monthly on behalf of EnergyAustralia NSW by Nalco Analytical Resources who measure conductivity, pH and temperature in the field with a calibrated instrument. In house methods based upon Standard Methods (APHA, 1998) are used for the general water quality characteristics of alkalinity, sulphate, chloride, calcium, magnesium, sodium, potassium, total dissolved solids (TDS) and total suspended solids (TSS, also known as non-filterable residue, NFR). The trace metals and elements monitored are the same for surface and groundwater: copper, cadmium, chromium, lead, zinc, iron, manganese, mercury, selenium, silver, arsenic, barium, boron and fluoride. Molybdenum, nickel and beryllium have been monitored since July, 2007 but beryllium was stopped in April, 2010 and aluminium has been monitored since July, 2010.
EnergyAustralia NSW has advised that the in-house methods are equivalent to those specified in DEC (2004), which also uses Standard Methods. (In this regard, it is relevant to note that the groundwater and Sawyers Swamp Creek monitoring is not required under the POEO licence). Trace metals were unfiltered, except for iron and manganese.
Groundwater bores are bailed and sampled after allowing time for the water level in the bore to re-establish. The depth to the water level from the top of the bore pipe is measured using a dip meter and the water surface elevation is calculated to AHD(m) after allowing for the pipe height.
Since April, 2006 the detection limits (DL) for routine monitoring of most trace metals tested were lower than the ANZECC (2000) guidelines (Table 1). Particular attention has been directed at the trace metals arsenic, cadmium, chromium, copper, mercury, nickel and lead, as well as the trace element selenium, which have been analysed with a low detection limit. However, due to sample matrix interference, silver has continued to be analysed above the ANZECC guideline trigger value of 0.00005mg/L since November, 2001 (see Attachment 2).
2.7 Guidelines As used in previous reports, the principle of the ANZECC (1995) guidelines for protection of groundwater, where the potential future use of the water resource is considered, has been taken into account. In this regard, the Irrigation, Ecosystem and additional guidelines for protection of livestock or drinking water has been used, where appropriate, to provide a wider context of the ANZECC (2000) guidelines, to define acceptable ambient water quality at the KVAD/R Stage 2 receiving water sites.
Page 13
The ANZECC Guidelines for Groundwater Protection in Australia (1995) and the NEPC (1999, update in May, 2013) require the background water quality in groundwater bores to be taken into account. As the NEPC (1999), and the updated 2013 version, did not define the meaning of “background” concentrations for groundwater, the baseline concentrations were continued to be defined, as used in previous reports, as the 90th percentile of the pre-placement concentrations, or the ANZECC guideline default trigger values, whichever is higher. Use of the background 90th percentiles is taken from the ANZECC (2000) guideline procedure for condition 3, highly modified catchments, which generally occur in mineralised areas.
Local guidelines are based on the ANZECC (2000) guideline approach of estimating local guidelines using the 90th percentile for naturally mineralised, highly disturbed groundwater. Hence, the background 90th percentiles that are higher than the default trigger values, are used as the local guidelines. The local and ANZECC guideline trigger values used are called the Environmental Goals and are shown in Table 1.
The groundwater background concentrations use the pre-placement data from the background bore, WGM1/D2, and elevated concentrations at the seepage detection bore WGM1/D5 and Lidsdale Cut (WX5) were also taken into account. The surface water background concentrations use the pre-placement data at Dump Creek, WX11, which is the local background for the mineralised area. The pre-KVAR data at WX7 was also taken into account. The 90th percentile baseline concentrations for all the water quality characteristics monitored are shown in bold in Table 1.
As discussed in Section 2.1, the surface water guideline goals apply to the receiving waters of Sawyers Swamp Creek at WX7 (Figure 1). The groundwater goals apply to the seepage detection bore WGM1/D5, but not Lidsdale Cut (WX5) since July, 2012 (see Section 4.5), and these are used for early warning of potential effects on the Sawyers Swamp Creek receiving waters. These goals are used for assessment of the Stage 2 effects in this report. In recent times, the level of groundwater in bore D5 has decreased due to lowering of the groundwater under the KVAR by the toe drains and sub-surface drains and sample collection has been limited at times (see Section 4.4).

Page 14
Table 1: Pre-dry Ash Placement Water Quality Baseli ne 90th Percentile at Background and Receiving Water Sites and resulting Guidelines or Goals for KVAD/R Groundwater, Lidsdale Cut and Sawyers Swamp Creek
Groundwater Surface Water
Element
(mg/L)
Background
Groundwater
(WGM1/D2)
KVAD & KVAR
Groundwater
(WGM1/D5)
Lidsdale Cut
(WX5)
Dump Creek
(WX11)
Sawyers Swamp
Creek (WX7)
Pre-
Placement
(1988-2003)
90th Percentile
Pre-Placement
(1988-2003)
90th Percentile
Pre-Placement
(1992-2003) 90th
Percentile
Groundwater
Guidelines# or
Goals
Pre-placement
(1991-2003)
90th Percentile
Pre-placement
(1991-2003) 90th
Percentile
Surface Water
Guidelines# or
Goals
pH 5.4 4.5 6.9 6.5 – 8.0 8.0 7.6 6.5 – 8.0
Cond/
(µS/cm) 310 810 952 2600^ 770 760 2200
TDS 258 550 650 2000++ 772 584 1500^
SO4 61 328 359 1000 325 323 1000 ++
CI 48 24 34 350 39 27 350 +
As <0.001 0.008 <0.001 0.024 <0.001 <0.001 0.024
Ag <0.001* <0.001* <0.001* 0.00005 <0.001 <0.001* 0.00005
Ba 0.114 0.148 0.054 0.7 0.050 0.043 0.7 +++
Be - 0.006 - 0.1 - - 0.1
B 0.10 1.7 2.16 1.7 1.45 2.33 1.25
Cd 0.001 0.004 <0.001 0.001 <0.001 <0.001 0.0015
Cr 0.041 0.041 <0.006 0.004 <0.001 <0.001 0.005
Cu 0.010 0.058 <0.005 0.005 0.002 <0.007 0.005
F 0.28 0.65 1.99 1.5 1.1 1.1 1.5+++
Fe 1.7 14.7 0.7 1.7 2.38 0.507 0.3+++
Hg <0.0007* <0.0006 <0.0002* 0.00006 <0.0002* <0.0002* 0.00006
Mn 0.44 2.5 2.12 1.9 1.94 0.829 1.9
Mo - - - 0.01 - - 0.01 +
Ni 0.031 0.137 - 0.137 - - 0.05
Pb 0.010 0.021 0.004 0.01 <0.001 0.003 0.005
Se <0.001 0.001 0.001 0.005 0.003 0.003 0.005
Zn 0.114 0.505 0.304 0.505 0.28 0.153 0.153
Page 15
Notes:
* Detection limit used was higher than ANZECC guidelines
^ ^ Groundwater conductivity derived from TDS 90th percentile of 2000 mg/L TDS/0.77; Creek TDS derived from 0.68 x 2200 µS/cm, which is the
ANZECC (2000) low land river conductivity for protection of aquatic life
# ANZECC (2000) guidelines for protection of freshwaters, livestock or irrigation water.
Cadmium, Chromium, Copper, lead, nickel and zinc adjusted for effects of hardness: Ca, Mg in WGM1/D5 22.3, 29.0 mg/L: in Sawyers Swamp
Creek 51.6, 38.0 mg/L, respectively
Note: Chromium guideline is 1 ug/L for CrVI and adjusted for hardness effect
Local guidelines using 90th percentile of pre-dry placement data in bold (Note: Fe guideline of 0.3 mg/L only marginally lower than
WX7 90th percentile so used ANZECC (2000) guideline)
+ Irrigation water moderately tolerant crops; irrigation. Note: Molybdenum drinking is 0.05 mg/L
++ Livestock
+++ drinking water
As mentioned in previous reports, the adoption of the surface water conductivity guideline of 2,200µS/cm shown in Table 1 was based on the background Dump Creek site, WX11, and the Sawyers Swamp Creek receiving water site, WX7, both having 90th percentile conductivity of more than twice the ANZECC (2000) guideline default upland river trigger value of 350 µS/cm (upland rivers are defined as above 150m altitude). The 90th percentile concentration at the Dump Creek site demonstrates that this was caused by local mineralisation effects, so use of the upland value was not considered appropriate. As a result, the higher ANZECC (2000) lowland (altitude below 150m) river conductivity trigger value of 2,200 µS/cm was used for protection of aquatic life in Sawyers Swamp Creek (Connell Wagner, 2008). This approach has proven to be appropriate because the background conductivity at WX11 increased to about 1400 uS/cm in the 2010/12 reporting period, apparently due to diffuse effects of coal mining activities in the area (Aurecon, 2012). Although the background groundwater bore, D2, 90th percentile conductivity was lower than the upland river trigger value of 350 µS/cm, the pre-dry ash placement 90th percentiles at the KVAD groundwater bore D5, as well as the Lidsdale Cut conductivities, were higher than in the creeks. As groundwater seepage into Sawyers Swamp Creek would be slow, use of the creek trigger value was not considered appropriate for groundwater. As mentioned in previous reports, the approach adopted was the ANZECC (1995) guidelines for protection of groundwater, where the potential future use of the water resource is taken into account. As shown in Table 1, the livestock drinking water guideline for salinity, of 2,000 mg/L TDS, was considered relevant to the assessment of groundwater in the area, should the groundwater be used for watering livestock in the future (Connell Wagner, 2008). The TDS was converted to the conductivity local trigger value of 2,600 µS/cm by dividing by the conversion factor 0.77, which was derived from the measured groundwater conductivity and TDS. 2.7.1 Receiving Waters As discussed in Section 2.1 and (Aurecon 2012), previous reports identified the following receiving water sites for assessment of ash leachate effects from the KVAR dry ash placement:
• Groundwater bore WGM1/D5

Page 16
• Lidsdale Cut (sampling site WX5)
• Sawyers Swamp Creek at site WX7.
The following provides clarification of how the receiving water sites are used to assess effects fo the SSCAD and KVAR. With the various collection systems in place, the Sawyers Swamp Creek site is the final receiving water site for the residual SSCAD, KVAD and KVAR seepages, and the now Lidsdale Cut seepage. Site WX7 also receives inflows from the local background catchment of Dump Creek and groundwater inflows to the creek from areas where it flows through the coal measures upstream of the KVAD/R. Bore WGM1/D5 represents the groundwater receiving water site for seepage from the KVAD/R that was not collected by the KVAD toe drains or the KVAR sub-surface drains that are directed to Lidsdale Cut via the KVAD toe drains. Consequently, the water quality in Lidsdale Cut, in addition to that at bore D5, has continued to be used for early warning of potential effects of groundwater in the water quality at WX7. Hence, WX7 is the final receiving water site for the ash placement areas. This approach was used in previous reports and has been used here for the current assessment. As EnergyAustralia NSW has begun routinely monitoring of the water quality in the upper Sawyers Swamp Creek where it flows through the coal measures upstream of the KVAD/R, changes in surface water quality at WX7 were assessed by comparison with these upstream sites, as well as the catchment background water quality in Dump Creek at WX11. 2.7.2 Early Warning of Water Quality Changes An early warning of changes in water quality that may potentially approach the relevant local guidelines set out in Table 1 is required for the ash repository management to allow time for investigations of the causes of changes and controls to be implemented if necessary. The approach used is the ANZECC (2000) guideline procedure for developing triggers for investigations of the cause of changes, and possible management actions. This approach involves comparing the 50th percentile (median) in receiving waters with the 90th percentile of the background or pre-KVAR water quality at the receiving water sites. An early warning of changes is signalled when the post-placement 50th percentile exceeds the pre-placement 90th percentile water quality conditions. This approach is supplemented by the use of Control Charts to show concentration changes relative to local/ANZECC trigger values and the 90th percentile pre-KVAR conditions. These procedures are applied to each down-gradient groundwater bore, the Lidsdale Cut and Sawyers Swamp Creek at WX7 to assess long-term changes that are approaching the local/ANZECC trigger values.
2.8 Control Charts Long-term plots are used to allow the identification of trends against the baseline and environmental goals. The trends are tracked using Control Charts (APHA Standard Methods, 1995 and ANZECC guidelines for Monitoring and Reporting, 2000) and the significance of any changes is determined by comparison with the criteria of pre-placement 90th percentiles, post-placement medians, ANZECC (2000) guidelines or local guidelines. As the ANZECC guidelines apply to the receiving waters of Sawyers Swamp Creek, Lidsdale Cut and the KVAD and Stages I and II seepage detection bore D5, the trends over time are graphed against these environmental goals.

Page 17
Investigations are indicated when the control chart shows that the post-placement median has exceeded the pre-placement 90th percentile. The medians are updated with data for each reporting period. If the investigation of the increase shows that it is likely to be due to the ash placement, early intervention may be warranted to minimise the potential for further increases. If the trend for increase continues, and approaches the local environmental goals, further management action would be indicated. To keep the number of charts manageable, only those parameters of relevance to the Stage 2 dry ash placement, such as conductivity, sulphate, boron and selenium, or those showing significant unexplained increases above the levels expected from the Stage 2 Environmental Assessment (PB, 2008) are graphed.
Elevated sulphate and boron concentrations are associated with coal mining activities and can also be elevated in flyash leachate and mine spoil (PPI, 1999). The presence of boron in higher than background concentrations is often associated with other trace metals and elements such as fluoride, nickel and zinc. The data for these and other elements are shown in Attachment 2.
The data are also summarised in Tables in this report, or in spreadsheet format in Attachment 2, including the minimum, maximum and mean as well as the 90th percentile baseline, median post-placement, ANZECC guidelines and local guideline concentrations.
Page 18
3. Effects of Seepage Collection Diversion and Return Systems on Sawyers Swamp Creek Water Quality and Trace Metals
This Section presents assessment further to that in the previous report on the likely effects of the KVAR Stage 2 seepage, the KVAD/R subsurface drains and SSCAD seepage collection and return systems on receiving water quality and trace metals in Sawyers Swamp Creek. As the subsurface drains and the KVAD toe drains send the collected seepage to Lidsdale Cut, the effects of the Lidsdale Cut v-notch discharge on the creek, prior to its cessation in April-June, 2012, are also examined. As the Springvale Mine water discharge has altered the water quality in Sawyers Swamp Creek, its characteristics are discussed first.
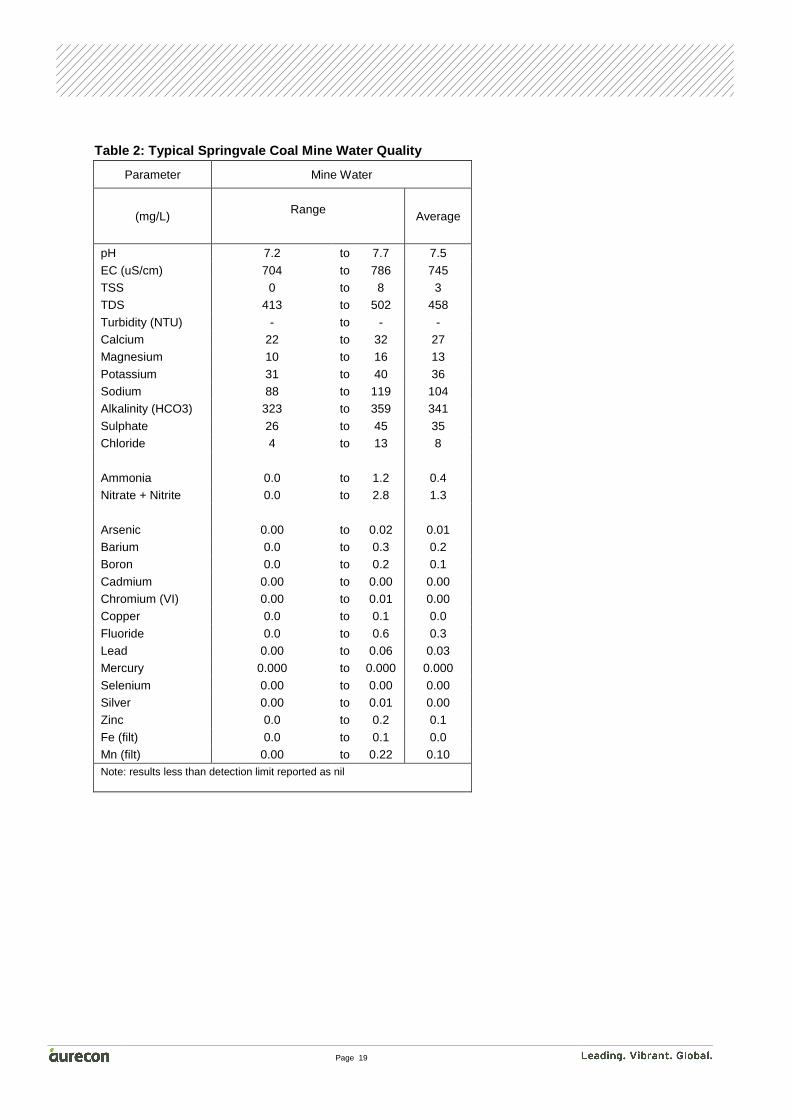
3.1 Springvale Mine Water Quality As noted above, the Springvale Mine water pipeline has been licenced to discharge to the creek since August, 2012 but has been leaking into the creek since July, 2011 (Aurecon, 2012), so the effects of mine water discharge has been examined first. The mine discharge rate, at 20 ML/day, is expected to be greater than the sum of the ash related seepage rates, particularly as much of the ash related seepage has been collected and diverted from entering the creek since 2010. EnergyAustralia NSW has provided a copy of the typical Springvale Mine water quality, which is shown in Table 2. More accurate trace metal data is shown in Table 3. The mine water is characterised by relatively low dissolved salts, including sulphate and chloride, but the conductivity is relatively high at 745 to 1098 uS/cm due to a high concentration of bicarbonate alkalinity. This is possibly derived from the limestone dust which is applied to the floor and walls of the mine as an explosion inhibitor. The discharge is also characterised by relatively low concentrations of trace metals, including selenium. As the alkalinity is higher than the various ash placement seepage waters, alkalinity has been used as a tracer for the mine water discharge to Sawyers Swamp Creek.
Page 19
Table 2: Typical Springvale Coal Mine Water Quality
Parameter Mine Water
(mg/L)
Range
Average
pH 7.2 to 7.7 7.5
EC (uS/cm) 704 to 786 745 TSS 0 to 8 3 TDS 413 to 502 458
Turbidity (NTU) - to - - Calcium 22 to 32 27 Magnesium 10 to 16 13
Potassium 31 to 40 36 Sodium 88 to 119 104 Alkalinity (HCO3) 323 to 359 341
Sulphate 26 to 45 35 Chloride 4 to 13 8
Ammonia 0.0 to 1.2 0.4 Nitrate + Nitrite 0.0 to 2.8 1.3
Arsenic 0.00 to 0.02 0.01 Barium 0.0 to 0.3 0.2 Boron 0.0 to 0.2 0.1
Cadmium 0.00 to 0.00 0.00 Chromium (VI) 0.00 to 0.01 0.00 Copper 0.0 to 0.1 0.0
Fluoride 0.0 to 0.6 0.3 Lead 0.00 to 0.06 0.03 Mercury 0.000 to 0.000 0.000
Selenium 0.00 to 0.00 0.00 Silver 0.00 to 0.01 0.00 Zinc 0.0 to 0.2 0.1
Fe (filt) 0.0 to 0.1 0.0 Mn (filt) 0.00 to 0.22 0.10 Note: results less than detection limit reported as nil
Page 20
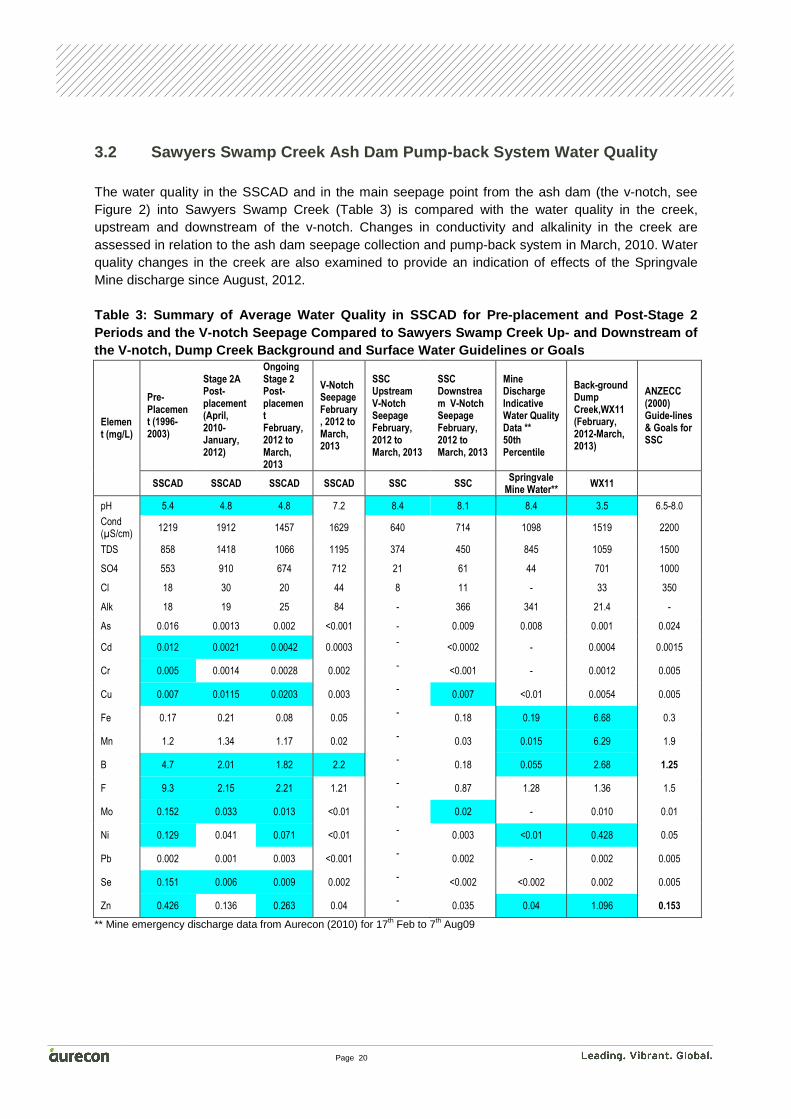
3.2 Sawyers Swamp Creek Ash Dam Pump-back System Wa ter Quality The water quality in the SSCAD and in the main seepage point from the ash dam (the v-notch, see Figure 2) into Sawyers Swamp Creek (Table 3) is compared with the water quality in the creek, upstream and downstream of the v-notch. Changes in conductivity and alkalinity in the creek are assessed in relation to the ash dam seepage collection and pump-back system in March, 2010. Water quality changes in the creek are also examined to provide an indication of effects of the Springvale Mine discharge since August, 2012. Table 3: Summary of Average Water Quality in SSCAD for Pre-placement and Post-Stage 2 Periods and the V-notch Seepage Compared to Sawyers Swamp Creek Up- and Downstream of the V-notch, Dump Creek Background and Surface Wate r Guidelines or Goals
Element (mg/L)
Pre-Placement (1996-2003)
Stage 2A Post-placement (April, 2010-January, 2012)
Ongoing Stage 2 Post-placement February, 2012 to March, 2013
V-Notch Seepage February, 2012 to March, 2013
SSC Upstream V-Notch Seepage February, 2012 to March, 2013
SSC Downstream V-Notch Seepage February, 2012 to March, 2013
Mine Discharge Indicative Water Quality Data ** 50th Percentile
Back-ground Dump Creek,WX11 (February, 2012-March, 2013)
ANZECC (2000) Guide-lines & Goals for SSC
SSCAD SSCAD SSCAD SSCAD SSC SSC Springvale
Mine Water** WX11
pH 5.4 4.8 4.8 7.2 8.4 8.1 8.4 3.5 6.5-8.0
Cond (µS/cm)
1219 1912 1457 1629 640 714 1098 1519 2200
TDS 858 1418 1066 1195 374 450 845 1059 1500
SO4 553 910 674 712 21 61 44 701 1000
Cl 18 30 20 44 8 11 - 33 350
Alk 18 19 25 84 - 366 341 21.4 -
As 0.016 0.0013 0.002 <0.001 - 0.009 0.008 0.001 0.024
Cd 0.012 0.0021 0.0042 0.0003 -
<0.0002 - 0.0004 0.0015
Cr 0.005 0.0014 0.0028 0.002 -
<0.001 - 0.0012 0.005
Cu 0.007 0.0115 0.0203 0.003 -
0.007 <0.01 0.0054 0.005
Fe 0.17 0.21 0.08 0.05 -
0.18 0.19 6.68 0.3
Mn 1.2 1.34 1.17 0.02 -
0.03 0.015 6.29 1.9
B 4.7 2.01 1.82 2.2 -
0.18 0.055 2.68 1.25
F 9.3 2.15 2.21 1.21 -
0.87 1.28 1.36 1.5
Mo 0.152 0.033 0.013 <0.01 -
0.02 - 0.010 0.01
Ni 0.129 0.041 0.071 <0.01 -
0.003 <0.01 0.428 0.05
Pb 0.002 0.001 0.003 <0.001 -
0.002 - 0.002 0.005
Se 0.151 0.006 0.009 0.002 -
<0.002 <0.002 0.002 0.005
Zn 0.426 0.136 0.263 0.04 -
0.035 0.04 1.096 0.153
** Mine emergency discharge data from Aurecon (2010) for 17th Feb to 7th Aug09
Page 21
Table 3 shows the following characteristics: • A moderate increase in conductivity from upstream to downstream of the v-notch in SSC
• Conductivity in the creek is much lower than in the SSCAD or the v-notch discharge and is similar to that of the Springvale mine water
• Alkalinity in the creek (downstream of the v-notch) is much higher than in the SSCAD or the v-notch discharge and is similar to that of the Springvale mine water
• Arsenic and molybdenum in the creek (downstream of the v-notch) are higher than in the SSCAD or the v-notch discharge and the arsenic is similar to that in the mine water.
• Copper in the creek is higher than in the v-notch and in bore D4 (Table 5). Contribution to these metals by the Springvale mine water, if any, cannot be determined due to lack of data or the high detection limits used but the copper concentration at the downstream site increased to 0.022 mg/L in August, 2012 at the time the continuous mine water discharge began. This may explain the high average copper concentration. See also comments on these metals in Section 3.3 and Table 4.
It is noted that the concentration of all these trace metals has increased since the initial detailed sampling from February to October, 2010 by LLI at the downstream site (SSC@800m) – see Attachment 2.8. During February to October, 2010, arsenic averaged 0.002 mg/L (now 0.009 mg/L), copper 0.002 (now 0.007 mg/L) and molybdenum <0.01 (now 0.02 mg/L). As a result of these changes, copper and molybdenum are now higher than their respective local guidelines and higher than in the background site in Dump Creek (Table 3). The sampling site at the SSCAD spillway (SSC@0m, Figure 2) where the SSCAD freshwater inflow diversion, as well as the Springvale Mine Water discharges since August, 2012, enters Sawyers Swamp Creek, has been sampled for water quality and trace metals since November, 2012. In addition, the water quality and trace metals at site 92, SSC upstream of the ash dam (Figure 2) have been sampled since June, 2012. The results are shown in Attachment 2.8. These data show that the combined discharge was elevated in arsenic and molybdenum but not copper, while the upstream SSC has low concentrations of these trace metals. Hence, it is suggested that EnergyAustralia NSW sample the mine water for trace metals to assist in confirmation of the cause of the increases in the creek. To assist in clarification of the changes in Sawyers Swamp Creek, upstream and downstream of the v-notch, due to the mine water, changes over time in conductivity and alkalinity from February 2010 to March, 2013 are shown in Figure 3. The LLI dataset had missing data, which are shown as dotted lines in Figure 3.
Page 22
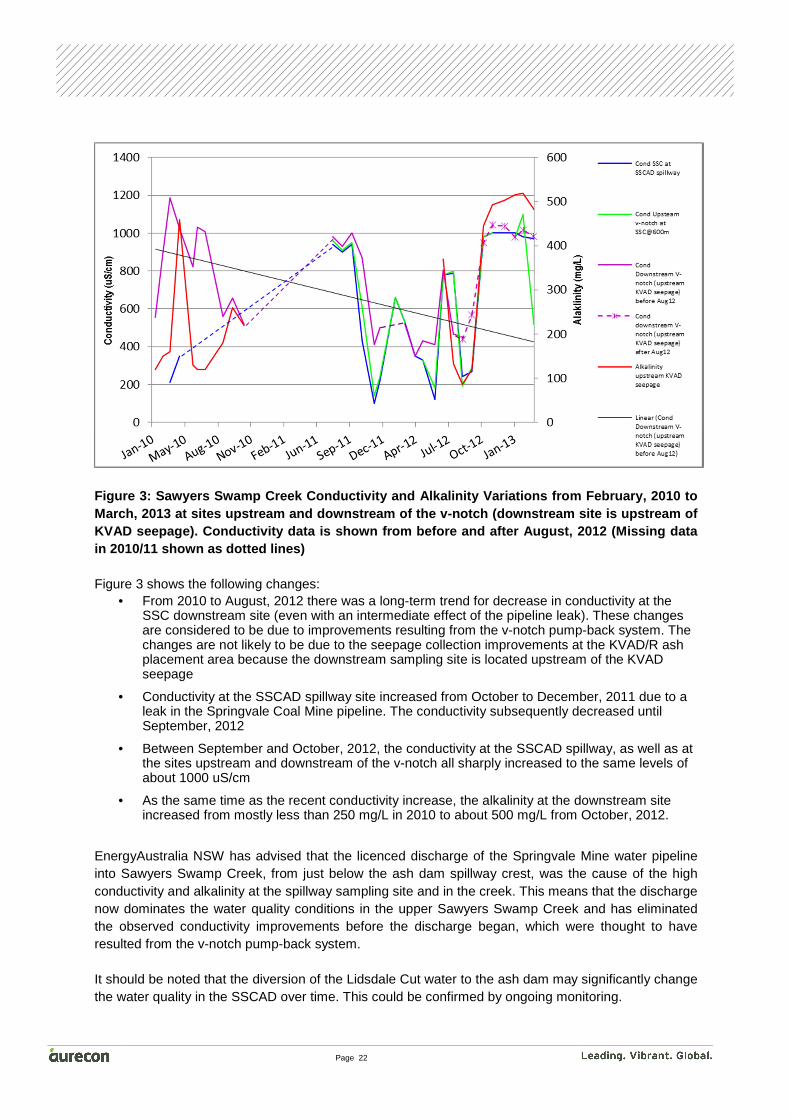
Figure 3: Sawyers Swamp Creek Conductivity and Alka linity Variations from February, 2010 to March, 2013 at sites upstream and downstream of the v-notch (downstream site is upstream of KVAD seepage). Conductivity data is shown from befo re and after August, 2012 (Missing data in 2010/11 shown as dotted lines) Figure 3 shows the following changes:
• From 2010 to August, 2012 there was a long-term trend for decrease in conductivity at the SSC downstream site (even with an intermediate effect of the pipeline leak). These changes are considered to be due to improvements resulting from the v-notch pump-back system. The changes are not likely to be due to the seepage collection improvements at the KVAD/R ash placement area because the downstream sampling site is located upstream of the KVAD seepage
• Conductivity at the SSCAD spillway site increased from October to December, 2011 due to a leak in the Springvale Coal Mine pipeline. The conductivity subsequently decreased until September, 2012
• Between September and October, 2012, the conductivity at the SSCAD spillway, as well as at the sites upstream and downstream of the v-notch all sharply increased to the same levels of about 1000 uS/cm
• As the same time as the recent conductivity increase, the alkalinity at the downstream site increased from mostly less than 250 mg/L in 2010 to about 500 mg/L from October, 2012.
EnergyAustralia NSW has advised that the licenced discharge of the Springvale Mine water pipeline into Sawyers Swamp Creek, from just below the ash dam spillway crest, was the cause of the high conductivity and alkalinity at the spillway sampling site and in the creek. This means that the discharge now dominates the water quality conditions in the upper Sawyers Swamp Creek and has eliminated the observed conductivity improvements before the discharge began, which were thought to have resulted from the v-notch pump-back system. It should be noted that the diversion of the Lidsdale Cut water to the ash dam may significantly change the water quality in the SSCAD over time. This could be confirmed by ongoing monitoring.
Page 23
3.3 KVAD/R Seepage and Subsurface Seepage Collectio n and Diversion Effects
The main KVAD/R seepage point from the north wall into Sawyers Swamp Creek is located near the ash placement internal groundwater bore GW6 (Figure 2). The water quality in the seepage, as well as in Sawyers Swamp Creek, and upstream and downstream of the seepage point, is shown in Table 4, as is the water quality at the receiving water site, WX7. Unfortunately, the KVAD/R seepage to the creek is only tested for general water quality, such as conductivity, and trace metals are not measured, so it is suggested that EnergyAustralia NSW test the north wall seepage water for trace metals as well as general water quality.
Changes in conductivity in the creek have also been assessed in relation to the KVAD/R subsurface drains for seepage collection and diversion to Lidsdale Cut since October, 2010. Water quality changes in the creek are also examined in relation to effects of the Springvale Mine discharge since August, 2012. Cessation of discharges from Lidsdale Cut to the creek, which was stopped in April, 2012, has also been taken into account.
Page 24
Table 4: Summary of Average and Median Water Qualit y in Sawyers Swamp Creek at the Receiving Water Site, WX7, compared to KVAD/R North Wall Seepage to the creek, Up- and Downstream of the Seepage, Lidsdale Cut, Springvale Mine Water and Surface Water Guidelines or Goals
Element (mg/L)
Sawyers Swamp Creek (WX7)
North Wall KVAD/R Seepage to SSC
Upper Sawyers Swamp
Creek
Springvale Mine
Water**
Lidsdale Cut (WX5)
Pre-placement
Stage 2A Post-placement (April, 2010-January, 2012) Median
Ongoing Stage 2 Post-placement (February, 2012-March, 2013)
Ongoing Stage 2 Post-placement (February, 2012-March, 2013)
SSC upstream KVAD/R Seepage & below V-notch (February, 2012 to March, 2013)
SSC down-stream KVAD/R Seepage near D5 (February, 2012 to March, 2013)
Indicative Water Quality Data ** Median
Ongoing Stage 2 Post-placement (February, 2012- July, 2012) Median
Surface Water Guidelines# or Goals^ (1991-2003)
90th Percentile
pH 7.6 7.3 7.5 4.2 8.1 8.0 8.4 7.3 6.5 – 8.0
Cond (µS/cm)
760 1100 828 1462 714 688 1098 590 2200
TDS 584 690 553 1244 450 435 845 360 1500^
SO4 323 300 156 769 61 67 44 160 1000 ++
CI 27 16 11 19 11 11 - 13 350 +
Alkalinity 20 162* 257* - 366 278 341 100 -
As <0.001 0.004 0.007 - 0.009 0.008 0.008 0.001 0.024
B 2.33 1.4 0.634 - 0.18 0.22 0.055 0.55 1.25
Cd <0.001 0.0007 0.0011 - <0.0002 <0.0002 - 0.0007 0.0015
Cr <0.001 0.0025 0.0128 - <0.001 <0.001 - 0.001 0.005
Cu <0.007 0.003 0.0099 - 0.007 0.001 <0.01 0.0025 0.005
F 1.1 1.7 1.7 - 0.87 0.786 1.28 0.80 1.5+++
Fe 0.507 0.02 0.26 - 0.18 0.28 0.19 0.12 0.3+++
Mn 0.829 1.7 0.72 - 0.03 0.25 0.015 0.74 1.9
Mo - 0.02 0.014 - 0.02 0.02 - 0.010 0.01 +
Ni - 0.16 0.059 - 0.003 <0.01 <0.01 0.03 0.05
Pb 0.003 0.002 0.003 - 0.002 0.001 - 0.001 0.005
Se 0.003 <0.002 <0.001 - <0.002 <0.002 <0.002 0.002 0.005
Zn 0.153 0.45 0.035 - 0.035 0.03 0.04 0.070 0.153
*averages used to allow for effects of periods of mine water pipeline leakage or the recent discharge ** Mine emergency discharge data from Aurecon (2010) for 17th Feb to 7th Aug09
Table 4 shows the following characteristics:
• The KVAD/R Seepage appears not to have an effect on the conductivity or total dissolved solids (TDS) in upper Sawyers Swamp Creek as they were both lower downstream of the north wall KVAD/R seepage point than upstream.
• The KVAD/R seepage sulphate at 769 mg/L was the highest source of sulphate, including the mine water, Lidsdale Cut and the SSCAD v-notch seepage (Table 3). Note that the north wall KVAD/R sulphate was even higher than in Dump Creek (see Table 3) which enters SSC upstream of WX7 but downstream of the creek site near D5. This suggests that the KVAD/R
Page 25
seepage was the cause of the small sulphate increase from upstream to downstream of the KVAD/R seepage point. However, the sulphate still met the local/ANZECC (2000) guideline goals. The average sulphate in Table 4 includes the period from October, 2012 when the mine water ceased to be used directly by the power station and was diverted to Sawyers swamp Creek. With this data not included, the increase in sulphate from February to September, 2012 was from 75 mg/L upstream to 91 mg/L downstream of the KVAD/R seepage point. Hence, the effects of the seepage were not significant in terms of the local/ANZECC (2000) guidelines.
• The moderate boron increase from up- to downstream of the north wall seepage is consistent with the sulphate increase in the creek, which indicates that the KVAD/R seepage has a higher boron than in the Springvale mine water
• Alkalinity in the creek downstream of the KVAD/R seepage (near bore D5 and at WX7) is moderately lower than the upstream site, which is similar to that of the Springvale mine water. The moderate decrease is likely to be due to the low pH in the seepage water (for which there is no alkalinity data).
• The moderate level of alkalinity in Lidsdale Cut, before it stopped discharging, is higher than the typical 20 mg/L in bore D5 (see Table 6, Section 4.4) due to the recent increase in pH in the void from 4.8 to the current 7.3. The alkalinity and pH increase is suggested to be due to mine water flowing down Sawyers Swamp Creek and seeping into the Lidsdale Cut void (see Section 4.5)
• Arsenic and molybdenum at the downstream sites in the creek, as well as at WX7, are higher than the current concentrations in Lidsdale Cut. Cadmium, copper, chromium, fluoride and nickel are also higher at WX7 than in Lidsdale Cut.
• The concentrations of arsenic, cadmium, copper and chromium have increased at WX7 since the previous reporting period. As a result of these changes, copper and chromium are now higher than their respective local guidelines and higher than in the background site in Dump Creek (Table 3).
• The Springvale mine water discharge has lowered the conductivity, total dissolved solids and sulphate, as well as the concentrations of boron, manganese, nickel and zinc at WX7 such that, of these, only nickel is now higher than the local guidelines.
The source of the elevated copper and chromium concentrations at WX7 was investigated and was found to be due to a large increase in trace metal concentrations, including copper and chromium, at WX7 in May, 2012 (see Attachment 2.1). EnergyAustralia NSW advised that the high groundwater inflows to Lidsdale Cut following the February/March flood caused the void water level to rise and seep into the local mine spoil. The acidic pH and high conductivity, sulphate and trace metals, including aluminium, boron and nickel, are characteristic of the local mine spoil groundwater. As the trace metal increases did not occur in Sawyers Swamp Creek near D5, in Lidsdale Cut or in Dump Creek, the coal related groundwater seepage must have entered the creek upstream of WX7 and downstream of Lidsdale Cut. Hence, it is unlikely that the increase was related to the KVAD/R Stage 1 and Stage 2 ash placements and it appears that the discolouring of Sawyers Swamp Creek in April, 2012 was inappropriately assigned to the Lidsdale Cut discharge.
It is unlikely that the Springvale mine water added to the chromium levels at WX7 at this time because Table 4 shows that the creek sites above and below the KVAD/R seepage, and both upstream of Lidsdale Cut, had low chromium concentrations. In addition, although the KVAD/R upstream site had elevated copper, the high copper occurred later in August (see Attachment 2.8) and the downstream site, near D5, had low copper levels. However, to clarify the effects of the mine water, if any, on cadmium, copper, chromium, molybdenum and lead in the creek, measurements of the mine water discharge are suggested to be undertaken at detection limits lower than the ANZECC (2000) guidelines.
Page 26
To further assess the effects of the KVAD/R seepage collection and diversion systems on the water quality and trace metals in Sawyers Swamp Creek, as well as changes due to the mine water, the trends over time are examined in Figure 4.
Figure 4: Sawyers Swamp Creek Conductivity Variatio ns from February, 2010 to February, 2012 at sites upstream and downstream of KVAD/R North Wa ll seepage as well as at Receiving Water Site WX7 (downstream site taken as the LLI si te near the groundwater bore D5) Figure 4 shows the following changes:
• Prior to the mine water discharge in August, 2012, there was a trend for decrease in conductivity in Sawyers Swamp Creek at both the KVAD/R downstream site and at the receiving water site WX7, which is located downstream of the Dump Creek inflow. This trend was evident even with the intermediate effect of the pipeline leak in 2011. These changes are considered to be due to improvements resulting from the KVAD/R seepage collection and diversion system since 2010. As shown in Figure 3, the conductivity also decreased at the creek site upstream of the KVAD/R, apparently due to the SSCAD seepage collection system
• After the Springvale mine water began to be discharged to the creek, the conductivity at the KVAD/R upstream and downstream sites, as well as at WX7 sharply increased to all be at the same levels of about 1000 uS/cm between September and October, 2012.
At the same time as the recent conductivity increase, the alkalinity at the downstream site increased from an average of 119 mg/L before October, 2012 to 490 mg/L from October, 2012. A similar increase was observed at WX7, confirming the dominant effects of the mine water discharge on the water quality in the creek.
3.4 Lidsdale Cut
Page 27
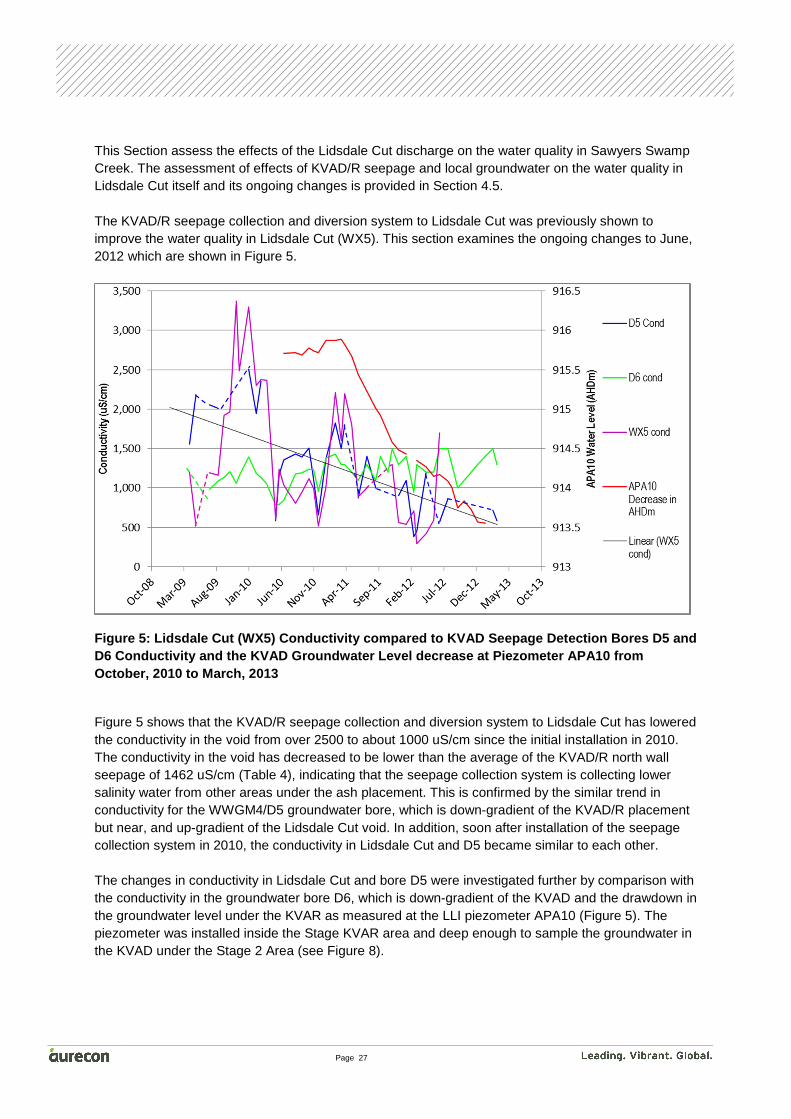
This Section assess the effects of the Lidsdale Cut discharge on the water quality in Sawyers Swamp Creek. The assessment of effects of KVAD/R seepage and local groundwater on the water quality in Lidsdale Cut itself and its ongoing changes is provided in Section 4.5. The KVAD/R seepage collection and diversion system to Lidsdale Cut was previously shown to improve the water quality in Lidsdale Cut (WX5). This section examines the ongoing changes to June, 2012 which are shown in Figure 5.
Figure 5: Lidsdale Cut (WX5) Conductivity compared to KVAD Seepage Detection Bores D5 and D6 Conductivity and the KVAD Groundwater Level decr ease at Piezometer APA10 from October, 2010 to March, 2013
Figure 5 shows that the KVAD/R seepage collection and diversion system to Lidsdale Cut has lowered the conductivity in the void from over 2500 to about 1000 uS/cm since the initial installation in 2010. The conductivity in the void has decreased to be lower than the average of the KVAD/R north wall seepage of 1462 uS/cm (Table 4), indicating that the seepage collection system is collecting lower salinity water from other areas under the ash placement. This is confirmed by the similar trend in conductivity for the WWGM4/D5 groundwater bore, which is down-gradient of the KVAD/R placement but near, and up-gradient of the Lidsdale Cut void. In addition, soon after installation of the seepage collection system in 2010, the conductivity in Lidsdale Cut and D5 became similar to each other. The changes in conductivity in Lidsdale Cut and bore D5 were investigated further by comparison with the conductivity in the groundwater bore D6, which is down-gradient of the KVAD and the drawdown in the groundwater level under the KVAR as measured at the LLI piezometer APA10 (Figure 5). The piezometer was installed inside the Stage KVAR area and deep enough to sample the groundwater in the KVAD under the Stage 2 Area (see Figure 8).
Page 28
From the flow paths shown in Figure 6, it appears that the subsurface drains are collecting KVAD seepage water that has been diluted by low salinity water entering the area from upstream of the KVAD/R placements. Prior to installation of the subsurface drains in 2010, both bore D5 and Lidsdale Cut had a higher conductivity than in bore D6 because the flow paths also indicate that bore D6 has its conductivity limited by the low salinity up-gradient inflows. The moderate increase in conductivity at D6 since 2010 indicates that the drawdown in the groundwater table by the toe drains and the subsurface drains (shown by the APA10 piezometer, Figure 5) has limited some of the low salinity groundwater from reaching bore D6. In addition to the changes due to installation of the subsurface drains, EnergyAustralia NSW has advised that in May 2012, the diversion of KVAD/R groundwater to the Lidsdale Cut void appeared to cause the void discharge to discolour Sawyers Swamp Creek with an aluminium deposit. Accordingly, EnergyAustralia NSW was requested by the NSW EPA to seal the discharge pipes in April, 2012 to prevent the void water from entering the creek. By the end of June, 2012 seepage water from the blocked Lidsdale Cut was found to have surfaced in Dump Creek, so pumping of the water from the void to the SSCAD, via the return canal, (Figure 2) began in July, 2012. The Lidsdale Cut water level has been controlled ever since.

Page 29
4. Stage 1 and Stage 2 Dry Ash Placement Effects on Groundwater Quality
This Section assesses the likely effects, if any, of the capped Stage 1 KVAR and the current KVAR Stage 2 dry ash placement on the local groundwater quality. Effects identified in Section 3 on the local surface water and groundwater by the subsurface drains, the SSCAD seepage collection and return system and diversion of the Lidsdale Cut discharge to the SSCAD are taken into account. In addition, the effects on local groundwater, if any, of the Springvale mine water discharge to Sawyers Swamp Creek are also considered. The aim of the seepage collection and diversion system management measures is for the receiving water quality at the groundwater bore WWGM1/D5 and in Sawyers Swamp Creek (WX7) to meet the local/ANZECC (2000) guideline trigger values for the characteristics defined in Table 1 during the post-dry ash placement periods. This presupposes any exceedances of the trigger values in the receiving waters by non-ash related changes in the area, such as increased background concentrations or the influence of the Springvale mine water discharge, can be taken into account. Long-term trends in water quality and trace metals are examined for changes from pre- to post-dry ash placement in the following groundwater bores:
• SSCAD seepage detection bores, WGM1/D3 and D4
• KVAD/R groundwater seepage detection bores WGM1/D5 and D6.
Groundwater quality changes at all the bores are compared to changes in the background bores, D1 and D2 and Lidsdale Cut. The overall effects on the final receiving water site in Sawyers Swamp Creek at WX7 are also included. As discussed in Section 1.1, a seepage collection and pump-back system was installed on the SSCAD v-notch seepage to minimise effects of the ash dam on Sawyers Swamp Creek and the local groundwater quality. However, residual effects of seepage from the ash dam pond under the dam wall on bores D3 and D4 have to be taken into account as they are up-gradient of the Stage 2 placement and may affect the groundwater flowing into the placement area.
4.1 Groundwater Flow Directions The groundwater flow directions are used to help explain why groundwater quality changes occur in the groundwater under and around the KVAD/R, as well as potential effects of seepage into Sawyers Swamp Creek. The flow directions were examined in previous reports because it was shown that the conductivity in the Lidsdale Cut was reduced to be similar to that at bore D5 when the sub-surface drains under the Stage 2 Area were first connected to the KVAD toe drains. In addition, bore D5 samples the groundwater seepage on its way to Sawyers Swamp Creek, which is nearby (Figure 2). Figure 6 shows the groundwater level contours and overall, indicative, groundwater flow paths in the ash placement areas. The level contours have changed from those of the previous report due to the ongoing drawdown of the water table under the KVAR by the toe drains and subsurface drains. The indicative KVAD/R seepage flow paths to the KVAD toe drains and toward the low point of the Lidsdale Cut are shown. Seepage from the KVAD, under the KVAR that is intercepted by the toe

Page 30
drains, is also shown. Any seepage that is not collected by the subsurface drains or the toe drains is shown as flowing to the local groundwater in Figure 6. The SSCAD dam wall seepage to Sawyers Swamp Creek that is not collected by the v-notch pump-back system is shown as flowing to the local groundwater in Figure 6.

SSCAD
SSCAD water return channel
D1 approximately 1500 m east
Pump Back System
Dam Seepage
Groundwater
Surface Water
Lisdale Cut
APA10
SSCUpstream @0 m
SSC @600 m
SSC @ 800 m
SSC@ 1250 m
D2
D3
D4
D5
D6
GW6
GW10
GW11
AP17
APA09A
APA08
APA06
KV_MB1DKV_MB1S
VNOTCH
WX11
WX5
Dump Cre
ek
Sawyers Swamp Creek
225
7993
83
Stage 2
Stage 1AStage
1B
918
91291
1
920
917
919
Figure 6: Kerosene Vale Ash Dam and Stage 1 and Stage 2 Dry Ash Repository Groundwater Level (RL m)with Inferred Flow Directions (from sketch provided by Lend Lease Infrastructure to EnergyAustralia)
EnergyAustralia Wallerawang Power Station
Source: Aurecon, EnergyAustralia
Legend
0 100 200m
P:\G
IS\P
roje
ct-2
\pro
ject
\Del
ta W
este
rn P
ower
Sta
tions
\208
562
- Wal
lera
wan
g PS
\Map
s\20
8562
- K
VAD
Gro
undw
ater
Flo
w M
odel
201
3 M
arku
p.m
xd\J
OB
No.
\18-
12-1
3\an
thon
y.ko
\Rev
0
1:7,000Projection: GDA 1994 MGA Zone 56
KVAD/KVAR piezometer & groundwater bores
EA NSW groundwater bores
Lend Lease SSC Sites
VNOTCH
Surface water sampling
EA NSW Monitoring Locations
Groundwater Contours 2013
KVAR Stage II seepage
Dam seepage
KVAR Sub-Surface Drains
KVAD Toe Drain
Flow to Lisdale Cut
Groundwater FlowDirection
KVADStage 1A
Stage 1B
Stage 2

Page 32
The piezometer water level changes and the groundwater contours provided by LLI show that the unblocked toe drains have drawn the ash placement groundwater level to below the assumed KVAD clay capping level of RL918m2 along the western and northern wall (Figure 6). This drawdown is consistent with the decrease in water level in the KVAD, under the dry ash placement, by over 2m (as measured at the piezometer APA10, see Figures 5 and 6). However, in the south-eastern area, groundwater mounding has increased from a maximum height of RL917m in 2012 to RL918 to RL919m in 2013.
These changes in the water level contours indicate that some rainwater infiltration is being retained above the clay capping. From these observations, it appears that the subsurface drains installed under the south-eastern section of the Stage 2 area (Figure 1) are taking groundwater from under the clay capping and sending it to the low point of the eastern drainage system (as indicated by the yellow arrows in Figure 6). The reversed groundwater flow direction in this area (the blue arrow) also indicates that some of the water above the clay capping is flowing to the eastern low point. Groundwater from the low point is directed into the KVAD toe drains and Lidsdale Cut.
Since unblocking of the toe drains and installation of the subsurface drains, the groundwater flow directions, the likely sources of groundwater and effects on the water quality in bores D5 and D6, as well as in the Lidsdale Cut have become clearer, based on the following observations:
• Groundwater in the KVAD, under Stages 1 and 2, is flowing toward Sawyers Swamp Creek
• Although seepage water from the SSCAD (the main flow now collected at the v-notch and pumped back into the dam pond) most likely affects the groundwater at D4 on the right abutment of the ash dam wall, the lower groundwater level of RL906m means it is unlikely to significantly affect the KVAD/R groundwater. The flow paths shown in Figure 6 indicate that the groundwater at bore D4 mainly flows to Sawyers Swamp Creek
• Groundwater sampled by bore D3 on the left abutment is less affected by the SSCAD seepage water (Section 4.3) and the groundwater is diluted by inflows of near pristine groundwater (but low pH water) from up-gradient of the borehole site
• Background groundwater for the KVAD/R is measured at bores D2 and D3, which are up-gradient of the KVAD. The D2 and D3 up-gradient sources appear to flow into the KVAD, under the KVAR, where it dilutes the KVAD water as it is collected by the toe drains and subsurface drains and sent to Lidsdale Cut. Bore D1 is up-gradient of the SSCAD and its flow appears to dilute the D3 groundwater which samples seepage from the SSCAD into the D3 area
• Some of the up-gradient water appears to flow around the southern edge of the KVAD where it dilutes KVAD seepage flowing toward bore D6
• Effects of residual seepage from the SSCAD and KVAD/R on water quality in Sawyers Swamp Creek, if any, appear to be dominated by the effects of the discharge flows from the Springvale coal mine.
4.2 Sawyers Swamp Creek Ash Dam Water Quality The changes in water quality in the SSCAD, from the time wet ash slurry ash placement was stopped in 2003, to the current Stage 2 periods is shown in Table 3. The Selenium concentration decreased by an order of magnitude from 0.15 mg/L to 0.009 mg/L and is less than the ANZECC (2000) guideline in the v-notch seepage water. Long-term trends in conductivity and sulphate, as well as the trace metals boron, manganese, nickel and zinc are shown in Figure 7.
2 The KVAR is placed on the clay capping of the KVAD.
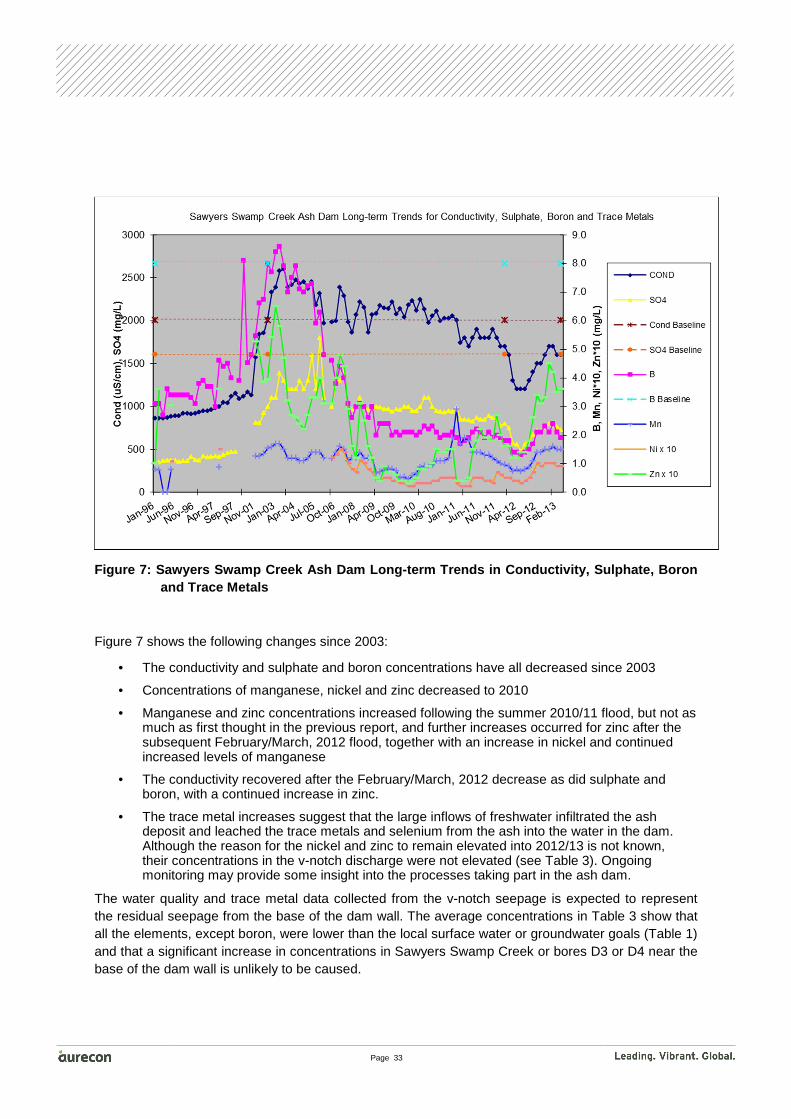
Page 33
Figure 7: Sawyers Swamp Creek Ash Dam Long-term Trends in Conductivity, Sulphate, Boron and Trace Metals
Figure 7 shows the following changes since 2003:
• The conductivity and sulphate and boron concentrations have all decreased since 2003
• Concentrations of manganese, nickel and zinc decreased to 2010
• Manganese and zinc concentrations increased following the summer 2010/11 flood, but not as much as first thought in the previous report, and further increases occurred for zinc after the subsequent February/March, 2012 flood, together with an increase in nickel and continued increased levels of manganese
• The conductivity recovered after the February/March, 2012 decrease as did sulphate and boron, with a continued increase in zinc.
• The trace metal increases suggest that the large inflows of freshwater infiltrated the ash deposit and leached the trace metals and selenium from the ash into the water in the dam. Although the reason for the nickel and zinc to remain elevated into 2012/13 is not known, their concentrations in the v-notch discharge were not elevated (see Table 3). Ongoing monitoring may provide some insight into the processes taking part in the ash dam.
The water quality and trace metal data collected from the v-notch seepage is expected to represent the residual seepage from the base of the dam wall. The average concentrations in Table 3 show that all the elements, except boron, were lower than the local surface water or groundwater goals (Table 1) and that a significant increase in concentrations in Sawyers Swamp Creek or bores D3 or D4 near the base of the dam wall is unlikely to be caused.

Page 34
4.3 SSCAD Groundwater Quality The SSCAD seepage detection bores, WGM1/D3 and D4, are located down-gradient of the SSCAD and up-gradient of the KVAD and KVAR Stage 1 and Stage 2 dry placement areas (Figure 1). Bore D3 samples groundwater affected by ash dam seepage from near the left abutment of the ash dam wall and bore D4 samples the right abutment. The conductivity and salinity at D3 has always been lower than at D4 (Table 5) as it is diluted by inflows of low salinity groundwater from up-gradient of the SSCAD (see flow paths in Figure 6). Changes in the SSCAD seepage detection bores have been assessed using data from pre-placement 90th percentile baselines (before May, 2003 at bore D4) and the background bore, D2. This data has been compared to the post-placement medians for periods of Stage 1, including capping since April, 2009 (May, 2003 to March, 2010) and during the Stage 2A dry ash placement (April, 2010 to January, 2012) and the current Stage 2 placement (February, 2012 to March, 2013), as shown in Table 5.
As bore D4 is located near the lower section of Sawyers Swamp Creek, where it passes the dam wall and the V-notch seepage, the water quality and trace metals at this bore are expected to show any effects of residual seepage from the dam wall since the v-notch pump back system was installed. To assess changes in bore D4 during the current period, the medians have been compared to those during previous periods together with its 90th percentile baseline in Table 5. Table 5: Median Water Quality for SSCAD V-notch See page and Seepage affected Groundwater bores during Post-Stage 1 and Post-Stage 2 Compared to the Groundwater Background, Seepage Bore WGM1/D4 Baseline and Groundwater Guide lines or Goals Element
(mg/L)
SSCAD Seepage Affected Bores V-Notch Seepage February, 2012 to March, 2013
Back-
ground
(February
, 2012 to
March,
2013)
D4 Baseline
(Pre-Stage I
90th
Percentile)
ANZECC
Guideline
Goals for
Groundwater
Stage 1 & Cap
May, 2003 to
March, 2010
Stage 2A Post-
placement (April,
2010 to January,
2012)
Stage 2 Post-
placement
(February, 2012 to
March, 2013)
D3 D4 D3 D4 D3 D4 SSCAD D2 D4
pH 6.2 5.9-8 5.9 5.8 6.1 5.7 7.2 4.9 6.8 6.5-8.0
Cond (µS/cm) 693 1276 746 1500 540 1500 1629 320 728 2600
TDS 430 1120 450 1200 330 1200 1195 215 510 2000
SO4 110 720 115 770 68 770 712 100 201 1000
Cl 82 27 105 33 66 35 44 22 45 350
Cu 0.005 0.0008 0.002 0.001 0.004 0.003 0.003 0.003 0.010 0.005
Fe 0.10 46.50 0.03 43.0 4.2 39.0 0.05 0.01 86 1.7
Mn 0.63 17.0 0.73 18.0 0.80 16.5 0.02 0.49 6.5 1.9
B 0.03 1.20 0.03 1.50 0.02 1.55 2.2 0.01 0.49 1.7
F 0.05 0.05 0.05 0.10 0.10 0.10 1.21 0.10 0.24 1.5
Ni 0.130 0.040 0.130 0.050 0.12 0.040 <0.01 0.050 0.023 0.137
Se 0.001 0.001 0.002 0.002 0.002 0.002 0.002 0.002 0.002 0.005
Zn 0.065 0.080 0.140 0.080 0.070 0.065 0.04 0.075 0.060 0.505

Page 35
The summary data in Table 5 shows:
� The bore D3 conductivity and salinity is now lower than during the Stage 1 period and the trace metals have shown no significant changes other than an increase in iron
� The bore D4 conductivity and salinity have increased slightly since Stage 1 and are similar to that measured in the V-notch seepage.
� The trace metals at D4 have shown no notable changes since Stage 1 and are mostly higher than measured at the V-notch. The higher concentrations of boron and fluoride at the V-notch appear not to have affected the D4 concentrations, as evidenced by the low fluoride at both groundwater bores. If the SSCAD seepage was the cause of the elevated boron at D4 (1.2 to 1.55 mg/L), the effects of the seepage should have appeared at bore D3 as an increase above that in the KVAD/R up-gradient bore D2. However, there was no such increase.
Long-term changes in conductivity, sulphate and boron at bore D4 are shown in Figure 8. Comparison with the changes in the SSCAD in Figure 7 shows the effect of the early SSCAD increases before dry ash placement began in 2003. Although the SSCAD levels began to decrease from 2005 (Figure 7), the conductivity, sulphate and boron concentrations in the D4 bore (Figure 8) continued to increase to have similar levels as those in the SSCAD and consistently exceeded their baselines, except during rainfall events. The lack of a trend for decrease in conductivity, sulphate and boron at D4 since 2010 indicates that installation of the v-notch pump-back system has not provided an improvement in groundwater quality. This is not unexpected, as most of the v-notch discharge flowed down the creek, and did not infiltrate into the surrounding area. The concentrations in D4 are almost exclusively influenced by seepage from the wider area of the ash dam pond into the local groundwater. The main improvement from the installation of the v-notch pump-back system could be expected to occur on the surface water quality in Sawyers Swamp Creek (See Section 4.6).
Figure 8 - Sawyers Swamp Creek Ash Dam Seepage Detection Bore WGM1/D4 Long-term Trends in Conductivity, Sulphate and Boron
In summary, Figure 8 shows that the conductivity, sulphate and boron in the SSCAD seepage detection bore D4 showed a steady increase from 2003 to 2008/09, followed by stabilisation at elevated levels. However, Table 3 in Section 3.2 and examination of Sawyers Swamp Creek data in

Page 36
Attachment 2.8 shows that, prior to the Springvale mine water discharge, there was no evidence of effects of groundwater seepage from the area sampled by bore D4. This is considered to be due to the slow rate of groundwater seepage into Sawyers Swamp Creek relative to the normal catchment inflows.
4.4 KVAD and KVAR Groundwater Quality The changes in salinity at the groundwater bores WGM1/D5 and D6 were examined in relation to the KVAD/R subsurface drains and the effects on the water quality in the Lidsdale Cut in Section 3.3.1. This Section examines the groundwater quality in these bores in relation to potential effects of the KVAR Stage 2. Changes from pre-placement, during the Stage 1 placement and capping and during the initial Stage 2 dry ash placement are examined. The understanding of the groundwater flow directions shown in Figure 6 explains how the inflowing up-gradient, low salinity groundwater dilutes the KVAD water that is collected by the toe drains and subsurface drains from under the KVAR. In turn, this is directed to Lidsdale Cut via the unblocked toe drains. Figure 5 shows that the conductivity in both the Lidsdale Cut and bore D5 were reduced to be similar to that at bore D6, shortly after the sub-surface drains were initially connected to the KVAD toe drains. Since then, their salinities have continued to decrease to be less than in bore D6. The continuing decrease indicates that the groundwater level drawdown is depleting the amount of high salinity water present in the KVAD. The elements that had higher concentrations than the local guidelines during the Stage 2 period are highlighted in blue in Table 4. Table 6 shows that, as a result of the seepage collection and diversion works, the local groundwater quality has changed. During 2010 to 2012, bore D6 had a lower median conductivity and sulphate than in bore D5, but during 2012 to 2013, bore D5 has the lower conductivity and sulphate. In addition, the concentrations of iron, nickel and zinc in bore D5 have decreased and boron, cadmium and copper and now lower than the local guidelines. There were no significant changes in concentrations of the other trace metals, including selenium, which remained low. In regard to the changes in trace metals in the area, it should be noted that the low pH in bores D5 and D6 indicates pyrite oxidation (Deutsch, 2005) of the residual coal and chitter in the Kerosene Vale mine void underneath the KVAR. Pyrite oxidation and its associated acidification are known to release trace metals into groundwater. In addition to the changes observed in the local groundwater, the flow directions indicate that bore D5 samples the groundwater seepage from under the KVAR on its way to Sawyers Swamp Creek, which is nearby. Hence, the KVAR subsurface drains, together with the KVAD toe drains, could be expected to improve the salinity in the creek by decreasing the salinity in the local groundwater.

Page 37
Table 6: Median Water Quality for Dry Ash KVAD/KVAR Groundwater Seepage Bores during Post-Stage 1, Initial Stage 2 and Stage 2A Compared to Current Groundwater Background Bore WGM1/D2 and Bore WGM1/D5 Baseline and Groundwater G uidelines or Goals
Element
(mg/L)
KVAD & KVAR Dry Ash Placement Monitoring Bores Back-
ground
February,
2012 to
March, 2013
D5 Baseline
(Pre-Stage I
90th
Percentile)
ANZECC
Guideline
Goals for
Ground-
water
Stage I& Cap May, 2003
to March, 2010
Stage 2A April, 2010
to January, 2012
Ongoing Stage 2
February, 2012 to
March, 2013
D5 D6 D5 D6 D5 D6 D2 D5
pH 3.6 3.2 3.6 3.2 3.7 3.4 4.9 4.5 6.5-8.0
Cond
(µS/cm) 1917 1110 1356 1216 580 1300 320 810 2600
TDS 1600 600 1000 730 430 885 215 550 2000
SO4 1100 350 680 485 240 530 100 328 1000
Cl 18 56 15 48 13 47 22 24 350
As 0.001 0.005 0.001 0.001 0.001 0.002 0.001 0.008 0.024
B 4.8 0.80 2.2 0.74 0.80 0.63 0.01 1.7 1.7
Cd 0.0024 0.0004 0.002 0.001 0.001 0.0002 0.0002 0.004 0.001
Cr 0.003 0.0026 0.001 0.002 0.002 0.0015 0.001 0.041 0.004
Cu 0.013 0.003 0.008 0.005 0.003 0.005 0.003 0.058 0.005
Fe 4.85 38.0 1.7 14.5 0.35 54.5 0.01 14.7 1.7
Mn 8.55 3.6 7.5 3.5 3.5 4.45 0.49 2.5 1.9
Mo 0.005 0.008 0.010 0.010 0.01 0.010 0.010 - 0.01
F 1.10 0.20 0.80 0.40 0.60 0.30 0.10 0.65 1.5
Ni 0.830 0.335 0.540 0.350 0.230 0.345 0.050 0.137 0.137
Pb 0.016 0.005 0.007 0.012 0.002 0.002 0.001 0.021 0.010
Se 0.001 <0.001 0.002 0.002 <0.002 0.002 0.002 0.002 0.005
Zn 1.50 0.335 1.10 0.895 0.560 0.920 0.075 0.505 0.505
To clarify the role of KVAR seepage, if any, on the local groundwater and surface water quality, long-term changes for conductivity, sulphate and boron in bore D5, from before dry ash placement, during Stage 1 and to the current Stage 2 placement, are examined in Figure 9. Bore D5 is used as the indicator of potential effects on Sawyers Swamp Creek because it has been shown to sample the groundwater seepage from under the KVAR on its way to the creek.

Page 38
Figure 9: Kerosene Vale Ash Dam Seepage Detection Bore WGM1/D5 Long-term Tr ends in Conductivity, Sulphate and Boron (Periods for Stage 1 placement and capped since 2003, Stage 2A, including initial Stage 2 since April 200 9, Blocked toe drains and Subsurface drain seepage Periods are shown)
Figure 9 shows that the conductivity, sulphate and boron at bore D5 have all decreased since installation of the KVAD/R seepage collection system to be similar to the Stage 1 pre-placement background levels. Other than boron, they have also had concentrations consistently below their respective environmental goals.
As discussed above in Section 3.3.1, the lower concentrations in bore D5 during the Stage 2 period appear to be due to the increased ability of the low conductivity background water to enter the KVAD under the KVAR since installation of the sub-surface drains and unblocking of the KVAD toe drains.
If the KVAR was significantly adding to the groundwater concentrations, they would not have decreased to their background levels. This is supported by the apparent lack of effects of the high rainfall events during summers 2010/11, 2011/12 and 2012/13 (see the rainfall in Section 2.4) on bore D5 concentrations, relative to the large changes seen at bore D4 (Figure 8). Hence, the lower variability at D5 may be due to effective sealing of the KVAD by the combined effects of the dry ash placement on the clay capping, which is on top of the KVAD.
Hence, these observations and trends support the foregoing suggestion that leachates from the dry ash, if any, even with the increased rainfall in recent summers, have not affected the local groundwater. The effects of wet and dry weather on the local groundwater quality and the indicated lack of dry ash leachate effects is expected to be confirmed by ongoing monitoring.
Page 39
4.5 Lidsdale Cut This Section assesses the effects of KVAD/R and local groundwater seepage, as well as the diversion systems, on the water quality in Lidsdale Cut. Section 3.3.1 showed that the KVAD/R Stage 2 seepage collection and diversion system was related to a decrease in conductivity in Lidsdale Cut (WX5) as well as at the KVAD seepage detection bore, D5, but not at D6. The relationships of observed water quality and trace metal changes in the Lidsdale Cut are further investigated in this Section. Table 7 shows water quality changes at Lidsdale Cut from pre-dry ash placement to Stage 1 (capped) and the various Stage 2 periods, including the current ongoing Stage 2 reporting period. These changes are compared to the current period for bore D5 and the groundwater quality changes at bore D5 over the same periods, which are shown in Table 6. This information can be used to confirm the findings from the previous Section on potential inputs from the KVAR to the local groundwater by identifying any links between the KVAD/R groundwater quality and that in the Lidsdale Cut. Table 7 shows the following changes in the Lidsdale Cut water quality: � All the water quality parameters and trace metals, including selenium, have lower concentrations
than the local/ANZECC (2000) guidelines
� Conductivity and sulphate, as well as the trace metals boron, fluoride, iron, manganese, lead and zinc have decreased to be lower than the pre-placement 90th percentile baselines and nickel is now lower than during the Stage 1 period
� There were no significant changes in concentrations of the other trace metals, including selenium which remained low
� Alkalinity and pH increased, causing the pH to be alkaline for the first time, and even higher than the pre-placement baseline of 6.9.
The alkalinity and pH increases suggest that water from Sawyers Swamp Creek, containing alkaline Springvale Mine water, may have seeped into the Lidsdale Cut void. The increases occurred as early as November, 2011 and may have been due to the water level in the creek being increased by high flows caused by the mine water pipeline leak, which began in July, 2011, aided by a period of high rainfall from November, 2011, and particularly the flooding due to the high rainfall in February and March, 2012. EnergyAustralia NSW confirmed that it is possible that the creek water may have seeped into the void through the surrounding mine spoil.

Page 40
Table 7: Median Lidsdale Cut Water Quality during S tage 1 and Capping and Stage 2 Dry Ash Placement periods compared to the current Groundwat er Quality at Bore WGM1/D5 and relative to the Pre-placement Baseline 90 th Percentile and Groundwater Guidelines or Goals
Element
(mg/L)
KVAD &
KVAR
Groundwater
(WGM1/D5)
Lidsdale Cut (WX5)
Ongoing
Stage 2 Post-
placement
(February,
2012-March,
2013)
Pre-
Placement
(1992-2003)
90th
Percentile
Stage 1
&Cap Post-
placement
(May, 2003-
March,
2010)
Initial Stage
2 Post-
placement
(April, 2009-
March,
2010)
Stage 2A
Post-
placement
(April, 2010-
January,
2012)
Ongoing
Stage 2
February,
2012 to
June, 2012*
Groundwater
Guidelines# or
Goals
pH 3.7 6.9 4.3 3.4 4.8 7.3 6.5 – 8.0
Cond/
(µS/cm)
580 952 1178 1965 1011 590 2600^
TDS 430 650 870 1500 740 360 2000
SO4 240 359 580 970 460 160 1000
CI 13 34 18 19 21 13 350
Alk 20 38 30 85 84.5 100 -
As 0.001 <0.001 0.002 0.002 0.002 0.001 0.024
B 0.80 2.16 2.50 5.20 2.4 0.55 1.7
Cd 0.001 <0.001 0.0008 0.0008 0.0013 0.0007 0.001
Cr 0.002 <0.006 0.001 0.0013 0.001 0.001 0.004
Cu 0.003 <0.005 0.003 0.003 0.004 0.0025 0.005
F 0.60 1.99 3.10 6.70 2.60 0.80 1.5
Fe 0.35 0.7 0.54 3.05 0.04 0.12 1.7
Mn 3.5 2.12 3.70 6.30 4.10 0.74 1.9
Mo 0.01 - 0.005 0.010 <0.010 0.010 0.010
Ni 0.230 - 0.375 0.540 0.280 0.030 0.137
Pb 0.002 0.004 0.003 0.003 0.002 0.001 0.01
Se <0.002 0.001 <0.001 0.001 0.002 0.002 0.005
Zn 0.560 0.304 0.360 1.20 0.520 0.070 0.505
* EnergyAustralia NSW was unable to monitor the water quality in the Lidsdale Cut void from July, 2012 due to drawdown of the void water level by the pumps that direct the water to the SSCAD.
The above mentioned Lidsdale Cut decreases in water quality parameters during the current Stage 2 period corresponded with similar decreases in the conductivity and sulphate in bore D5. Most of the trace metals decreased in both the Lidsdale Cut void and in bore D5, with the exception of manganese, nickel and zinc, which remained higher in the D5 groundwater. These observations are consistent with dilution of the poor water quality in the KVAD, underneath the KVAR, as well as at bore D5, with inflows of low salinity and trace metals from the up-gradient
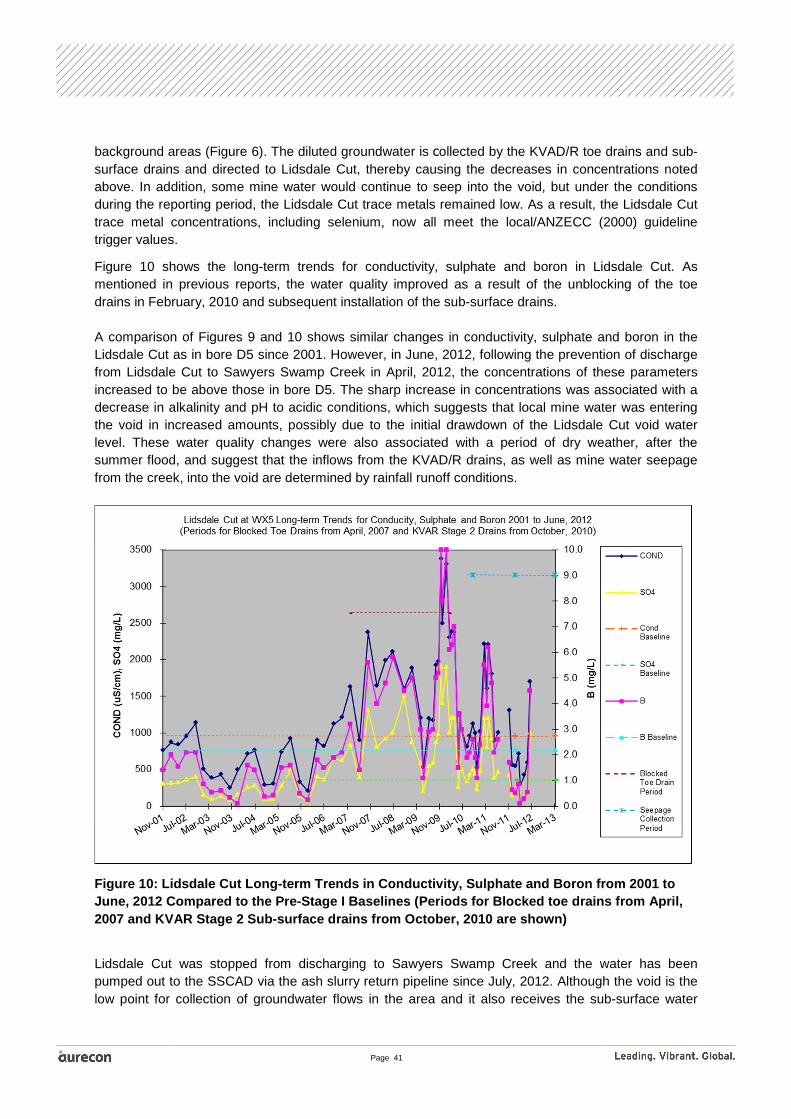
Page 41
background areas (Figure 6). The diluted groundwater is collected by the KVAD/R toe drains and sub-surface drains and directed to Lidsdale Cut, thereby causing the decreases in concentrations noted above. In addition, some mine water would continue to seep into the void, but under the conditions during the reporting period, the Lidsdale Cut trace metals remained low. As a result, the Lidsdale Cut trace metal concentrations, including selenium, now all meet the local/ANZECC (2000) guideline trigger values.
Figure 10 shows the long-term trends for conductivity, sulphate and boron in Lidsdale Cut. As mentioned in previous reports, the water quality improved as a result of the unblocking of the toe drains in February, 2010 and subsequent installation of the sub-surface drains. A comparison of Figures 9 and 10 shows similar changes in conductivity, sulphate and boron in the Lidsdale Cut as in bore D5 since 2001. However, in June, 2012, following the prevention of discharge from Lidsdale Cut to Sawyers Swamp Creek in April, 2012, the concentrations of these parameters increased to be above those in bore D5. The sharp increase in concentrations was associated with a decrease in alkalinity and pH to acidic conditions, which suggests that local mine water was entering the void in increased amounts, possibly due to the initial drawdown of the Lidsdale Cut void water level. These water quality changes were also associated with a period of dry weather, after the summer flood, and suggest that the inflows from the KVAD/R drains, as well as mine water seepage from the creek, into the void are determined by rainfall runoff conditions.
Figure 10: Lidsdale Cut Long-term Trends in Conduct ivity, Sulphate and Boron from 2001 to June, 2012 Compared to the Pre-Stage I Baselines (P eriods for Blocked toe drains from April, 2007 and KVAR Stage 2 Sub-surface drains from Octob er, 2010 are shown)
Lidsdale Cut was stopped from discharging to Sawyers Swamp Creek and the water has been pumped out to the SSCAD via the ash slurry return pipeline since July, 2012. Although the void is the low point for collection of groundwater flows in the area and it also receives the sub-surface water
Page 42
from the KVAD/R drains, EnergyAustralia NSW has advised that the water level is now kept lower than the level of Sawyers Swamp Creek. Under these conditions, it is possible that the creek water could seep into the void, particularly during high rainfall events, and be pumped out together with the groundwater flows and the sub-surface drain water to the SSCAD. It is also possible that there will be additional seepage into Lidsdale Cut from the overburden deposits at the back of the void. This means that Lidsdale Cut has ceased to provide an early warning of groundwater changes or potential effects on the Sawyers Swamp Creek receiving waters. Hence, it is suggested that water quality in the void no longer needs to be sampled as part of the routine sampling program.
4.6 Sawyers Swamp Creek Changes in the water quality and trace metals at the Sawyers Swamp Creek receiving water site (WX7) were assessed in Section 3 in relation to the inputs of seepage water from under the SSCAD wall and seepage from the current Stage 2 dry ash KVAD/R ash placements, as well as the Lidsdale Cut discharge until mid-2012. The effects of the Springvale mine water pipeline leak since July, 2011, and its licenced discharge since August, 2012 were also assessed. As WX7 is the final receiving water site for the ash placement areas, this Section examines the overall effects of surface and groundwater seepage on the WX7 receiving waters. Figure 11 shows the trends for conductivity, sulphate and boron at WX7 from before conversion from wet to dry ash to the current Stage 2 placement period. The trends are compared to the conductivity in the SSCAD (reduced by half to allow direct comparison with the WX7 conductivity on the same scale), as well as the various ash placement management periods that may have affected the water quality at WX7. These include:
• The period when the KVAD toe drains were found to be blocked and subsequently unblocked to allow the KVAD seepage water to drain to Lidsdale Cut
• Springvale Mine water pipeline leak and constant discharge periods • SSCAD v-notch seepage pump-back, and • KVAD/R subsurface drain seepage collection and diversion to Lidsdale Cut.
The concentrations of conductivity, sulphate and boron all decreased from their peaks after the toe drains were unblocked, which showed the potential effects of the KVAD/R seepage on the creek without a seepage collection system. The SSCAD pump-back system was installed about the same time the toe drains were unblocked and this was followed soon after by the KVAD/R subsurface drains.
The more recent water quality data has clarified the role of the SSCAD seepage on the water quality at the Sawyers Swamp Creek receiving water site, WX7. Prior to installation of the seepage works in mid-2010 and early 2011, the WX7 creek site conductivity tended to follow that of the SSCAD conductivity. After installation of these systems, the WX7 conductivity decreased in August, 2012 to its lowest level since the late 1990s. However, the SSCAD conductivity also decreased during this period, and the WX7 conductivity continued to follow that of the SSCAD trend. The main differences between WX7 and the SSCAD trends during this period was a large decrease, followed by an increase at WX7, relative to the SSCAD. These changes at WX7 were mostly due to heavy rainfall followed by the mine water pipeline leaks. Since the mine water pipeline discharge became continuous in August, 2012, the WX7 conductivity increased and, as a consequence, there is no current link between the SSCAD conductivity trend and that at WX7.
Since the mine water discharge to the creek became continuous, the concentrations of sulphate and boron at WX7 have decreased to below their respective goals or pre-KVAR baselines, but the

Page 43
conductivity has increased again to about 1,000 µS/cm. The conductivity is now similar to that of the mine water (Table 4). As noted in Section 3, the conductivity increase was due to the relatively high conductivity in the mine water, which is mostly due to the high concentration of alkaline salts, rather than sulphate (Table 3).
Table 3 also shows that, although WX7 is downstream of Dump Creek (WX11), the elevated concentrations of sulphate (701 mg/L) and boron at (2.68 mg/L) at WX11 did not prevent the mine water from diluting the WX7 concentrations to low levels. This supports the view that the mine water flow rate is much higher that the local catchment runoff or the combined seepage rates from the SSCAD and the KVAD/R ash placement areas. This is further supported by the WX11 conductivity of 1519 µS/cm, which was diluted at WX7 to about 1,000 µS/cm by the mine water.
Figure 11: Sawyers Swamp Creek Long-term trends in Conductivity, Sulphate and Boron in relation to baseline and goals and the SSCAD Conduc tivity (halved) and Periods shown for the blocked KVAD toe drains, Springvale Mine water disc harge and pipeline leak, SSCAD pump-back and KVAD/R seepage collection and diversion to Lidsdale Cut
4.7 Overall Effects of Groundwater Seepage from Ash Placements on Sawyers Swamp Creek Receiving Waters
From the above considerations, the following overall effects of groundwater seepage from the KVAD/R and SSCAD on the WX7 receiving waters, qualified by the local background conditions and the Springvale Mine water, are:
• Prior to August, 2012, the SSCAD seepage dominated the conductivity conditions in Sawyers Swamp Creek other than during high rainfall events and the previous Springvale Mine water pipeline leak and the recent continuous discharge to the creek. Water quality, including
Page 44
conductivity, continued to meet the local/ANZECC (2000) guideline goals and there was no evidence of effects of the seepage on trace metals at WX7.
• After unblocking of the toe drains and installation of the KVAD/R subsurface drains, there were no detectable effects of the Stage 1 and Stage 2 dry ash placements on water quality and trace metals in the creek
• Although the KVAD/R north wall seepage caused a small increase in the sulphate, and possibly boron, in the creek, the sulphate continued to meet the local/ANZECC (2000) guideline goal. The naturally elevated boron levels in the creek were diluted by the Springvale Mine water discharge to below its local goal concentration
• Lidsdale Cut water quality and trace metals met all the local/ANZECC (2000) guideline goals. Accordingly, it is unlikely to have affected the creek receiving waters
• Copper and chromium (as well as aluminium) temporarily increased at WX7 due to local mine spoil seepage after the February/March, 2012 flood
• Springvale Mine water discharge now dominates most of the water quality conditions in the upper (above KVAD/R) and lower (below KVAD/R and Lidsdale Cut) Sawyers Swamp Creek. The discharge lowered the concentrations of boron and zinc at WX7 to below the local goals. An increase in copper and molybdenum occurred at the time of the continuous mine water discharge in the upper creek and the increases were also evident at WX7.
Page 45
5. Discussion The Sawyers Swamp Creek Ash Dam seepage, and possibly some input from the associated groundwater bore D4, was confirmed as the main determinant of the conductivity in Sawyers Swamp Creek prior to the Springvale mine water discharge, but always met the local/ANZECC guidelines and had no significant effects on trace metals. These conditions have since been surpassed by the Springvale Mine water discharge. The mine water has completely altered the water quality and trace metals in the creek, but other than increases in copper and molybdenum, the creek water quality downstream of the SSCAD v-notch has continued to meet the local/ANZECC guidelines. As the mine water discharge is expected to continue indefinitely, monitoring of the SSCAD v-notch water quality will be the only means of defining the potential effects of the ash dam seepage on the creek. In addition, the water quality in the SSCAD itself may change, or may already be in the process of changing, as a result of the diversion of the KVAD/R groundwater and Lidsdale Cut water to the ash dam. As the Springvale Mine water quality is poorly understood, it is suggested that EnergyAustralia NSW test the mine water for trace metals at detection limits lower than the ANZECC (2000) guidelines to confirm effects, if any, on the creek. This is particularly important in regard to understanding the effects of the KVAD/R seepage into the creek. Notwithstanding the Springvale Mine water discharge, it was apparent that the KVAD/R Seepage has not significantly affected the conductivity or salinity in Sawyers Swamp Creek. Although the trace metal concentrations in the KVAD/R north wall seepage are unknown, the creek data indicates that the seepage was unlikely to significantly affect the concentrations in the creek. To confirm this view, it is suggested that EnergyAustralia NSW test the north wall seepage water for trace metals as well as water quality. As the Springvale Mine water now dominates the water quality and trace metals in the creek, definition of the KVAD/R seepage water quality and trace metal concentrations is needed to allow an effective understanding of potential effects on Sawyers Swamp Creek. Repair of the KVAD toe drains and installation of sub-surface drains under the KVAR has drawn down the groundwater and in the process appears to have depleted the poor water quality in the KVAD. As a result, the water quality and trace metals in bore D5 and Lidsdale Cut (the receptacle of the drains) has continued to improve. Consequently, the KVAR Stage 1 and Stage 2 dry ash placements did not significantly increase the salinity and trace metal concentrations in the local groundwater, and as a consequence, was not expected to affect the conditions in Sawyers Swamp Creek. Hence, other than the effects of the local background conditions and the mine water, the water quality and trace metal concentrations were lower than the Local/ANZECC (2000) guidelines in the creek’s receiving waters. The February/March, 2012 flood caused groundwater from the local coal mine spoil to seep into Sawyers Swamp Creek in May, 2012, which made the water acidic and increased the concentrations of conductivity, sulphate and trace metals at the WX7 receiving water site. The trace metal increases did not occur in Sawyers Swamp Creek upstream of Lidsdale Cut, in Lidsdale Cut itself or in Dump Creek, so it is considered unlikely that the increases were related to the KVAD/R Stage 1 and Stage 2 ash placements or Lidsdale Cut. As a result of this event, the Lidsdale Cut discharge was stopped and pumped to Sawyers Swamp Creek Ash Dam but it appears that the effects on Sawyers Swamp Creek were inappropriately assigned to the Lidsdale Cut discharge rather than local mine spoil groundwater seepage.
Page 46
As the Lidsdale Cut discharge has been stopped and the water is pumped out of the void, Lidsdale Cut could cease to be the early warning site for potential effects of groundwater seepage on Sawyers Swamp Creek. Hence, it is suggested that water quality monitoring in the void may no longer be needed.
The dominant effect of the Springvale Mine water discharge on the Sawyers Swamp Creek receiving water site means that WX7 ceases to be useful as the final receiving water site for the KVAR. This would leave only bore D5 as the site for indication of potential effects on the Sawyers Swamp Creek receiving waters for the KVAR. However, it would be prudent to retain the existing water quality monitoring in Sawyers Swamp Creek so that EnergyAustralia NSW is not incorrectly assigned effects of the local coal mine conditions and the Springvale Mine water discharge.
In summary, the key points from the assessment are:
• SSCAD – confirmed as contributing conductivity and salinity to Sawyers Swamp Creek, but does not exceed the local/ANZECC guidelines for water quality and trace metals
• KVAD – unblocking of the toe drains and installation of the subsurface drains have reduced effects on the local groundwater quality to an acceptable level, when the background conditions are taken into account.
• KVAR – on evidence of significant effects on surface or groundwater quality.
• Springvale Mine water discharge – the water quality conditions in Sawyers Swamp Creek now overridden by the mine water discharge but, other than copper and molybdenum, the creek continued to meet the local/ANZECC guidelines for water quality and trace metals.
The finding for effects on Sawyers Swamp Creek at the receiving water site had to take into account the increase in trace metals due to local coal mine spoil seepage into the creek after the heavy rainfall event of February/March, 2012.
Page 47
6. Conclusions The findings of this assessment of effects of the Stage 1 and Stage 2 dry ash KVAR placements and the Sawyers Swamp Creek Ash Dam seepage on the surface and groundwater, taking into account the number of management changes (toe drains, subsurface drains, SSCAD v-notch pump-back and Lidsdale Cut stopped discharge) and the beginning of the continuous Springvale Mine water discharge, lead to the following conclusions:
� The SSCAD seepage was associated with a decrease in conductivity in Sawyers Swamp Creek in line with that in the SSCAD until the Springvale Mine water discharge began, after which the conductivity increased and the water quality and trace metals also changed. All the water quality and trace metal concentrations in the creek, downstream of the ash dam v-notch, met the local/ANZECC guideline concentrations, with the exception of copper and molybdenum, which became elevated at the time of the mine water discharge
� KVAD/R North Wall seepage had no observable effects on the conductivity in Sawyers Swamp Creek, and like that upstream at the SSCAD, was also decreasing until the beginning of the Springvale Mine water discharge.
� All the water quality and trace metal concentrations in the creek downstream of the KVAD/R seepage met the local/ANZECC guideline concentrations, with the exception of molybdenum. Both the upstream and downstream molybdenum concentrations were similar and the increases both occurred in October, 2012, shortly after the mine discharge began in August, 2012. However, it is noted that there was no trace metal data for the KVAD/R seepage, so it was recommended that the seepage be tested for trace metals
� The conductivity in Lidsdale Cut and in the groundwater at bore D5 decreased together following reinstatement of the toe drains and installation of the subsurface drains. The improvement in conductivity has continued as the groundwater level in the KAVD/R has decreased.
� Unblocking of the KVAD toe drains, installation of the KVAR sub-surface drains and diversion of the groundwater to Lidsdale Cut provided conditions that reduced the salinity (conductivity), sulphate and trace metals in:
− The local groundwater at bore D5
− Lidsdale Cut
− Sawyers Swamp Creek receiving water site, which had the water quality and trace metal concentrations lower than the Local/ANZECC (2000) guidelines other than effects of the local background conditions and the Springvale Mine water.
� High rainfall during the Stage 2 period introduced high concentrations of trace metals from the local mine spoil into Sawyers Swamp Creek downstream of Lidsdale Cut, causing the receiving waters to exceed some of the local environmental goals.
� Although the water quality data indicates that the KVAR ash placement management effectively controls dry ash leachates from affecting the local groundwater and surface water quality, the advent of the continuous Springvale Mine water discharge has compromised future assessment of potential effects on the Sawyers Swamp Creek receiving water site. As a consequence, appropriate changes to the monitoring program are advisable.
Page 48
7. Recommendations From the study findings and the domination of the water quality in Sawyers Swamp Creek by the discharge of water from the Springvale Mine, the following recommendations are made:
� Continue monthly water quality monitoring at the EnergyAustralia NSW routine groundwater monitoring sites and make the following changes to the surface water monitoring:
− Water quality monitoring in the Lidsdale Cut void to cease as part of the routine sampling program
− Retain the existing water quality monitoring in Sawyers Swamp Creek to avoid assignment of the local coal mines and Springvale Mine water discharge to KVAD/R and/or SSCAD
− Monitor the Springvale mine water for trace metals at detection limits lower than the ANZECC (2000) guidelines to confirm effects, if any, on the creek
− Continue to monitor the SSCAD water quality and the v-notch discharge to define the potential effects on Sawyers Swamp Creek
− Monitor the KVAD/R north wall seepage water for trace metals as well as water quality
− Silver be removed from the sampling program.
Page 49
8. References ANZECC,1995. Guidelines for Groundwater Protection in Australia. National Water Quality Management Strategy, Commonwealth of Australia. Australian and New Zealand Environmental Conservation Council, ACT.
ANZECC, 2000. Australian Water Quality Guidelines for Fresh and Marine Waters. Australian and New Zealand Environmental Conservation Council, ACT.
APHA, 1998. American Public Health Association, 1998. Standard Methods for the Examination of Water and Wastewater. 20th Edition.
Aurecon, 2010. KVAD Stage II Water Quality Assessment October, 2007 to March, 2010. Draft Report to Energy Delta Electricity Western 18th June, 2010
Aurecon, 2012 Kerosene Vale Ash Dam and Dry Ash Repository KVAR Stage 2A Water Quality Assessment April, 2010 to January, 2012. Report to Delta Electricity Western 9th October, 2012
Connell Wagner, 2008. Kerosene Vale Ash Dam Groundwater November, 2001 to July, 2007. Report to EnergyAustralia NSW Western, 15th February, 2008
DEC, 2004. Approved Methods for the Sampling and Analysis of Water Pollutants in New South Wales. Prepared by NSW Environment Protection Authority (EPA) and is published by Department of Environment and Conservation, NSW (DEC) on behalf of the EPA. March, 2004
Deutsch, WJ 2005. Groundwater Geochemistry: Fundamentals and Applications to Contamination Second Ed., Lewis Publishers
NEPC, 1999 (updated in May, 2013). National Environment Protection (Assessment of Site Contamination) Measure, National Environment Protection Council, Canberra.
PB, 2008. Kerosene Vale Stage 2 Ash Repository Area Environmental Assessment Technical Reports 1 – Groundwater and 2 – Surface Water. Parsons Brinckerhoff Australia Report to EnergyAustralia NSW , April, 2008
PPI, 1999. Mt Piper Ash/brine co-disposal pilot field test. Pacific Power International Report GO 129, 1999 to EnergyAustralia NSW
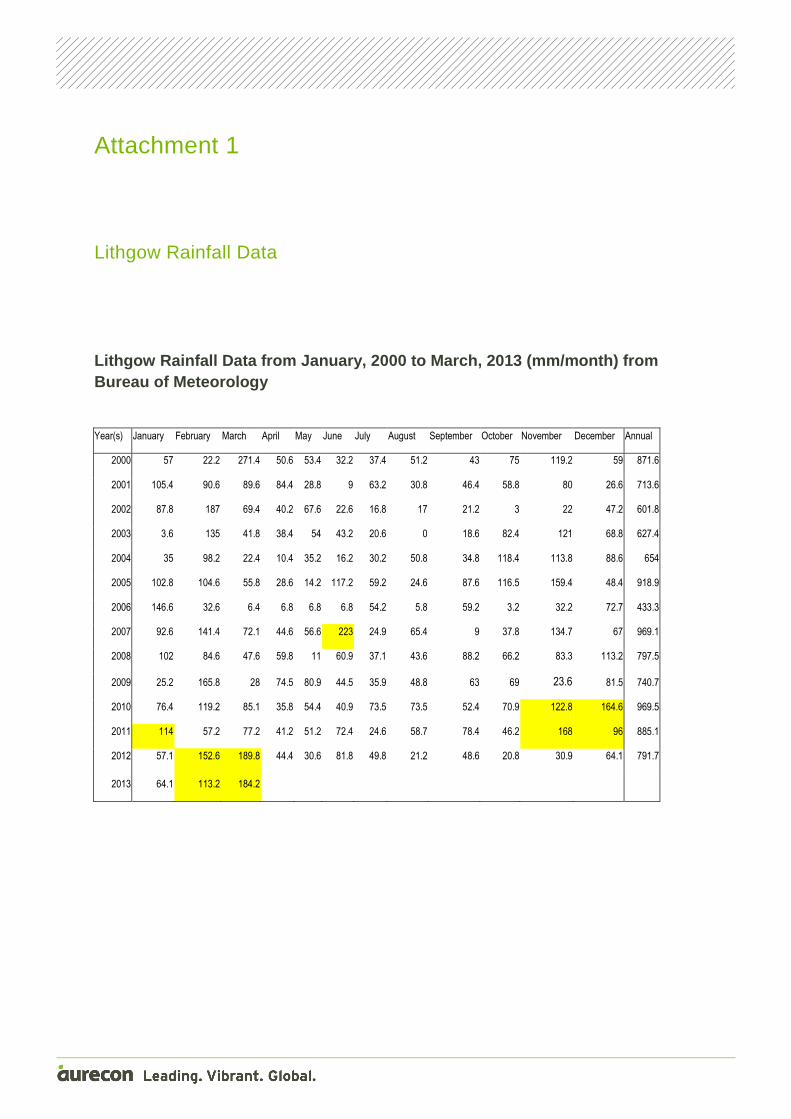
Attachment 1 Lithgow Rainfall Data
Lithgow Rainfall Data from January, 2000 to March, 2013 (mm/month) from Bureau of Meteorology
Year(s) January February March April May June July August September October November December Annual
2000 57 22.2 271.4 50.6 53.4 32.2 37.4 51.2 43 75 119.2 59 871.6
2001 105.4 90.6 89.6 84.4 28.8 9 63.2 30.8 46.4 58.8 80 26.6 713.6
2002 87.8 187 69.4 40.2 67.6 22.6 16.8 17 21.2 3 22 47.2 601.8
2003 3.6 135 41.8 38.4 54 43.2 20.6 0 18.6 82.4 121 68.8 627.4
2004 35 98.2 22.4 10.4 35.2 16.2 30.2 50.8 34.8 118.4 113.8 88.6 654
2005 102.8 104.6 55.8 28.6 14.2 117.2 59.2 24.6 87.6 116.5 159.4 48.4 918.9
2006 146.6 32.6 6.4 6.8 6.8 6.8 54.2 5.8 59.2 3.2 32.2 72.7 433.3
2007 92.6 141.4 72.1 44.6 56.6 223 24.9 65.4 9 37.8 134.7 67 969.1
2008 102 84.6 47.6 59.8 11 60.9 37.1 43.6 88.2 66.2 83.3 113.2 797.5
2009 25.2 165.8 28 74.5 80.9 44.5 35.9 48.8 63 69 23.6 81.5 740.7
2010 76.4 119.2 85.1 35.8 54.4 40.9 73.5 73.5 52.4 70.9 122.8 164.6 969.5
2011 114 57.2 77.2 41.2 51.2 72.4 24.6 58.7 78.4 46.2 168 96 885.1
2012 57.1 152.6 189.8 44.4 30.6 81.8 49.8 21.2 48.6 20.8 30.9 64.1 791.7
2013 64.1 113.2 184.2
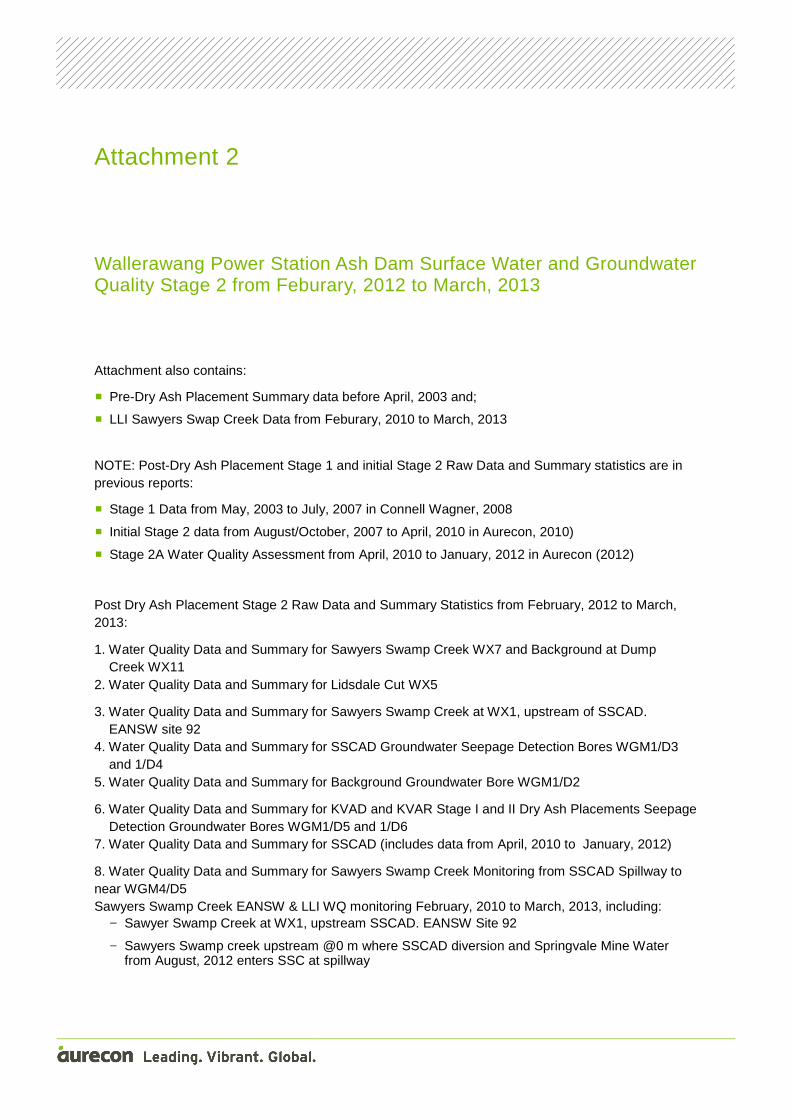
Attachment 2 Wallerawang Power Station Ash Dam Surface Water and Groundwater Quality Stage 2 from Feburary, 2012 to March, 2013
Attachment also contains:
� Pre-Dry Ash Placement Summary data before April, 2003 and;
� LLI Sawyers Swap Creek Data from Feburary, 2010 to March, 2013
NOTE: Post-Dry Ash Placement Stage 1 and initial Stage 2 Raw Data and Summary statistics are in previous reports:
� Stage 1 Data from May, 2003 to July, 2007 in Connell Wagner, 2008
� Initial Stage 2 data from August/October, 2007 to April, 2010 in Aurecon, 2010)
� Stage 2A Water Quality Assessment from April, 2010 to January, 2012 in Aurecon (2012)
Post Dry Ash Placement Stage 2 Raw Data and Summary Statistics from February, 2012 to March, 2013:
1. Water Quality Data and Summary for Sawyers Swamp Creek WX7 and Background at Dump Creek WX11 2. Water Quality Data and Summary for Lidsdale Cut WX5
3. Water Quality Data and Summary for Sawyers Swamp Creek at WX1, upstream of SSCAD. EANSW site 92 4. Water Quality Data and Summary for SSCAD Groundwater Seepage Detection Bores WGM1/D3 and 1/D4 5. Water Quality Data and Summary for Background Groundwater Bore WGM1/D2
6. Water Quality Data and Summary for KVAD and KVAR Stage I and II Dry Ash Placements Seepage Detection Groundwater Bores WGM1/D5 and 1/D6 7. Water Quality Data and Summary for SSCAD (includes data from April, 2010 to January, 2012)
8. Water Quality Data and Summary for Sawyers Swamp Creek Monitoring from SSCAD Spillway to near WGM4/D5 Sawyers Swamp Creek EANSW & LLI WQ monitoring February, 2010 to March, 2013, including:
− Sawyer Swamp Creek at WX1, upstream SSCAD. EANSW Site 92
− Sawyers Swamp creek upstream @0 m where SSCAD diversion and Springvale Mine Water from August, 2012 enters SSC at spillway

− Sawyers Crk upstream @600 m downstream of Spillway but upstream of Ash Dam seepage from V-notch
− Sawyers Swamp Creek Ash Dam Seepage from V-notch (water collected and recycling back into dam)
− Sawyers Swamp Creek at @850m - upstream seepage from KVAD wall and Below SSCAD v-notch Seepage Point. EANSW Site 93 from June, 2012
− Sawyers Swamp Creek at 1250 m near GW Bore D5. EANSW Site 83
− KVAD/R Seepage water Northern wall collection pit near GW6 Groundwater from the KVAD on the northside drains
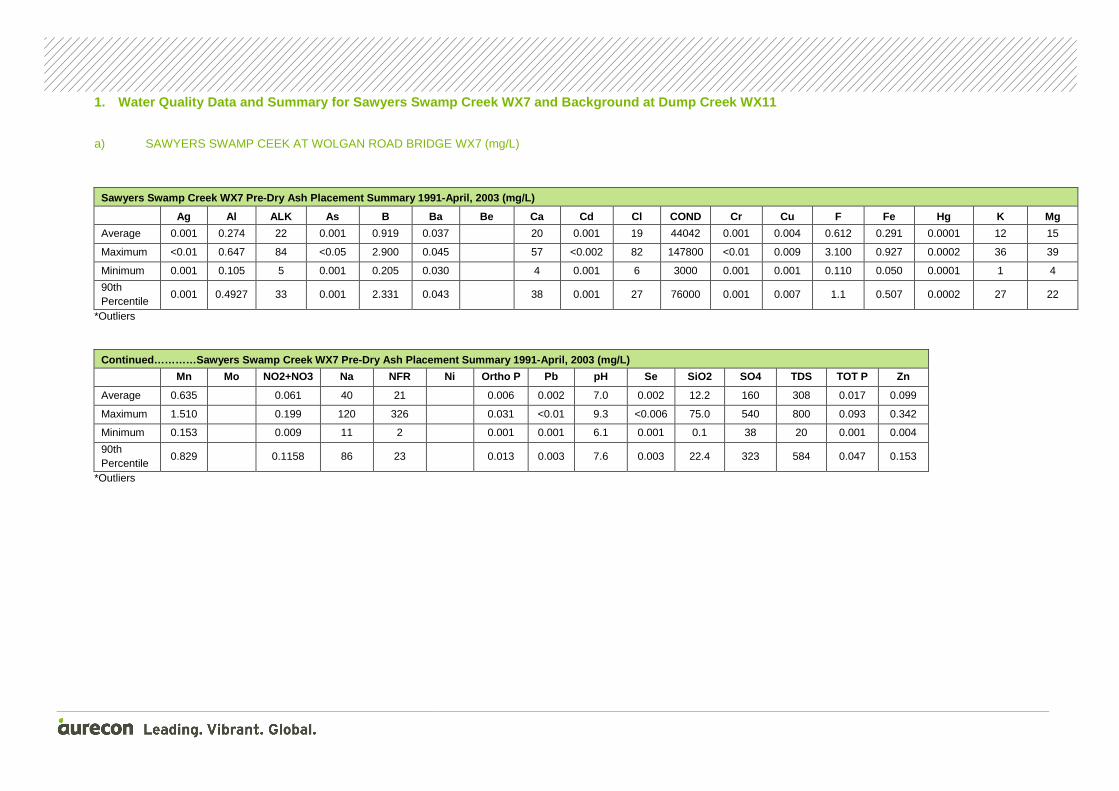
1. Water Quality Data and Summary for Sawyers Swamp Creek WX7 and Background at Dump Creek WX11
a) SAWYERS SWAMP CEEK AT WOLGAN ROAD BRIDGE WX7 (mg/L)
Sawyers Swamp Creek WX7 Pre-Dry Ash Placement Summa ry 1991-April, 2003 (mg/L)
Ag Al ALK As B Ba Be Ca Cd Cl COND Cr Cu F Fe Hg K Mg
Average 0.001 0.274 22 0.001 0.919 0.037 20 0.001 19 44042 0.001 0.004 0.612 0.291 0.0001 12 15
Maximum <0.01 0.647 84 <0.05 2.900 0.045 57 <0.002 82 147800 <0.01 0.009 3.100 0.927 0.0002 36 39
Minimum 0.001 0.105 5 0.001 0.205 0.030 4 0.001 6 3000 0.001 0.001 0.110 0.050 0.0001 1 4
90th Percentile
0.001 0.4927 33 0.001 2.331 0.043 38 0.001 27 76000 0.001 0.007 1.1 0.507 0.0002 27 22
*Outliers
Continued…………Sawyers Swamp Creek WX7 Pre-Dry Ash Pl acement Summary 1991-April, 2003 (mg/L)
Mn Mo NO2+NO3 Na NFR Ni Ortho P Pb pH Se SiO2 SO4 T DS TOT P Zn
Average 0.635 0.061 40 21 0.006 0.002 7.0 0.002 12.2 160 308 0.017 0.099
Maximum 1.510 0.199 120 326 0.031 <0.01 9.3 <0.006 75.0 540 800 0.093 0.342
Minimum 0.153 0.009 11 2 0.001 0.001 6.1 0.001 0.1 38 20 0.001 0.004
90th Percentile
0.829 0.1158 86 23 0.013 0.003 7.6 0.003 22.4 323 584 0.047 0.153
*Outliers
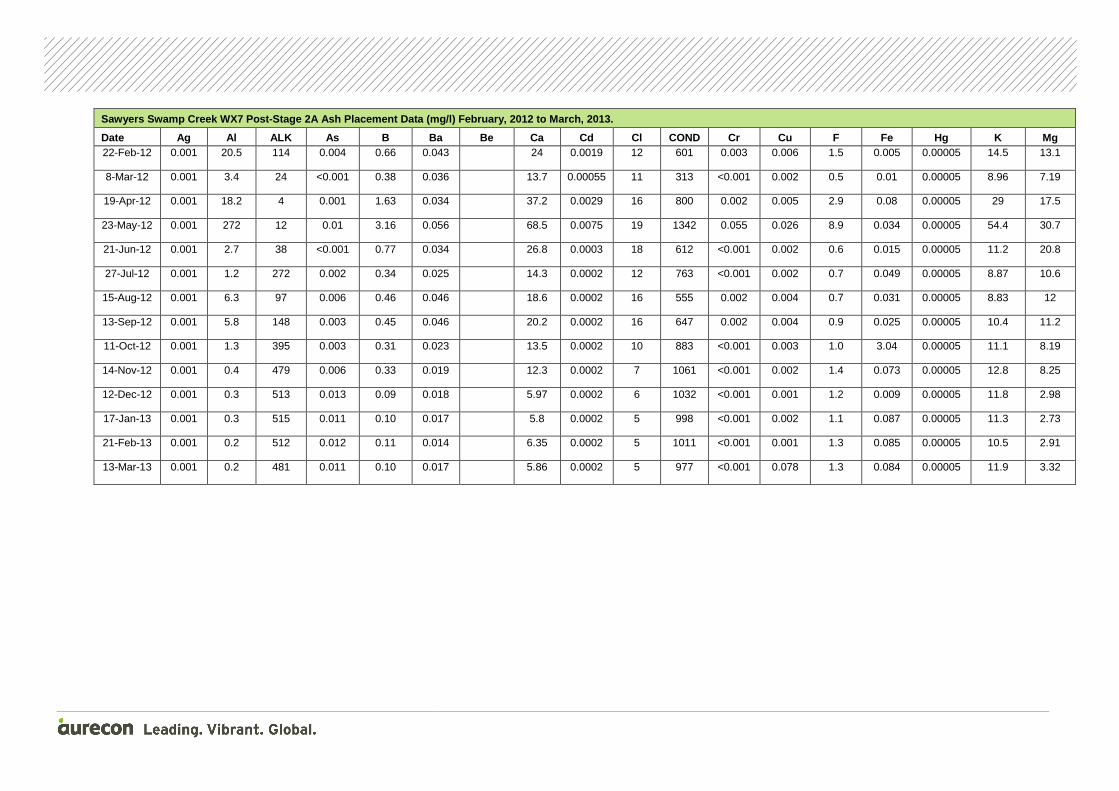
Sawyers Swamp Creek WX7 Post-Stage 2A Ash Placement Data (mg/l) February, 2012 to March, 2013.
Date Ag Al ALK As B Ba Be Ca Cd Cl COND Cr Cu F Fe Hg K Mg 22-Feb-12 0.001 20.5 114 0.004 0.66 0.043
24 0.0019 12 601 0.003 0.006 1.5 0.005 0.00005 14.5 13.1
8-Mar-12 0.001 3.4 24 <0.001 0.38 0.036
13.7 0.00055 11 313 <0.001 0.002 0.5 0.01 0.00005 8.96 7.19
19-Apr-12 0.001 18.2 4 0.001 1.63 0.034
37.2 0.0029 16 800 0.002 0.005 2.9 0.08 0.00005 29 17.5
23-May-12 0.001 272 12 0.01 3.16 0.056
68.5 0.0075 19 1342 0.055 0.026 8.9 0.034 0.00005 54.4 30.7
21-Jun-12 0.001 2.7 38 <0.001 0.77 0.034
26.8 0.0003 18 612 <0.001 0.002 0.6 0.015 0.00005 11.2 20.8
27-Jul-12 0.001 1.2 272 0.002 0.34 0.025
14.3 0.0002 12 763 <0.001 0.002 0.7 0.049 0.00005 8.87 10.6
15-Aug-12 0.001 6.3 97 0.006 0.46 0.046
18.6 0.0002 16 555 0.002 0.004 0.7 0.031 0.00005 8.83 12
13-Sep-12 0.001 5.8 148 0.003 0.45 0.046
20.2 0.0002 16 647 0.002 0.004 0.9 0.025 0.00005 10.4 11.2
11-Oct-12 0.001 1.3 395 0.003 0.31 0.023
13.5 0.0002 10 883 <0.001 0.003 1.0 3.04 0.00005 11.1 8.19
14-Nov-12 0.001 0.4 479 0.006 0.33 0.019
12.3 0.0002 7 1061 <0.001 0.002 1.4 0.073 0.00005 12.8 8.25
12-Dec-12 0.001 0.3 513 0.013 0.09 0.018
5.97 0.0002 6 1032 <0.001 0.001 1.2 0.009 0.00005 11.8 2.98
17-Jan-13 0.001 0.3 515 0.011 0.10 0.017
5.8 0.0002 5 998 <0.001 0.002 1.1 0.087 0.00005 11.3 2.73
21-Feb-13 0.001 0.2 512 0.012 0.11 0.014
6.35 0.0002 5 1011 <0.001 0.001 1.3 0.085 0.00005 10.5 2.91
13-Mar-13 0.001 0.2 481 0.011 0.10 0.017
5.86 0.0002 5 977 <0.001 0.078 1.3 0.084 0.00005 11.9 3.32
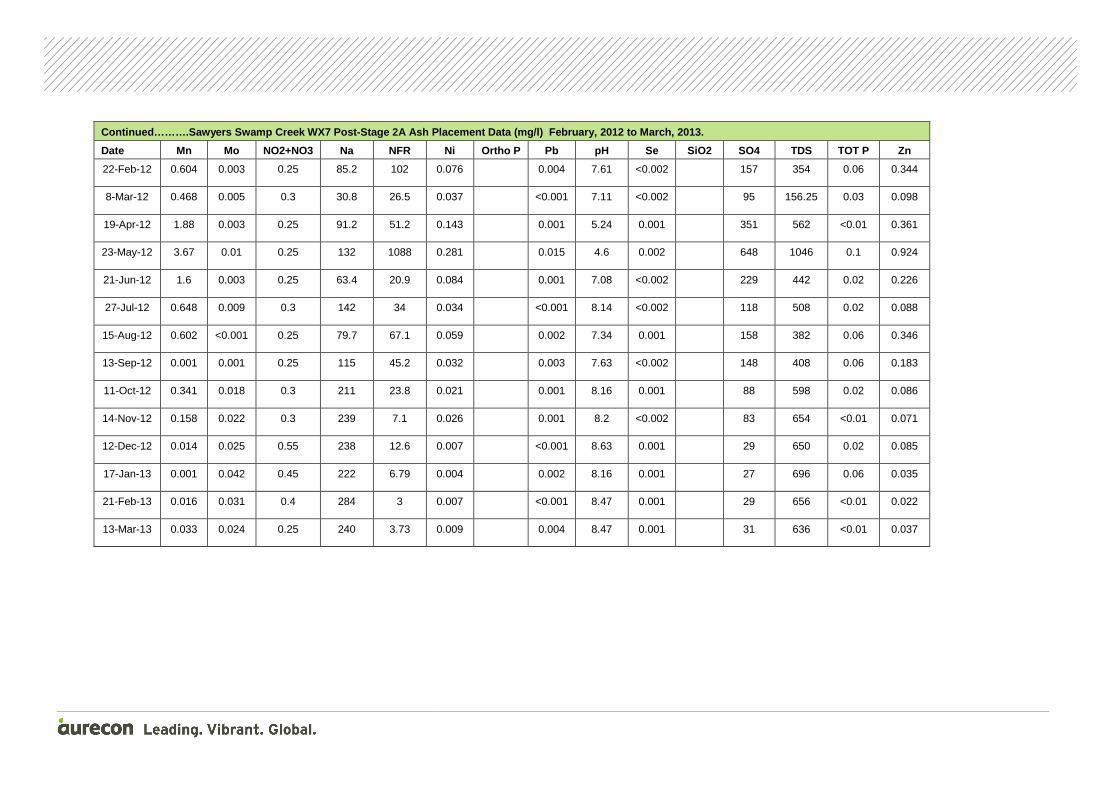
Continued……….Sawyers Swamp Creek WX7 Post-Stage 2A Ash Placement Data (mg/l) February, 2012 to March, 2013.
Date Mn Mo NO2+NO3 Na NFR Ni Ortho P Pb pH Se SiO2 SO4 TDS TOT P Zn
22-Feb-12 0.604 0.003 0.25 85.2 102 0.076 0.004 7.61 <0.002 157 354 0.06 0.344
8-Mar-12 0.468 0.005 0.3 30.8 26.5 0.037 <0.001 7.11 <0.002 95 156.25 0.03 0.098
19-Apr-12 1.88 0.003 0.25 91.2 51.2 0.143 0.001 5.24 0.001 351 562 <0.01 0.361
23-May-12 3.67 0.01 0.25 132 1088 0.281 0.015 4.6 0.002 648 1046 0.1 0.924
21-Jun-12 1.6 0.003 0.25 63.4 20.9 0.084 0.001 7.08 <0.002 229 442 0.02 0.226
27-Jul-12 0.648 0.009 0.3 142 34 0.034 <0.001 8.14 <0.002 118 508 0.02 0.088
15-Aug-12 0.602 <0.001 0.25 79.7 67.1 0.059 0.002 7.34 0.001 158 382 0.06 0.346
13-Sep-12 0.001 0.001 0.25 115 45.2 0.032 0.003 7.63 <0.002 148 408 0.06 0.183
11-Oct-12 0.341 0.018 0.3 211 23.8 0.021 0.001 8.16 0.001 88 598 0.02 0.086
14-Nov-12 0.158 0.022 0.3 239 7.1 0.026 0.001 8.2 <0.002 83 654 <0.01 0.071
12-Dec-12 0.014 0.025 0.55 238 12.6 0.007 <0.001 8.63 0.001 29 650 0.02 0.085
17-Jan-13 0.001 0.042 0.45 222 6.79 0.004 0.002 8.16 0.001 27 696 0.06 0.035
21-Feb-13 0.016 0.031 0.4 284 3 0.007 <0.001 8.47 0.001 29 656 <0.01 0.022
13-Mar-13 0.033 0.024 0.25 240 3.73 0.009 0.004 8.47 0.001 31 636 <0.01 0.037
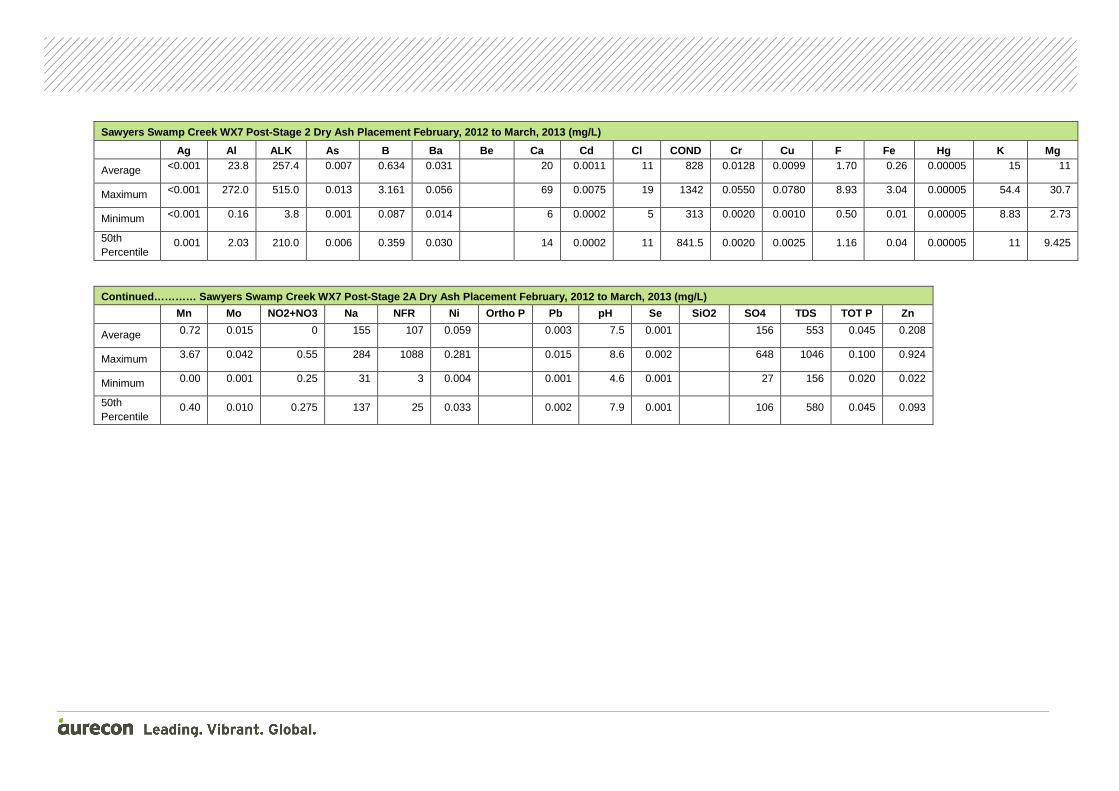
Sawyers Swamp Creek WX7 Post-Stage 2 Dry Ash Placem ent February, 2012 to March, 2013 (mg/L)
Ag Al ALK As B Ba Be Ca Cd Cl COND Cr Cu F Fe Hg K Mg
Average <0.001 23.8 257.4 0.007 0.634 0.031 20 0.0011 11 828 0.0128 0.0099 1.70 0.26 0.00005 15 11
Maximum <0.001 272.0 515.0 0.013 3.161 0.056 69 0.0075 19 1342 0.0550 0.0780 8.93 3.04 0.00005 54.4 30.7
Minimum <0.001 0.16 3.8 0.001 0.087 0.014 6 0.0002 5 313 0.0020 0.0010 0.50 0.01 0.00005 8.83 2.73
50th Percentile
0.001 2.03 210.0 0.006 0.359 0.030 14 0.0002 11 841.5 0.0020 0.0025 1.16 0.04 0.00005 11 9.425
Continued………… Sawyers Swamp Creek WX7 Post-Stage 2A Dry Ash Placement February, 2012 to March, 2013 (m g/L)
Mn Mo NO2+NO3 Na NFR Ni Ortho P Pb pH Se SiO2 SO4 T DS TOT P Zn
Average 0.72 0.015 0 155 107 0.059 0.003 7.5 0.001 156 553 0.045 0.208
Maximum 3.67 0.042 0.55 284 1088 0.281 0.015 8.6 0.002 648 1046 0.100 0.924
Minimum 0.00 0.001 0.25 31 3 0.004 0.001 4.6 0.001 27 156 0.020 0.022
50th Percentile
0.40 0.010 0.275 137 25 0.033 0.002 7.9 0.001 106 580 0.045 0.093
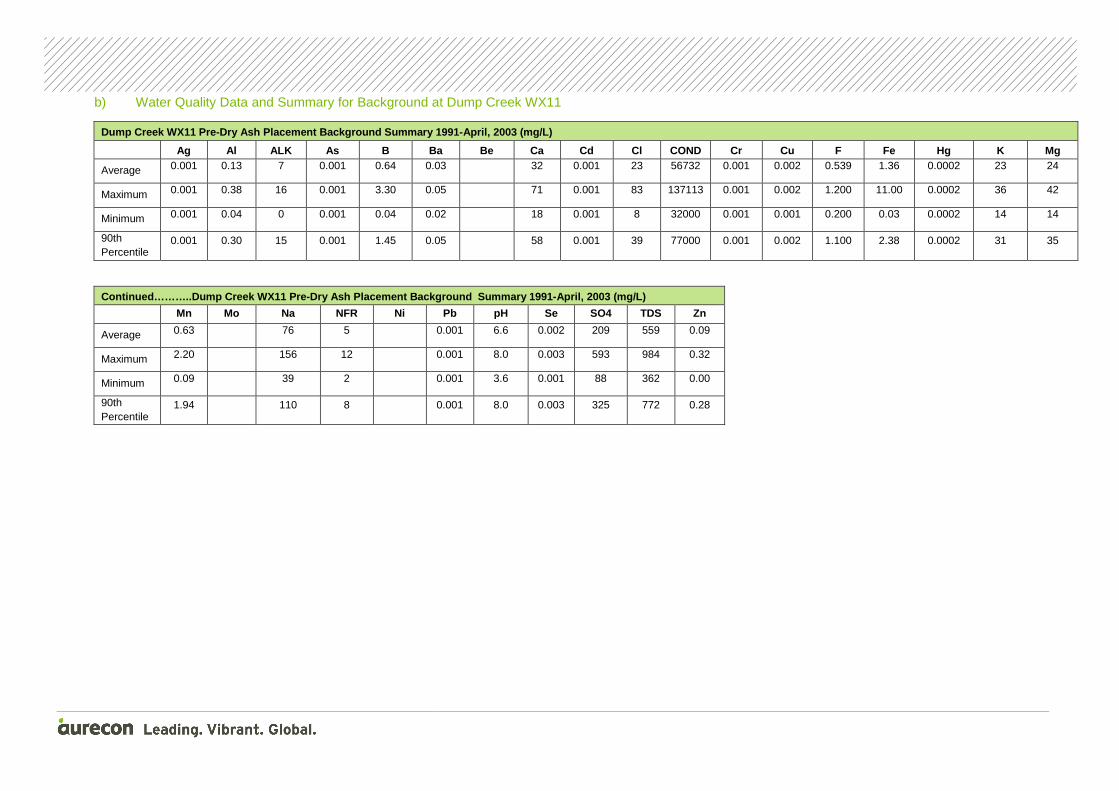
b) Water Quality Data and Summary for Background at Dump Creek WX11
Dump Creek WX11 Pre-Dry Ash Placement Background Su mmary 1991-April, 2003 (mg/L)
Ag Al ALK As B Ba Be Ca Cd Cl COND Cr Cu F Fe Hg K Mg
Average 0.001 0.13 7 0.001 0.64 0.03 32 0.001 23 56732 0.001 0.002 0.539 1.36 0.0002 23 24
Maximum 0.001 0.38 16 0.001 3.30 0.05 71 0.001 83 137113 0.001 0.002 1.200 11.00 0.0002 36 42
Minimum 0.001 0.04 0 0.001 0.04 0.02 18 0.001 8 32000 0.001 0.001 0.200 0.03 0.0002 14 14
90th Percentile
0.001 0.30 15 0.001 1.45 0.05 58 0.001 39 77000 0.001 0.002 1.100 2.38 0.0002 31 35
Continued………..Dump Creek WX11 Pre-Dry Ash Placement Background Summary 1991-April, 2003 (mg/L)
Mn Mo Na NFR Ni Pb pH Se SO4 TDS Zn
Average 0.63 76 5 0.001 6.6 0.002 209 559 0.09
Maximum 2.20 156 12 0.001 8.0 0.003 593 984 0.32
Minimum 0.09 39 2 0.001 3.6 0.001 88 362 0.00
90th Percentile
1.94 110 8 0.001 8.0 0.003 325 772 0.28

Dump Creek WX11 Post-Dry Ash Placement Data (mg/l) February, 2012 to March, 2013
Date Ag Al ALK As B Ba Be Ca Cd Cl COND Cr Cu F Fe Hg K Mg 22-Feb-12 0.001 0.5 20 <0.001 2 0.02 55 0.0002 21 1100 0.001 0.002 0.5 0.27 0.00005 24 48
8-Mar-12 0.001 0.21 20 <0.001 0.89 0.016 38 0.0002 18 670 0.001 0.002 0.4 0.33 0.00005 15 25
19-Apr-12 0.001 1.6 20 <0.001 2.6 0.025 62 0.0002 24 1400 0.001 0.003 1.4 3.3 0.00005 28 59
23-May-12 0.001 1.5 20 <0.001 2.8 0.025 68 0.0003 24 1600 0.001 0.005 1.3 6.4 0.00005 31 67
21-Jun-12 0.001 1.1 20 <0.001 2.5 0.027 73 0.0003 26 1400 0.001 0.003 1.1 3.8 0.00005 27 65
27-Jul-12 0.001 0.89 20 <0.001 2.2 0.026 73 0.0002 26 1400 0.001 0.002 0.9 1.2 0.00005 24 64
15-Aug-12 0.001 2.2 20 <0.001 2.8 0.026 81 0.0003 28 1600 0.001 0.005 1.7 4.5 0.00005 30 72
13-Sep-12 0.001 0.49 20 0.001 1.6 0.023 57 0.0002 55 1300 0.001 0.009 0.5 0.89 0.00005 28 50
11-Oct-12 0.001 2 20 <0.001 3 0.024 69 0.0004 24 1500 0.001 0.007 1.6 21 0.00005 30 66
14-Nov-12 0.001 2.3 20 <0.001 3.7 0.039 84 0.0004 25 1900 0.001 0.004 3 11 0.00005 38 76
12-Dec-12 0.001 2.5 25 <0.001 3.5 0.022 82 0.0005 23 1900 0.001 0.005 2 10 0.00005 41 75
17-Jan-13 0.001 4 25 <0.001 3.4 0.038 79 0.0007 29 1800 0.001 0.013 1.8 11 0.00005 38 75
21-Feb-13 0.001 3.3 25 0.001 3.4 0.02 90 0.0006 23 1800 0.001 0.008 2.5 11 0.00005 39 79
13-Mar-13 0.001 2.8 25 <0.001 3.1 0.022 89 0.0006 110 1900 0.004 0.007 0.3 8.8 0.00005 40 79

Continued……………………..Dump Creek WX11 Post-Dry Ash Pla cement Data (mg/l) February, 2012 to March, 2013
Date Mn Mo Na NFR Ni Pb pH Se SO4 TDS Zn
22-Feb-12 4.3 0.01 90 0.27 0.001 3.9 0.002 490 740 0.57
8-Mar-12 1.3 0.01 51 0.1 0.001 6.5 0.002 270 440 0.21
19-Apr-12 5 0.01 110 0.34 0.001 3.4 0.002 620 980 0.85
23-May-12 6.5 0.01 110 0.46 0.001 3.3 0.002 730 1100 1.1
21-Jun-12 6.2 0.01 100 0.39 0.001 3.4 0.002 690 1100 0.9
27-Jul-12 6.3 0.01 94 0.33 0.001 3.5 0.002 670 1000 0.71
15-Aug-12 7.2 0.01 120 0.48 0.001 3.4 0.002 780 1200 1.2
13-Sep-12 4.1 0.01 120 0.16 0.001 3.5 0.002 540 860 0.4
11-Oct-12 6.9 0.01 110 0.49 0.003 3.2 0.002 710 1100 1.3
14-Nov-12 8.5 0.01 130 0.59 0.003 3 0.002 860 1200 1.5
12-Dec-12 8.1 0.01 120 0.6 0.004 3.2 0.002 900 1300 1.6
17-Jan-13 7.6 0.01 110 0.57 0.008 3.1 0.002 820 1200 1.7
21-Feb-13 7.9 0.01 150 0.59 0.004 3.1 0.002 880 1300 1.6
13-Mar-13 8.1 0.01 130 0.62 0.004 3.1 0.002 850 1300 1.7

Dump Creek WX11 Post-Stage 2 Dry Ash Placement Febr uary, 2012 to March, 2013 (mg/L)
Ag Al ALK As B Ba Be Ca Cd Cl COND Cr Cu F Fe Hg K Mg
Average <0.001 1.8 21.4 0.001 2.678 0.025 71 0.0004 33 1519 0.0012 0.0054 1.36 6.68 0.00005 31 64
Maximum <0.001 4.0 25.0 0.001 3.700 0.039 90 0.0007 110 1900 0.0040 0.0130 3.00 21.00 0.00005 41 79
Minimum <0.001 0.21 <20 0.001 0.890 0.016 38 0.0002 18 670 0.0010 0.0020 0.30 0.27 0.00005 15 25
50th Percentile
<0.001 1.80 20.0 0.001 2.800 0.025 73 0.0003 24.5 1550 0.0010 0.0050 1.35 5.45 0.00005 30 66.5
Continued…………….Dump Creek WX11 Post-Stage 2 Dry Ash Placement February, 2012 to March, 2013 (mg/L)
Mn Mo Na NFR Ni Pb pH Se SO4 TDS Zn
Average 6.29 0.010 110 0.428 0.002 3.5 0.002 701 1059 1.096
Maximum 8.50 0.010 150 0.620 0.008 6.5 0.002 900 1300 1.700
Minimum 1.30 0.010 51 0.100 0.001 3 0.002 270 440 0.210
50th Percentile
6.70 0.010 110 0.470 0.001 3.35 0.002 720 1100 1.150
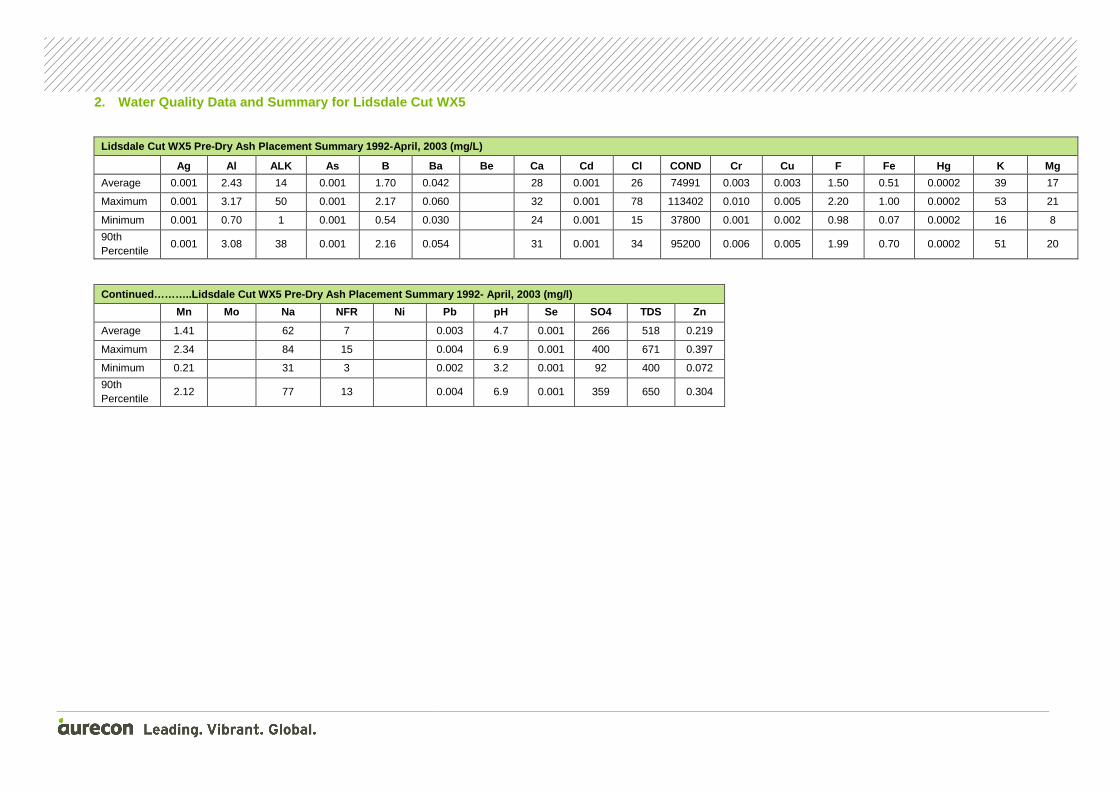
2. Water Quality Data and Summary for Lidsdale Cut WX5
Lidsdale Cut WX5 Pre-Dry Ash Placement Summary 1992 -April, 2003 (mg/L) Ag Al ALK As B Ba Be Ca Cd Cl COND Cr Cu F Fe Hg K Mg
Average 0.001 2.43 14 0.001 1.70 0.042 28 0.001 26 74991 0.003 0.003 1.50 0.51 0.0002 39 17
Maximum 0.001 3.17 50 0.001 2.17 0.060 32 0.001 78 113402 0.010 0.005 2.20 1.00 0.0002 53 21
Minimum 0.001 0.70 1 0.001 0.54 0.030 24 0.001 15 37800 0.001 0.002 0.98 0.07 0.0002 16 8
90th Percentile
0.001 3.08 38 0.001 2.16 0.054 31 0.001 34 95200 0.006 0.005 1.99 0.70 0.0002 51 20
Continued………..Lidsdale Cut WX5 Pre-Dry Ash Placemen t Summary 1992- April, 2003 (mg/l) Mn Mo Na NFR Ni Pb pH Se SO4 TDS Zn
Average 1.41 62 7 0.003 4.7 0.001 266 518 0.219
Maximum 2.34 84 15 0.004 6.9 0.001 400 671 0.397
Minimum 0.21 31 3 0.002 3.2 0.001 92 400 0.072
90th Percentile
2.12 77 13 0.004 6.9 0.001 359 650 0.304

Lidsdale Cut WX5 Post-Dry Ash Placement Data (mg/l) February, 2012 to March, 2013
Date Ag Al ALK As B Ba Be Ca Cd Cl COND Cr Cu F Fe Hg K Mg
22-Feb-12 0.001 9.2 130 0.002 0.87 0.029 24 0.0015 13 710 0.001 0.003 1.2 <0.01 0.00005 18 11
8-Mar-12 0.001 0.28 85 0.001 0.11 0.032 5.8 0.0002 11 290 <0.001 <0.001 0.2 0.23 0.00005 4 4
19-Apr-12 0.001 1.4 110 0.001 0.29 0.032 11 0.0002 13 420 <0.001 0.002 0.5 0.02 0.00005 7 7
23-May-12 0.001 3.5 100 0.001 0.55 0.037 19 0.0007 15 590 0.001 0.002 0.8 0.02 0.00005 10 10
21-Jun-12 <0.001 65 20 <0.001 4.5 0.032 93 0.016 21 1700 0.011 0.02 13 0.22 <0.00005 72 36
27-Jul-12
15-Aug-12
13-Sep-12
11-Oct-12
14-Nov-12
12-Dec-12
17-Jan-13
21-Feb-13
13-Mar-13

Continued…….Lidsdale Cut WX5 Post-Dry Ash Placement Data (mg/l) February, 2012 to March, 2013
Date Mn Mo Na NFR Ni Pb pH Se SO4 TDS Zn
22-Feb-12 1 0.01 110 0.08 0.001 7.3 0.002 190 420 0.2
8-Mar-12 0.045 0.01 54 0.01 0.001 8 0.002 38 150 0.03
19-Apr-12 0.26 0.01 76 0.01 0.001 7.6 0.002 83 280 0.03
23-May-12 0.74 0.01 84 0.03 0.001 7.2 0.002 160 360 0.07
21-Jun-12 5.4 <0.01 100 0.44 0.002 4.2 0.003 1000 1600 1.2
27-Jul-12
15-Aug-12
13-Sep-12
11-Oct-12
14-Nov-12
12-Dec-12
17-Jan-13
21-Feb-13
13-Mar-13

Lidsdale Cut WX5 Post-Stage 2 Dry Ash Placement Feb ruary, 2012 to March, 2013 (mg/L)
Ag Al ALK As B Ba Be Ca Cd Cl COND Cr Cu F Fe Hg K Mg
Average <0.001 15.9 89.0 0.001 1.264 0.032 31 0.0037 15 742 0.0043 0.0068 3.14 0.12 0.00005 22 14
Maximum <0.001 65.0 130.0 0.002 4.500 0.037 93 0.0160 21 1700 0.0110 0.0200 13.00 0.23 0.00005 72 36
Minimum <0.001 0.28 20 0.001 0.110 0.029 6 0.0002 11 290 0.0010 0.0020 0.20 0.02 0.00005 4 4
50th Percentile
<0.001 3.50 100.0 0.001 0.550 0.032 19 0.0007 13 590 0.0010 0.0025 0.80 0.12 0.00005 10 10
Continued………..Lidsdale Cut WX5 Post-Stage 2 Dry Ash Placement February, 2012 to March, 2013 (mg/L)
Mn Mo Na NFR Ni Pb pH Se SO4 TDS Zn
Average 1.49 0.010 85 0.114 0.001 6.9 0.002 294 303 0.306
Maximum 5.40 0.010 110 0.440 0.002 8 0.003 1000 420 1.200
Minimum 0.05 0.010 54 0.010 0.001 4.2 0.002 38 150 0.030
50th Percentile
0.74 0.010 84 0.030 0.001 7.3 0.002 160 320 0.070
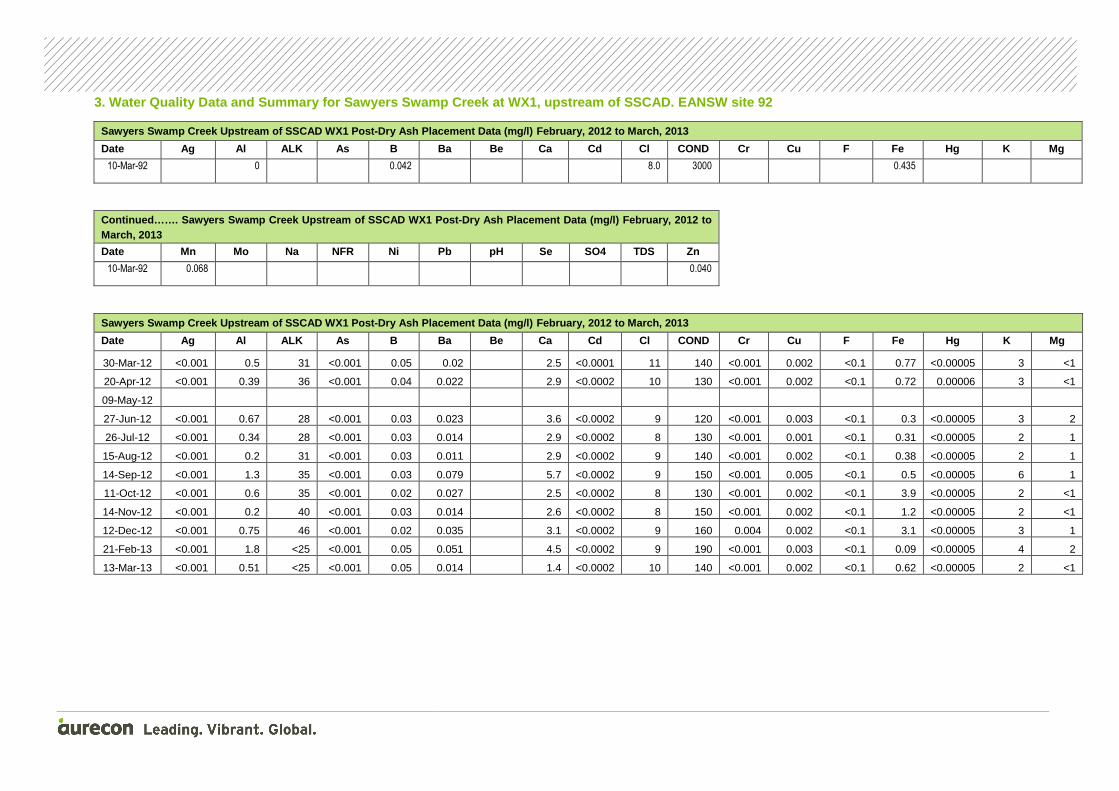
3. Water Quality Data and Summary for Sawyers Swamp Creek at WX1, upstream of SSCAD. EANSW site 92
Sawyers Swamp Creek Upstream of SSCAD WX1 Post-Dry Ash Placement Data (mg/l) February, 2012 to March, 2013
Date Ag Al ALK As B Ba Be Ca Cd Cl COND Cr Cu F Fe Hg K Mg
10-Mar-92 0 0.042 8.0 3000 0.435
Continued……. Sawyers Swamp Creek Upstream of SSCAD WX1 Post-Dry Ash Placement Data (mg/l) February, 2012 to March, 2013
Date Mn Mo Na NFR Ni Pb pH Se SO4 TDS Zn
10-Mar-92 0.068 0.040
Sawyers Swamp Creek Upstream of SSCAD WX1 Post-Dry Ash Placement Data (mg/l) February, 2012 to March, 2013
Date Ag Al ALK As B Ba Be Ca Cd Cl COND Cr Cu F Fe Hg K Mg
30-Mar-12 <0.001 0.5 31 <0.001 0.05 0.02 2.5 <0.0001 11 140 <0.001 0.002 <0.1 0.77 <0.00005 3 <1
20-Apr-12 <0.001 0.39 36 <0.001 0.04 0.022 2.9 <0.0002 10 130 <0.001 0.002 <0.1 0.72 0.00006 3 <1
09-May-12
27-Jun-12 <0.001 0.67 28 <0.001 0.03 0.023 3.6 <0.0002 9 120 <0.001 0.003 <0.1 0.3 <0.00005 3 2
26-Jul-12 <0.001 0.34 28 <0.001 0.03 0.014 2.9 <0.0002 8 130 <0.001 0.001 <0.1 0.31 <0.00005 2 1
15-Aug-12 <0.001 0.2 31 <0.001 0.03 0.011 2.9 <0.0002 9 140 <0.001 0.002 <0.1 0.38 <0.00005 2 1
14-Sep-12 <0.001 1.3 35 <0.001 0.03 0.079 5.7 <0.0002 9 150 <0.001 0.005 <0.1 0.5 <0.00005 6 1
11-Oct-12 <0.001 0.6 35 <0.001 0.02 0.027 2.5 <0.0002 8 130 <0.001 0.002 <0.1 3.9 <0.00005 2 <1
14-Nov-12 <0.001 0.2 40 <0.001 0.03 0.014 2.6 <0.0002 8 150 <0.001 0.002 <0.1 1.2 <0.00005 2 <1
12-Dec-12 <0.001 0.75 46 <0.001 0.02 0.035 3.1 <0.0002 9 160 0.004 0.002 <0.1 3.1 <0.00005 3 1
21-Feb-13 <0.001 1.8 <25 <0.001 0.05 0.051 4.5 <0.0002 9 190 <0.001 0.003 <0.1 0.09 <0.00005 4 2
13-Mar-13 <0.001 0.51 <25 <0.001 0.05 0.014 1.4 <0.0002 10 140 <0.001 0.002 <0.1 0.62 <0.00005 2 <1
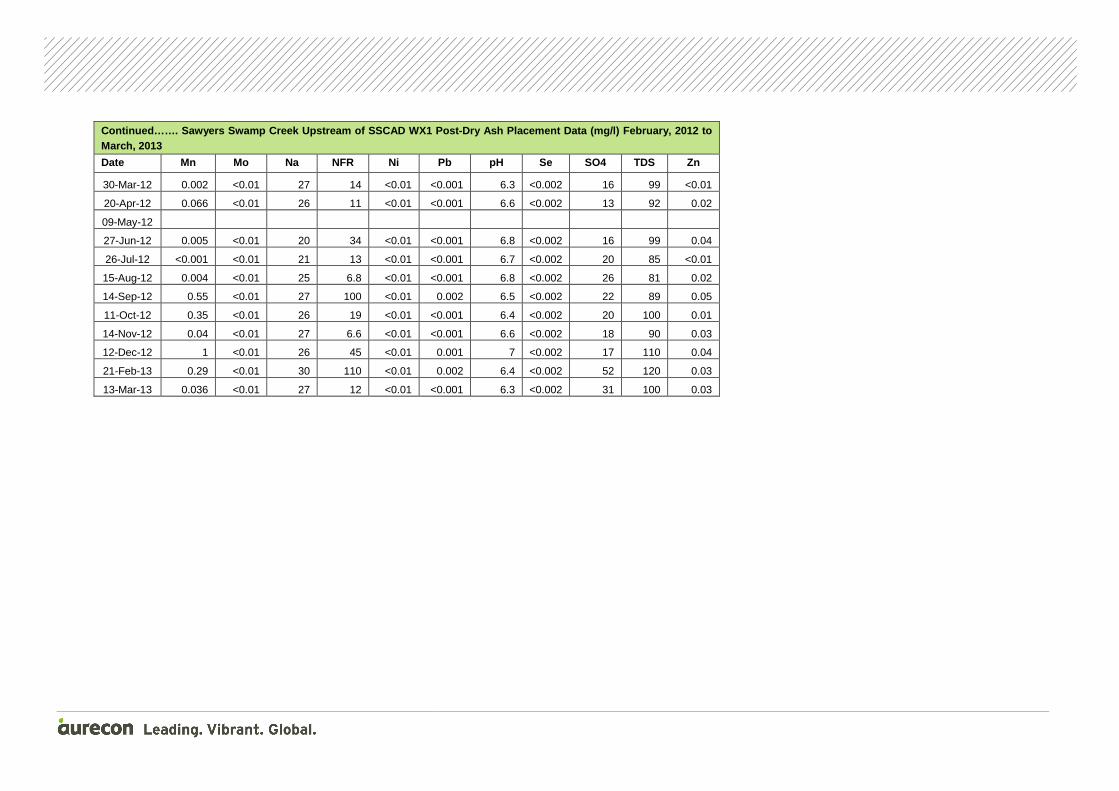
Continued……. Sawyers Swamp Creek Upstream of SSCAD WX1 Post-Dry Ash Placement Data (mg/l) February, 2012 to March, 2013
Date Mn Mo Na NFR Ni Pb pH Se SO4 TDS Zn
30-Mar-12 0.002 <0.01 27 14 <0.01 <0.001 6.3 <0.002 16 99 <0.01
20-Apr-12 0.066 <0.01 26 11 <0.01 <0.001 6.6 <0.002 13 92 0.02
09-May-12
27-Jun-12 0.005 <0.01 20 34 <0.01 <0.001 6.8 <0.002 16 99 0.04
26-Jul-12 <0.001 <0.01 21 13 <0.01 <0.001 6.7 <0.002 20 85 <0.01
15-Aug-12 0.004 <0.01 25 6.8 <0.01 <0.001 6.8 <0.002 26 81 0.02
14-Sep-12 0.55 <0.01 27 100 <0.01 0.002 6.5 <0.002 22 89 0.05
11-Oct-12 0.35 <0.01 26 19 <0.01 <0.001 6.4 <0.002 20 100 0.01
14-Nov-12 0.04 <0.01 27 6.6 <0.01 <0.001 6.6 <0.002 18 90 0.03
12-Dec-12 1 <0.01 26 45 <0.01 0.001 7 <0.002 17 110 0.04
21-Feb-13 0.29 <0.01 30 110 <0.01 0.002 6.4 <0.002 52 120 0.03
13-Mar-13 0.036 <0.01 27 12 <0.01 <0.001 6.3 <0.002 31 100 0.03
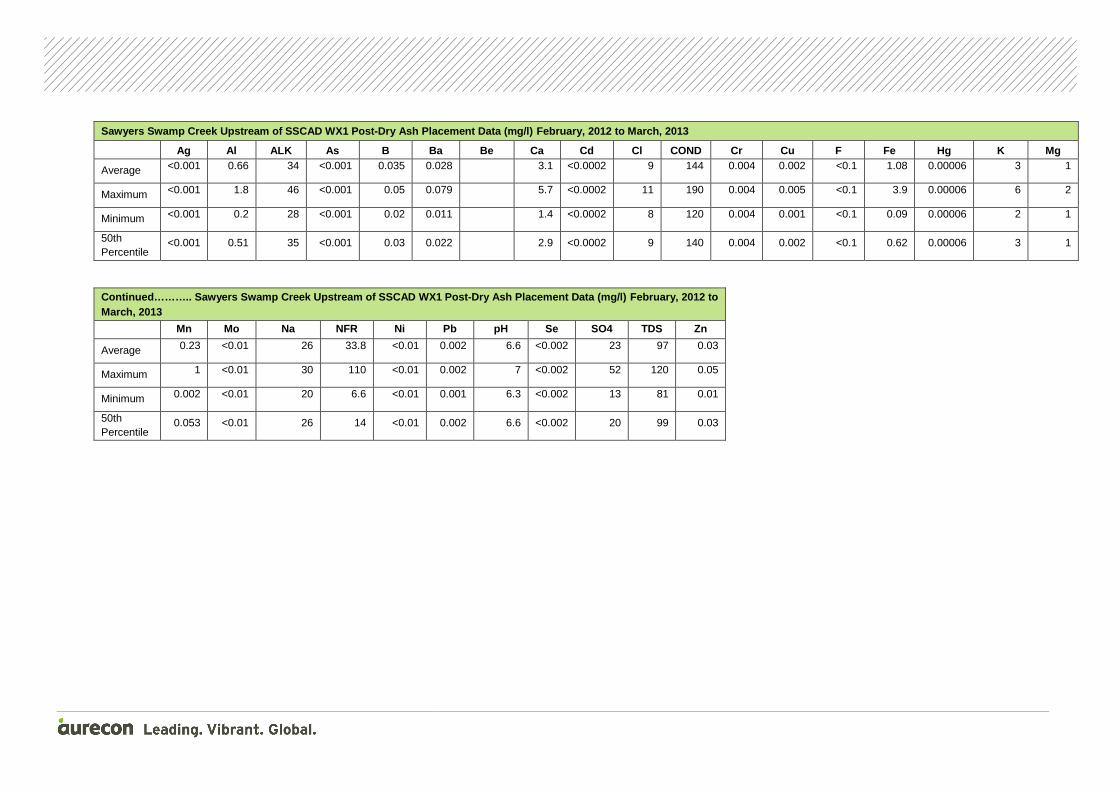
Sawyers Swamp Creek Upstream of SSCAD WX1 Post-Dry Ash Placement Data (mg/l) February, 2012 to March, 2013
Ag Al ALK As B Ba Be Ca Cd Cl COND Cr Cu F Fe Hg K Mg
Average <0.001 0.66 34 <0.001 0.035 0.028 3.1 <0.0002 9 144 0.004 0.002 <0.1 1.08 0.00006 3 1
Maximum <0.001 1.8 46 <0.001 0.05 0.079 5.7 <0.0002 11 190 0.004 0.005 <0.1 3.9 0.00006 6 2
Minimum <0.001 0.2 28 <0.001 0.02 0.011 1.4 <0.0002 8 120 0.004 0.001 <0.1 0.09 0.00006 2 1
50th Percentile
<0.001 0.51 35 <0.001 0.03 0.022 2.9 <0.0002 9 140 0.004 0.002 <0.1 0.62 0.00006 3 1
Continued……….. Sawyers Swamp Creek Upstream of SSCA D WX1 Post-Dry Ash Placement Data (mg/l) February, 2012 to March, 2013
Mn Mo Na NFR Ni Pb pH Se SO4 TDS Zn
Average 0.23 <0.01 26 33.8 <0.01 0.002 6.6 <0.002 23 97 0.03
Maximum 1 <0.01 30 110 <0.01 0.002 7 <0.002 52 120 0.05
Minimum 0.002 <0.01 20 6.6 <0.01 0.001 6.3 <0.002 13 81 0.01
50th Percentile
0.053 <0.01 26 14 <0.01 0.002 6.6 <0.002 20 99 0.03

4. Water Quality Data and Summary for SSCAD Groundwate r Seepage Detection Bores WGM1/D3 and 1/D4
a) Water Quality Data and Summary for WGM1/D3
WGM1/D3 Pre-Dry Ash Placement Summary 1988- April, 2003 (mg/L) Ag ALK Al As B Ba Be Ca Cd Cl COND Cr Cu F Fe Hg K Mg
Average 0.001 115 0.010 0.05 0.292 18.7 0.001 64 62308 0.009 0.005 0.19 4.9 0.0004 8 20.0
Maximum 0.001 229 0.043 0.22 5.700 31.0 0.001 140 77320 0.026 0.040 0.73 21.0 0.0009 38 28.0
Minimum 0.001 8 0.001 0.005 0.080 6.3 0.001 25 34200 0.001 0.001 0.040 0.5 0.0001 1 2.0
90th Percentile
0.001 154 0.027 0.19 0.150 24.0 0.001 77 72000 0.020 0.010 0.33 9.4 0.0007 9 25.0
Continued……….. WGM1/D3 Pre-Dry Ash Placement Summar y 1988- April, 2003 (mg/L)
Mn Mo Na Ni Pb pH Se SO4 TDS WL1
WL AHD
Zn
Average 0.592 69 0.080 0.008 6.0 0.001 94 349 10.0 920.2 0.061
Maximum 1.930 109 0.092 0.074 6.9 0.003 144 660 11.1 921.5 0.200
Minimum 0.080 31 0.071 0.001 4.6 0.001 20 125 8.7 919.1 0.010
90th Percentile
0.710 85 0.089 0.014 6.4 0.002 116 470 10.9 921.3 0.110
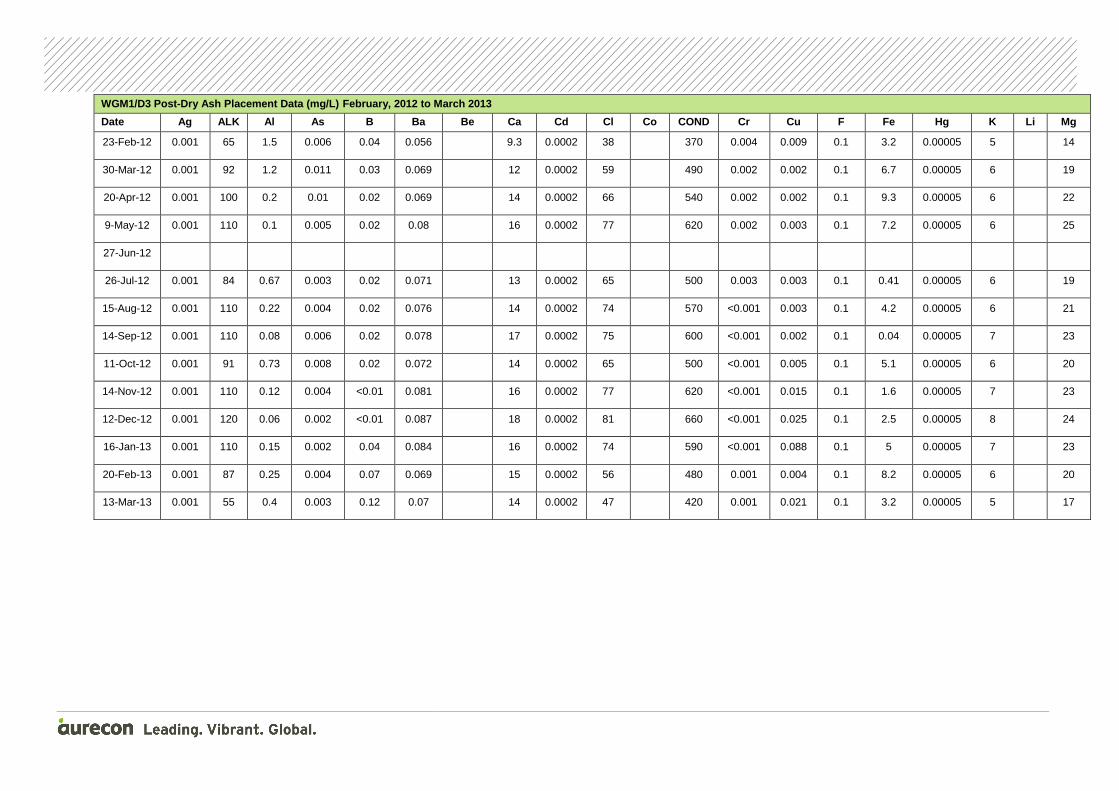
WGM1/D3 Post-Dry Ash Placement Data (mg/L) February, 2012 to March 2013
Date Ag ALK Al As B Ba Be Ca Cd Cl Co COND Cr Cu F Fe Hg K Li Mg
23-Feb-12 0.001 65 1.5 0.006 0.04 0.056 9.3 0.0002 38 370 0.004 0.009 0.1 3.2 0.00005 5 14
30-Mar-12 0.001 92 1.2 0.011 0.03 0.069 12 0.0002 59 490 0.002 0.002 0.1 6.7 0.00005 6 19
20-Apr-12 0.001 100 0.2 0.01 0.02 0.069 14 0.0002 66 540 0.002 0.002 0.1 9.3 0.00005 6 22
9-May-12 0.001 110 0.1 0.005 0.02 0.08 16 0.0002 77 620 0.002 0.003 0.1 7.2 0.00005 6 25
27-Jun-12
26-Jul-12 0.001 84 0.67 0.003 0.02 0.071 13 0.0002 65 500 0.003 0.003 0.1 0.41 0.00005 6 19
15-Aug-12 0.001 110 0.22 0.004 0.02 0.076 14 0.0002 74 570 <0.001 0.003 0.1 4.2 0.00005 6 21
14-Sep-12 0.001 110 0.08 0.006 0.02 0.078 17 0.0002 75 600 <0.001 0.002 0.1 0.04 0.00005 7 23
11-Oct-12 0.001 91 0.73 0.008 0.02 0.072 14 0.0002 65 500 <0.001 0.005 0.1 5.1 0.00005 6 20
14-Nov-12 0.001 110 0.12 0.004 <0.01 0.081 16 0.0002 77 620 <0.001 0.015 0.1 1.6 0.00005 7 23
12-Dec-12 0.001 120 0.06 0.002 <0.01 0.087 18 0.0002 81 660 <0.001 0.025 0.1 2.5 0.00005 8 24
16-Jan-13 0.001 110 0.15 0.002 0.04 0.084 16 0.0002 74 590 <0.001 0.088 0.1 5 0.00005 7 23
20-Feb-13 0.001 87 0.25 0.004 0.07 0.069 15 0.0002 56 480 0.001 0.004 0.1 8.2 0.00005 6 20
13-Mar-13 0.001 55 0.4 0.003 0.12 0.07 14 0.0002 47 420 0.001 0.021 0.1 3.2 0.00005 5 17

Continued…….WGM1/D3 Post-Dry Ash Placement Data (mg /L) February, 2012 to March 2013
Date Mn Mo Na Ni Pb pH Se SO4 TDS WL1 WL
AHD Zn
23-Feb-12 1 0.01 49 0.14 0.005 5.8 0.002 45 310 9.5 920.70 0.09
30-Mar-12 1.2 0.01 62 0.15 0.002 6.1 0.002 55 350 9.6 920.60 0.07
20-Apr-12 1.1 0.01 69 0.14 0.001 7.4 0.002 60 340 9.8 920.40 0.05
9-May-12 0.8 0.01 65 0.13 0.001 6.3 0.002 66 350 0.07
27-Jun-12
26-Jul-12 0.58 0.01 60 0.1 0.002 6 0.002 58 310 9.9 920.30 0.09
15-Aug-12 0.64 0.01 66 0.11 0.001 6 0.002 68 370 9.9 920.30 0.1
14-Sep-12 0.63 0.01 72 0.11 0.002 6.4 0.002 73 340 10 920.20 0.22
11-Oct-12 0.57 0.01 66 0.1 0.002 6 0.002 68 300 10 920.20 0.32
14-Nov-12 0.66 0.01 71 0.12 0.001 6.2 0.002 78 330 10.2 920.00 0.04
12-Dec-12 0.71 0.01 76 0.13 0.001 6.1 0.002 81 410 10.3 919.90 0.07
16-Jan-13 0.82 0.01 66 0.14 0.001 6.1 0.002 73 330 10.1 920.10 0.06
20-Feb-13 1 0.01 62 0.11 0.001 6.1 0.002 62 300 9.7 920.50 0.03
13-Mar-13 0.95 0.01 46 0.09 0.001 5.7 0.002 71 280 9.4 920.80 0.05

WGM1/D3 Post-Stage 2 Dry Ash Placement February, 20 12 to March 2013 (mg/L)
Ag ALK Al As B Ba Be Ca Cd Cl COND Cr Cu F Fe Hg K Mg
Average <0.001 96 0.44 0.0052 0.04 0.074 14 0.0002 66 535 0.0021 0.0140 0.10 4.4 0.00005 6 21
Maximum <0.001 120 1.50 0.0110 0.12 0.087 18 0.0002 81 660 0.0040 0.0880 0.10 9.3 0.00005 8 25
Minimum <0.001 55 0.06 0.0020 0.02 0.056 9 0.0002 38 370 0.0010 0.0020 0.10 0.0 0.00005 5 14
50th Percentile
<0.001 100 0.22 0.0040 0.02 0.072 14 0.0002 66 540 0.0020 0.0040 0.10 4.2 0.00005 6 21
Continued……….. WGM1/D3 Post-Stage 2 Dry Ash Placeme nt February, 2012 to March 2013 (mg/L)
Mn Mo Na Ni Pb pH Se SO4 TDS WL1
WL AHD
Zn
Average 0.82 0.010 64 0.121 0.002 6.2 0.002 66 332 9.9 920.3 0.097
Maximum 1.20 0.010 76 0.150 0.005 7.4 0.002 81 410 10.3 920.8 0.320
Minimum 0.57 0.010 46 0.090 0.001 5.7 0.002 45 280 9.4 919.9 0.030
50th Percentile
0.80 0.010 66 0.120 0.001 6.1 0.002 68 330 9.9 920.3 0.070

b) Water Quality Data and Summary for WGM1/D4
WGM1/D4 Pre-Dry Ash Placement Summary 1988- April, 2003 (mg/L) Date Ag ALK As B Ba Be Ca Cd Cl COND Cr Cu F Fe Hg K Mg
Average 0.001 96 0.003 0.27 0.372 30.0 0.002 30 58408 0.005 0.012 0.15 54.6 0.0009 6 18.9
Maximum 0.001 282 0.012 0.61 6.700 58.0 0.004 86 98969 0.019 0.100 0.72 120.0 0.0033 46 47.0
Minimum 0.001 20.60 0.001 0.07 0.050 16.0 0.001 6.00 16100 0.001 0.001 0.001 0.1 0.0002 0 1.8
90th Percentile 0.001 168 0.006 0.49 0.330 43.8 0.003 45 72780 0.012 0.036 0.24 86.0 0.0020 7 26.8
Continued……………WGM1/D4 Pre-Dry Ash Placement Summary 1988- April, 2003 (mg/L)
Date Mn Mo Na Ni Pb pH Se SO4 TDS WL1 WL
AHD Zn
Average 4.588 29 0.018 0.006 6.3 0.009 118 327 1.3 905.8 0.041
Maximum 12.000 82 0.024 0.022 7.3 0.100 350 768 1.5 906.3 0.100
Minimum 0.094 4 0.011 0.001 5.2 0.001 11 96 0.8 905.3 0.004
90th Percentile 6.500 42 0.023 0.011 6.8 0.002 201 510 1.4 906.0 0.060

WGM1/D4 Post-Dry Ash Placement Data February, 2012 to March 2013 (mg/l)
Date Ag ALK Al As B Ba Be Ca Cd Cl COND Cr Cu F Fe Hg K Li Mg 23-Feb-12 0.001 20 0.02 0.002 1.4 0.016 98 0.0002 35 1500 0.001 0.001 0.1 39 0.00005 10 67
30-Mar-12 0.001 34 0.16 0.002 0.67 0.034 88 0.0002 33 1000 0.001 0.001 0.1 19 0.00005 9 41
20-Apr-12 0.001 20 0.02 0.002 1.5 0.026 100 0.0002 34 1400 0.001 0.002 0.1 45 0.00005 10 66
9-May-12 0.001 23 0.02 0.002 1.6 0.027 100 0.0002 36 1500 0.001 0.003 0.1 49 0.00005 9 72
27-Jun-12 0.001 37 0.03 0.002 1.0 0.021 93 0.0002 38 1300 0.001 0.003 0.1 49 0.00005 10 59
26-Jul-12 0.001 20 0.01 0.002 1.5 0.021 100 0.0002 35 1400 0.001 0.003 0.1 39 0.00005 12 69
15-Aug-12 0.001 21 0.02 0.002 1.5 0.021 95 0.0002 38 1400 0.001 0.001 0.1 53 0.00005 9 68
14-Sep-12 0.001 20 0.01 0.002 1.6 0.021 100 0.0002 35 1500 0.001 0.002 0.1 43 0.00005 12 69
11-Oct-12 0.001 20 <0.01 0.002 1.6 0.018 100 0.0002 34 1400 0.001 0.003 0.1 89 0.00005 9 70
14-Nov-12 0.001 20 0.01 0.002 1.9 0.021 110 0.0002 33 1600 0.001 0.003 0.1 36 0.00005 10 74
12-Dec-12 0.001 33 0.02 0.002 1.9 0.019 110 0.0002 33 1600 0.001 0.002 0.1 29 0.00005 11 75
16-Jan-13 0.001 32 0.01 0.002 2.0 0.018 110 0.0002 31 1500 0.001 0.004 0.1 28 0.00005 11 74
20-Feb-13 0.001 38 0.02 0.002 1.8 0.015 120 0.0002 32 1500 0.001 0.004 0.1 27 0.00005 10 79
13-Mar-13 0.001 35 0.45 0.002 1.2 0.023 110 0.0002 38 1500 0.001 0.007 0.1 32 0.00005 10 62

Continued…………………WGM1/D4 Post-Dry Ash Placement Data February, 2012 to March 2013 (mg/l)
Date Mn Mo Na Ni Pb pH Se SO4 TDS WL1
WL AHD
Zn
23-Feb-12 16 0.01 120 0.04 0.001 5.5 0.002 730 1200 1.1 906.02 0.07
30-Mar-12 7.1 0.01 75 0.03 0.001 5.9 0.002 460 770 1.2 905.92 0.05
20-Apr-12 15 0.01 120 0.04 0.001 5.6 0.002 720 1100 1.1 906.02 0.05
9-May-12 17 0.01 110 0.04 0.001 5.7 0.002 770 1200 0.09
27-Jun-12 12 0.01 110 0.03 0.001 5.9 0.002 670 1100 16 891.12 0.07
26-Jul-12 16 0.01 150 0.04 0.001 5 0.002 790 1300 1.1 906.02 0.06
15-Aug-12 16 0.01 110 0.04 0.001 5.4 0.002 770 1200 1.1 906.02 0.07
14-Sep-12 18 0.01 160 0.04 0.001 5.5 0.002 780 1200 1.1 906.02 0.07
11-Oct-12 17 0.01 120 0.04 0.001 5.5 0.002 760 1300 1.1 906.02 0.06
14-Nov-12 19 0.01 130 0.04 0.001 5.6 0.002 820 1300 1.2 905.92 0.06
12-Dec-12 19 0.01 130 0.04 0.001 5.8 0.002 840 1400 1.1 906.02 0.07
16-Jan-13 19 0.01 130 0.04 0.001 5.8 0.002 810 1300 1.1 906.02 0.08
20-Feb-13 18 0.01 150 0.04 0.001 5.9 0.002 820 1300 1 906.12 0.05
13-Mar-13 14 0.01 120 0.03 0.001 5.7 0.002 730 1100 1 906.12 0.06
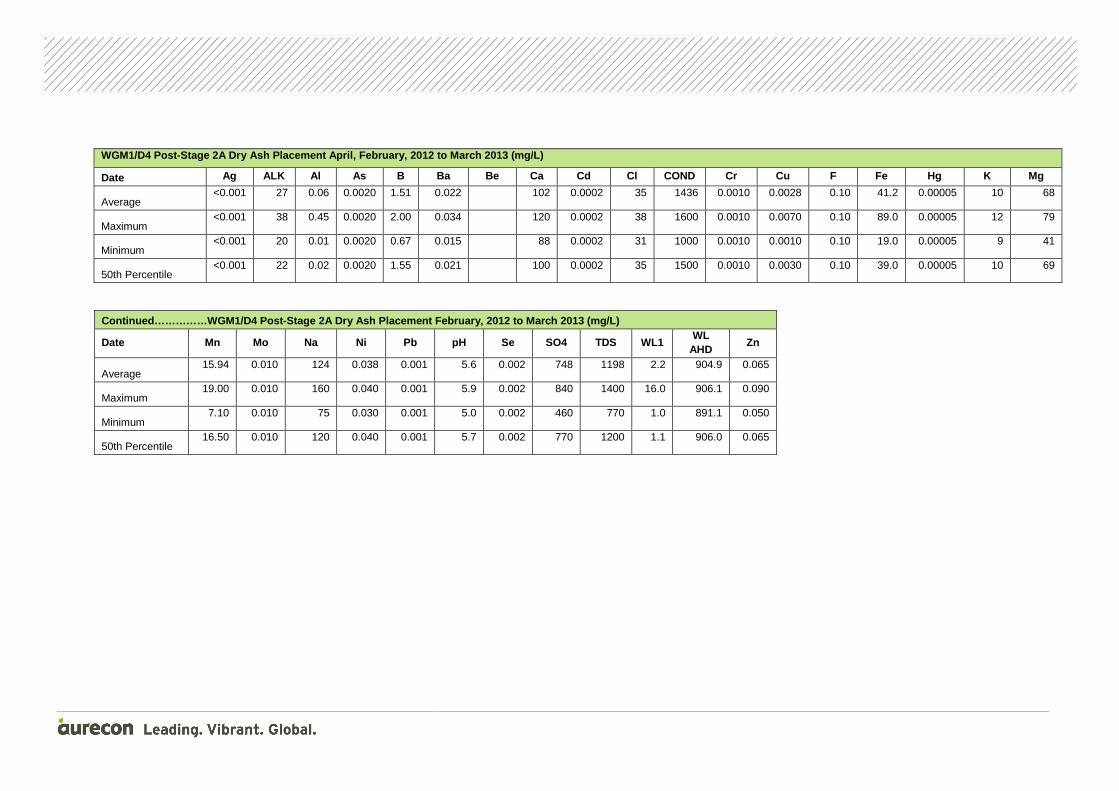
WGM1/D4 Post -Stage 2A Dry Ash Placeme nt April, February, 2012 to March 2013 (mg/L)
Date Ag ALK Al As B Ba Be Ca Cd Cl COND Cr Cu F Fe Hg K Mg
Average <0.001 27 0.06 0.0020 1.51 0.022 102 0.0002 35 1436 0.0010 0.0028 0.10 41.2 0.00005 10 68
Maximum <0.001 38 0.45 0.0020 2.00 0.034 120 0.0002 38 1600 0.0010 0.0070 0.10 89.0 0.00005 12 79
Minimum <0.001 20 0.01 0.0020 0.67 0.015 88 0.0002 31 1000 0.0010 0.0010 0.10 19.0 0.00005 9 41
50th Percentile <0.001 22 0.02 0.0020 1.55 0.021 100 0.0002 35 1500 0.0010 0.0030 0.10 39.0 0.00005 10 69
Continued……………WGM1/D4 Post-Stage 2A Dry Ash Placeme nt February, 2012 to March 2013 (mg/L)
Date Mn Mo Na Ni Pb pH Se SO4 TDS WL1 WL
AHD Zn
Average 15.94 0.010 124 0.038 0.001 5.6 0.002 748 1198 2.2 904.9 0.065
Maximum 19.00 0.010 160 0.040 0.001 5.9 0.002 840 1400 16.0 906.1 0.090
Minimum 7.10 0.010 75 0.030 0.001 5.0 0.002 460 770 1.0 891.1 0.050
50th Percentile 16.50 0.010 120 0.040 0.001 5.7 0.002 770 1200 1.1 906.0 0.065
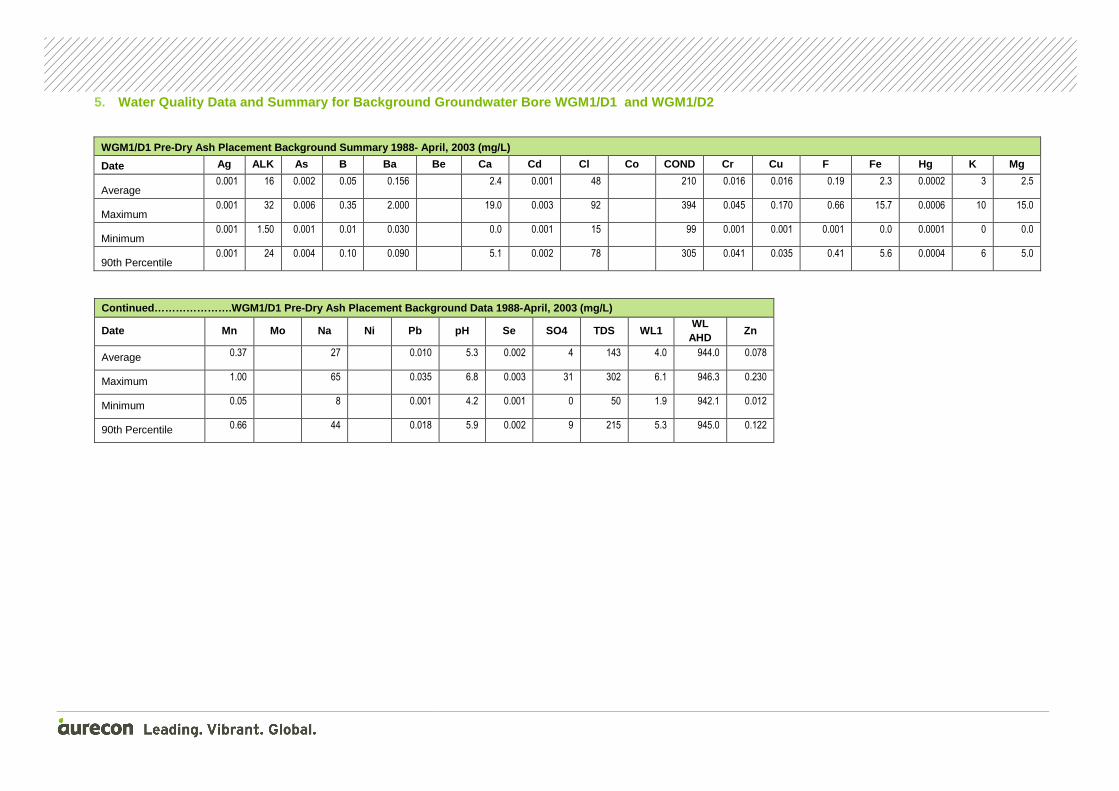
5. Water Quality Data and Summary for Background Groun dwater Bore WGM1/D1 and WGM1/D2
WGM1/D1 Pre-Dry Ash Placement Background Summary 19 88- April, 2003 (mg/L) Date Ag ALK As B Ba Be Ca Cd Cl Co COND Cr Cu F Fe Hg K Mg
Average 0.001 16 0.002 0.05 0.156 2.4 0.001 48 210 0.016 0.016 0.19 2.3 0.0002 3 2.5
Maximum 0.001 32 0.006 0.35 2.000 19.0 0.003 92 394 0.045 0.170 0.66 15.7 0.0006 10 15.0
Minimum 0.001 1.50 0.001 0.01 0.030 0.0 0.001 15 99 0.001 0.001 0.001 0.0 0.0001 0 0.0
90th Percentile 0.001 24 0.004 0.10 0.090 5.1 0.002 78 305 0.041 0.035 0.41 5.6 0.0004 6 5.0
Continued………………….WGM1/D1 Pre-Dry Ash Placement Back ground Data 1988-April, 2003 (mg/L)
Date Mn Mo Na Ni Pb pH Se SO4 TDS WL1 WL
AHD Zn
Average 0.37 27 0.010 5.3 0.002 4 143 4.0 944.0 0.078
Maximum 1.00 65 0.035 6.8 0.003 31 302 6.1 946.3 0.230
Minimum 0.05 8 0.001 4.2 0.001 0 50 1.9 942.1 0.012
90th Percentile 0.66 44 0.018 5.9 0.002 9 215 5.3 945.0 0.122
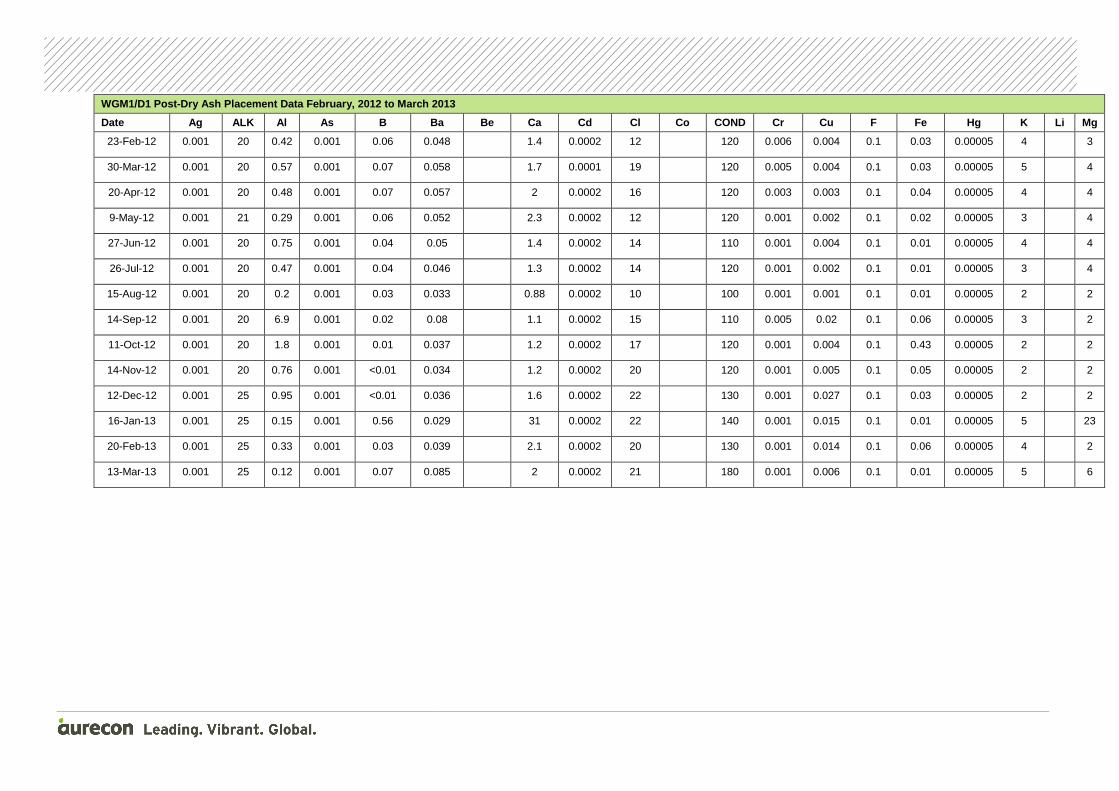
WGM1/D1 Post-Dry Ash Placement Data February, 2012 to March 2013
Date Ag ALK Al As B Ba Be Ca Cd Cl Co COND Cr Cu F Fe Hg K Li Mg
23-Feb-12 0.001 20 0.42 0.001 0.06 0.048 1.4 0.0002 12 120 0.006 0.004 0.1 0.03 0.00005 4 3
30-Mar-12 0.001 20 0.57 0.001 0.07 0.058 1.7 0.0001 19 120 0.005 0.004 0.1 0.03 0.00005 5 4
20-Apr-12 0.001 20 0.48 0.001 0.07 0.057 2 0.0002 16 120 0.003 0.003 0.1 0.04 0.00005 4 4
9-May-12 0.001 21 0.29 0.001 0.06 0.052 2.3 0.0002 12 120 0.001 0.002 0.1 0.02 0.00005 3 4
27-Jun-12 0.001 20 0.75 0.001 0.04 0.05 1.4 0.0002 14 110 0.001 0.004 0.1 0.01 0.00005 4 4
26-Jul-12 0.001 20 0.47 0.001 0.04 0.046 1.3 0.0002 14 120 0.001 0.002 0.1 0.01 0.00005 3 4
15-Aug-12 0.001 20 0.2 0.001 0.03 0.033 0.88 0.0002 10 100 0.001 0.001 0.1 0.01 0.00005 2 2
14-Sep-12 0.001 20 6.9 0.001 0.02 0.08 1.1 0.0002 15 110 0.005 0.02 0.1 0.06 0.00005 3 2
11-Oct-12 0.001 20 1.8 0.001 0.01 0.037 1.2 0.0002 17 120 0.001 0.004 0.1 0.43 0.00005 2 2
14-Nov-12 0.001 20 0.76 0.001 <0.01 0.034 1.2 0.0002 20 120 0.001 0.005 0.1 0.05 0.00005 2 2
12-Dec-12 0.001 25 0.95 0.001 <0.01 0.036 1.6 0.0002 22 130 0.001 0.027 0.1 0.03 0.00005 2 2
16-Jan-13 0.001 25 0.15 0.001 0.56 0.029 31 0.0002 22 140 0.001 0.015 0.1 0.01 0.00005 5 23
20-Feb-13 0.001 25 0.33 0.001 0.03 0.039 2.1 0.0002 20 130 0.001 0.014 0.1 0.06 0.00005 4 2
13-Mar-13 0.001 25 0.12 0.001 0.07 0.085 2 0.0002 21 180 0.001 0.006 0.1 0.01 0.00005 5 6

Continued…….. WGM1/D1 Post-Dry Ash Placement Data February, 2012 to March 2013
Date Mn Mo Na Ni Pb pH Se SO4 TDS WL1 WL
AHD Zn
23-Feb-12 0.11 0.01 15 0.001 0.001 5.9 0.002 17.0 99 1.7 946.42 0.04
30-Mar-12 0.31 0.01 14 0.001 0.001 5.6 0.002 13.0 89 1.7 946.42 0.04
20-Apr-12 0.44 0.01 13 0.001 0.001 7.2 0.002 13.0 60 1.7 946.42 0.04
9-May-12 0.65 0.01 12 0.001 0.001 6 0.002 13.0 60 0.05
27-Jun-12 0.31 0.01 13 0.001 0.001 6 0.002 12.0 50 1.7 946.42 0.05
26-Jul-12 0.32 0.01 14 0.001 0.001 6.5 0.002 13.0 91 1.7 946.42 0.03
15-Aug-12 0.15 0.01 13 0.001 0.001 5.8 0.002 13.0 75 2.4 945.72 0.03
14-Sep-12 0.04 0.01 17 0.001 0.014 5.7 0.002 11.0 80 2.9 945.22 0.11
11-Oct-12 0.2 0.01 17 0.001 0.001 5.8 0.002 10.0 84 3.2 944.92 0.07
14-Nov-12 0.38 0.01 18 0.001 0.001 5.9 0.002 10.0 81 3.7 944.42 0.07
12-Dec-12 0.68 0.01 19 0.001 0.001 5.7 0.002 11.0 110 3.9 944.22 0.14
16-Jan-13 0.99 0.01 46 0.02 0.001 5.9 0.002 11.0 69 4.3 943.82 0.1
20-Feb-13 1.1 0.01 18 0.001 0.001 5.9 0.002 6.0 76 3.7 944.42 0.18
13-Mar-13 0.069 0.01 22 0.001 0.001 5.5 0.002 12.0 140 1.7 946.42 0.06

WGM1/D1 Post -Stage 2 Dry Ash Pl acement February, 2012 to March 2013 (mg/L )
Date Ag ALK Al As B Ba Be Ca Cd Cl Co COND Cr Cu F Fe Hg K Mg
Average <0.001 22 1.01 0.0010 0.09 0.049 4 0.0002 17 124 0.0021 0.0079 0.10 0.1 0.00005 3 5
Maximum <0.001 25 6.90 0.0010 0.56 0.085 31 0.0002 22 180 0.0060 0.0270 0.10 0.4 0.00005 5 23
Minimum <0.001 20 0.12 0.0010 0.01 0.029 1 0.0001 10 100 0.0010 0.0010 0.10 0.0 0.00005 2 2
50th Percentile <0.001 20 0.48 0.0010 0.05 0.047 2 0.0002 17 120 0.0010 0.0040 0.10 0.0 0.00005 4 4
Continued………………….WGM1/D1 Post-Stage 2 Dry Ash Place ment February, 2012 to March 2013 (mg/L)
Date Mn Mo Na Ni Pb pH Se SO4 TDS WL1 WL
AHD Zn
Average 0.41 0.010 18 0.002 0.002 6.0 0.002 12 83 2.6 945.5 0.072
Maximum 1.10 0.010 46 0.020 0.014 7.2 0.002 17 140 4.3 946.4 0.180
Minimum 0.04 0.010 12 0.001 0.001 5.5 0.002 6 50 1.7 943.8 0.030
50th Percentile 0.32 0.010 16 0.001 0.001 5.9 0.002 12 81 2.4 945.7 0.055

WGM1/D2 Pre-Dry Ash Placement Background Summary 19 88- April, 2003 (mg/L) Date Ag ALK As B Ba Be Ca Cd Cl Co COND Cr Cu F Fe Hg K Mg
Average 0.007 14 0.001 0.05 0.173 1.6 0.001 36 0.017 25534 0.013 0.007 0.17 1.1 0.0003 2 5.2
Maximum 0.020 138 0.002 0.30 3.000 13.0 0.001 104 0.021 44536 0.048 0.080 0.75 13.0 0.0009 5 16.0
Minimum 0.001 0.00 0.001 0.005 0.010 0.0 0.001 9.00 0.014 9720 0.001 0.001 0.001 0.03 0.0001 0 0.0
90th Percentile 0.016 24 0.001 0.10 0.114 5.0 0.001 48 0.020 31000 0.041 0.010 0.28 1.7 0.0007 4 9.0
Continued………………….WGM1/D2 Pre-Dry Ash Placement Back ground Data 1988-April, 2003 (mg/L)
Date Mn Mo Na Ni Pb pH Se SO4 TDS WL1 WL
AHD Zn
Average 0.301 32 0.027 0.008 4.6 0.001 45 160 5.9 914.3 0.067
Maximum 0.800 66 0.032 0.074 5.6 0.001 102 345 8.7 917.6 0.180
Minimum 0.035 11 0.023 0.001 2.9 0.001 6 10 2.7 911.5 0.012
90th Percentile 0.442 42 0.031 0.010 5.4 0.001 61 258 7.3 917.2 0.114
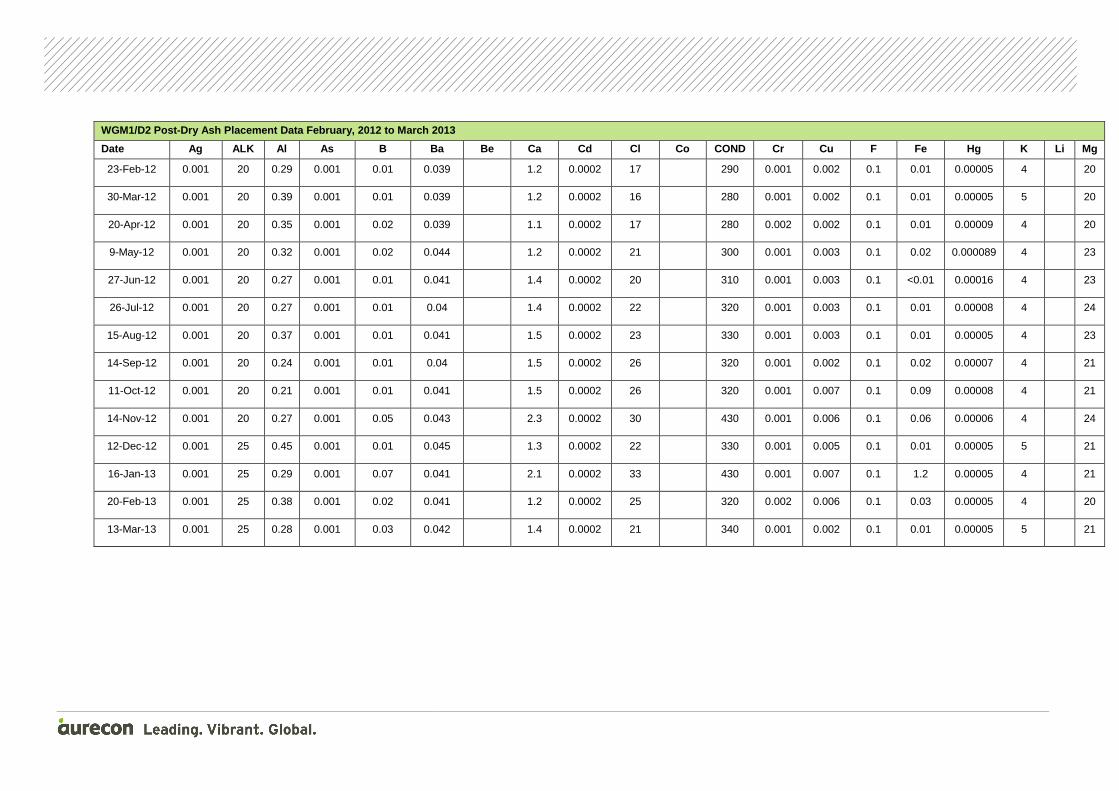
WGM1/D2 Post-Dry Ash Placement Data February, 2012 to March 2013
Date Ag ALK Al As B Ba Be Ca Cd Cl Co COND Cr Cu F Fe Hg K Li Mg
23-Feb-12 0.001 20 0.29 0.001 0.01 0.039 1.2 0.0002 17 290 0.001 0.002 0.1 0.01 0.00005 4 20
30-Mar-12 0.001 20 0.39 0.001 0.01 0.039 1.2 0.0002 16 280 0.001 0.002 0.1 0.01 0.00005 5 20
20-Apr-12 0.001 20 0.35 0.001 0.02 0.039 1.1 0.0002 17 280 0.002 0.002 0.1 0.01 0.00009 4 20
9-May-12 0.001 20 0.32 0.001 0.02 0.044 1.2 0.0002 21 300 0.001 0.003 0.1 0.02 0.000089 4 23
27-Jun-12 0.001 20 0.27 0.001 0.01 0.041 1.4 0.0002 20 310 0.001 0.003 0.1 <0.01 0.00016 4 23
26-Jul-12 0.001 20 0.27 0.001 0.01 0.04 1.4 0.0002 22 320 0.001 0.003 0.1 0.01 0.00008 4 24
15-Aug-12 0.001 20 0.37 0.001 0.01 0.041 1.5 0.0002 23 330 0.001 0.003 0.1 0.01 0.00005 4 23
14-Sep-12 0.001 20 0.24 0.001 0.01 0.04 1.5 0.0002 26 320 0.001 0.002 0.1 0.02 0.00007 4 21
11-Oct-12 0.001 20 0.21 0.001 0.01 0.041 1.5 0.0002 26 320 0.001 0.007 0.1 0.09 0.00008 4 21
14-Nov-12 0.001 20 0.27 0.001 0.05 0.043 2.3 0.0002 30 430 0.001 0.006 0.1 0.06 0.00006 4 24
12-Dec-12 0.001 25 0.45 0.001 0.01 0.045 1.3 0.0002 22 330 0.001 0.005 0.1 0.01 0.00005 5 21
16-Jan-13 0.001 25 0.29 0.001 0.07 0.041 2.1 0.0002 33 430 0.001 0.007 0.1 1.2 0.00005 4 21
20-Feb-13 0.001 25 0.38 0.001 0.02 0.041 1.2 0.0002 25 320 0.002 0.006 0.1 0.03 0.00005 4 20
13-Mar-13 0.001 25 0.28 0.001 0.03 0.042 1.4 0.0002 21 340 0.001 0.002 0.1 0.01 0.00005 5 21
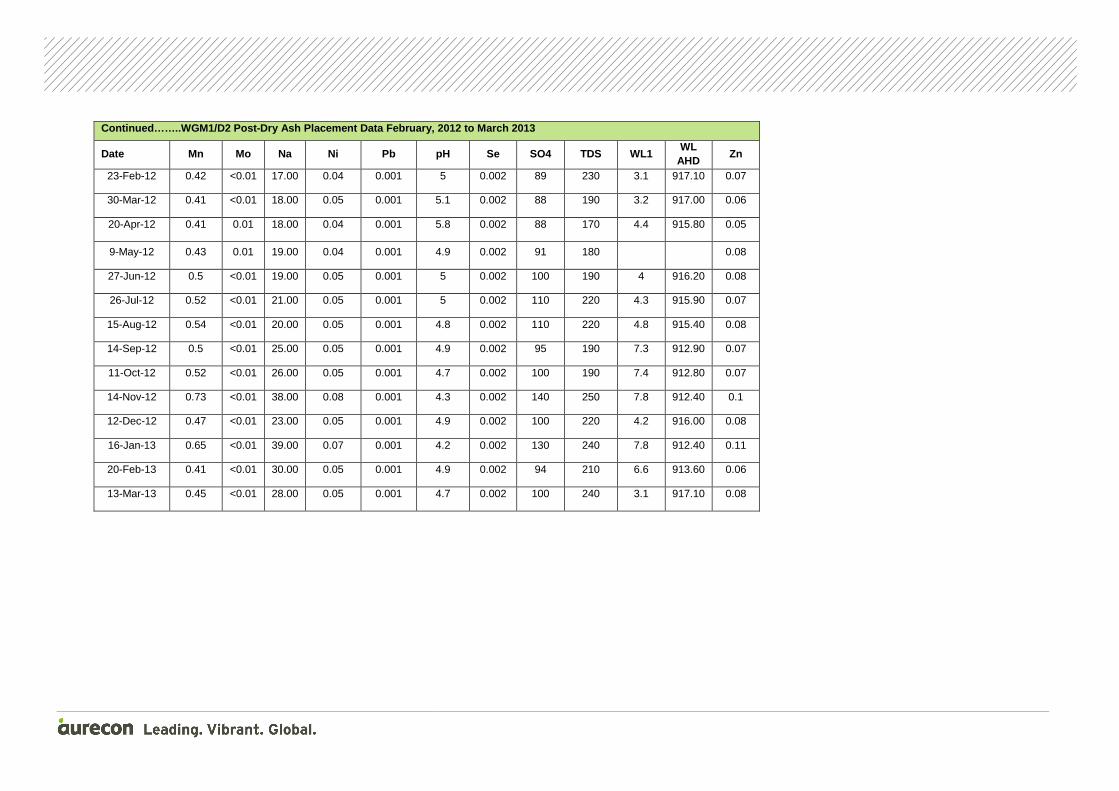
Continued…….. WGM1/D2 Post-Dry Ash Pl acement Data February, 2012 to March 2013
Date Mn Mo Na Ni Pb pH Se SO4 TDS WL1 WL
AHD Zn
23-Feb-12 0.42 <0.01 17.00 0.04 0.001 5 0.002 89 230 3.1 917.10 0.07
30-Mar-12 0.41 <0.01 18.00 0.05 0.001 5.1 0.002 88 190 3.2 917.00 0.06
20-Apr-12 0.41 0.01 18.00 0.04 0.001 5.8 0.002 88 170 4.4 915.80 0.05
9-May-12 0.43 0.01 19.00 0.04 0.001 4.9 0.002 91 180 0.08
27-Jun-12 0.5 <0.01 19.00 0.05 0.001 5 0.002 100 190 4 916.20 0.08
26-Jul-12 0.52 <0.01 21.00 0.05 0.001 5 0.002 110 220 4.3 915.90 0.07
15-Aug-12 0.54 <0.01 20.00 0.05 0.001 4.8 0.002 110 220 4.8 915.40 0.08
14-Sep-12 0.5 <0.01 25.00 0.05 0.001 4.9 0.002 95 190 7.3 912.90 0.07
11-Oct-12 0.52 <0.01 26.00 0.05 0.001 4.7 0.002 100 190 7.4 912.80 0.07
14-Nov-12 0.73 <0.01 38.00 0.08 0.001 4.3 0.002 140 250 7.8 912.40 0.1
12-Dec-12 0.47 <0.01 23.00 0.05 0.001 4.9 0.002 100 220 4.2 916.00 0.08
16-Jan-13 0.65 <0.01 39.00 0.07 0.001 4.2 0.002 130 240 7.8 912.40 0.11
20-Feb-13 0.41 <0.01 30.00 0.05 0.001 4.9 0.002 94 210 6.6 913.60 0.06
13-Mar-13 0.45 <0.01 28.00 0.05 0.001 4.7 0.002 100 240 3.1 917.10 0.08

WGM1/D2 Post -Stage 2 Dry Ash Pl acement February, 2012 to March 2013 (mg/L )
Date Ag ALK Al As B Ba Be Ca Cd Cl Co COND Cr Cu F Fe Hg K Mg
Average <0.001 21 0.31 0.0010 0.02 0.041 1 0.0002 23 329 0.0011 0.0038 0.10 0.11 0.00007 4 22
Maximum <0.001 25 0.45 0.0010 0.07 0.045 2 0.0002 33 430 0.0020 0.0070 0.10 1.20 0.00016 5 24
Minimum <0.001 20 0.21 0.0010 0.01 0.039 1 0.0002 16 280 0.0010 0.0020 0.10 0.01 0.00005 4 20
50th Percentile <0.001 20 0.29 0.0010 0.01 0.041 1 0.0002 22 320 0.0010 0.0030 0.10 0.01 0.00006 4 21
Continued………………….WGM1/D2 Post-Stage 2 Dry Ash Place ment February, 2012 to March 2013 (mg/L)
Date Mn Mo Na Ni Pb pH Se SO4 TDS WL1 WL
AHD Zn
Average 0.50 0.010 24 0.051 0.001 4.9 0.002 103 210 5.2 915.0 0.076
Maximum 0.73 0.010 39 0.080 0.001 5.8 0.002 140 250 7.8 917.1 0.110
Minimum 0.41 0.010 17 0.040 0.001 4.2 0.002 88 170 3.1 912.4 0.050
50th Percentile 0.49 0.010 22 0.050 0.001 4.9 0.002 100 215 4.4 915.8 0.075

6. Water Quality Data and Summary for KVAD/R Dry Ash P lacement Area Seepage Detection Groundwater Bores W GM1/D5 and 1/D6
a) Groundwater Bore WGM1/D5
WGM1/D5 Pre-Dry Ash Placement Background Summary 19 88-April, 2003 (mg/L) Date Ag ALK As B Ba Be Ca Cd Cl Co COND Cr Cu F Fe Hg K Mg
Average 0.001 18 0.004 1.29 0.166 0.006 12.4 0.002 20 0.061 701 0.017 0.019 0.41 6.9 0.0003 16 20.3
Maximum 0.001 90 0.013 2.00 1.700 0.006 23.0 0.005 90 0.075 1050 0.055 0.080 1.02 17.0 0.0007 23 34.0
Minimum 0.001 1 0.001 0.08 0.010 0.006 5.2 0.001 8 0.047 283 0.003 0.001 0.10 0.1 0.0002 7 8.0
90th Percentile
0.001 51 0.008 1.70 0.148 0.006 19.7 0.004 24 0.072 810 0.041 0.058 0.65 14.7 0.0006 19 26.0
Continued…………..WGM1/D5 Pre-Dry Ash Placement Backgr ound Summary 1988-April, 2003 (mg/L)
Date Mn Mo Na Ni Pb pH Se SO4 TDS WL1 WL AHD Zn
Average 1.630 61 0.125 0.010 3.8 0.001 259 470 4.8 899.6 0.338
Maximum 3.970 127 0.140 0.050 5.4 0.002 380 1913 8.8 902.0 2.630
Minimum 0.520 7 0.110 0.002 2.8 0.001 92 48 2.3 895.4 0.032 90th Percentile 2.500 70 0.137 0.021 4.5 0.002 328 550 8.3 901.7 0.505
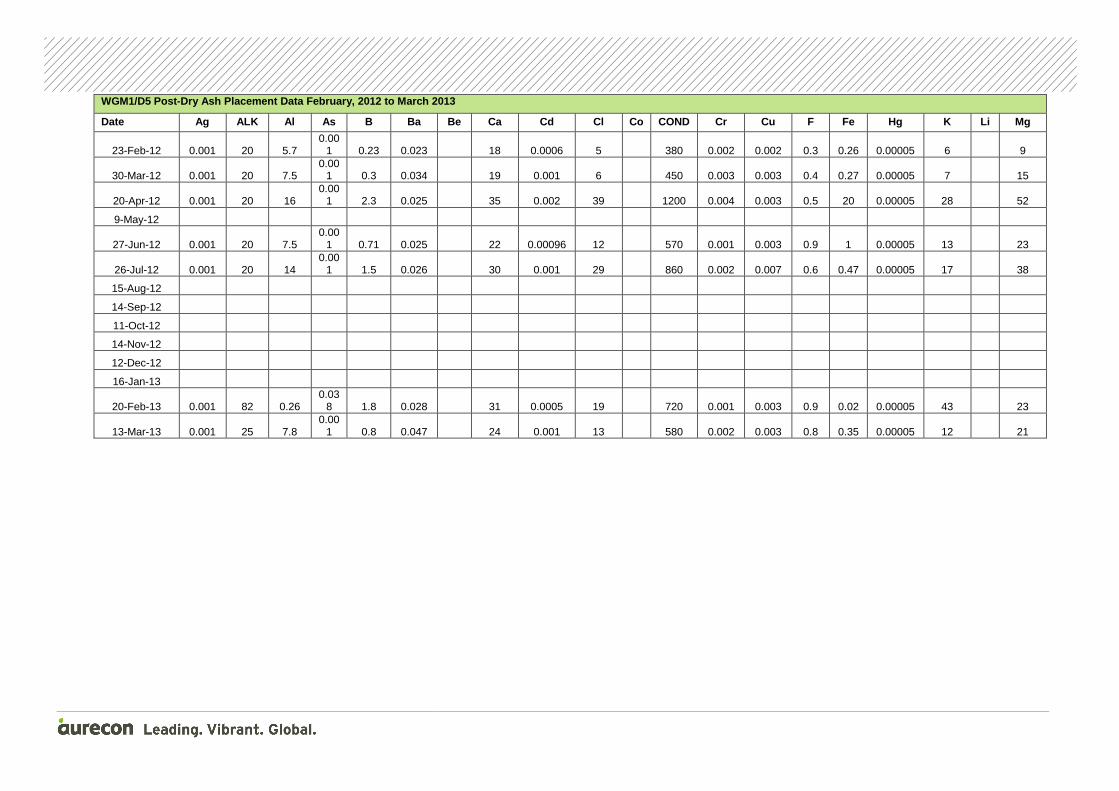
WGM1/D5 Post -Dry Ash Placement Data February, 2012 to March 2013
Date Ag ALK Al As B Ba Be Ca Cd Cl Co COND Cr Cu F Fe Hg K Li Mg
23-Feb-12 0.001 20 5.7 0.00
1 0.23 0.023 18 0.0006 5 380 0.002 0.002 0.3 0.26 0.00005 6 9
30-Mar-12 0.001 20 7.5 0.00
1 0.3 0.034 19 0.001 6 450 0.003 0.003 0.4 0.27 0.00005 7 15
20-Apr-12 0.001 20 16 0.00
1 2.3 0.025 35 0.002 39 1200 0.004 0.003 0.5 20 0.00005 28 52
9-May-12
27-Jun-12 0.001 20 7.5 0.00
1 0.71 0.025 22 0.00096 12 570 0.001 0.003 0.9 1 0.00005 13 23
26-Jul-12 0.001 20 14 0.00
1 1.5 0.026 30 0.001 29 860 0.002 0.007 0.6 0.47 0.00005 17 38
15-Aug-12
14-Sep-12
11-Oct-12
14-Nov-12
12-Dec-12
16-Jan-13
20-Feb-13 0.001 82 0.26 0.03
8 1.8 0.028 31 0.0005 19 720 0.001 0.003 0.9 0.02 0.00005 43 23
13-Mar-13 0.001 25 7.8 0.00
1 0.8 0.047 24 0.001 13 580 0.002 0.003 0.8 0.35 0.00005 12 21

Continued……… WGM1/D5 Post -Dry Ash Placement Data February, 2012 to March 2013
Date Mn Mo Na Ni Pb pH Se SO4 TDS WL1 WL
AHD Zn
23-Feb-12 2 0.01 10 0.13 0.001 3.7 0.002 140 290 2.6 901.59 0.35
30-Mar-12 2.8 0.01 20 0.23 0.002 3.7 0.002 180 300 2.6 901.59 0.56
20-Apr-12 6.8 0.01 86 0.45 0.003 3.8 0.002 560 860 6.2 897.99 0.81
9-May-12
27-Jun-12 3.5 0.01 24 0.25 0.002 3.8 0.002 240 410 2.3 901.89 0.64
26-Jul-12 5.2 0.01 47 0.29 0.003 3.7 0.002 400 630 5.6 898.59 0.62
15-Aug-12
14-Sep-12
11-Oct-12
14-Nov-12
12-Dec-12
16-Jan-13
20-Feb-13 4.3 0.19 70 0.03 <0.001 6.4 0.002 240 510 7.7 896.49 0.06
13-Mar-13 3.2 0.01 25 0.22 0.002 3.7 0.002 220 430 3.1 901.09 0.56
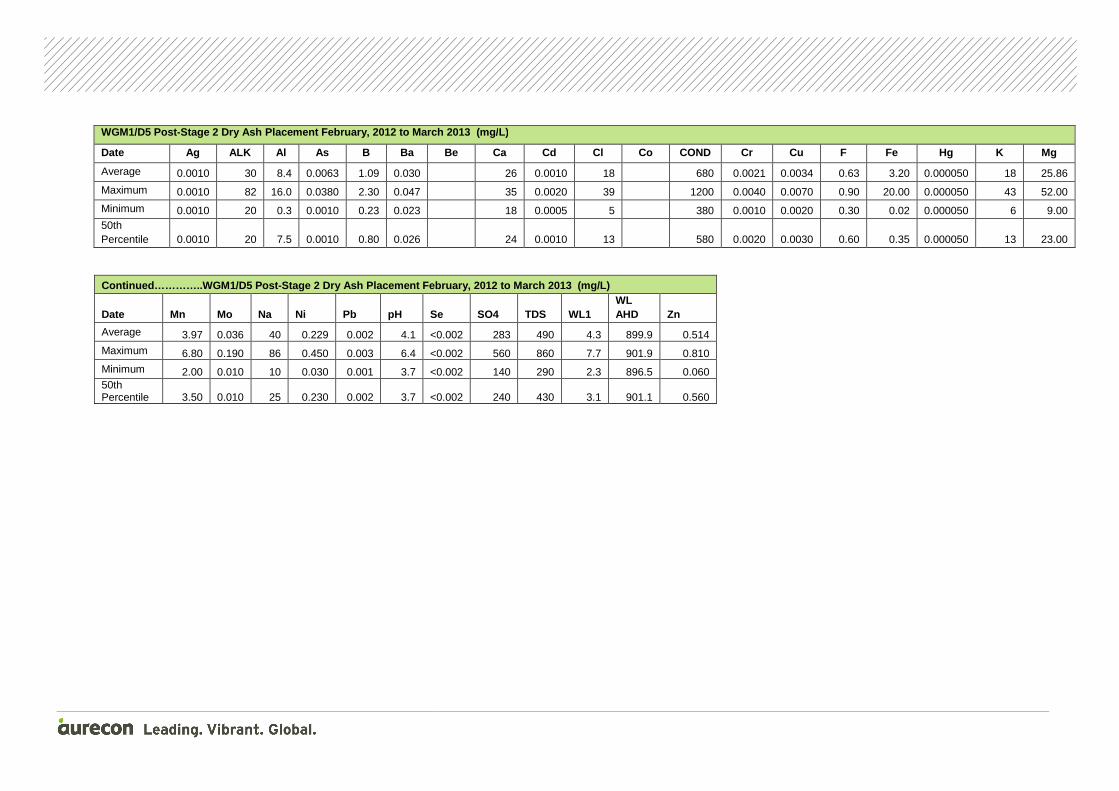
WGM1/D5 Post -Stage 2 Dry Ash Placement February, 2012 to March 2013 (mg/L)
Date Ag ALK Al As B Ba Be Ca Cd Cl Co COND Cr Cu F Fe Hg K Mg
Average 0.0010 30 8.4 0.0063 1.09 0.030 26 0.0010 18 680 0.0021 0.0034 0.63 3.20 0.000050 18 25.86
Maximum 0.0010 82 16.0 0.0380 2.30 0.047 35 0.0020 39 1200 0.0040 0.0070 0.90 20.00 0.000050 43 52.00
Minimum 0.0010 20 0.3 0.0010 0.23 0.023 18 0.0005 5 380 0.0010 0.0020 0.30 0.02 0.000050 6 9.00 50th Percentile 0.0010 20 7.5 0.0010 0.80 0.026 24 0.0010 13 580 0.0020 0.0030 0.60 0.35 0.000050 13 23.00
Continued…………..WGM1/D5 Post-Stage 2 Dry Ash Placeme nt February, 2012 to March 2013 (mg/L)
Date Mn Mo Na Ni Pb pH Se SO4 TDS WL1 WL AHD Zn
Average 3.97 0.036 40 0.229 0.002 4.1 <0.002 283 490 4.3 899.9 0.514
Maximum 6.80 0.190 86 0.450 0.003 6.4 <0.002 560 860 7.7 901.9 0.810
Minimum 2.00 0.010 10 0.030 0.001 3.7 <0.002 140 290 2.3 896.5 0.060 50th Percentile 3.50 0.010 25 0.230 0.002 3.7 <0.002 240 430 3.1 901.1 0.560

b) Groundwater Bore WGM1/D6
WGM1/D6 Pre-Dry Ash Placement Background Summary 1988 -April, 2003 (mg/L)
Ag ALK As B Ba Be Ca Cd Cl COND Cr Cu F Fe Hg K Mg
Average 0.001 27 0.003 0.78 0.184 22.3 0.002 53 94830 0.011 0.016 0.14 93.3 0.0004 7 25.4
Maximum 0.001 390 0.015 1.10 1.900 33.0 0.009 160 143000 0.032 0.260 0.65 174.2 0.0009 48 34.0
Minimum 0.001 0 0.001 0.27 0.021 14.0 0.001 23 60100 0.001 0.001 0.001 0.1 0.0001 4 17.0
90th Percentile 0.001 39 0.005 0.98 0.210 27.0 0.003 65 110000 0.020 0.021 0.28 123.0 0.0007 9 30.0
Continued……………..WGM1/D6 Pre-Dry Ash Placement Backg round Summary 1988-April, 2003 (mg/l)
Mn Mo Na Ni Pb pH Se SO4 TDS WL1 WL
AHD Zn
Average 4.005 45 0.117 0.007 4.5 0.016 340 603 10.8 896.2 0.107
Maximum 5.400 90 0.210 0.023 5.8 0.100 536 902 11.4 896.9 0.566
Minimum 1.390 26 0.023 0.001 1.4 0.001 190 320 10.1 895.6 0.004
90th Percentile 4.810 55 0.191 0.013 5.5 0.043 381 736 11.2 896.6 0.232
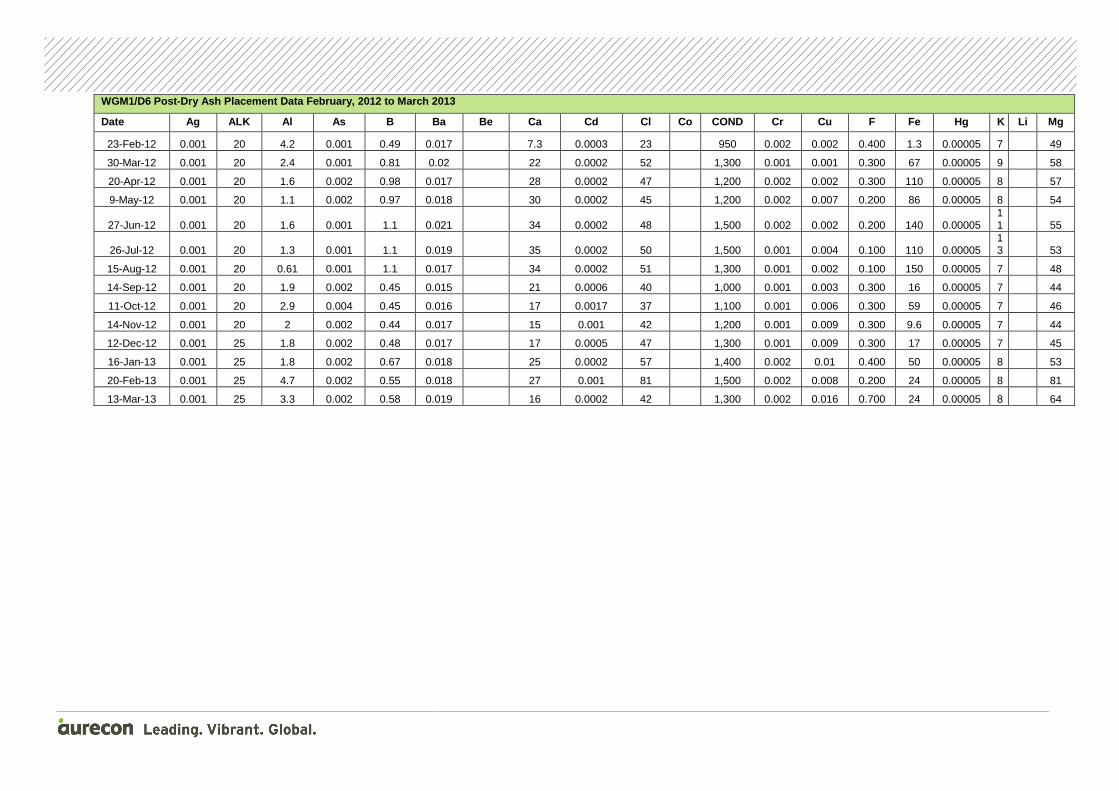
WGM1/D6 Post -Dry Ash Plac ement Data February, 2012 to March 2013
Date Ag ALK Al As B Ba Be Ca Cd Cl Co COND Cr Cu F Fe Hg K Li Mg
23-Feb-12 0.001 20 4.2 0.001 0.49 0.017 7.3 0.0003 23 950 0.002 0.002 0.400 1.3 0.00005 7 49
30-Mar-12 0.001 20 2.4 0.001 0.81 0.02 22 0.0002 52 1,300 0.001 0.001 0.300 67 0.00005 9 58
20-Apr-12 0.001 20 1.6 0.002 0.98 0.017 28 0.0002 47 1,200 0.002 0.002 0.300 110 0.00005 8 57
9-May-12 0.001 20 1.1 0.002 0.97 0.018 30 0.0002 45 1,200 0.002 0.007 0.200 86 0.00005 8 54
27-Jun-12 0.001 20 1.6 0.001 1.1 0.021 34 0.0002 48 1,500 0.002 0.002 0.200 140 0.00005 11 55
26-Jul-12 0.001 20 1.3 0.001 1.1 0.019 35 0.0002 50 1,500 0.001 0.004 0.100 110 0.00005 13 53
15-Aug-12 0.001 20 0.61 0.001 1.1 0.017 34 0.0002 51 1,300 0.001 0.002 0.100 150 0.00005 7 48
14-Sep-12 0.001 20 1.9 0.002 0.45 0.015 21 0.0006 40 1,000 0.001 0.003 0.300 16 0.00005 7 44
11-Oct-12 0.001 20 2.9 0.004 0.45 0.016 17 0.0017 37 1,100 0.001 0.006 0.300 59 0.00005 7 46
14-Nov-12 0.001 20 2 0.002 0.44 0.017 15 0.001 42 1,200 0.001 0.009 0.300 9.6 0.00005 7 44
12-Dec-12 0.001 25 1.8 0.002 0.48 0.017 17 0.0005 47 1,300 0.001 0.009 0.300 17 0.00005 7 45
16-Jan-13 0.001 25 1.8 0.002 0.67 0.018 25 0.0002 57 1,400 0.002 0.01 0.400 50 0.00005 8 53
20-Feb-13 0.001 25 4.7 0.002 0.55 0.018 27 0.001 81 1,500 0.002 0.008 0.200 24 0.00005 8 81
13-Mar-13 0.001 25 3.3 0.002 0.58 0.019 16 0.0002 42 1,300 0.002 0.016 0.700 24 0.00005 8 64

Continued………………..WGM1/D6 Post-Dry Ash Placement Dat a February, 2012 to March 2013
Date Mn Mo Na Ni Pb pH Se SO4 TDS WL1 WL AHD Zn
23-Feb-12 1.1 0.01 77 0.35 0.002 3.40 0.002 380 560 10.3 896.65 0.74
30-Mar-12 4 0.01 98 0.34 0.001 3.50 0.002 540 900 10.1 896.85 0.59
20-Apr-12 5.2 0.01 91 0.25 0.001 4.20 0.002 560 960 10.4 896.55 0.39
9-May-12 5.9 0.01 78 0.19 0.002 4.70 0.002 590 890 906.95 0.31
27-Jun-12 6.9 0.01 110 0.23 0.001 4.80 0.002 650 1100 15.0 891.95 0.35
26-Jul-12 7 0.01 140 0.16 0.001 3.10 0.002 660 1100 10.0 896.95 0.2
15-Aug-12 7.4 0.01 75 0.12 0.001 4.10 0.002 670 1200 10.8 896.15 0.12
14-Sep-12 4 0.01 74 0.3 0.002 3.90 0.002 460 660 11.0 895.95 1.1
11-Oct-12 3.2 0.01 75 0.43 0.005 3.10 0.002 420 710 10.8 896.15 1.6
14-Nov-12 2.9 0.01 71 0.4 0.003 3.00 0.002 400 590 10.7 896.25 1.4
12-Dec-12 3.6 0.01 77 0.39 0.002 3.10 0.002 430 650 10.8 896.15 1.3
16-Jan-13 5.1 0.01 82 0.37 <0.001 3.00 0.002 520 800 11.0 895.95 1.1
20-Feb-13 4.9 0.01 140 0.64 0.003 3.20 0.002 640 1100 10.7 896.25 2.1
13-Mar-13 3 0.01 110 0.53 0.002 3.30 0.002 520 880 10.4 896.55 1.3
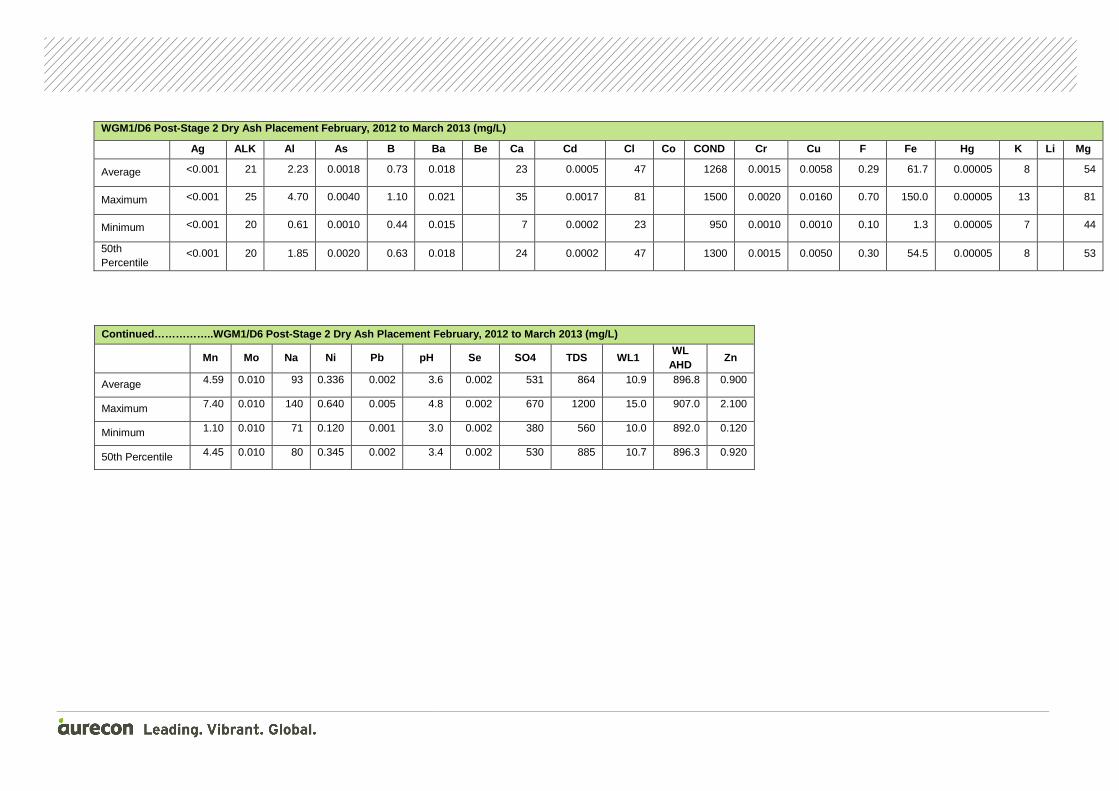
WGM1/D6 Post -Stage 2 Dry Ash Pl acement February, 2012 to March 2013 (mg/L )
Ag ALK Al As B Ba Be Ca Cd Cl Co COND Cr Cu F Fe H g K Li Mg
Average <0.001 21 2.23 0.0018 0.73 0.018 23 0.0005 47 1268 0.0015 0.0058 0.29 61.7 0.00005 8 54
Maximum <0.001 25 4.70 0.0040 1.10 0.021 35 0.0017 81 1500 0.0020 0.0160 0.70 150.0 0.00005 13 81
Minimum <0.001 20 0.61 0.0010 0.44 0.015 7 0.0002 23 950 0.0010 0.0010 0.10 1.3 0.00005 7 44
50th Percentile
<0.001 20 1.85 0.0020 0.63 0.018 24 0.0002 47 1300 0.0015 0.0050 0.30 54.5 0.00005 8 53
Continued……………..WGM1/D6 Post-Stage 2 Dry Ash Placem ent February, 2012 to March 2013 (mg/L)
Mn Mo Na Ni Pb pH Se SO4 TDS WL1 WL
AHD Zn
Average 4.59 0.010 93 0.336 0.002 3.6 0.002 531 864 10.9 896.8 0.900
Maximum 7.40 0.010 140 0.640 0.005 4.8 0.002 670 1200 15.0 907.0 2.100
Minimum 1.10 0.010 71 0.120 0.001 3.0 0.002 380 560 10.0 892.0 0.120
50th Percentile 4.45 0.010 80 0.345 0.002 3.4 0.002 530 885 10.7 896.3 0.920

7. Water Quality Data and Summary for SSCAD
SSCAD Pre-Dry Ash Placement Background Summary 1996 -April, 2003 (mg/L)
Date Ag ALK As B Ba Be Ca Cd Cl COND Cr CrIV Cu F Fe Hg K Mg
Average 0.001 18 0.016 4.7 0.128 0.009 56 0.012 18 121893 0.005 0.007 9.3 0.17 0.0002 53 11
Maximum 0.001 53 0.039 8.6 0.152 0.009 140 0.020 74 257800 0.018 0.035 14.0 0.45 0.0002 110 18
Minimum 0.001 5 0.003 2.7 0.110 0.008 33 0.006 8 86000 0.001 0.001 7.2 0.03 0.0001 35 7
90th Percentile 0.001 28.4 0.034 8.0 0.142 0.009 107 0.020 28 200360 0.013 0.016 11.4 0.29 0.0002 88 15
Continued………………..SSCAD Pre-Dry Ash Placement Backgr ound Summary 1996-April, 2003 (mg/L)
Date Mn Mo Na Ni Pb pH Se SO4 TDS Zn
Average 1.2 0.152 137 0.129 0.002 5.4 0.151 553 858 0.426
Maximum 1.7 0.190 380 0.150 0.005 6.5 0.379 1390 2170 0.650
Minimum 0.8 0.113 46 0.108 0.001 4.7 0.029 351 215 0.100
90th Percentile 1.7 0.182 287 0.146 0.005 6.0 0.298 1029 1604 0.580

SSCAD Post -Dry Ash Placement April, 2010 to January 2012 (data from August, 2007 to March, 2010 in Aurecon, 2010)
Date Ag ALK Al As B Ba Be Ca Cd Cl Co COND Cr CrIV Cu F Fe Hg K Li Mg
16-Apr-10 <0.001 20 0.001 2.1 0.07 0.001 83 0.002 40 2247 0.001 0.01 2.5 0.03 0.00005 49 19 26-May-10 <0.001 20 0.001 2.3 0.071 88 0.0022 39 2130 0.001 0.005 2.3 0.05 0.00005 50 20 9-Jun-10 <0.001 20 0.001 2.2 0.069 85 0.0022 37 1978 0.001 0.004 2.2 0.01 0.00005 50 19 1-Jul-10 <0.001 20 1.5 0.001 2.3 0.071 81 0.0023 35 2055 0.001 0.008 2.2 0.14 0.00005 46 19 25-Aug-10 <0.001 20 4 0.001 2.1 0.071 78 0.0026 32 2109 0.001 0.01 2.4 0.57 0.00005 46 19 23-Sep-10 <0.001 20 3.6 0.001 1.9 0.067 81 0.0025 31 1996 0.001 0.012 2.7 1.4 0.00005 45 19 27-Oct-10 <0.001 20 0.002 2 0.075 78 0.0028 30 2026 0.001 0.01 2.3 0.39 0.00005 44 17 19-Nov-10 <0.001 20 0.002 2 0.083 79 0.0029 33 2023 0.001 0.011 2.5 0.15 0.00005 47 19 9-Dec-10 <0.001 20 1.5 0.0018 2.1 0.044 84 0.0014 32 2051 0.001 0.0057 1.7 0.07 0.00005 48 17 12-Jan-11 <0.001 20 0.32 0.002 1.9 0.029 90 0.0002 33 2007 0.001 0.001 1.3 1.3 0.00007 48 17 24-Feb-11 <0.001 20 0.14 0.001 1.7 0.027 76 0.0008 28 1745 0.001 <0.001 1.4 0.09 0.00005 41 14 24-Mar-11 <0.001 20 0.2 0.003 1.8 0.03 83 0.0005 27 1800 0.001 0.003 1.4 0.04 0.00005 42 15 8-Apr-11 <0.001 20 0.73 0.001 1.9 0.037 81 0.001 28 1700 0.001 0.006 1.6 0.01 0.00005 44 14 12-May-11 <0.001 20 2.8 0.001 2.1 0.052 82 0.003 26 1800 0.001 0.015 2.2 0.02 0.00005 45 16 10-Jun-11 <0.001 20 3 0.001 2.2 0.041 84 0.003 28 1900 0.001 0.014 2.4 0.01 0.00005 42 16 26-Jul-11 <0.001 20 2.7 0.001 2.1 0.031 91 0.002 26 1800 0.001 0.01 2.3 0.01 0.00005 45 15 30-Aug-11 <0.001 20 1.8 0.001 1.9 0.023 87 0.002 28 1800 0.001 0.007 1.9 0.01 0.00005 44 14 21-Sep-11 <0.001 20 1.6 0.001 2.1 0.024 96 0.002 29 1800 0.001 0.008 1.9 0.01 0.00005 48 15 12-Oct-11 <0.001 20 1.3 0.001 1.9 0.037 94 0.001 28 1900 0.001 0.004 1.7 0.01 0.00005 46 15 10-Nov-11 <0.001 20 7.2 0.002 2 0.098 75 0.0041 26 1800 0.010 0.046 2.3 0.09 0.00005 42 16 8-Dec-11 <0.001 20 4.5 0.001 1.9 0.083 70 0.0037 25 1700 0.001 0.031 4 0.04 0.00005 39 15 18-Jan-12 <0.001 2.6 20 0.001 1.8 0.079 70 0.003 27 1700 0.001 0.021 2.1 0.09 0.00005 40 15

Continued…….. SSCAD Post -Dry Ash Placement April, 2010 to January, 2012 (data from August, 2007 to March, 2010 in Aurecon, 2010)
Date Mn Mo Na Ni Pb pH Se SO4 TDS Zn
16-Apr-10 0.89 0.03 370 0.03 0.001 4.5 0.003 1000 1600 0.08
26-May-10 0.92 0.01 380 0.03 0.001 5.5 0.002 1100 1600 0.08
9-Jun-10 0.93 0.02 370 0.03 0.001 5.9 0.003 1100 1600 0.09
1-Jul-10 0.94 0.02 350 0.04 0.001 4.9 0.003 1000 1600 0.1
25-Aug-10 1.1 0.01 330 0.04 0.001 4.6 0.003 950 1500 0.15
23-Sep-10 1.1 0.01 340 0.05 0.001 5.3 0.003 940 1500 0.14
27-Oct-10 1.1 0.01 320 0.05 0.001 5.2 0.004 930 1500 0.14
19-Nov-10 1.2 0.02 340 0.05 0.001 5 0.004 950 1400 0.15
9-Dec-10 1.9 0.01 350 0.05 0.001 4.2 0.004 940 1500 0.15
12-Jan-11 2.9 0.01 350 0.03 0.001 3.9 0.015 990 1400 0.04
24-Feb-11 1.7 0.25 280 0.02 0.001 5 0.006 850 1300 0.04
24-Mar-11 1.9 0.16 290 0.02 0.001 4.2 0.006 850 1200 0.04
8-Apr-11 1.8 0.04 280 0.02 0.001 5.1 0.005 840 1400 0.05
12-May-11 1.4 0.01 290 0.05 0.001 4.6 0.005 830 1400 0.15
10-Jun-11 1.4 0.01 290 0.05 0.001 4.5 0.005 870 1300 0.18
26-Jul-11 1.4 0.01 300 0.05 0.001 4.8 0.004 850 1400 0.22
30-Aug-11 1.3 0.01 290 0.04 0.001 4.9 0.004 850 1400 0.19
21-Sep-11 1.3 0.01 310 0.04 0.001 4.9 0.004 890 1300 0.19
12-Oct-11 1.2 0.03 290 0.03 0.001 5.2 0.006 870 1400 0.18
10-Nov-11 1.1 0.01 270 0.07 0.003 4.4 0.018 840 1300 0.27
8-Dec-11 1 0.01 260 0.06 0.002 4.8 0.014 780 1300 0.2
18-Jan-12 0.96 0.02 280 0.05 0.001 5 0.014 800 1300 0.16
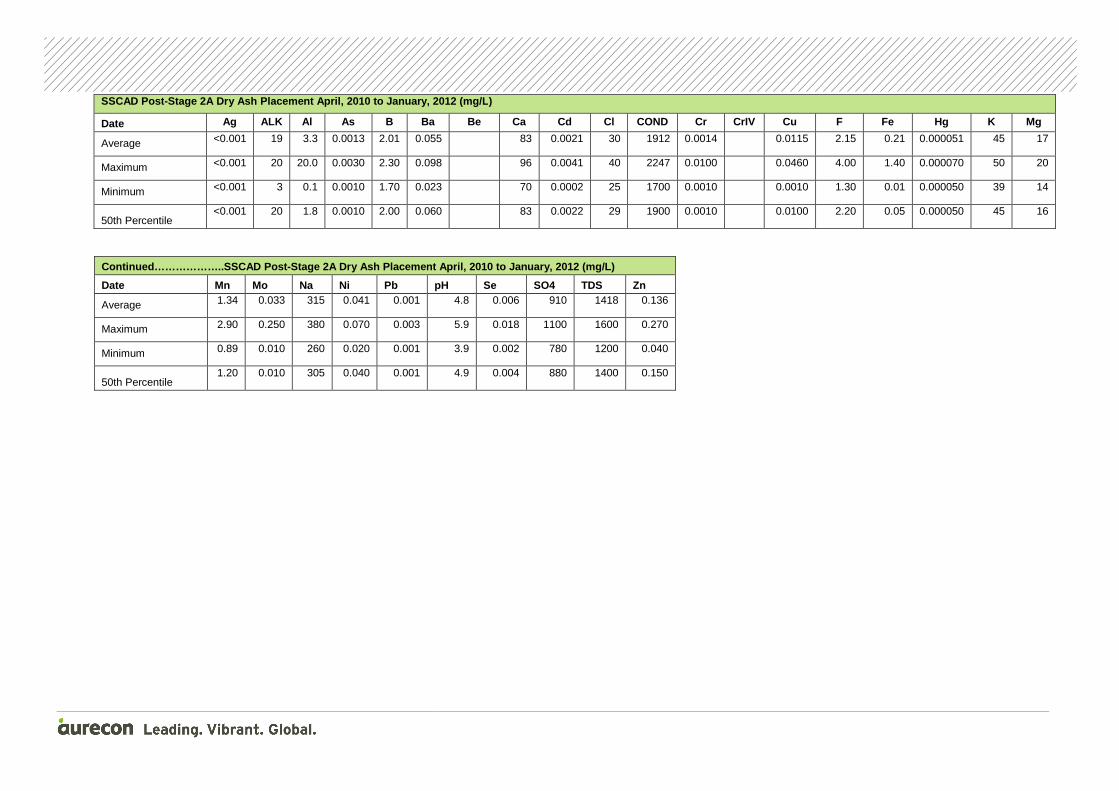
SSCAD Post -Stage 2A Dry Ash Pl acement April, 2010 to January, 2012 (mg/L )
Date Ag ALK Al As B Ba Be Ca Cd Cl COND Cr CrIV Cu F Fe Hg K Mg
Average <0.001 19 3.3 0.0013 2.01 0.055 83 0.0021 30 1912 0.0014 0.0115 2.15 0.21 0.000051 45 17
Maximum <0.001 20 20.0 0.0030 2.30 0.098 96 0.0041 40 2247 0.0100 0.0460 4.00 1.40 0.000070 50 20
Minimum <0.001 3 0.1 0.0010 1.70 0.023 70 0.0002 25 1700 0.0010 0.0010 1.30 0.01 0.000050 39 14
50th Percentile <0.001 20 1.8 0.0010 2.00 0.060 83 0.0022 29 1900 0.0010 0.0100 2.20 0.05 0.000050 45 16
Continued………………..SSCAD Post-Stage 2A Dry Ash Placem ent April, 2010 to January, 2012 (mg/L)
Date Mn Mo Na Ni Pb pH Se SO4 TDS Zn
Average 1.34 0.033 315 0.041 0.001 4.8 0.006 910 1418 0.136
Maximum 2.90 0.250 380 0.070 0.003 5.9 0.018 1100 1600 0.270
Minimum 0.89 0.010 260 0.020 0.001 3.9 0.002 780 1200 0.040
50th Percentile 1.20 0.010 305 0.040 0.001 4.9 0.004 880 1400 0.150

SSCAD Post -Dry Ash Placement February, 2012 to March 2013
Date Ag ALK Al As B Ba Be Ca Cd Cl Co COND Cr CrIV Cu F Fe Hg K Li Mg
22-Feb-12 0.001 20 2 0.002 1.8 0.075 66 0.0028 23 1600 0.001 0.013 2 0.010 0.00005 38 14
14-Mar-12 0.001 20 1.3 0.001 1.4 0.061 52 0.002 20 1300 0.001 0.008 1.5 0.02 0.00005 32 11
19-Apr-12 0.001 20 1.8 0.002 1.4 0.061 50 0.002 20 1200 0.001 0.009 0.4 0.31 0.00006 28 11
9-May-12 0.001 74 1.5 0.003 1.3 0.064 45 0.0019 18 1200 0.002 0.01 1.7 0.03 0.00005 24 10
27-Jun-12 0.001 20 2.2 0.003 1.4 0.076 46 0.003 19 1200 0.005 0.017 1.7 0.06 0.00005 28 10
26-Jul-12 0.001 20 5.4 0.004 1.5 0.079 51 0.003 19 1300 0.008 0.023 2.4 0.1 0.00005 30 11
15-Aug-12 0.001 20 7.6 0.002 1.7 0.078 50 0.004 20 1400 0.007 0.027 2.2 0.11 0.00005 33 12
13-Sep-12 0.001 20 11 0.002 2.1 0.08 61 0.006 20 1500 0.006 0.028 3.3 0.06 0.00005 40 15
11-Oct-12 0.001 20 8.2 0.003 2.1 0.075 60 0.006 20 1500 0.001 0.026 2.8 0.11 0.00005 37 14
14-Nov-12 0.001 20 6.5 0.004 2.3 0.061 64 0.006 20 1600 0.003 0.022 2.9 0.06 0.00005 41 15
12-Dec-12 0.001 25 5.7 0.002 2.1 0.073 60 0.006 20 1700 0.001 0.022 2.8 0.08 0.00005 43 14
16-Jan-13 0.001 25 3.6 0.002 2.4 0.076 65 0.006 22 1700 0.001 0.018 2.4 0.03 0.00005 45 16
20-Feb-13 0.001 25 2.4 0.001 2.1 0.07 70 0.005 21 1600 0.001 0.022 2.3 0.010 0.00005 40 17
13-Mar-13 0.001 25 4.2 <0.001 1.9 0.067 60 0.005 20 1600 0.001 0.039 2.6 0.07 0.00005 41 15

Continued…….. SSCAD Post -Dry Ash Plac ement February, 2012 to March 2013
Date Mn Mo Na Ni Pb pH Se SO4 TDS Zn
22-Feb-12 0.91 0.02 280 0.05 <0.001 5 0.012 750 1100 0.16
14-Mar-12 0.74 0.02 220 0.04 <0.001 5.1 0.008 570 890 0.12
19-Apr-12 0.79 0.01 190 0.04 0.001 4.6 0.008 560 940 0.12
9-May-12 0.74 0.01 190 0.03 0.001 7.4 0.006 480 810 0.14
27-Jun-12 0.8 0.02 180 0.04 0.001 4.5 0.009 560 940 0.14
26-Jul-12 0.88 0.01 190 0.05 0.003 4.2 0.01 600 940 0.18
15-Aug-12 1.1 0.01 190 0.07 0.002 4.4 0.01 670 1100 0.26
13-Sep-12 1.4 0.01 220 0.1 0.002 4.5 0.009 720 1100 0.34
11-Oct-12 1.4 0.01 220 0.09 0.002 4.6 0.01 710 1100 0.31
14-Nov-12 1.5 0.02 240 0.1 0.002 4.7 0.012 750 1200 0.33
12-Dec-12 1.5 0.01 240 0.1 0.003 4.6 0.008 800 1200 0.45
16-Jan-13 1.6 0.01 240 0.1 0.002 4.8 0.008 780 1200 0.42
20-Feb-13 1.5 0.01 280 0.09 <0.001 4.8 0.006 760 1200 0.35
13-Mar-13 1.5 0.01 230 0.09 0.015 4.6 0.005 730 1200 0.36
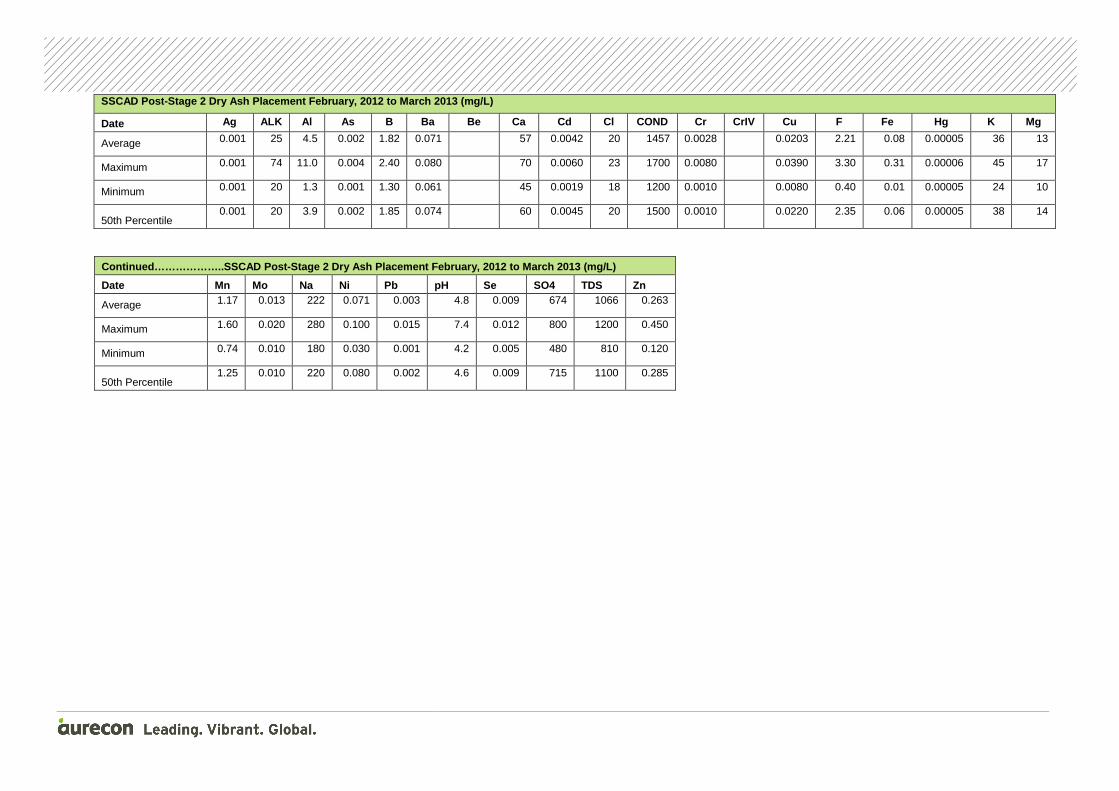
SSCAD Post -Stage 2 Dry Ash Pl acement February, 2012 to March 2013 (mg/L )
Date Ag ALK Al As B Ba Be Ca Cd Cl COND Cr CrIV Cu F Fe Hg K Mg
Average 0.001 25 4.5 0.002 1.82 0.071 57 0.0042 20 1457 0.0028 0.0203 2.21 0.08 0.00005 36 13
Maximum 0.001 74 11.0 0.004 2.40 0.080 70 0.0060 23 1700 0.0080 0.0390 3.30 0.31 0.00006 45 17
Minimum 0.001 20 1.3 0.001 1.30 0.061 45 0.0019 18 1200 0.0010 0.0080 0.40 0.01 0.00005 24 10
50th Percentile 0.001 20 3.9 0.002 1.85 0.074 60 0.0045 20 1500 0.0010 0.0220 2.35 0.06 0.00005 38 14
Continued………………..SSCAD Post-Stage 2 Dry Ash Placeme nt February, 2012 to March 2013 (mg/L)
Date Mn Mo Na Ni Pb pH Se SO4 TDS Zn
Average 1.17 0.013 222 0.071 0.003 4.8 0.009 674 1066 0.263
Maximum 1.60 0.020 280 0.100 0.015 7.4 0.012 800 1200 0.450
Minimum 0.74 0.010 180 0.030 0.001 4.2 0.005 480 810 0.120
50th Percentile 1.25 0.010 220 0.080 0.002 4.6 0.009 715 1100 0.285
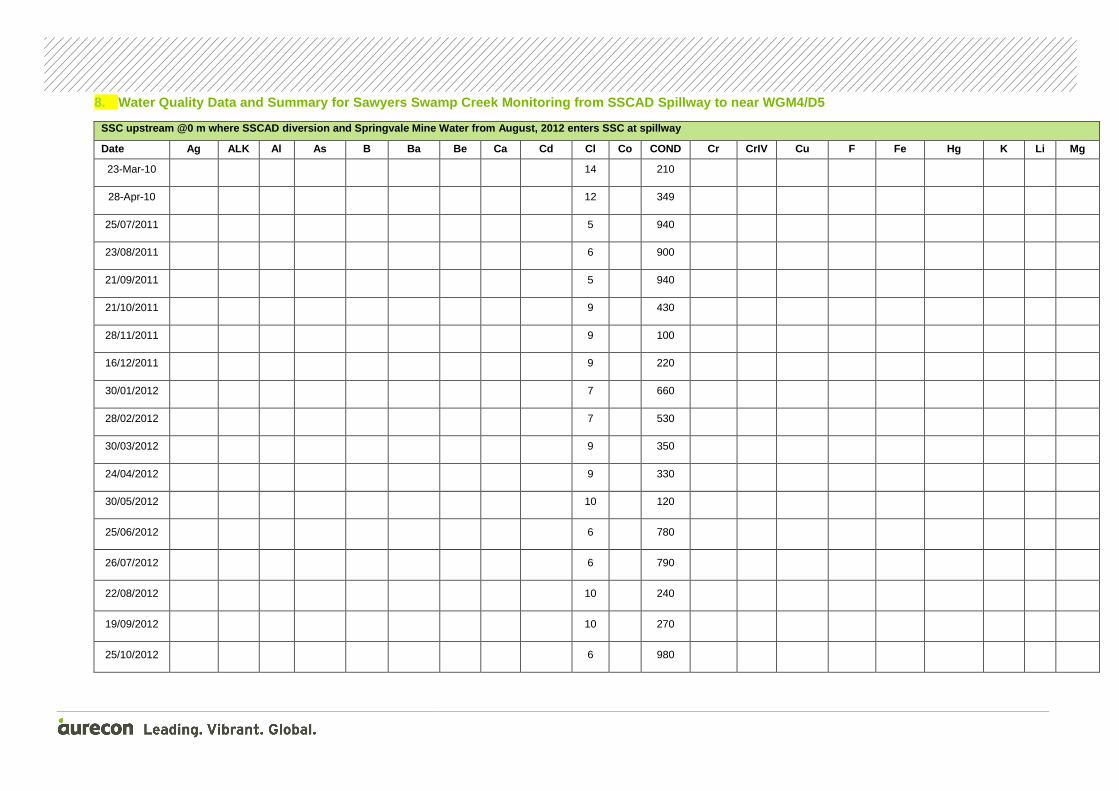
8. Water Quality Data and Summary for Sawyers Swamp Creek Monitoring from SSCAD Spillway to near WGM4/D5
SSC upstream @0 m where SSCAD diversion and Springv ale Mine Water from August, 2012 enters SSC at spil lway
Date Ag ALK Al As B Ba Be Ca Cd Cl Co COND Cr CrIV Cu F Fe Hg K Li Mg
23-Mar-10
14
210
28-Apr-10
12
349
25/07/2011
5
940
23/08/2011
6
900
21/09/2011
5
940
21/10/2011
9
430
28/11/2011
9
100
16/12/2011
9
220
30/01/2012
7
660
28/02/2012
7
530
30/03/2012
9
350
24/04/2012
9
330
30/05/2012
10
120
25/06/2012
6
780
26/07/2012
6
790
22/08/2012
10
240
19/09/2012
10
270
25/10/2012
6
980
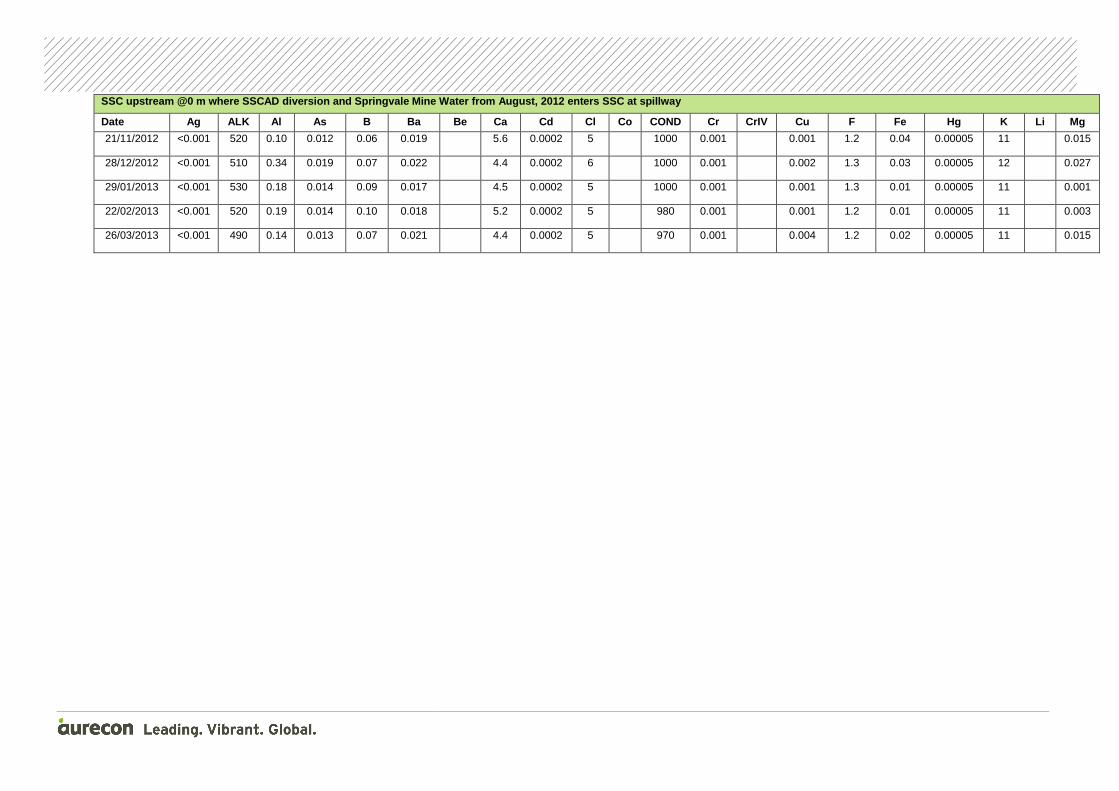
SSC upstream @0 m where SSCAD diversion and Springv ale Mine Water from August, 2012 enters SSC at spil lway
Date Ag ALK Al As B Ba Be Ca Cd Cl Co COND Cr CrIV Cu F Fe Hg K Li Mg
21/11/2012 <0.001 520 0.10 0.012 0.06 0.019 5.6 0.0002 5
1000 0.001
0.001 1.2 0.04 0.00005 11
0.015
28/12/2012 <0.001 510 0.34 0.019 0.07 0.022 4.4 0.0002 6
1000 0.001
0.002 1.3 0.03 0.00005 12
0.027
29/01/2013 <0.001 530 0.18 0.014 0.09 0.017 4.5 0.0002 5
1000 0.001
0.001 1.3 0.01 0.00005 11
0.001
22/02/2013 <0.001 520 0.19 0.014 0.10 0.018 5.2 0.0002 5
980 0.001
0.001 1.2 0.01 0.00005 11
0.003
26/03/2013 <0.001 490 0.14 0.013 0.07 0.021 4.4 0.0002 5
970 0.001
0.004 1.2 0.02 0.00005 11
0.015
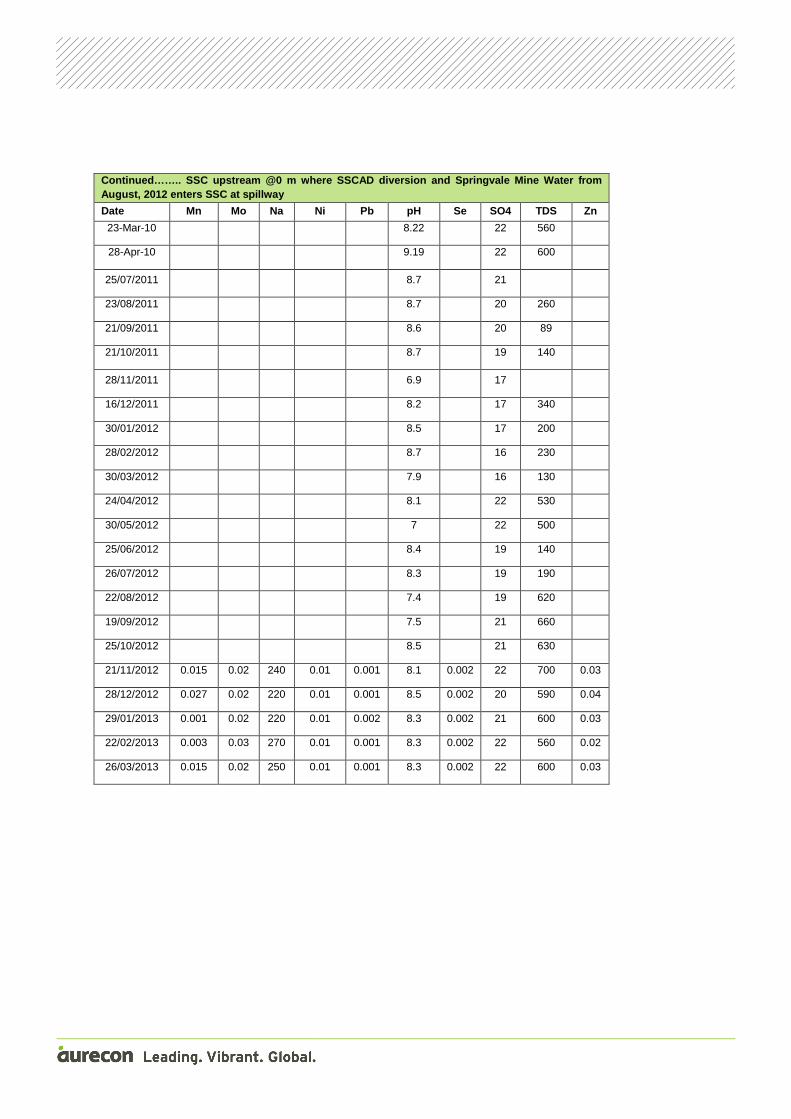
Continued…….. SSC upstream @0 m w here SSCAD diversion and Springvale Mine Water from August, 2012 enters SSC at spillway
Date Mn Mo Na Ni Pb pH Se SO4 TDS Zn
23-Mar-10
8.22
22 560
28-Apr-10
9.19
22 600
25/07/2011
8.7
21
23/08/2011
8.7
20 260
21/09/2011
8.6
20 89
21/10/2011
8.7
19 140
28/11/2011
6.9
17
16/12/2011
8.2
17 340
30/01/2012
8.5
17 200
28/02/2012
8.7
16 230
30/03/2012
7.9
16 130
24/04/2012
8.1
22 530
30/05/2012
7
22 500
25/06/2012
8.4
19 140
26/07/2012
8.3
19 190
22/08/2012
7.4
19 620
19/09/2012
7.5
21 660
25/10/2012
8.5
21 630
21/11/2012 0.015 0.02 240 0.01 0.001 8.1 0.002 22 700 0.03
28/12/2012 0.027 0.02 220 0.01 0.001 8.5 0.002 20 590 0.04
29/01/2013 0.001 0.02 220 0.01 0.002 8.3 0.002 21 600 0.03
22/02/2013 0.003 0.03 270 0.01 0.001 8.3 0.002 22 560 0.02
26/03/2013 0.015 0.02 250 0.01 0.001 8.3 0.002 22 600 0.03
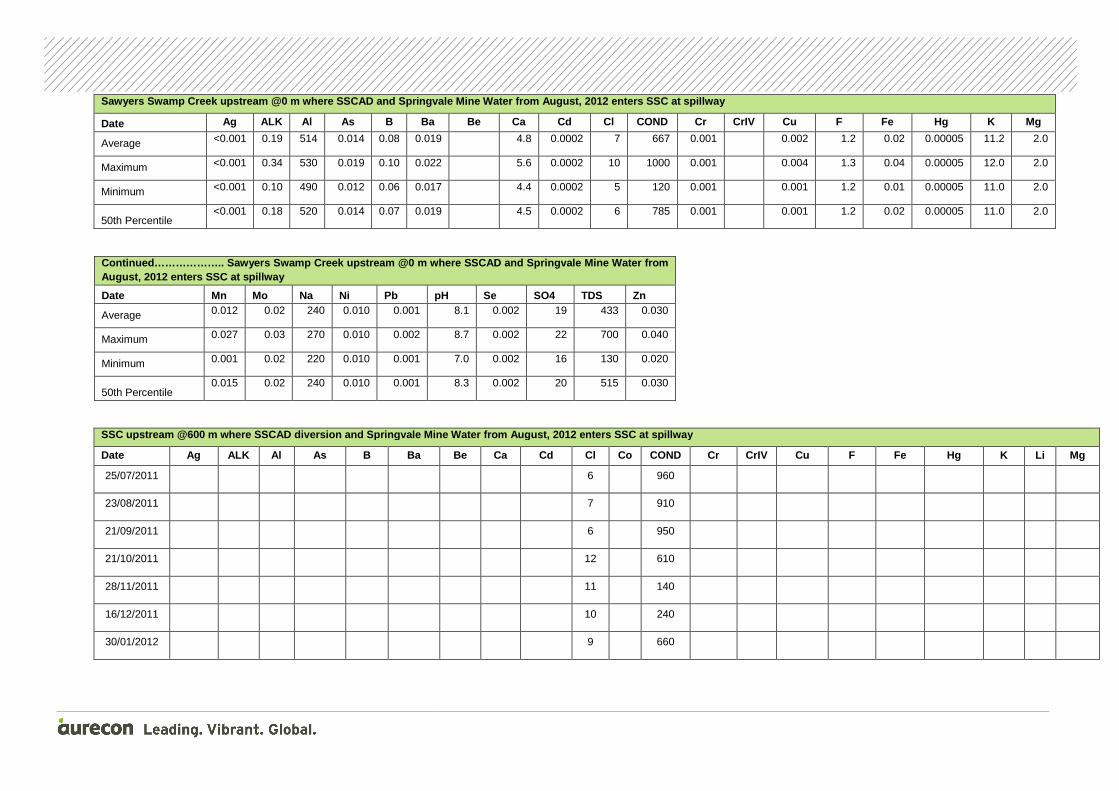
Sawyers Swamp Creek upstream @0 m where SSCAD and S pringvale Min e Water from August, 2012 enters SSC at spillway
Date Ag ALK Al As B Ba Be Ca Cd Cl COND Cr CrIV Cu F Fe Hg K Mg
Average <0.001 0.19 514 0.014 0.08 0.019 4.8 0.0002 7 667 0.001 0.002 1.2 0.02 0.00005 11.2 2.0
Maximum <0.001 0.34 530 0.019 0.10 0.022 5.6 0.0002 10 1000 0.001 0.004 1.3 0.04 0.00005 12.0 2.0
Minimum <0.001 0.10 490 0.012 0.06 0.017 4.4 0.0002 5 120 0.001 0.001 1.2 0.01 0.00005 11.0 2.0
50th Percentile <0.001 0.18 520 0.014 0.07 0.019 4.5 0.0002 6 785 0.001 0.001 1.2 0.02 0.00005 11.0 2.0
Cont inued……………….. Sawyers Swamp Creek upstream @0 m where SSCAD and S pringvale Mine Water from August, 2012 enters SSC at spillway
Date Mn Mo Na Ni Pb pH Se SO4 TDS Zn
Average 0.012 0.02 240 0.010 0.001 8.1 0.002 19 433 0.030
Maximum 0.027 0.03 270 0.010 0.002 8.7 0.002 22 700 0.040
Minimum 0.001 0.02 220 0.010 0.001 7.0 0.002 16 130 0.020
50th Percentile 0.015 0.02 240 0.010 0.001 8.3 0.002 20 515 0.030
SSC upstream @600 m where SSCAD diversion and Sprin gvale Mine Water from August, 2012 e nters SSC at spillway
Date Ag ALK Al As B Ba Be Ca Cd Cl Co COND Cr CrIV Cu F Fe Hg K Li Mg
25/07/2011
6
960
23/08/2011
7
910
21/09/2011
6
950
21/10/2011
12
610
28/11/2011
11
140
16/12/2011
10
240
30/01/2012
9
660
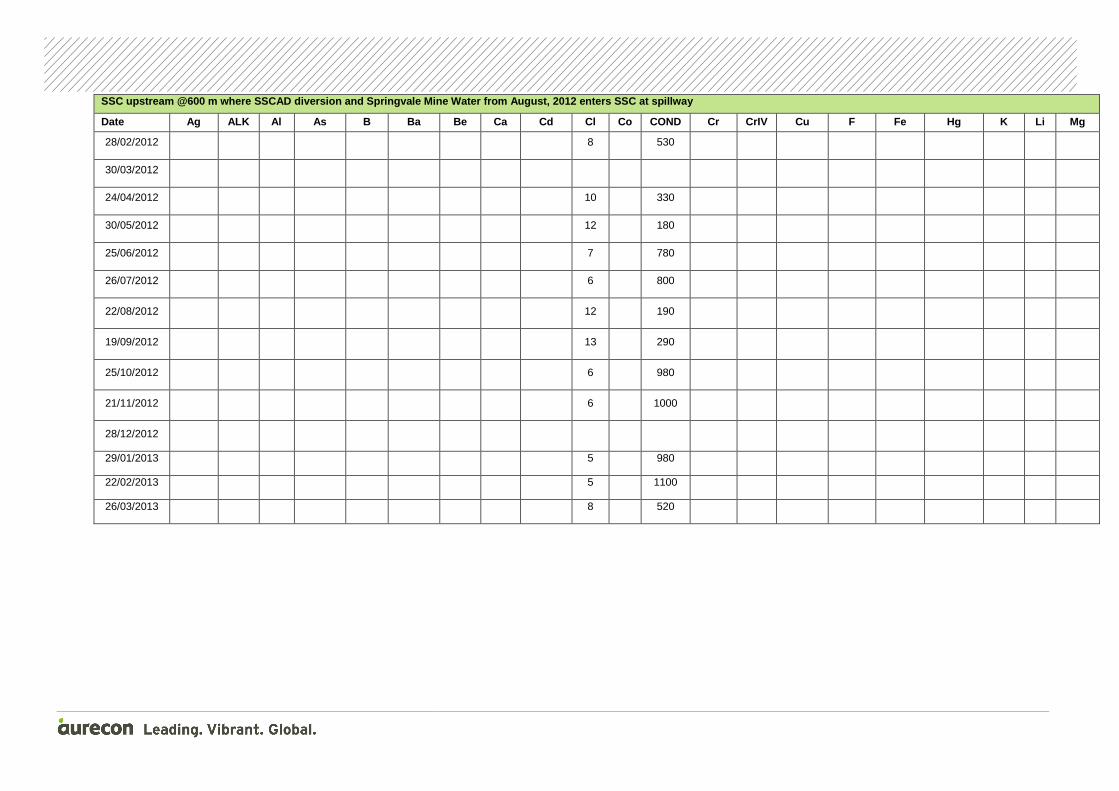
SSC upstream @600 m where SSCAD diversion and Sprin gvale Mine Water from August, 2012 e nters SSC at spillway
Date Ag ALK Al As B Ba Be Ca Cd Cl Co COND Cr CrIV Cu F Fe Hg K Li Mg
28/02/2012
8
530
30/03/2012
24/04/2012
10
330
30/05/2012
12
180
25/06/2012
7
780
26/07/2012
6
800
22/08/2012
12
190
19/09/2012
13
290
25/10/2012
6
980
21/11/2012
6
1000
28/12/2012
29/01/2013 5
980
22/02/2013 5
1100
26/03/2013 8
520
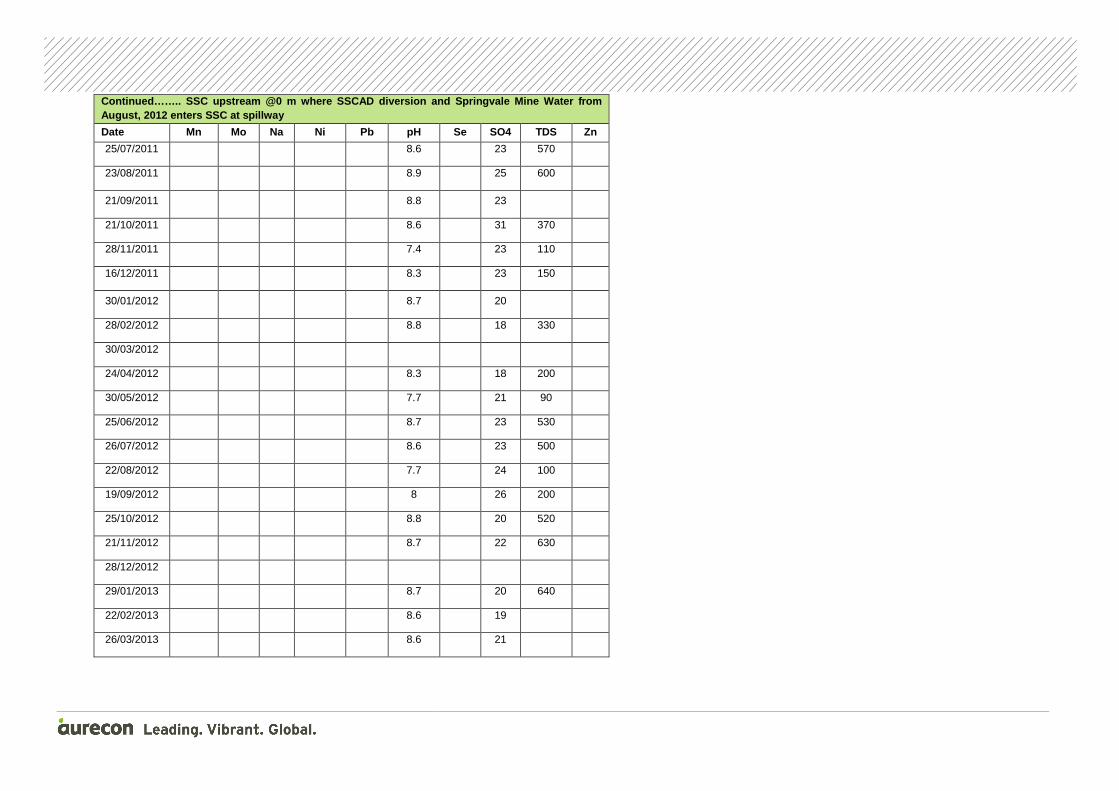
Continued…….. SSC upstream @0 m where SSCAD diversi on and Springvale Mine Water from August, 2012 enters SSC at spillway
Date Mn Mo Na Ni Pb pH Se SO4 TDS Zn
25/07/2011
8.6
23 570
23/08/2011
8.9
25 600
21/09/2011
8.8
23
21/10/2011
8.6
31 370
28/11/2011
7.4
23 110
16/12/2011
8.3
23 150
30/01/2012
8.7
20
28/02/2012
8.8
18 330
30/03/2012
24/04/2012
8.3
18 200
30/05/2012
7.7
21 90
25/06/2012
8.7
23 530
26/07/2012
8.6
23 500
22/08/2012
7.7
24 100
19/09/2012
8
26 200
25/10/2012
8.8
20 520
21/11/2012
8.7
22 630
28/12/2012
29/01/2013
8.7
20 640
22/02/2013
8.6
19
26/03/2013
8.6
21
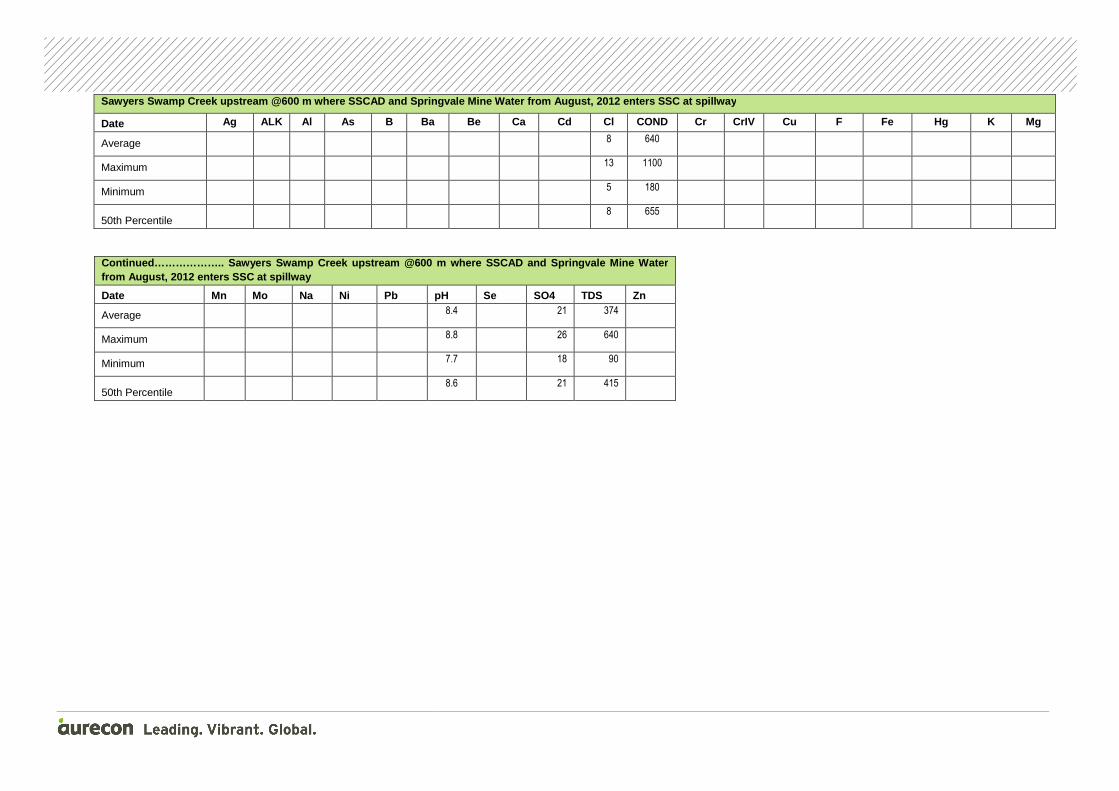
Sawyers Swamp Creek upstream @600 m where SSCAD and Springvale Mine Water from August, 2012 enters SSC at spillway
Date Ag ALK Al As B Ba Be Ca Cd Cl COND Cr CrIV Cu F Fe Hg K Mg
Average 8 640
Maximum 13 1100
Minimum 5 180
50th Percentile 8 655
Cont inued……………….. Sawyers Swamp Creek upstream @600 m w here SSCAD and Springvale Mine Water from August, 2012 enters SSC at spillway
Date Mn Mo Na Ni Pb pH Se SO4 TDS Zn
Average 8.4 21 374
Maximum 8.8 26 640
Minimum 7.7 18 90
50th Percentile 8.6 21 415

SSCAD Seepage from V -notch (water collected and recycling back into dam)
Date Ag ALK Al As B Ba Be Ca Cd Cl Co COND Cr CrIV Cu F Fe Hg K Li Mg
1/02/2010 <0.001 90 0.2 <0.002 2.9 0.024 0.001 150 0.0004 49
2013 <0.001
<0.001 0.6 <0.01 <0.00005 34 67
24/02/2010 <0.001 80 0.1 <0.001 2.8 0.022 0.001 130 0.00018 51
2139 <0.001
0.0029 1.6 <0.01 <0.00005 35 61
18/03/2010 <0.001 80 <0.1 <0.001 3 0.021 0.001 140 0.0002 46
2016 <0.001
0.0032 1.5 <0.01 <0.00005 35 64
15/04/2010 <0.001 110 <0.1 <0.001 2.4 0.021 <0.001 120 0.0002 48
2000 <0.001
0.004 1.2 0.01 <0.00005 33 57
26/05/2010 <0.001 60 0.5 <0.001 2 0.021 <0.001 99 <0.0002 40
1555 0.001
0.002 1.2 0.02 <0.00005 28 47
9/06/2010 <0.001 80 0.09 <0.001 2.7 0.021 140 0.0002 48
1831 <0.001
0.002 1.3 <0.01 <0.00005 35 65
1/07/2010 <0.001 90 0.36 <0.001 2 0.03 110 <0.0002 50
1681 <0.001
0.004 1.2 <0.01 <0.00005 26 52
25/08/2010 <0.001 80 1.1 <0.001 0.75 0.03 52 <0.0002 46
860 0.001
0.003 0.8 0.01 <0.00005 12 25
23/09/2010 <0.001 240 1.1 0.001 0.58 0.033 41 <0.0002 45
979 <0.001
0.004 1.2 0.01 <0.00005 12 21
27/10/2010 <0.001 80 1.1 <0.001 0.79 0.035 48 <0.0002 38
818 <0.001
0.002 0.7 0.01 <0.00005 12 24
19/11/2010 <0.001 110 1.7 0.001 1 0.056 62 <0.0002 48
1004 0.002
0.005 0.9 0.01 <0.00005 17 31
9/12/2010 <0.001 50 0.88 0.0015 1.7 0.058 78 0.001 44
1488 <0.001
0.0042 1.1 <0.01 <0.00005 29 33
12/01/2011 <0.001 90 0.09 <0.001 2.1 0.029 120 <0.0002 58
1840 <0.001
0.001 1.3 0.01 <0.00005 32 58
24/02/2011 <0.001 90 0.06 <0.001 2.5 0.023 130 0.0002 51
1900 <0.001
<0.001 1.4 <0.01 <0.00005 34 60
24/03/2011 <0.001 86 0.05 <0.001 2.5 0.023 130 <0.0002 51
1900 <0.001
0.002 1.3 <0.01 <0.00005 34 61
8/04/2011 <0.001 85 0.06 <0.001 2.6 0.021 120 0.0002 50
1900 <0.001
0.002 1.3 0.02 <0.00005 37 57
12/05/2011 <0.001 81 0.05 <0.001 2.5 0.022 120 0.0002 48
1900 <0.001
0.002 1.3 0.02 <0.00005 33 60
10/06/2011 <0.001 82 0.08 <0.001 2.6 0.022 130 <0.0002 48
2000 <0.001
0.003 1.3 <0.01 <0.00005 33 59
26/07/2011 <0.001 82 0.04 <0.001 2.6 0.02 120 <0.0002 45
1800 0.001
0.002 1.3 <0.01 <0.00005 35 57
30/08/2011 <0.001 85 0.06 <0.001 2.3 0.021 120 <0.0002 46
1800 <0.001
0.002 1.3 <0.01 <0.00005 33 53
21/09/2011 <0.001 84 0.05 <0.001 2.4 0.021 120 <0.0002 49
1900 0.002
0.004 1.4 0.02 <0.00005 34 56
26/10/2011 <0.001 89 0.05 <0.001 2.1 0.022 110 <0.0002 47
1900 0.001
<0.001 1.3 0.03 <0.00005 33 55

SSCAD Seepage from V -notch (water collected and recycling back into dam)
Date Ag ALK Al As B Ba Be Ca Cd Cl Co COND Cr CrIV Cu F Fe Hg K Li Mg
15/11/2011 <0.001 87 0.1 <0.001 2.4 0.18 120 <0.0002 53
1900 <0.001
0.003 1.4 0.03 <0.00005 33 56
18/01/2012 <0.001 89 0.12 <0.001 2.4 0.024 120 <0.0002 52
1900 <0.001
0.003 1.3 0.03 <0.00005 34 54
23/02/2012 <0.001 90 0.37 <0.001 1.9 0.027 92 <0.0002 43
1600 <0.001
0.002 0.9 0.03 <0.00005 28 44
14/03/2012 <0.001 100 0.09 <0.001 2 0.03 97 <0.0002 53
1700 <0.001
0.002 0.9 0.01 <0.00005 30 47
20/04/2012 <0.001 88 0.31 <0.001 2.3 0.024 100 0.0002 49
1700 <0.001
0.004 1.7 0.02 0.00006 30 48
23/05/2012 <0.001 85 0.19 <0.001 2.4 0.023 110 <0.0002 47
1700 <0.001
0.003 1.3 0.01 <0.00005 28 53
21/06/2012 <0.001 89 0.11 <0.001 2 0.021 88 <0.0002 45
1500 <0.001
0.002 1.3 <0.01 <0.00005 26 43
26/07/2012 <0.001 68 1.1 <0.001 1.4 0.026 62 <0.0002 38
1200 <0.001
0.002 0.8 0.03 <0.00005 19 31
15/08/2012 <0.001 86 0.17 <0.001 2.1 0.023 93 <0.0002 48
1600 <0.001
0.002 1.5 0.02 <0.00005 28 44
14/09/2012 <0.001 86 0.19 <0.001 2.3 0.022 98 <0.0002 46
1600 <0.001
0.003 1.2 <0.01 <0.00005 31 46
11/10/2012 <0.001 82 0.31 <0.001 2.3 0.024 94 0.0002 42
1600 <0.001
0.004 1.2 0.22 <0.00005 30 44
14/11/2012 <0.001 82 0.07 <0.001 2.5 0.022 98 <0.0002 41
1700 <0.001
0.002 1.3 <0.01 <0.00005 31 45
12/12/2012 <0.001 79 0.36 <0.001 2.4 0.044 96 0.0003 44
1700 <0.001
0.004 1.5 <0.01 <0.00005 38 45
16/01/2013 <0.001 80 0.69 <0.001 2.6 0.039 110 0.0006 42
1700 0.002
0.008 1.8 0.04 <0.00005 37 47
20/02/2013 <0.001 77 0.17 <0.001 2.4 0.021 110 <0.0002 37
1700 <0.001
0.004 0.2 <0.01 <0.00005 33 50
13/03/2013 <0.001 84 0.08 <0.001 2.2 0.027 110 0.0002 40
1800 <0.001
0.005 1.4 <0.01 <0.00005 36 51

Continued…….. SSCAD Seepage fro m V-notch (water collected and recycling back into dam)
Date Mn Mo Na Ni Pb pH Se SO4 TDS Zn
1/02/2010 0.03 <0.01 250 0.01 <0.001 7.4 0.002 1000 1600 0.06
24/02/2010 0.05 <0.01 230 <0.01 <0.001 7.4 <0.002 980 1500 0.03
18/03/2010 0.06 <0.01 240 0.01 <0.001 7.5 <0.002 900 1600 0.04
15/04/2010 0.02 <0.01 250 <0.01 <0.001 7.8 0.002 890 1500 0.04
26/05/2010 0.05 <0.01 190 <0.01 <0.001 <0.002 720 1100 0.03
9/06/2010 0.05 <0.01 240 0.01 <0.001 7.4 0.002 930 1500 0.04
1/07/2010 0.22 <0.01 190 <0.01 <0.001 8 <0.002 700 1200 0.03
25/08/2010 0.15 <0.01 96 <0.01 0.001 7.7 <0.002 250 530 0.04
23/09/2010 <0.01 0.01 150 <0.01 0.001 8.2 0.002 190 610 0.01
27/10/2010 0.24 <0.01 83 <0.01 0.001 7.7 <0.002 250 560 0.02
19/11/2010 0.11 <0.01 120 <0.01 0.002 7.7 <0.002 330 700 0.02
9/12/2010 0.41 0.01 210 0.02 <0.001 7.4 0.002 640 1100 0.07
12/01/2011 <0.01 <0.01 240 <0.01 <0.001 7.5 <0.002 850 1500 0.03
24/02/2011 0.07 <0.01 250 0.01 <0.001 7.5 <0.002 910 1500 0.03
24/03/2011 0.046 <0.01 250 <0.01 <0.001 7.4 <0.002 890 1400 0.03
8/04/2011 0.046 <0.01 250 <0.01 <0.001 7.5 <0.002 900 1500 0.03
12/05/2011 0.049 <0.01 240 <0.01 <0.001 7.4 <0.002 880 1500 0.03
10/06/2011 0.055 <0.01 260 0.01 <0.001 7.4 <0.002 890 1400 0.04
26/07/2011 0.05 <0.01 240 <0.01 <0.001 7.3 0.002 880 1400 0.04
30/08/2011 0.047 <0.01 240 <0.01 <0.001 7.5 0.002 820 1300 0.04
21/09/2011 0.039 <0.01 250 <0.01 <0.001 7.7 0.002 850 1500 0.03
26/10/2011 0.05 <0.01 230 <0.01 <0.001 7.4 0.002 820 1400 0.03
15/11/2011 0.019 <0.01 230 <0.01 <0.001 7.7 0.002 830 1500 0.51
18/01/2012 0.076 <0.01 250 <0.01 <0.001 7.6 <0.002 820 1400 0.04
23/02/2012 0.001 <0.01 210 <0.01 <0.001 7.6 <0.002 630 1100 0.03
14/03/2012 0.032 <0.01 220 <0.01 <0.001 7.7 0.002 700 1100 0.03
20/04/2012 0.019 <0.01 220 <0.01 <0.001 7.4 0.002 750 1300 0.03
23/05/2012 0.026 <0.01 210 <0.01 <0.001 7.2 0.002 740 1300 0.06
21/06/2012 0.03 <0.01 190 <0.01 <0.001 7.5 0.002 660 1200 0.03
26/07/2012 <0.001 <0.01 140 <0.01 <0.001 7 0.002 480 860 0.03
15/08/2012 0.014 <0.01 210 <0.01 <0.001 7.1 0.002 720 1300 0.07
14/09/2012 0.007 <0.01 210 <0.01 <0.001 7.4 <0.002 730 1200 0.04

Continued…….. SSCAD Seepage fro m V-notch (water collected and recycling back into dam)
Date Mn Mo Na Ni Pb pH Se SO4 TDS Zn
11/10/2012 0.087 <0.01 210 <0.01 <0.001 7.1 0.002 710 1200 0.03
14/11/2012 0.027 <0.01 220 <0.01 <0.001 6.9 0.002 730 870 0.04
12/12/2012 0.017 <0.01 210 <0.01 <0.001 7.2 0.002 820 1300 0.05
16/01/2013 0.031 <0.01 220 0.02 0.001 6.8 0.002 780 1300 0.08
20/02/2013 0.024 <0.01 250 <0.01 <0.001 7.1 <0.002 770 1400 0.03
13/03/2013 0.007 <0.01 230 0.01 <0.001 7 0.002 750 1300 0.04
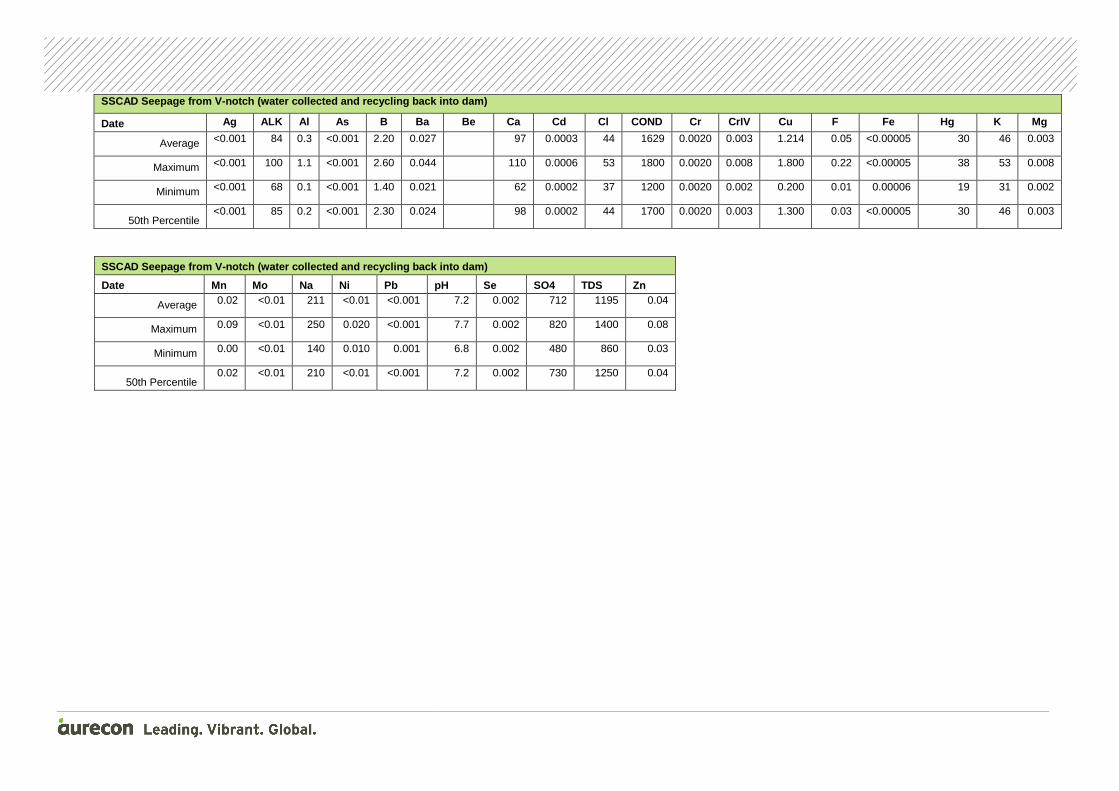
SSCAD Seepage from V -notch (water collected and recycling back into dam)
Date Ag ALK Al As B Ba Be Ca Cd Cl COND Cr CrIV Cu F Fe Hg K Mg
Average <0.001 84 0.3 <0.001 2.20 0.027 97 0.0003 44 1629 0.0020 0.003 1.214 0.05 <0.00005 30 46 0.003
Maximum <0.001 100 1.1 <0.001 2.60 0.044 110 0.0006 53 1800 0.0020 0.008 1.800 0.22 <0.00005 38 53 0.008
Minimum <0.001 68 0.1 <0.001 1.40 0.021 62 0.0002 37 1200 0.0020 0.002 0.200 0.01 0.00006 19 31 0.002
50th Percentile <0.001 85 0.2 <0.001 2.30 0.024 98 0.0002 44 1700 0.0020 0.003 1.300 0.03 <0.00005 30 46 0.003
SSCAD Seepage from V-notch (water collected and rec ycling back into dam)
Date Mn Mo Na Ni Pb pH Se SO4 TDS Zn
Average 0.02 <0.01 211 <0.01 <0.001 7.2 0.002 712 1195 0.04
Maximum 0.09 <0.01 250 0.020 <0.001 7.7 0.002 820 1400 0.08
Minimum 0.00 <0.01 140 0.010 0.001 6.8 0.002 480 860 0.03
50th Percentile 0.02 <0.01 210 <0.01 <0.001 7.2 0.002 730 1250 0.04

Sawyers Creek @850m – upstream seepage from KVAD wall and Below v -notch Seepage Point. EANSW Site 93 from June, 201 2
Date Ag ALK Al As B Ba Be Ca Cd Cl Co COND Cr CrIV Cu F Fe Hg K Li Mg
1-Feb-10 <0.001 120 0.3 0.002 0.43 0.043 <0.001 20 <0.0002 15
554 <0.001 0.001 0.6 0.32 <0.00005 8 9.4
24-Feb-10 <0.001 150 <0.1 0.001 0.82 0.085 <0.001 44 <0.0001 22
895 <0.001 0.0012 0.6 0.02 <0.00005 12 21
17-Mar-10 <0.001 160 <0.1 0.001 1.1 0.14 0.001 66 <0.0002 29
1188 <0.001 0.002 0.6 <0.01 <0.00005 16 33
15-Apr-10 <0.001 460 0.8 0.003 0.19 0.027 <0.001 12 <0.0002 9
1024 <0.001 0.002 1 0.33 <0.00005 11 6
26-May-10 <0.001 130 5 0.004 0.63 0.089 0.001 34 <0.0002 32
822 0.005 0.009 0.5 0.02 <0.00005 13 19
9-Jun-10 <0.001 120 0.03 0.001 0.98 0.07 52 <0.0002 33
1031 <0.001 0.001 0.6 0.02 <0.00005 15 26
1-Jul-10 <0.001 120 0.04 0.001 0.85 0.08 48 <0.0002 32
1007 <0.001 0.003 0.4 <0.01 <0.00005 14 25
25-Aug-10 <0.001 180 0.51 0.001 0.2 0.032 14 <0.0002 20
560 <0.001 0.001 0.5 0.62 <0.00005 6 7.7
23-Sep-10 <0.001 260 0.4 0.003 1.1 0.024 8.8 <0.0002 10
656 <0.001 0.002 0.6 0.95 <0.00005 7 4.5
28-Oct-10 <0.001 220 1 0.002 0.07 0.026 7.2 <0.0002 8
519 <0.001 0.002 0.5 0.46 <0.00005 5 4.3
23-Nov-10
9-Dec-10
13-Jan-11
24-Feb-11
24-Mar-11
8-Apr-11
12-May-11
10-Jun-11
25/07/2011 8
980
23/08/2011 9
930
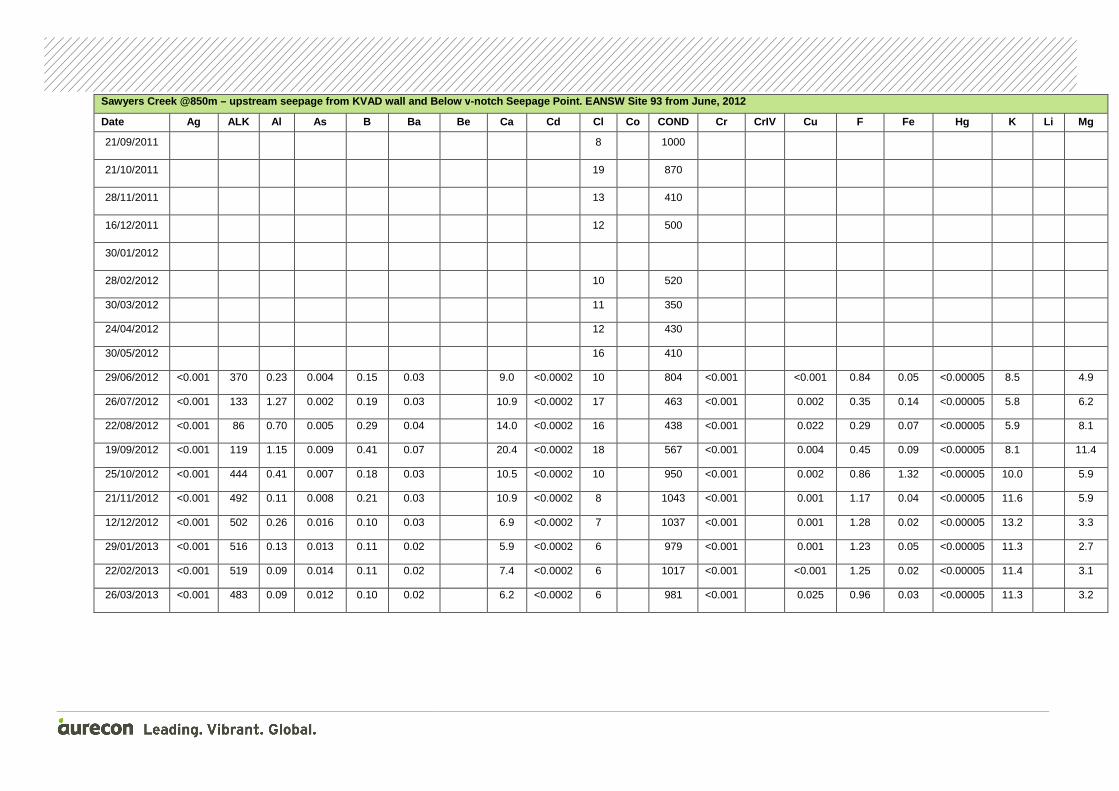
Sawyers Creek @850m – upstream seepage from KVAD wall and Below v -notch Seepage Point. EANSW Site 93 from June, 201 2
Date Ag ALK Al As B Ba Be Ca Cd Cl Co COND Cr CrIV Cu F Fe Hg K Li Mg
21/09/2011 8
1000
21/10/2011 19
870
28/11/2011 13
410
16/12/2011 12
500
30/01/2012
28/02/2012 10
520
30/03/2012 11
350
24/04/2012 12
430
30/05/2012 16
410
29/06/2012 <0.001 370 0.23 0.004 0.15 0.03 9.0 <0.0002 10
804 <0.001 <0.001 0.84 0.05 <0.00005 8.5 4.9
26/07/2012 <0.001 133 1.27 0.002 0.19 0.03 10.9 <0.0002 17
463 <0.001 0.002 0.35 0.14 <0.00005 5.8 6.2
22/08/2012 <0.001 86 0.70 0.005 0.29 0.04 14.0 <0.0002 16
438 <0.001 0.022 0.29 0.07 <0.00005 5.9 8.1
19/09/2012 <0.001 119 1.15 0.009 0.41 0.07 20.4 <0.0002 18
567 <0.001 0.004 0.45 0.09 <0.00005 8.1 11.4
25/10/2012 <0.001 444 0.41 0.007 0.18 0.03 10.5 <0.0002 10
950 <0.001 0.002 0.86 1.32 <0.00005 10.0 5.9
21/11/2012 <0.001 492 0.11 0.008 0.21 0.03 10.9 <0.0002 8
1043 <0.001 0.001 1.17 0.04 <0.00005 11.6 5.9
12/12/2012 <0.001 502 0.26 0.016 0.10 0.03 6.9 <0.0002 7
1037 <0.001 0.001 1.28 0.02 <0.00005 13.2 3.3
29/01/2013 <0.001 516 0.13 0.013 0.11 0.02 5.9 <0.0002 6
979 <0.001 0.001 1.23 0.05 <0.00005 11.3 2.7
22/02/2013 <0.001 519 0.09 0.014 0.11 0.02 7.4 <0.0002 6
1017 <0.001 <0.001 1.25 0.02 <0.00005 11.4 3.1
26/03/2013 <0.001 483 0.09 0.012 0.10 0.02 6.2 <0.0002 6
981 <0.001 0.025 0.96 0.03 <0.00005 11.3 3.2

Continued…….. SSCAD Seepage from V -notch (water collected and recycling back into dam)
Date Mn Mo Na Ni Pb pH Se SO4 TDS Zn
1-Feb-10 0.08 <0.01 84 <0.01 <0.001 7.9 <0.002 130 340 <0.01
24-Feb-10 1.1 <0.01 110 <0.01 <0.001 7.6 <0.002 250 550 0.01
17-Mar-10 1.6 <0.01 150 <0.01 <0.001 7.5 <0.002 390 860 0.02
15-Apr-10 <0.01 0.01 230 <0.01 <0.001 8.5 <0.002 71 590 0.04
26-May-10 0.11 <0.01 120 <0.01 0.011 7.7 <0.002 230 480 0.06
9-Jun-10 0.55 <0.01 130 <0.01 <0.001 7.7 <0.002 380 720 0.01
1-Jul-10 0.91 <0.01 120 <0.01 <0.001 8.2 <0.002 320 600 0.02
25-Aug-10 0.2 <0.01 95 <0.01 <0.001 8.1 <0.002 79 310 0.02
23-Sep-10 0.04 <0.01 140 <0.01 0.001 8.3 <0.002 68 390 0.01
28-Oct-10 0.02 0.01 110 <0.01 0.001 8.1 <0.002 38 360 0.02
23-Nov-10
9-Dec-10
13-Jan-11
24-Feb-11
24-Mar-11
8-Apr-11
12-May-11
10-Jun-11
25/07/2011 8.4 58 630
23/08/2011 8.6 57 610
21/09/2011 8.4 59
21/10/2011 7.8 200 560
28/11/2011 7.6 79 280
16/12/2011 8.0 120 330
30/01/2012
28/02/2012 8.1 39 340
30/03/2012 8.0 36 240
24/04/2012 7.9 56 260
30/05/2012 7.6 99 220
29/06/2012 0.050 0.01 176 0.002 <0.001 8.5 <0.002 57 536 0.029
26/07/2012 0.001 0.01 81 0.002 0.002 7.7 <0.002 72 310 0.014
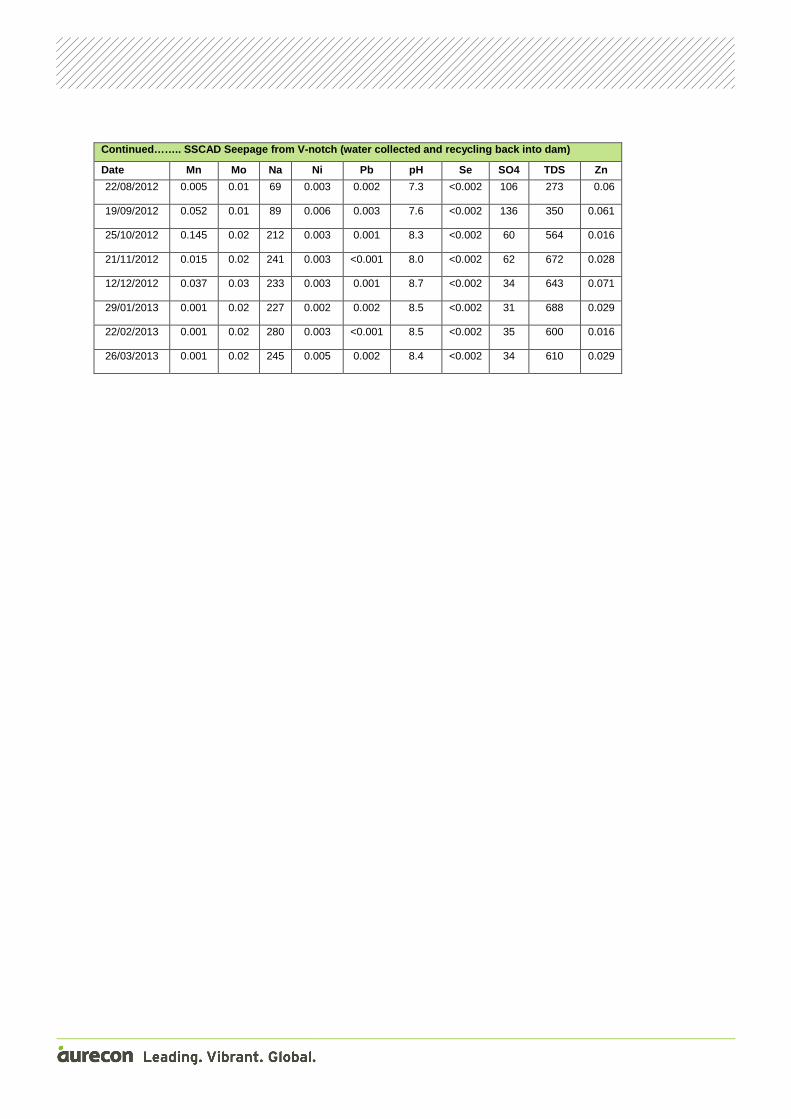
Continued…….. SSCAD Seepage from V -notch (water collected and recycling back into dam)
Date Mn Mo Na Ni Pb pH Se SO4 TDS Zn
22/08/2012 0.005 0.01 69 0.003 0.002 7.3 <0.002 106 273 0.06
19/09/2012 0.052 0.01 89 0.006 0.003 7.6 <0.002 136 350 0.061
25/10/2012 0.145 0.02 212 0.003 0.001 8.3 <0.002 60 564 0.016
21/11/2012 0.015 0.02 241 0.003 <0.001 8.0 <0.002 62 672 0.028
12/12/2012 0.037 0.03 233 0.003 0.001 8.7 <0.002 34 643 0.071
29/01/2013 0.001 0.02 227 0.002 0.002 8.5 <0.002 31 688 0.029
22/02/2013 0.001 0.02 280 0.003 <0.001 8.5 <0.002 35 600 0.016
26/03/2013 0.001 0.02 245 0.005 0.002 8.4 <0.002 34 610 0.029

Sawyers Creek @850m – upstream seepage from KVAD wall and Below v -notch Seepage Point. EANSW Site 93
Date Ag ALK Al As B Ba Be Ca Cd Cl COND Cr CrIV Cu F Fe Hg K Mg
Average <0.001 366 0.44 0.009 0.18 0.03 10.2 <0.0002 11 714 <0.001 0.007 0.87 0.18 <0.00005 9.7 5.5
Maximum <0.001 519 1.27 0.016 0.41 0.07 20.4 <0.0002 18 1043 <0.001 0.025 1.28 1.32 <0.00005 13.2 11.4
Minimum <0.001 86 0.09 0.002 0.10 0.02 5.9 <0.0002 6 350 <0.001 0.001 0.29 0.02 <0.00005 5.8 2.7
50th Percentile <0.001 464 0.24 0.009 0.17 0.03 9.8 <0.0002 10 686 <0.001 0.002 0.91 0.05 <0.00005 10.6 5.4
Sawyers Creek @850m – upstream seepage fro m KVAD wall and Below v -notch Seepage Point. EANSW Site 93 from June, 2012
Date Mn Mo Na Ni Pb pH Se SO4 TDS Zn
Average 0.03 0.02 185 0.003 0.002 8.1 <0.002 61 450 0.035
Maximum 0.15 0.03 280 0.006 0.003 8.7 <0.002 136 688 0.071
Minimum 0.00 0.01 69 0.002 0.001 7.3 <0.002 31 220 0.014
50th Percentile 0.01 0.02 220 0.003 0.002 8.1 <0.002 56 443 0.029
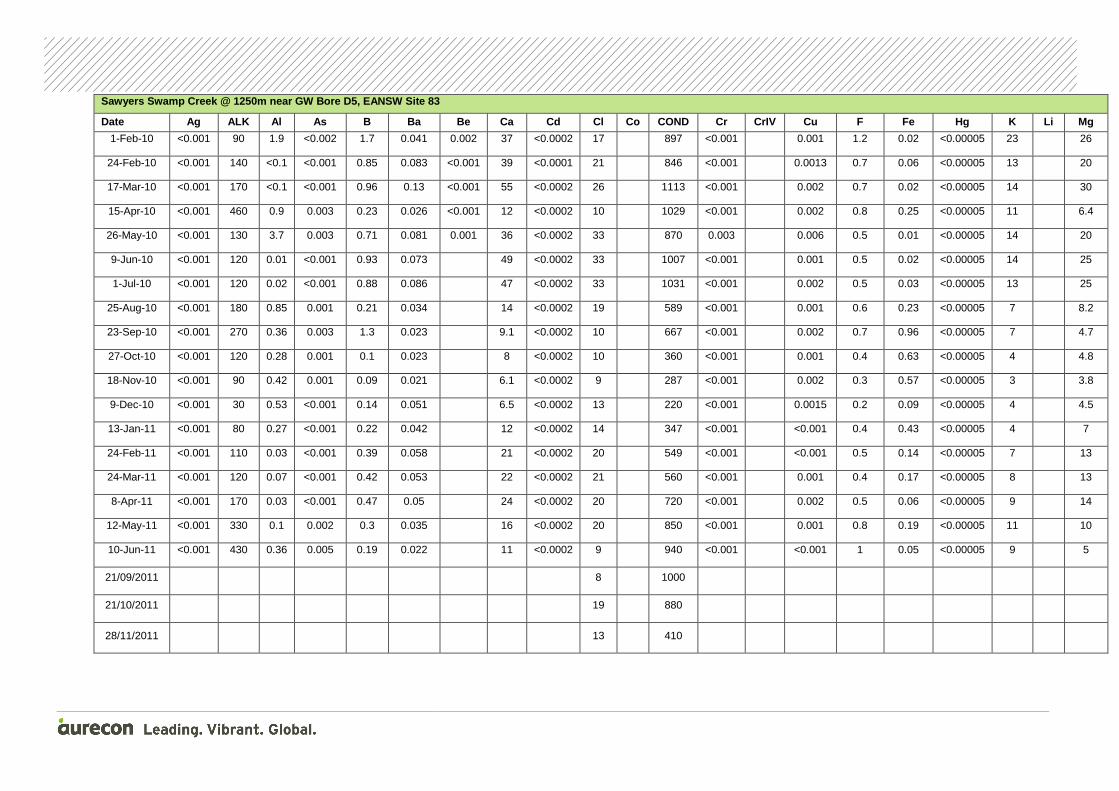
Sawyers Swamp Creek @ 1250m near GW Bore D5, EANSW Site 83
Date Ag ALK Al As B Ba Be Ca Cd Cl Co COND Cr CrIV Cu F Fe Hg K Li Mg
1-Feb-10 <0.001 90 1.9 <0.002 1.7 0.041 0.002 37 <0.0002 17
897 <0.001 0.001 1.2 0.02 <0.00005 23 26
24-Feb-10 <0.001 140 <0.1 <0.001 0.85 0.083 <0.001 39 <0.0001 21
846 <0.001 0.0013 0.7 0.06 <0.00005 13 20
17-Mar-10 <0.001 170 <0.1 <0.001 0.96 0.13 <0.001 55 <0.0002 26
1113 <0.001 0.002 0.7 0.02 <0.00005 14 30
15-Apr-10 <0.001 460 0.9 0.003 0.23 0.026 <0.001 12 <0.0002 10
1029 <0.001 0.002 0.8 0.25 <0.00005 11 6.4
26-May-10 <0.001 130 3.7 0.003 0.71 0.081 0.001 36 <0.0002 33
870 0.003 0.006 0.5 0.01 <0.00005 14 20
9-Jun-10 <0.001 120 0.01 <0.001 0.93 0.073 49 <0.0002 33
1007 <0.001 0.001 0.5 0.02 <0.00005 14 25
1-Jul-10 <0.001 120 0.02 <0.001 0.88 0.086 47 <0.0002 33
1031 <0.001 0.002 0.5 0.03 <0.00005 13 25
25-Aug-10 <0.001 180 0.85 0.001 0.21 0.034 14 <0.0002 19
589 <0.001 0.001 0.6 0.23 <0.00005 7 8.2
23-Sep-10 <0.001 270 0.36 0.003 1.3 0.023 9.1 <0.0002 10
667 <0.001 0.002 0.7 0.96 <0.00005 7 4.7
27-Oct-10 <0.001 120 0.28 0.001 0.1 0.023 8 <0.0002 10
360 <0.001 0.001 0.4 0.63 <0.00005 4 4.8
18-Nov-10 <0.001 90 0.42 0.001 0.09 0.021 6.1 <0.0002 9
287 <0.001 0.002 0.3 0.57 <0.00005 3 3.8
9-Dec-10 <0.001 30 0.53 <0.001 0.14 0.051 6.5 <0.0002 13
220 <0.001 0.0015 0.2 0.09 <0.00005 4 4.5
13-Jan-11 <0.001 80 0.27 <0.001 0.22 0.042 12 <0.0002 14
347 <0.001 <0.001 0.4 0.43 <0.00005 4 7
24-Feb-11 <0.001 110 0.03 <0.001 0.39 0.058 21 <0.0002 20
549 <0.001 <0.001 0.5 0.14 <0.00005 7 13
24-Mar-11 <0.001 120 0.07 <0.001 0.42 0.053 22 <0.0002 21
560 <0.001 0.001 0.4 0.17 <0.00005 8 13
8-Apr-11 <0.001 170 0.03 <0.001 0.47 0.05 24 <0.0002 20
720 <0.001 0.002 0.5 0.06 <0.00005 9 14
12-May-11 <0.001 330 0.1 0.002 0.3 0.035 16 <0.0002 20
850 <0.001 0.001 0.8 0.19 <0.00005 11 10
10-Jun-11 <0.001 430 0.36 0.005 0.19 0.022 11 <0.0002 9
940 <0.001 <0.001 1 0.05 <0.00005 9 5
21/09/2011 8
1000
21/10/2011 19
880
28/11/2011 13
410
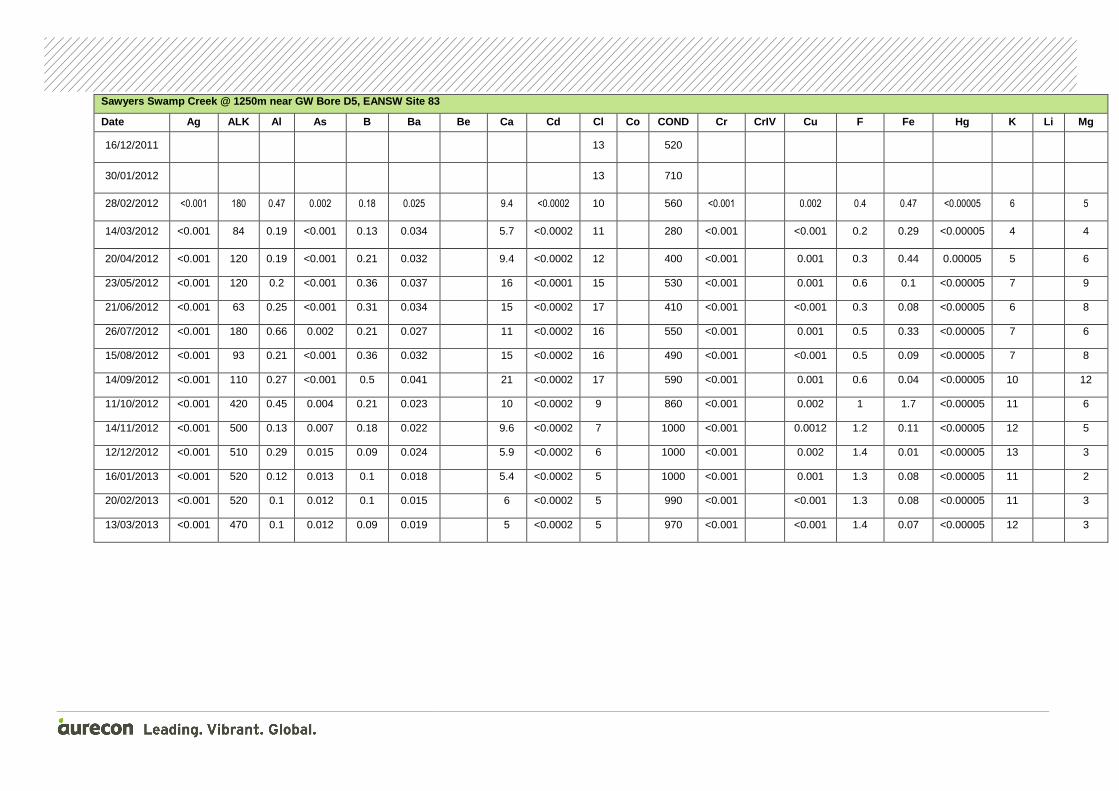
Sawyers Swamp Creek @ 1250m near GW Bore D5, EANSW Site 83
Date Ag ALK Al As B Ba Be Ca Cd Cl Co COND Cr CrIV Cu F Fe Hg K Li Mg
16/12/2011 13
520
30/01/2012 13
710
28/02/2012 <0.001 180 0.47 0.002 0.18 0.025 9.4 <0.0002 10
560 <0.001 0.002 0.4 0.47 <0.00005 6 5
14/03/2012 <0.001 84 0.19 <0.001 0.13 0.034 5.7 <0.0002 11
280 <0.001 <0.001 0.2 0.29 <0.00005 4 4
20/04/2012 <0.001 120 0.19 <0.001 0.21 0.032 9.4 <0.0002 12
400 <0.001 0.001 0.3 0.44 0.00005 5 6
23/05/2012 <0.001 120 0.2 <0.001 0.36 0.037 16 <0.0001 15
530 <0.001 0.001 0.6 0.1 <0.00005 7 9
21/06/2012 <0.001 63 0.25 <0.001 0.31 0.034 15 <0.0002 17
410 <0.001 <0.001 0.3 0.08 <0.00005 6 8
26/07/2012 <0.001 180 0.66 0.002 0.21 0.027 11 <0.0002 16
550 <0.001 0.001 0.5 0.33 <0.00005 7 6
15/08/2012 <0.001 93 0.21 <0.001 0.36 0.032 15 <0.0002 16
490 <0.001 <0.001 0.5 0.09 <0.00005 7 8
14/09/2012 <0.001 110 0.27 <0.001 0.5 0.041 21 <0.0002 17
590 <0.001 0.001 0.6 0.04 <0.00005 10 12
11/10/2012 <0.001 420 0.45 0.004 0.21 0.023 10 <0.0002 9
860 <0.001 0.002 1 1.7 <0.00005 11 6
14/11/2012 <0.001 500 0.13 0.007 0.18 0.022 9.6 <0.0002 7
1000 <0.001 0.0012 1.2 0.11 <0.00005 12 5
12/12/2012 <0.001 510 0.29 0.015 0.09 0.024 5.9 <0.0002 6
1000 <0.001 0.002 1.4 0.01 <0.00005 13 3
16/01/2013 <0.001 520 0.12 0.013 0.1 0.018 5.4 <0.0002 5
1000 <0.001 0.001 1.3 0.08 <0.00005 11 2
20/02/2013 <0.001 520 0.1 0.012 0.1 0.015 6 <0.0002 5
990 <0.001 <0.001 1.3 0.08 <0.00005 11 3
13/03/2013 <0.001 470 0.1 0.012 0.09 0.019 5 <0.0002 5
970 <0.001 <0.001 1.4 0.07 <0.00005 12 3
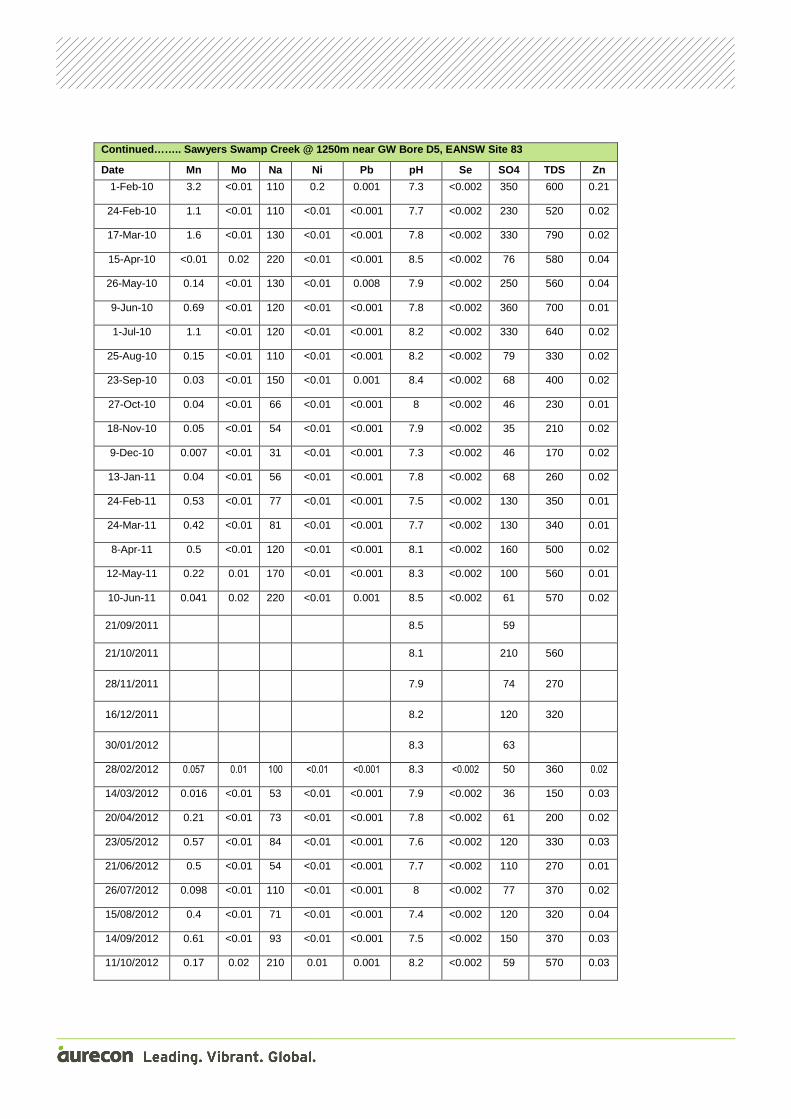
Continued…….. Sawyers Swamp Creek @ 1250m near GW Bore D5, EANSW Site 83
Date Mn Mo Na Ni Pb pH Se SO4 TDS Zn
1-Feb-10 3.2 <0.01 110 0.2 0.001 7.3 <0.002 350 600 0.21
24-Feb-10 1.1 <0.01 110 <0.01 <0.001 7.7 <0.002 230 520 0.02
17-Mar-10 1.6 <0.01 130 <0.01 <0.001 7.8 <0.002 330 790 0.02
15-Apr-10 <0.01 0.02 220 <0.01 <0.001 8.5 <0.002 76 580 0.04
26-May-10 0.14 <0.01 130 <0.01 0.008 7.9 <0.002 250 560 0.04
9-Jun-10 0.69 <0.01 120 <0.01 <0.001 7.8 <0.002 360 700 0.01
1-Jul-10 1.1 <0.01 120 <0.01 <0.001 8.2 <0.002 330 640 0.02
25-Aug-10 0.15 <0.01 110 <0.01 <0.001 8.2 <0.002 79 330 0.02
23-Sep-10 0.03 <0.01 150 <0.01 0.001 8.4 <0.002 68 400 0.02
27-Oct-10 0.04 <0.01 66 <0.01 <0.001 8 <0.002 46 230 0.01
18-Nov-10 0.05 <0.01 54 <0.01 <0.001 7.9 <0.002 35 210 0.02
9-Dec-10 0.007 <0.01 31 <0.01 <0.001 7.3 <0.002 46 170 0.02
13-Jan-11 0.04 <0.01 56 <0.01 <0.001 7.8 <0.002 68 260 0.02
24-Feb-11 0.53 <0.01 77 <0.01 <0.001 7.5 <0.002 130 350 0.01
24-Mar-11 0.42 <0.01 81 <0.01 <0.001 7.7 <0.002 130 340 0.01
8-Apr-11 0.5 <0.01 120 <0.01 <0.001 8.1 <0.002 160 500 0.02
12-May-11 0.22 0.01 170 <0.01 <0.001 8.3 <0.002 100 560 0.01
10-Jun-11 0.041 0.02 220 <0.01 0.001 8.5 <0.002 61 570 0.02
21/09/2011 8.5 59
21/10/2011 8.1 210 560
28/11/2011 7.9 74 270
16/12/2011 8.2 120 320
30/01/2012 8.3 63
28/02/2012 0.057 0.01 100 <0.01 <0.001 8.3 <0.002 50 360 0.02
14/03/2012 0.016 <0.01 53 <0.01 <0.001 7.9 <0.002 36 150 0.03
20/04/2012 0.21 <0.01 73 <0.01 <0.001 7.8 <0.002 61 200 0.02
23/05/2012 0.57 <0.01 84 <0.01 <0.001 7.6 <0.002 120 330 0.03
21/06/2012 0.5 <0.01 54 <0.01 <0.001 7.7 <0.002 110 270 0.01
26/07/2012 0.098 <0.01 110 <0.01 <0.001 8 <0.002 77 370 0.02
15/08/2012 0.4 <0.01 71 <0.01 <0.001 7.4 <0.002 120 320 0.04
14/09/2012 0.61 <0.01 93 <0.01 <0.001 7.5 <0.002 150 370 0.03
11/10/2012 0.17 0.02 210 0.01 0.001 8.2 <0.002 59 570 0.03

Continued…….. Sawyers Swamp Creek @ 1250m near GW Bore D5, EANSW Site 83
Date Mn Mo Na Ni Pb pH Se SO4 TDS Zn
14/11/2012 0.043 0.03 250 <0.01 <0.001 8.2 <0.002 47 640 0.03
12/12/2012 0.026 0.02 240 <0.01 0.001 8.6 <0.002 27 640 0.06
16/01/2013 <0.001 0.03 220 <0.01 0.002 8.5 <0.002 27 690 0.03
20/02/2013 <0.001 0.03 270 <0.01 <0.001 8.5 <0.002 24 620 0.02
13/03/2013 <0.001 0.02 250 <0.01 <0.001 8.4 <0.002 26 560 0.03
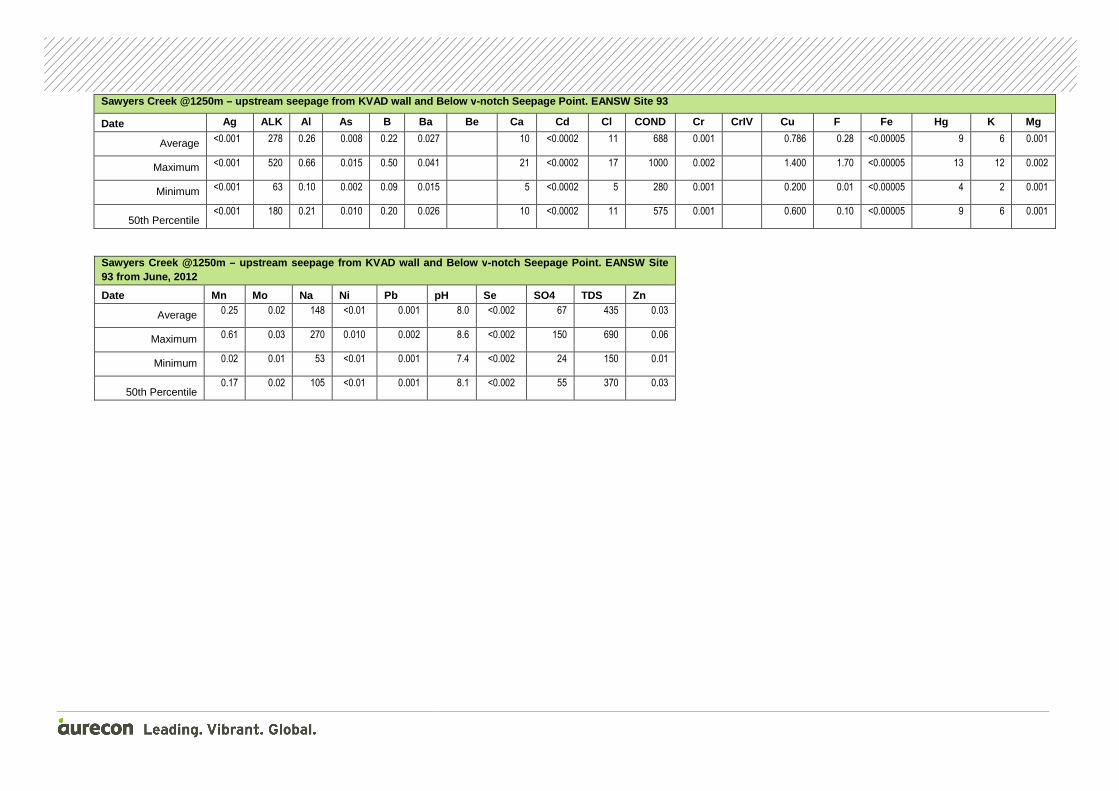
Sawyers Creek @1250m – upstream seepage from KVAD wall and Below v -notch Seepage Point. EANSW Site 93
Date Ag ALK Al As B Ba Be Ca Cd Cl COND Cr CrIV Cu F Fe Hg K Mg
Average <0.001 278 0.26 0.008 0.22 0.027 10 <0.0002 11 688 0.001 0.786 0.28 <0.00005 9 6 0.001
Maximum <0.001 520 0.66 0.015 0.50 0.041 21 <0.0002 17 1000 0.002 1.400 1.70 <0.00005 13 12 0.002
Minimum <0.001 63 0.10 0.002 0.09 0.015 5 <0.0002 5 280 0.001 0.200 0.01 <0.00005 4 2 0.001
50th Percentile <0.001 180 0.21 0.010 0.20 0.026 10 <0.0002 11 575 0.001 0.600 0.10 <0.00005 9 6 0.001
Sawyers Creek @1250m – upstream seepage from KVAD wall and Below v -notch Seepage Point. EANSW Site 93 from June, 2012
Date Mn Mo Na Ni Pb pH Se SO4 TDS Zn
Average 0.25 0.02 148 <0.01 0.001 8.0 <0.002 67 435 0.03
Maximum 0.61 0.03 270 0.010 0.002 8.6 <0.002 150 690 0.06
Minimum 0.02 0.01 53 <0.01 0.001 7.4 <0.002 24 150 0.01
50th Percentile 0.17 0.02 105 <0.01 0.001 8.1 <0.002 55 370 0.03
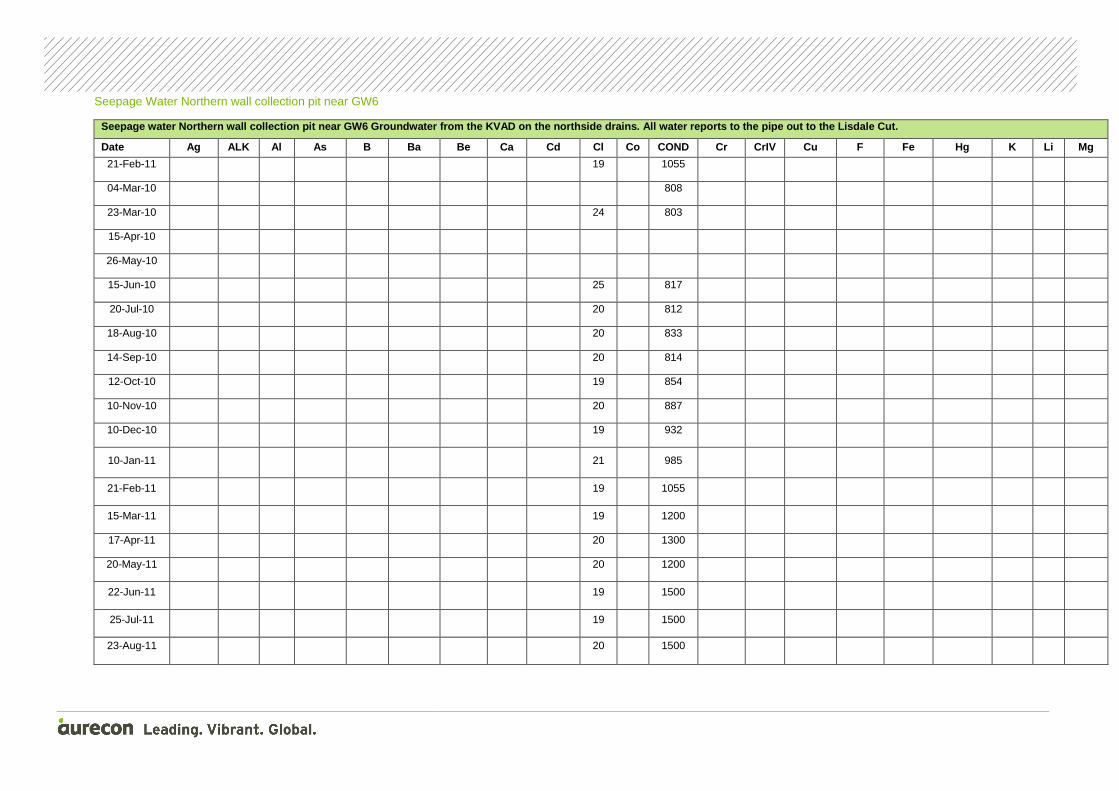
Seepage Water Northern wall collection pit near GW6
Seepage water Northern wall collection pit near GW6 Groundwater from the KVAD on the northside drains. All water reports to t he pipe out to the Lisdale Cut.
Date Ag ALK Al As B Ba Be Ca Cd Cl Co COND Cr CrIV Cu F Fe Hg K Li Mg
21-Feb-11 19
1055
04-Mar-10
808
23-Mar-10 24
803
15-Apr-10
26-May-10
15-Jun-10 25
817
20-Jul-10 20
812
18-Aug-10 20
833
14-Sep-10 20
814
12-Oct-10 19
854
10-Nov-10 20
887
10-Dec-10 19
932
10-Jan-11 21
985
21-Feb-11 19
1055
15-Mar-11 19
1200
17-Apr-11 20
1300
20-May-11 20
1200
22-Jun-11 19
1500
25-Jul-11 19
1500
23-Aug-11 20
1500

Seepage water Northern wall collection pit near GW6 Groundwater from the KVAD on the northside drains. All water reports to t he pipe out to the Lisdale Cut.
Date Ag ALK Al As B Ba Be Ca Cd Cl Co COND Cr CrIV Cu F Fe Hg K Li Mg
21-Sep-11 20
1400
21-Oct-11 18
1600
28-Nov-11 19
1600
16-Dec-11 19
1700
30-Jan-12 18
1500
28-Feb-12 18
1500
30-Mar-12 18
1700
24-Apr-12 16
1700
30-May-12 17
1700
29-Jun-13 17
2000
26-Jul-13 18
2100
22-Aug-12 18
1800
19-Sep-12 18
2100
25-Oct-12 17
2200
14-Nov-12
28-Dec-12 17
2400
29-Jan-13 17
2400
20-Feb-13
26-Mar-13 18
2900
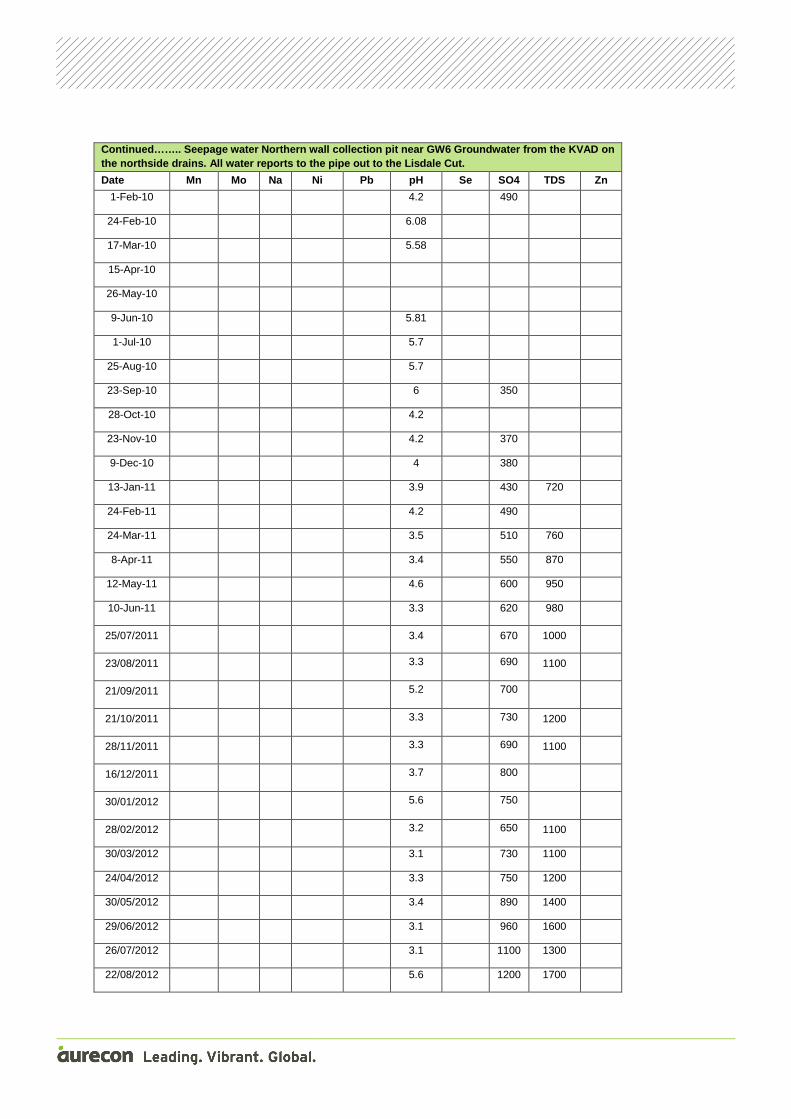
Continued…….. Seepage water Nor thern wall collection pit near GW6 Groundwater from the KVAD on the northside drains. All water reports to the pipe out to the Lisdale Cut.
Date Mn Mo Na Ni Pb pH Se SO4 TDS Zn
1-Feb-10 4.2 490
24-Feb-10 6.08
17-Mar-10 5.58
15-Apr-10
26-May-10
9-Jun-10 5.81
1-Jul-10 5.7
25-Aug-10 5.7
23-Sep-10 6 350
28-Oct-10 4.2
23-Nov-10 4.2 370
9-Dec-10 4 380
13-Jan-11 3.9 430 720
24-Feb-11 4.2 490
24-Mar-11 3.5 510 760
8-Apr-11 3.4 550 870
12-May-11 4.6 600 950
10-Jun-11 3.3 620 980
25/07/2011 3.4 670 1000
23/08/2011 3.3 690 1100
21/09/2011 5.2 700
21/10/2011 3.3 730 1200
28/11/2011 3.3 690 1100
16/12/2011 3.7 800
30/01/2012 5.6 750
28/02/2012 3.2 650 1100
30/03/2012 3.1 730 1100
24/04/2012 3.3 750 1200
30/05/2012 3.4 890 1400
29/06/2012 3.1 960 1600
26/07/2012 3.1 1100 1300
22/08/2012 5.6 1200 1700

Continued…….. Seepage water Nor thern wall collection pit near GW6 Groundwater from the KVAD on the northside drains. All water reports to the pipe out to the Lisdale Cut.
Date Mn Mo Na Ni Pb pH Se SO4 TDS Zn
19/09/2012 4.1 1200 1800
25/10/2012 5.7 1200 1500
21/11/2012
12/12/2012 3 1200 1700
29/01/2013 2.9 1200 1800
22/02/2013
26/03/2013 2.9 1400

Seepage water Northern wall collection pit near GW6 Groundwater from the KVAD on the northside drains. All water reports to t he pipe out to the Lisdale Cut.
Date Ag ALK Al As B Ba Be Ca Cd Cl COND Cr CrIV Cu F Fe Hg K Mg
Average 19 1462
Maximum 25 2900
Minimum 16 803
50th Percentile 19 1500
Seepage water Northern wall collection pit near GW6 Groundwater from the KVAD on the northside drains. All water reports to the pipe out to the Lisdale Cut.
Date Mn Mo Na Ni Pb pH Se SO4 TDS Zn
Average 4.2 769 1244
Maximum 6.1 1400 1800
Minimum 2.9 350 720
50th Percentile 3.9 700 1150

Aurecon Australia Pty Ltd ABN 54 005 139 873
Level 2, 116 Military Road Neutral Bay NSW 2089
PO Box 538 Neutral Bay NSW 2089 Australia
T +61 2 9465 5599 F +61 2 9465 5598 E [email protected] W aurecongroup.com
Aurecon offices are located in: Angola, Australia, Botswana, China, Ethiopia, Hong Kong, Indonesia, Lesotho, Libya, Malawi, Mozambique, Namibia, New Zealand, Nigeria, Philippines, Singapore, South Africa, Swaziland, Tanzania, Thailand, Uganda, United Arab Emirates, Vietnam.