project level pavement management system development … · report no. cdoh-dh-sd-90-7 project...
TRANSCRIPT

report no. CDOH-DH-SD-90-7
PROJECT LEVEL PAVEMENT MANAGEMENT SYSTEM
DEVELOPMENT
Stephen Horton P .E. Colorado Department of Highways Sta ff Design Branch
4201 East Arkansas Avenue Denver, Colorado 80222
Final Report
August, 1990
Prepared in cooperation with. the
U.S. Department of Transportation
Federal Highway Administration

Table of content
Chapter I Introduction . . . . . . . . . . . . . . . . . . . . . . . . . . . . . . . . . . . . . . . . . . . . . .
Chapter II Pavement Management Systems A. Network Level Pavement Management B. Project Level Pavement Management • • • • • • • • ~ • • • a _ • • • • • • • •
Chapter III
Page
1
2 5
Program Development and Procedures •••..•.•.••.•••.•••.•... 11 A. Flexible Pavements .................................. 13
B. Rigid Pavements ••....••••••.•••••••....•............ 17
C. Pavement Rehabilitation ••••••••.••.• . .•.••••••••.•.•• 20
1. Rehabilitation of Asphalt Pavements .••••.••••.•••• 22 2. Rehabilitation of Portland Cement Pavements •.•••• 26
D. Life-Cycle Cost Analysis ••••••••....•••..•...••••••. 29 E. Computer Programs ................................... 31
1. Flexible Pavement Design Program ••.•••.••.•.....• 32 2. Rigid Pavement Design Program ••.••••••••••••.•..• 32
3. Pavement Rehabilitation Design Program •••••..•..• 33 4. Life-Cycle Analysis Program ••••••••••.••••••••••• 34
Chapter IV. Implementation ............... ".............................. 35
Appendix A Pavement Evaluation Checklist
Appendix B Pavement Condition Factors
Appendix C User's Manual for Pavement Design Program
Appendix 0 User's Manual for Life-cycle Analysis Program
Appendix E Pavement Management Data Sheet

T ec:hnic:al Reporf Doc:um.ntation Page
, 1. R.I'o" No. , 2. Gover"".._", A.ccessio" No. I J. p<ecil',en" s Ca'aloIJ No. I
jCOOH-DH-SD-90-7
I 5. R .port 00'.
, lmnm:::t. 1990 4. j"I. and S",b'i,l.
6. Performing O'lianiza,ion Cod.
1498C
!Proj ect level Pavement Management /system Development
:-i -;-~-:--:-:-------------------_____ -tl s. P .riO''"t"9 O'VGni %ation Repatt No. i 7. AIJ,,",orts; I iSteve Horton, P. E. , 9. P .rfO'''''"9 O'gani zatian Nom. and Addre.s
jcolorado Department of Highways .4201 E. Arkansas Avenue
COOH-W-SD-90-7 10. Work Un"~ No. (TI;tAIS)
II. Can'ract or G'ant No.
'
I Denver, CO 80222 13. Typ. of Report and Period Co".r.d
~~------------------------~-----------------------------------------~ I 12. SpanSO""9 Ag.ncy Name and Address
I, u. S. Department of Transportation I Federal Highway Administration I
Final 2 years 14. Sponso,in9 Agency Code
Prepared in cooperation with the U. s. Department of Transportation, I Federal Highway Administration I 16. Ab.'roct
l'IbiS study was cazried out in several phases, including documentation of current policies am procedures am review of existi.rg state-of-the-art project level pavement management system; fran other states ani agencies. rurin:;] the development of Colorados I S pavement management system the subsequent study phases were focused on the modification of the flexible ani rigid pavement design process, followed by the rehabilitation of pavements ani life-cycle cost analyses. All changes were incorporated in the COOH design marrual subsequent to approval by the FHWA. ccmputer programs were developed for the pavement design process, pavement rehabilitation, and life-cycle cost analyses. 'Ihese programs are currently being Beta tested by the department's designers, am changes will be made upon findings fram the users as warranted.
Imalementatlon
Implementation of this study was an ongoing process. After each phase of the pavement design, rehabilitation, am life-cycle, costing was ~leted, l.n'plementation of that particular phase was enacted.
17. K.,. Wo,d.
I Proj ect Level Pavement Management, I Rigid pavement design,
IPavement rehabilitation, Lif~~cle cost anal~sis
IS. Oi.trib"tion Stat .... en'
No Restrictions: This report is available to the public through the National Infonnation Service Spri.nqfield, vireinia 22161
19. Sec""i,,. Claud. (of 'hIS ,e"o,t) 20. S.curity Claud. (e»f 'hi' "agel 21. No. of Pao.. 22. Price
Unclassified Unclassified
Farm ~OT F 1700.7 (8-72) Reprod"'ction of compl.t.d pag. outhariz.d

I. INTRODOCTION
Pavement management in the broadest sense includes all the activities associated with the planning, design, construction, maintenance, evaluation, and rehabilitation of a pavement system. Activities within the Colorado Department of Highways (CDOH) are characterized at two (2) levels:
Network level activities determine the optimum strategy for allocating pavement rehabilitation and maintenance funds over the entire network.
The current network objectives are to help management:
a) allocate surface rehabilitation and maintenance funds to the various Districts
b) suggest short-range programming, and
c) analyze alternative system performance under a variety of budget scenarios
Project level activities determine the best strategy for the construction or rehabilitation of a particular roadway section. The CDOH project level pavement management system was developed to provide a systematic procedure to assist designers in selecting optimum strategies for designing, rehabilitating, and maintaining pavements over a given period of time.
-1-

II. PAVEMENT MANAGEMENT SYSTEMS
A. Network Level Pavement Management
The Colorado Highway Department began developing its network pavement management system in late 1981. This system was developed by the Division of Transportation Planning with the assistance of a consultant firm. Implementation began in the summer of 1983.
It is important to note that there is no ideal single Pavement Management System which is best for all agencies. Every highway agency presents a unique situation with specific needs; therefore, each agency must carefully define what it wants from a pavement management system. Colorado's network system was modeled after Arizona's Network Optimization System. The philosophy of this system is one of preventative maintenance, i.e. it is more cost effective and beneficial to the highway system as a whole to treat problems before they become severe. Colorado's network system uses a mathematical formulation, known as a "linear programming II model as the basis of its system. In essence, this model considers the probabilistic performance relationships, the costs of the various activities, and the current pavement conditions. Based on these variables, it recommends that set of rehabilitation actions that will meet performance standards over time at a minimum total cost.
In order to determine the improvement category a section of roadway will be assigned, various data is collected on an annual basis using a K.J.Law 8300 roughness surveyor and visual observations. The condition survey determines the amount of cracking and patching plus roughness on a milepost basis for all the asphalt highways on the State system. For asphalt roadways, roughness and cracking were determined to be the variables most indicative of providing a comfortable, smooth and safe ride. For concrete pavement conditions the department updated the 1983 pavement condition survey. This survey evaluated numerous distress conditions and the overall condition of the concrete pavement was determined and recommended rehabilitation treatments were made. It is the intend of the department to incorporate this rating system into the network system in the future.
-2-

For asphalt pavements the conditions states were defined by the various combinations of three levels each of pavement roughness and pavement cracking as shown in Table 1.
The other variables affecting pavement performance are categorized into different Road categories based on the various combinations of traffic loading, administrative system, urbanized/rural characteristics, and environmental characteristics.
Table 1
Condition Level of Level of state Roughness Cracking Acceptability
1 Low Low Good 2 Low Medium Good 3 Low High Fair 4 Medium Low Fair 5 Medium Medium Fair 6 Medium High Poor 7 High Low Fair 8 High Medium Poor 9 High High Poor
Traffic loading are divided into four levels:
0 to 100 EDLA 100 to 500 EDLA 500 to 2000 EDLA
over 2000 EDLA
Environmental zones are divided into five categories:
High Mt. elevs over 8500 ft cool, wet, high frost Medium Mt. 6500 ft to 8500 ft cool, wet, high frost San Luis Valley 6500 ft to 8500 ft cool, dry, high frost Northern Plains less than 8500 ft warm, dry, low frost Southern Plains less than 6500 ft warm, dry, very low frost
(Another factor that is planned to be incorporated into'the overall condition survey is the extent and severity of pavement rutting. )
This process produces 47 categories referenced to highway route and milepost. Using a Delphi exercise, the probability of a given category highway moving from one condition state to another after receiving one of three types of surface treatments is made. The
-3-

three (3) surface treatment types considered by the network system are:
(1) Major Pavement structural Treatment- Improvements (normally overlays) in excess of one (1) inch in depth which improve the structural integrity of the facility. This category also includes activities normally associated with major treatments including leveling courses, patching, and crack filling operations performed in conjunction with the overlay itself.
(2) Minor Pavement Surface Treatment- Activities of a continuous nature such as thin overlays, chip seals, and seal coats. Projects in the category generally do not contribute to the structural capacity of the roadway since the thickness of the treatment is one(l) inch or less; however, they do provide an inproved wearing surface. 1
(3)Routine Pavement Surface Maintenance- Activities of a "spot" nature such as crack filling, patching, and pot hole repair which do not contribute to the overall structural capacity of the roadway. This data is analyzed yearly, and the overall condition state for all the state highways on the system is determined.
Colorado has over 86,330 miles of public roads, of which 9,198 miles are on the State system.
% Miles % YMT
951 miles Interstate (10%) 37% 4,314 miles Primary (47%) 45% 3,405 miles Secondary (37%) 8%
270 miles Urban ( 3%) 9% 258 miles Non-Fed Aid ( 3%) 1%
Approximately 50% and 75% of the current Interstate was built prior to 1965 and 1970 respectively • Many of the highways have reached or exceeded their initial design life and the demands for rehabilitation are increasing. By 1988 the system had declined to 42% in good, 38% in fair, and 20% in poor.
The breakdown of condition criteria as adopted by the Department is as follows:
-4-

System Interstate Primary Secondary Urban Non-Fed-Aid
Good 50% 31% 25% 31% 12%
Fair 45% 52% 49% 52% 37%
Poor 5%
17% 26% 17% 41%
The condition survey (as of June 1990) shows:
INTERSTATE: Flexible PortionRigid Portion-
SYSTEM STATE WIDE: Commission Goal Actual
73% 28%
25% 42%
21% 43%
50% 38%
6% 29%
25% 20%
The most immediate use of the information provided by the network system is in the area of resource allocation. Based on network optimization system recommendations, pavement rehabilitation Funds are allocated to Engineering Districts by improvement type. This resource allocation output is derived from the short-range (one year) program which provided a mile-by-mile listing of recommended treatments for all asphalt pavements in the state . It must be stressed that the recommended treatments are strictly those which are made on the basis of state-wide or region-wide averages and assumptions. While the network model's ability at the resource allocation level is felt to be quite strong, the mile-by-mile treatment recommendations are be used only as a guide. project level decisions are the function of the Project Level Pavement Management System.
In summary Colo's network system provides:
1) allocation of surface rehabilitation and maintenance funds to the Districts
2) suggests short-range programming 3) analyzes alternative system performance scenarios
B. Project Level Pavement Management
Like the various network systems available, there are numerous systems that define Project Level Pavement Management. Colorado's
-5-
PLPMS was developed to provide a comprehensive process for the selection and design for new, reconstructed and rehabilitated pavement structures.
with the selection of a project for design, the PLPMS continues the pavement management process with the major objective of identifying and developing cost effective techniques. Major inputs for the project level system include traffic loading, material characteristics, construction and maintenance variables and cost. Typical output include a set of design strategies that minimize total cost, including construction, maintenance , while satisfying physical and administrative constraints, such as performance requirements and funding.
Design and rehabilitation strategies are in part guided by the 1986 AASHTO "Guide for Design of Pavement structure" and existing design procedures that have proven satisfactory. Pavement design procedures for new and reconstructed pavements have been upgraded to also include recent AASHTO design guidelines.
Design changes include incorporation of the following:
* Reliability Factor- input value for design of both rigid and flexible pavement. This value provides a common method for incorporating a reliability factor into the design based on a change in the design traffic.
*Drainage- provisions have been made to improve guidance in the design of drainage and for modifying the design equations to address drainage design.
* Tied Shoulders- design procedures for the design of rigid pavements with tied shoulders, or widened outside lanes are included.
* Subbase Erosion- a method for adjusting the design to represent the effects of soil erosion under rigid pavements.
* Rehabilitation- portions of the 1986 Guide for rehabilitation have been adopted, and have been incorporated. This procedure includes a design procedure for thin asphalt pavements over rigid pavements.
As noted, many of the highways have reached or exceeded their initial design life, and the demands for rehabilitation are ever
-6-

increasing. Colorado's PLPMS was developed to address what will be major expenditures for rehabilitation and reconstruction. Major rehabilitation activities differ markedly from periodic maintenance in that the primary function of maintenance is to preserve the existing pavement, while rehabilitation is undertaken to significantly increase the functional life of the pavement. In the case of rehabilitation, the most cost effective rehabilitation technique tends to be overlays. Overlays are selected to either:
a) strengthen an existing pavement to support future traffic loading
b) improve surface characteristics of the pavement
A key element in the development of a cost effective rehabilitation strategy is the determination of the cause and extent of the deterioration. Pavement distress is the only symptom of the problem. Quick fix repairs which only correct the existing distress without addressing the mechanism which caused it have a high probability of premature failure and ultimately are not cost effective.
Pavement evaluation requires a systematic approach to adequately quantify and analyze the many variables that influence the selection of the appropriate rehabilitation technique. More engineering effort may be required for pavement rehabilitation than for new construction because of the additional element of evaluating the existing pavement.
The evaluation of rehabilitation alternatives was developed to include the following steps:
Project data collection Field Survey Initial Selection Physical Testing Evaluation with considerations of traffic control, design
life, geometric problems, ROW, utilities vertical clearance problems, funding (1st cost consideration), etc.
Cost Analysis Project Selection
When evaluating rehabilitation design strategies, hard choices
-7-
have to be made; do you go with the lowest initial cost or longest life? Sealcoats offer the lowest initial cost and the lowest life cycle cost. After repeated seal coat projects though, ride quality and public patience both begin to deteriorate.
As a rule, rehabilitation projects are considered on significantly damaged portions of a pavement. This does not mean that only high severity distress merits rehabilitation work. It may be economically justifiable to spend additional funds repairing some lower severity distress at the same time adjacent high severity distress is being corrected. The additional cost must be weighed against the benefit obtained by intercepting distress at an earlier stage in its development. In terms of convenience " it may be beneficial to carry out simultaneous repairs on both high and low severity distresses on a high volume road if major rehabilitation work creates significant traffic handling problems. One of the "yard sticks" to measure each pavement selection against another will be through an economic analysis using life cycle cost comparisons. It is policy to provide a justifying analysis to support the pavement type selection for all appropriate projects, comparing pavement types, and/ or alternative rehabilitation techniques. This comparison will involve a review of the structural adequacy of the alternatives over the design life. The total economic life of the alternatives is the basic vehicle for comparison, used to compare initial designs along with the extended service live gained from future rehabilitations.
Life cycle cost comparisons are very sensitive to the input data being used. The designer has to be aware of the pitfalls of using outdated unit cost, or not identifying all the features that will influence the final cost. Another factor that complicates the process is that pavement selection is often done early in the design process and many times the cost data used to evaluate life cycle cost is outdated by the time the project go to bid.
An additional element that can control pavement selection is the accurate determination of the maintenance cost associated with each pavement type. For this reason the annual maintenance cost information being tracked by the Department Maintenance Management System (MMS) was reviewed and upgraded to reflect current expenditures. The MMS tracks the various maintenance operations which are carried out on a highway, such as the maintenance of the pavement, shoulders, drainage, erosion, vegetation, and structure plus ice and snow control are some of the major
-8-

maintenance activities. For the purpose of a pavement economic analysis, only those categories of maintenance which directly effect the performance of a pavement are considered. These periodic maintenance items are limited to:
* minor resurfacing * patching * filling potholes * sealing cracks and joints * repair of minor failures * undersealing of concrete slabs * any other work intended primarily for the preservation of
the existing roadway
Items of maintenance of a roadway that are common to both rigid and flexible pavements and not a function of the pavement type i.e. blading of the shoulders, snow and ice removal, etc. are not included in the economic analysis. Only those items that are a function of the pavement type are included in order to arrive at an average cost to maintain the various pavement types. variation in cost were found to be considerable. Assuming proper design and construction, factors largely responsible for the variations appear to be attributed to limitations to District budgets, difference in cost of materials, traffic, climate, and quality of maintenance. with the variations in maintenance cost and sometimes efforts on a state wide basis, the annual maintenance co·st determined are considered accurate in order of magnitude only.
The Maintenance Management System is currently being upgraded and cost data is being maintained within each District rather than on a State wide basis. For this reason it is recommended that annual maintenance cost be formulated on a District basis in the future; however, until such time th~ following state wide maintenance cost are suggested:
Asphalt Concrete Pavement Portland Cement Concrete Composite (asphalt on concrete)
$900/ lane mile $300/ lane mile $600/ lane mile
Again, the figures shown are based on State wide averages; however, procedures allow the designer the flexibility to input actual cost figures if available.
Because PLPMS is analogous to value engineering o.f pavement design, changes to design procedures, material specifications,
-9-

and construction techniques will have to be constantly integrated into the system to form a total analysis. Establishing actual performance for both flexible and rigid pavements is an area in which design strategy decisions should be based. the network system has collected data on a yearly basis, but performance curves have not yet been established to determine pavement performance. A data-based system using performance information, construction and maintenance history needs to be developed to supplement the network system. A performance basedsystem will assure that funding allocations are more representative of the condition state of the roadway needing attention.
The primary objectives of the PLPMS are to: a) establish performance based data information to assist in
the decision making process for funding allocations. b) Provide a mechanism for optimum designs by analyzing the
various pavement design possibilities, and applying life cycle costing to make final pavement design selections.
In order to assist the designer, software programs were developed to compute pavement thickness requirements, and to perform life cycle cost analyses. These programs are structured so the designer can easily change various design parameters, and compare numerous combinations to select optimum designs.
-10-

III. PROGRAM DEVELOPMENT AND PROCEDURES
The development of the PLPMS program was carried out in five major phases:
Flexible pavement design Rigid pavement design Rehabilitation, and Life-cycle cost analysis Computer programs for Pavement Design
and Life Cycle cost analysis
Although not directly related to the development of a project level pavement management system, steps had to be taken' to address changes in the current CDOH design procedure. These changes, as developed during the various phases of the study, were implemented after approval was given by the FHWA for each of these phases. In addition to changes to the design manual, computer programs for personal computers were developed subsequent to approval for each of these topics. These programs are based on the 1986 AASHTO guidelines, and those changes that are unique to CDOH. Additional information on these programs will be covered later in , this report.
Flowcharts were developed to assist the designer in the selection process. One chart is applicable to new designs, both flexible as well as rigid, while the second deals with the rehabilitation alternative selection process.
The principal factors considered in choosing pavement type are: soil characteristics, traffic volume and types, climate, life cycle costs, and construction considerations. These factors apply to new designs as well as rehabilitation projects. Other factors can be considered to help in the selection of the best alternative when similar life cycle costs are evident. These secondary factors are: initial construction costs, future maintenance costs, (average costs have been discussed previously) performance of similar pavements in the vicinity, traffic control, conservation of materials and energy (recycling), availability of local materials and contractor capabilities,
-11-

PAVEMENT SELECTION PROCESS
1. 2. S. ". Are there overriding ...... Develop preUrnInary
~ Eoonomlo anaIy". ..... Ev"uate consld .... tlona which .". dealgna for typic" of typic.. aeotlon
..... aecondary dlot.t. pavement type? No aectlon a. one type ctearly No faotora
'1\ superior?
V •• ,..... Iv ..
- No
\11 \I \1
8. 7. •• •• Selaot tin.,
./ la det.lled dealan ./ Parlonn detalled ./ PreUminary
pavement type ...... re.aonebIy oIeae "' p.vement dealgn ...... pavement type
and dealgn to typical dealan MIeotion
UHd in anaIy",?
REHABILIT A TION ALTERNATIVE SELECTION PROCESS
1. I. Conduct p.vemen Develop prelminllrY ev.lu.tlon and altem.te de_1gna determine cauae ..... that Rep.... exlatlng ... of pavement and Prevent fubre
...... deterior.tion .". dl8tr ...
11\
2. Consider primary f.ctora /
Tr.fflo SoIla CRmate Tr.fflc Control No Conatruotion ooneid .... tlon Varlou. con.tr.lnta Cav.. oonat. t) Othera
e. Select final rehabiDtatfon alternate and complete dealana and specific. tiona
Vea
I. a. detalled deaian reuonably 010 .. to typloal dealgn?
-12-
..... ...
". Ufe oyole I a. one oo.t anaIy.18 alternative
I c ...... y of .. temete deaigna I 814»erior?
Yes
7. Perform detailed rehabilitation dealgn
•• .valuate ......
.". alternatee
No ov ... .,1 Important decision faotora
•• Preliminary rebablDtation alternate MIeotIon

experimental features, stimulation of competition and local municipal preference.
It is imperative that the mechanism that caused the pavement deterioration is driving the process of selecting the alternative design. For example, if pumping has significantly contributed to the damage, techniques to repair and prevent (or reduce) recurrence must be included.
A. FLEXIBLE PAVEMENTS
The following concerns were addressed in the development of Colorado's Project Level Pavement Management System:
a. Traffic Analysis One of the major factors that the designer is faced with in the process of designing a pavement section is the traffic which will be placed the roadway. The number used to accomplish this is the l8-kip Equivalent single Axle Loads (ESAL's) which is projected to be placed on the pavement over the design period. This number will typically be provided by the department's Traffic Analysis Section. The designer has the option of using the AASHTO pavement design microcomputer software to compute this ESAL. It should be stressed here that the ESAL's are different for flexible and rigid design, so the designer has to inform the Traffic Analysis Section of the design type.
b. Expected servicea~ility Loss Serviceability of a pavement is the pavement's ability to provide adequate support and a satisfactory ride at any specific time. The Serviceability Index is a number which is indicative of the pavements's ability to serve traffic at any specific time. This number is based on a combination of profilometer readings, and visual inspection. The index ranges from 0 to 5 as follows:
Serviceability Index
0-1 1 - 2 2 - 3 3 - 4 4 - 5
Pavement Condition
Very Poor Poor Fair Good Very Good
The Design Serviceability Loss (~PSI) is determined by
-13-

subtracting the terminal SI at the end of the design period from the initial SI at initial construction. The index at initial construction will normally fall in the range from 4.2 to 4.6, and generally can be assumed to be 4.5. The index at the end of the design period is the worst case allowable condition that the pavement can reach. A terminal PSI of 2.5 is generally accepted for major roads (with a current ADT of 750 or more) and 2.0 for minor roads (with a current ADT of less than 750.)
The design serviceability loss may be affected by components other than traffic; the roadbed soils may influence serviceability loss; problems encountered can include frost heaving or moisture swelling. The recommendations made to remove and replace any subgrade soils that are susceptible to the detrimental effects of frost or swelling. If removal is not practical, .in-place treatment is recommended.
c. Drainage Characteristics ot the Base Course Material Distresses can be related to particular moisture properties of the materials in the pavement. If the existence of these properties is not recognized and corrected where possible, the rehabilitation work will be wasted by allowing the same type of moisture-related distress to occur again. The recognition of the amount, severity, and cause of moisture damage also plays an important role in the selection of the rehabilitation scheme to be utilized on the pavement, and this information will help in the structural evaluation of the pavement.
Moisture-related distresses develop from two major groupings of factors that influence the moisture condition in a pavement.
1. External factors are the climatic factors in an area that govern the supply of moisture to the pavement.
2. Internal factors are those properties of the pavement materials whose interaction with moisture influences pavement performance.
Although drainage was considered in previous design criteria, an adjustment factor did not adequately address the variety of drainage problems encountered. Drainage analyses permit the designer greater flexibility to match a specific design to conditions inherent to a particular region.
In rehabilitation design the recognition of each distress and the mechanism causing that distress are necessary if the correct
-14-

rehabilitation procedures are to be selected. Each distress type that develops within a pavement will be load-or environment related, or a combination of the two. Moisture will accelerate this deterioration when it is environment related. To prevent future deterioration, the moisture problems must be recognized and corrected.
The fact that moisture problems may appear in any layer emphasizes the necessity of having a logical procedure for examining the pavement in order to determine the cause of the problem. Nondestructive testing (NOT) will indicate the overall structural level of the pavement. However, NOT alone cannot identify which component of the pavement is responsible for the strength loss. The distress analysis must be utilized in conjunction with the NDT analysis in order to identify potential moisture related problems. If the subgrade has moisture problems, as determined by the distress survey, it may do no good to overlay the pavement, recycle it, or rework and stabilize the subbase without addressing the subgrade. If the base or subbase have moisture problems, it will be wasteful to rehabilitate, restore, or overlay without solving moisture problems through reworking or stabilizing the base and/or consideration of the granular layer.
The treatment for the expected level of drainage for a flexible pavement is through the use of modified layer coefficients (e.g. a higher effective layer coefficient would be used for improved drainage conditions.) The factor for modifying the layer coefficient is referred to as an mi value and has been integrated into the structural number (SN) equation along with layer strength coefficient (ai) and thickness (Oi) as follows:
The use of the drainage coefficients requires an analysis of the effects of poor drainage on the pavement section and not to increase the pavement thickness to compensate for the poor drainage. For the reason stated, it is important to address drainage conditions in both new and reconstruction design.
d. Evaluation of subqrade The 1986 AASHTO Guide has adopted the resilient modulus (MR) for pavement design. The COOH currently uses stabilometer R-values for the design of pavement structures.
-15-

Research within the Department is being done to determine as correlation between R-values and reslilient moduli employing the method of modulus back-calculation using a falling weight deflectometer (FWD). until a correlation factor has been established the assessment of the subgrade in terms of MR is accomplished by the AA5HTO soil strength-correlation equation
[(51 + 18.72)/6.24]
where the soil support value 51 = [('R' - 5)/11.29] + 3
e. Reliability A reliability (risk) factor was incorporated into the design procedure. This component gives the designer the option of incorporating a risk reduction factor into the design process. The reliability factor is based on the functional classification of the roadway, and whether it is in an urban or rural location. Ranges of factors are presented in the following table and can be selected by the designer ad deemed appropriate for the situation.
Functional Classification Interstate Freeway Principal Arterials Minor Arterials Collectors Local
RELIABILITY (Risk)
Urban 85-95 80-95 70-95 50-90 50-80
Rural 80-95 70-95 60-90 50-85 50~75
The reliability factor provided by the 1986 AASHTO Guide had a range from 50% to 99.9%. After performing a sensitivity analysis the range was reduced to 50% to 95%. (It was felt that reliability factors over 95% were not cost effective.)
For comparison purposes, previous flexible pavement design procedures have essentially contained an inherent 50% reliability factor.
f. Overall deviation The Overall Deviation adjusts for the statistical variations of data used in the calculations. A value of 0.44 was selected to be used in Colorado's flexible pavement designs.
-16-

B. RIGID PAVEMENTS Rigid pavement design criteria were developed during the second phase of the project, and the following items were included in the design procedure:
a. Desiqn traffic As described in the flexible design section, this traffic related variable is computed by the Departments's traffic analysis section. These 18 kip ESAL's reflect their applications specifically for rigid pavement sections, hence the designer must request the traffic information with this in mind.
b. Modulus of subqrade Reaction This variable can be obtained by the designer using a chart of k-values versus Soil Classifications as determined by normal laboratory methods.
c. Modulus of Rupture The modulus of rupture (flexural strength) of portland cement concrete to be used in ~he design is established at 650 p.s.i.
d. Drainaqe coefficient The treatment for the expected level of drainage for a rigid pavement is through the use of a drainage coefficient, Cd. Because drainage conditions influence slab support and therefore the overall stress condition in the slab, Cd is incorporated in the design equation for pavement depth. Cd has the same relative impact on rigid pavement performance as both the modulus of rupture (Sc) and the load transfer coefficient (J). A 20-percent increase in Cd will have the same effect as a 20-percent increase in Sc or, since J is in the denominator, a 20-percent increase in l/J. For comparison, the value for Cd for the conditions at the AASHO road test was 1.
The drainage coefficient value, Cd, depends on the quality of drainage and 'the percent of time during the year the pavement structure would normally be exposed to moisture levels approaching saturation. To obtain adequate pavement drainage the designer should consider various types of drainage systems such as: (1) surface drainage, (2) groundwater drainage, and (3) structural drainage. Removal of free water can be accomplished by draining the free water vertically into the subgrade, or laterally through a drainage layer into a pipe collector, or edge drain. Such systems are only effective for free water: water held by capillary forces in soils and in fine aggregates cannot be
-17-
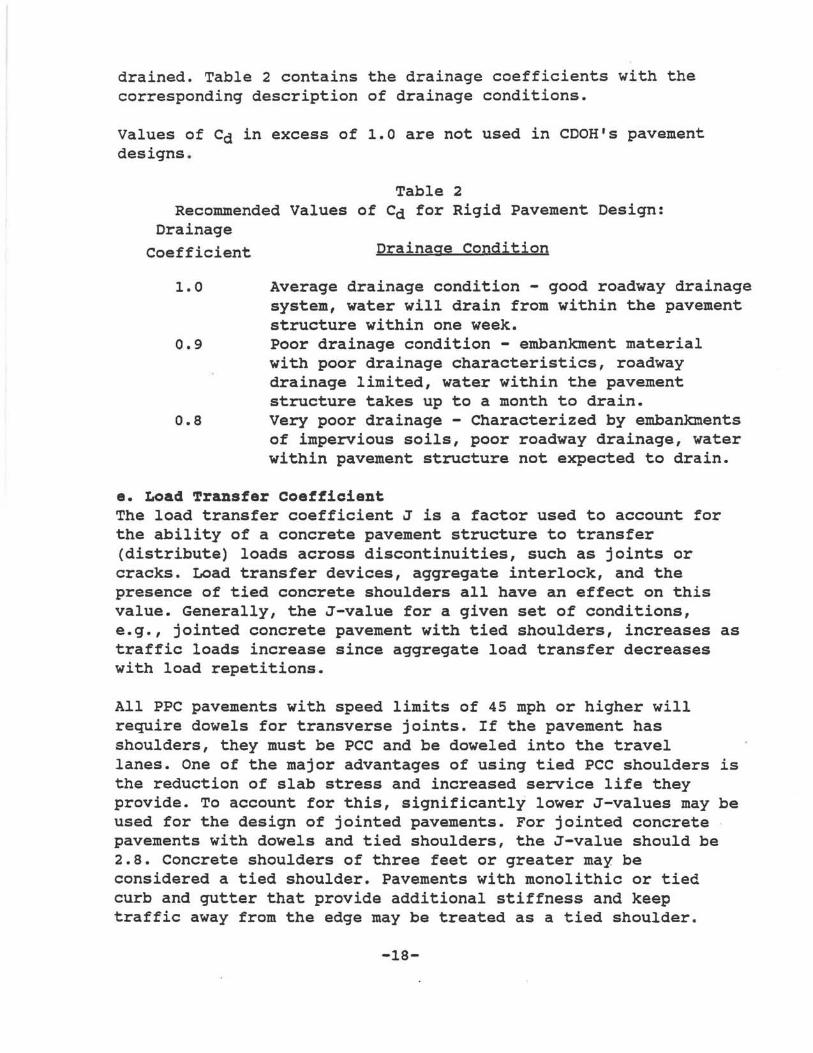
drained. Table 2 contains the drainage coefficients with the corresponding description of drainage conditions.
Values of Cd in excess of 1.0 are not used in CDOH's pavement designs.
Table 2 Recommended Values of Cd for Rigid Pavement Design:
Drainage Coefficient Drainage Condition
1.0 Average drainage condition - good roadway drainage system, water will drain from within the pavement structure within one week.
0.9 Poor drainage condition - embankment material with poor drainage characteristics, roadway drainage limited, water within the pavement structure takes up to a month to drain.
O.S Very poor drainage - Characterized by embankments of impervious soils, poor roadway drainage, water within pavement structure not expected to drain.
e. Load Transfer Coefficient The load transfer coefficient J is a factor used to account for the ability of a concrete pavement structure to transfer (distribute) loads across discontinuities, such as joints or cracks. Load transfer devices, aggregate interlock, and the presence of tied concrete shoulders all have an effect on this value. Generally, the J-value for a given set of conditions, e.g., jointed concrete pavement with tied shoulders, increases as traffic loads increase since aggregate load transfer decreases with load repetitions.
All PPC pavements with speed limits of 45 mph or higher will require dowels for transverse joints. If the pavement has shoulders, they must be PCC and be doweled into the travel lanes. One of the major advantages of using tied PCC shoulders is the reduction of slab stress and increased service life they provide. To account for this, significantly lower J-values may be used for the design of jointed pavements. For jointed concrete pavements with dowels and tied shoulders, the J-value should be 2.S. Concrete shoulders of three feet or greater may be considered a tied shoulder. Pavements with monolithic or tied curb and gutter that provide additional stiffness and keep traffic away from the edge may be treated as a tied shoulder.
-lS-

Load transfer coefficient values for different conditions were established as shown
Doweled Non-doweled
f. Loss of support
Tied Shoulder
2.8 3.6
Non-Tied Shoulder
3.6 4.2
This factor is included in the design of rigid pavements to account for the potential loss of support arising from subbase erosion and/or differential vertical soil movements. It is treated in the design procedure by diminishing the effective or composite k-value based on the size of void that may develop beneath the slab. Table 604.2F provides ranges of LS depending on the type of material (specifically its stiffness or elastic modulus.) The value for LS to be used will be 1.0 unless other conditions in the design analysis prevail.
Table 604.2F
Type of Material Loss of Support CLS) Cement treated granular base (E=l,OOO,OOO to 2,000,000 psi)
Cement aggregate mixture (E=500,000 to 1,000,000 psi)
Asphalt treated base (E-350,000 to 1,000,000 psi)
Bituminous stabilized mixtures (E=20,000 to 70,000 psi)
Lime stabilized (E=15,000 to 45,000 psi)
Fine grained or natural subgrade materials * (E=3,000 to 40,000 psi)
0.0 to 1. 0
0.0 to 1.0
0.0 to 1.0
0.0 to 1.0
1.0 to 3.0
2.0 to 3.0
Note: E in this table refers to the general symbol for elastic or resilient modulus of the material.
-19-

* If the Plastic Index (PI) of the subgrade soil is more than 15 or the "R" value of the subgrade is less than 10, the subgrade soil must be lime treated to a minimum depth of 8 inches.
q. Expected Serviceability Loss This factor is described in the flexible pavement design section above with values from 2.0 to 2.5 depending on the highway classification.
h. Reliability As with the flexible pavement design, this factor gives the designer the option of incorporating a risk reduction factor into the pavement design process. The reliability factor is based on the functional classification of the roadway and whether it is in an urban or rural location.
i. Modulus of Elasticity While the exact modulus (Ec) can be obtained from ASTM test method C469, an approximate value of 3,400,000 psi can be used. This value is within the reasonable range of 2 to 6 million psi, depending largely on the strength of the concrete.
j. OVerall Deviation The standard value for deviations of rigid pavements was selected as 0.34 to compensate for variations in the data used in the specific design.
c. PAVEMENT REHABILITATION Major pavement rehabilitation significantly increases the functional life of the roadway as compared to periodic maintenance, which deals primarily with the preservation of existing pavements. Overlays are selected to either strengthen "the pavement structure in order to support future traffic loading, or to improve surface characteristics of the pavement.
The key element of a cost-effective rehabilitation strategy is the determination of the cause and extent of pavement damages. Quick-fix repairs without considerations of the underlying problems have a high probability of premature failure. Engineering judgement and experience play an important role in selecting a rehabilitation strategy, however, this needs to be expanded. A systematic approach to analyze and quantify the factors that influence the various rehabilitation techniques must be considered.
-20-

The following steps were developed to provide a systematic evaluation of rehabilitation alternatives:
a. Project data Items to be considered consist of "As Built" plans, pavement design data, materials and soil properties, actual traffic (ESAL's), environmental conditions, and other data pertinent to major maintenance.
b. Field Survey A pavement evaluation should be conducted to determine the most likely cause of deterioration. A checklist was developed for flexible as well as rigid pavement assessment. (Appendix A)
c. Distress Analysis A determination of the causes of pavement distress is necessary to determine the appropriate rehabilitation strategy. In addition to surface distress, PMS information regarding roughness, deflection, and skid resistance should also be considered.
d. Initial Selection Develop preliminary alternate designs that address existing distresses and prevent future problems.
e. Physical Testing Additional information is obtained·through coring, deflection testing, determination of resilient modulus, permeability, moisture content, etc.
f. Evaluation and Selection of the Main Rehabilitation Technique This involves identification of various projects constraints, such as Traffic control, Design Life, Geometric Problems, Right-of-Way, utilities, etc.
g. cost Analysis A comparison of life cycle costs for the alternate designs based on initial costs, maintenance costs, and future rehabilitation costs serve as guidelines in the selection process.
h. Project Selection The final decision of a preferred rehabilitation strategy depends not only on the life cycle costs, but other constraints such as unusual traffic delay problems, and time of
-21-

construction and other factors that would adversely' impact the project.
1. Rehabilitation of Asphalt Pavements
When selecting an appropriate rehabilitation design, the most cost effective rehabilitation technique tends to be overlays. Asphaltic overlays are used to correct both surface and structural deficiencies. The type and thickness of the required overlay is based on an evaluation of present pavement conditions and estimates of future traffic.
When a pavement surface evaluation indicates adequate structural strength, but the condition of the surface needs correction, a thin overlay ( 2") may be used. Surface conditions which may require correction include excessive permeability, surface raveling, surface roughness, rutting, and low skid resistance.
When a pavement surface evaluation indicates possible structural deficiencies, a more detailed analysis should be undertaken~ If the pavement shows deep rutting or distortion or is badly cracked, total reconstruction may be warranted. Reflective cracking potential should be considered in making a determination whether to reconstruct or overlay. Thick overlays ( 2") are used to correct base or subgrade deficiencies or to correct thickness (S.N.) deficiencies. For a complete reconstruction, a soil profile should be taken and drainage assessment made in order to design a new pavement structure.
When structural deficiencies exist which may be corrected by overlay, the thickness of the overlay should be sufficient to accommodate predicted traffic for the selected design period. The following strategies will not be allowed:
o The use of thick asphaltic overlays which do not satisfy the structural requirements of the pavement structure.
o The use of thin overlays over severely cracked or rutted pavements for which remedial measures were not taken to prevent or retard the reoccurrence of the cracking or rutting.
-22-

The designer should use a single or combination of several corrective techniques which will provide the best overall solution to extend the pavement life. other strategies used may be one or a combination of the following:
o Remove and replace a portion of the existing pavement (example: remove by milling the wheel rutting in the driving lane). The removed material may be recycled.
o Rejuvenation of the existing pavement prior to overlay (example: heater-scarify or cold recycle of the existing pavement to remove irregularities and to rejuvenate an oxidized pavement.
o other techniques including full depth patching, base removal and replacement, use of fabric, etc., should all be analyzed.
Normally an eight to ten year design period will be used for overlay designs. Thickness will be determined by either Pavement Deflection Analysis or Component Analysis. The design procedure differs for flexible overlays over rigid pavements and flexible overlays over flexible on rigid (composite) pavements. The design equation governing the former is as follows:
while the latter design uses the following equation:
where SNOL = structural Number of the overlay SNy = structural Number for new flexible pavement over the
existing subgrade FRL = Remaining Life factor (1.0 for all overlays) aO and ac = strength coefficients of existing PCC DO and Dc = Thickness of existing pec
and the expression SNxeff-rp = a2D2m2 for flexible over rigid and SNxeff-rp = a1D1 + a3D3m3 for flexible ·over composite
-23-

where a2' D2, and m2 are strength coefficient, thickness, and drainage coefficient of the base course material.
a1 and D1 are strength coefficient and thickness of the existing flexible overlay.
a3' D3, and m3 are strength coefficient, thickness, and drainage coefficient of the base course material.
The major differences in these equations are the terms inside the parentheses. The first term refers to the strength coefficient and thickness of the existing pavement. strength coefficients were developed for both flexible on rigid, as well as flexible on composite pavements. A table governing the respective coefficients was developed and is based on a combination of load-associated cracking, average age of layer combinations, estimated air voids. (Appendix B)
overlay Desiqn by Pavement Deflection ADalysis
a. Deflections will be determined with either the dynaflect or falling weight deflectometer. The distance between deflection readings will be no more than 0.1 mile.
On two-lane roadways, deflection readings will be taken in the outer wheel path; the odd test site readings will be taken in one direction and the even test site readings will be taken in the opposite direction. On multi-lane roadways, normally the deflection readings will be taken 0.1 mile apart in the outer lane of each direction. Other testing patterns may be requested by the districts for special reasons.
When test sections are less than one mile in length, a minimum of ten tests will be taken.
b. When deflection testing is completed, the deflection data will be processed to correct the readings for pavement temperature and thickness.
c. The corrected deflection data will be divided into sections depending on the roadway condition. The length of sections should be grouped such as the deflections are similar in value.
-24-

The mean and standard deviation will be calculated for each section. Add the mean plus two standard deviations to obtain the representative deflection. If one or more deflections fall outside the limits of t~e mean plus or minus two standard deviations, delete them as outlier and recalculate the mean and standard deviation. Outlier should be removed from the calculations only once. Test locations having adjusted deflections greater than the mean of adjusted measured rebound deflections plus two standard deviations should be considered for special treatment.
Additional deflection measurements may be required to determine the extent of such weak areas. These locations may require patching or local increases in thickness to provide uniform support for the entire length of the section. Deflection measurements representing special treatment locations are omitted from calculations to obtain representative deflections.
During the pavement analysis portion of the thickness design, the designer should compare the information obtained from the deflection data vs. that noted in the distress survey. Deflection readings do not always address the total scope of corrective action needed, especially in areas with substantial distress conditions present. It is recommended that the designer use a profile plot ·of distress an deflection to itentify areas requiring additional consideration. In areas of high distress it may be desirable to verify the Deflection Analysis with an Component Analysis.
Overlay Design hy Component Analysis
a. Subgrade Analysis - The MR value of the top two feet of the subgrade can be obtained from the soil survey of the completed roadbed. Some field verification of the soil survey information should be performed to verify the profile data. In the areas where this information is not available, it will be necessary to obtain samples of the major soil types for MR value determination.
b. Aggregate Base Course Analysis - The thickness and strength coefficient of the base and subbase can be determined from plans or the soil survey of the completed roadbed; however, this information should be verified by field samples. When this information is not available, samples will be taken to determine the thickness "R" value and strength coefficients Samples will be taken at the locations the soil samples are taken. A minimum of
-25-

one sample per mile will be obtained.
c. Asphalt Layer Analysis - The thickness of the asphalt layers can be determined from plans or the soil survey of the completed roadbed; however, this information should be verified by field samples. If this information is not available, the thickness will be checked in the field at the time the soil and aggregate base course are sampled. Pavement type, age, and condition must be evaluated in order to determine the strength coefficient of the existing pavement.
overlay Design by Surface Condition Survey
If the pavement surface exhibits distress but the deflection analysis does not indicate that an overlay is needed, the following guide Table 605.5 can be used to determine the overlay thickness.
TABLE 605.5 - SURFACE CONDITION
DISTRESS TYPE
Wheel Rutting
Block Cracking Block Size: > 2 sq. ft.
< 2 sq. ft.
Bleeding or Slickness
ALLOWABLE THICKNESS
Fill ruts with leveling course or remove by milling, then overlay using 3/4" to 1 1/2" thickness.
3/4" to 1 1/2" 1" to 2"
3/4" to 1 1/4" .
2. Rehabilitation of Portland Cement Pavements
Rehabilitation of concrete pavements is as much an art as a science and there are no definitive equations, guides, or step-by-
-26-

step procedures that one can use to "cookbook" a proper rehabilitation design. Therefore, a considerable amount of both analysis and engineering judgement must be applied to each design. Despite incomplete knowledge, the designer must make rehabilitation decisions based on the adequate information available. A detailed concrete pavement condition survey is required before a rehabilitation project can be evaluated and designed. The types of distress in concrete pavements have to be identified and documented prior to the selection of corrective measures. The cause of distress(es) are not always easily identified and may consist of a combination of problems. The following types of distress are common to deteriorating concrete pavements: excessive deflection, differential deflection at joints, moisture related distress at cracks and joints, cracking due to reactive aggregate, longitudinal and transverse cracking, spalling, faulting, pumping, rutting, and movement of slabs due to swelling soils. The condition survey should identify and document the types, location, and amount of distress encountered in the design selected for rehabilitation. (Photographs are a good way to document many of the distresses m~ntioned above.)
a. Plexible Overlay
Flexible overlays over existing rigid pavement is a significant and often used rehabilitation overlay strategy. It also represents the category in which state of the art concerning overlay requirements is least known. since the existing PCC pavement is usually cracked when an asphalt overlay is considered, the pavement structure is neither "rigid" nor "flexible" but in a "semi-rigid" condition. Even after the overlay is placed, cracking of the PCC layer may increase, causing the "rigidity" of the overall pavement to approach a more "flexible" condition with time and traffic.
Thin asphalt overlays are used primarily to correct surface distress such as rutting, reactive aggregate, etc. These overlays can range in thickness from 3/4" to a 3" overlay. In some cases, a leveling course may be required. Thin asphalt overlays are not to be placed over severely cracked, step faulted, shattered or broken pavements. An advantage of thin overlays is that the clearance and roadside improvements associated with thick overlays are usually not necessary.
Thicker asphalt overlays are used to provide additional structural
-27-

capacity for the existing pavement. since the principal causes of cracking in an overlay are thermal contractions and expansions, and vertical differential deflections of the underlying slabs, some effort must be made to mitigate these stresses. Differential deflections at cracks or joints are considered to be more critical due to the quicker loading rate. The designer must consider the reflective cracking potential of the asphalt overlay over the existing rigid pavement. At present there are several techniques which minimize/eliminate reflective cracking distress. They are:
(1) Use of Thick AC OVerlays (2) Crack and seat Approach (3) Saw cutting Matching Transverse Joints in Overlay (4) Use of Crack Relief Layers (5) Stress-Absorbing Membrane Interlayers w/Overlay (6) Fabric/Membrane Interlayers w/Overlay
Additional design and cost considerations such as vertical clearance at structures, drainage modifications, and the need to increase the height of railings and barriers need to be considered when evaluating thick asphalt overlays.
b. Rigid Overlays
Two types of rigid overlays are considered: Unbonded concrete overlays, and thin bonded overlays.
Unbonded concrete overlays (minimum 6" thickness for traffic less than 5,000,000 18k ESALi minimum 8" thickness for traffic greater than 5,000,000 18k ESAL) provides additional structural capacity to the roadway. A bond breaker is placed between the old pavement and the new overlay to prevent reflective cracking. Reflective cracking can be minimized by placing a bond breaker under the new overlay. Rocking, pumping, or faulted slabs should be stabilized prior to overlay. vertical height considerations must be addressed because of the considerable pavement thicknesses involved. If existing asphalt shoulders are to be replaced, they should be replaced with portland cement concrete and tied to the driving lanes.
Thin bonded concrete overlays with m~n~mum thicknesses of 2 inches must be bonded to the existing PCC pavement. the existing surface must be cleaned properly to ensure good
-28-

bonding. A grout made from sand and cement or neat cement should be placed immediately before the paver without allowing the grout to dry. Since reflective cracking is eminent, all joints in the new overlay must match the joints in the existing PCC. For the same reason this type of overlay should be restricted to relatively little cracked pavements that require minimal surface corrections.
c. Rehabilitation without overlay
PCC pavements which are rutted and/or faulted with little or no additional distresses can be corrected by grinding with diamond saws. In the case of rutting, the surface i~ retextured and transverse drainage is restored. Thus, the problem of the r~ts filling with water and resulting hydroplaning are eliminated. The joints should then be resawn to the proper shape factor (depth to width ratio) and resealed. If grinding is excessive, the thickness of the pavement may need to be increased to handle existing or future traffic loads. With faulted pavements the entire surface can be ground or the height of the fault can be feathered back into the slab. After grinding, the joints should be restored using the same technique as for rutting.
In addition to grinding techniques, replacement of complete slabs may be called for if the existing distress is extensive with spalling and cracking. The limits of slab replacement are one lane width, extending between sawn joints. Slab replacements may also be considered in conjunction with overlays.
D. LIFE-CYCLE COST ANALYSIS
Economic cost comparisons are used in the selection process. A justifying analysis to support the pavement type selection will be prepared for all appropriate projects comparing concrete to asphalt pavements, and/or comparing alternative rehabilitation techniques.
The comparison of pavement types or rehabilitation techniques will involve a review of the structural adequacy of the alternatives over the design life. The total economic life of the alternative is the basic vehicle for comparison, used to compare initial designs along with the extended service lives gained from future
-29-
rehabilitation.
The analysis period to be used is the period of time selected for making an economic analysis of pavement costs. All alternatives being considered should be evaluated over this same period. If the maximum life of an alternative is 20 years, another rehabilitation project would have to be applied at the 20th year, and into the future, until the analysis period is covered. Planned rehabilitation is used in the pavement analysis to make engineering comparisons of candidate strategies and is not used for future funding eligibility determinations.
Base data to be used consist of the following:
a. For New Construction and Reconstruction Analysis period - 30 years Design life - 20 years
Rejuvenating periods Concrete pavements - 3 inch asphaltic overlay after 20 years Asphalt pavements - 2 inch overlay after 10 years and
2 inch overlay after 20 years
b. For Restoration, Rehabilitation, and Resurfacing Analysis Period - 30 years Design life - 8, 10, or 20 years
Examples where an economic analysis may not be needed:
1. When the concrete pavement is structurally sound, and requires only re-sealing and/or minor rehabilitation work.
2. Concrete or asphalt pavement is structurally sound, but needs surface treatment to restore skid resistance or ride properties.
3. When work involves minor safety improvements, such as channelization, shoulder work, etc.
4. When projects are less than one mile long.
c. Maintenance costs should be based on the best available information. CUrrently, the CDOH Maintenance System is compiling data on state Highway maintenance costs. The designer should exercise good judgement in the application of maintenance costs. Inappropriate selection can adversely influence the selection of alternatives to be constructed.
-30-

d. Salvage value of the pavement will not be taken into account in the analysis, since the salvage values are considered to be equivalent at the 30 year point.
e. The present worth or annual cost method of economic analysis will be used. All future costs are adjusted according to a discount rate of 4% to a present worth. Costs incurred at any time into the future can be combined with initial construction costs to give a total cost over the life cycle. An inflation factor is not to be considered.
computing the initial cost of a design alternative involves not only the material quantity calculations, but the other direct cost associated with the pavement alternative being considered. Difference in grading quantities required by different pavement alternatives should be considered where appropriate. For example, the comparison of a thick overlay alternative with a recycling or removal and replacement alternative should include the required shoulder quantity for the overlay. If traffic control costs vary from one alternative to another, this cost should be estimated and included as an initial cost. The different construction techniques, curing time, and duration of lane closures associated with concrete or bituminous pavements have a significant impact on the traffic control methods.
For example, a bituminous pavement overlay could involve the closure of one lane of traffic at a time, with related signing and traffic control items: a concrete pavement overlay might necessitate complete roadway closure and detour construction.
Any item that impacts the initial cost should be analyzed, and a determination made as to whether it should be included in the cost analysis. Such items would include shoulder construction, major utility considerations, temporary access or traffic crossovers, etc.
E. COMPUTER PROGRAMS
The development of computer programs to facilitate implementation of the goals of the PLPMS was initiated subsequent to the completion of each study phase. The programs were written in Basic and compiled with Micro-soft's Quickbasic compiler. The required system configuration is described in the user's guides found in the appendix section of this report. The main program, dealing with pavement design and rehabilitation, was originally
-31-

prepared by the Ohio Ready Mixed concrete Association (ORMCA). The program contained three major areas: rigid pavement design, flexible pavement design, and the computation of equivalent single axle loadings. In addition to modifications of the two pavement designs, a new program was developed to include the rehabilitation design. A program guide for these four programs can be found in Appendix C. The last program to be developed was the Life Cycle Analysis program. The program guide for this software is in Appendix D.
1. Plexible pavement desiqn proqram
The program development for this segment consisted of incorporation of Colorado's design parameters, either in individual values, as in the case of the standard deviation, or in user accessible tables that are contained in CDOH's design guide. The program is based on the 1986 AASHTO guidelines. Additional program code was written to allow the designer to use R-values in place of soil resilient moduli. This was deemed important since the CDOH has much experience with R-values. The program converts these R-values to equivalent resilient moduli numbers. The menu-driven program allows the user to input or change any of the parameters. A program routine was written to let the user "build" the pavement layer by layer until the structural number, which was computed earlier, is equal to the number obtained by the summation of the individual layer structural number. The designer has the option to make changes in the main program, and then compute new layer modifications with respect to material (as expressed in the layer strength coefficient), drainage coefficient, or layer thickness that will satisfy the new overall structural number.
2. Rigid pavement desiqn proqram
Similar to the flexible design program, this program was developed with CDOH's criteria and design values. Iri addition to the standard deviation of 0.34 the value for concrete's Modulus of Elasticity was fixed at 3,400,000 p.s.i., and the modulus of Rupture at 650 p.s.i. to reflect the Departments current design criteria. Changes to these default values are only possible in the source code in order to obtain consistent designs throughout the state. Help screens are available to
-32-
the designer for the reliability factors, load transfer coefficients, modulus of subgrade reaction, drainage coefficients, and PSI loss. Values that are beyond the allowable ranges, as listed in the corresponding design guide tables, are "locked out", so that the designer cannot use values that might adversely affect the design. The modulus of subgrade reaction can be entered directly at the prompt of the main data input' screen, from the table in the help screen, or by entering a corresponding R-value. After computing the required pavement thickness, the user can make changes to any of the data entries, or if needed he can access the rehabilitation program.
3. Pavement rehabilitation desiqn program
This portion of the program is "chained" to the main program. Although it appears to be a stand-alone program, it needs values from the main program or it will not run. Specifically the program addresses flexible rehabilitation over rigid or composite pavements. This program is accessible from the main program after a structural number for a "new" pavement is computed. The rehabilitation computation for flexible overlays over rigid pavement takes into account the condition and thickness of the rigid pavement, strength coefficient and thickness of the base, and the drainage coefficient. Tables with values for existing pavement strength coefficients, drainage coefficients are available to the user via help screens, while base strength coefficients can be input as direct values or R-values. OVerlay requirements of flexible overlays over composite pavements are computed in a similar fashion, except for strength coefficients and thicknesses for the existing flexible pavement have to be provided. The tables of values needed to obtain the strength coefficient are more complex than for the rigid pavement scenario. In addition to load-associat'ed surface cracking of the existing pavement, the program also needs the information regarding age of pavement, and estimated air voids. The tables contain corresponding factors, which when summed together result in the strength coefficient for the existing flexible pavement layer. The final result of the computation is the thickness of the required overlay. Transportation between the main design program and the rehabilitation program is facilitated so the designer can make changes in the main program, which will be carried forward to the rehab program, resulting in a new
-33-
overlay thickness requirement.
4. Life cycle analysis proqram
This program was developed to assist the designer in the selection of alternate paving strategies on the basis of an economic analysis. The computed parameters on which the user can base his decision consist of: initial cost, present worth and annual cost.
Data input consists of information regarding the project identification, unit prices, maintenance costs, and section geometrics. The program structure is designed to take advantage of previous information as applicable to a specific project, so that the designer can retrieve this information from· an existing file.
• Although default values have been built into the pr9gram for the analysis period (30 years), desiqn life (20 years), and maintenance costs for flexible, rigid and composite pavements, the user can (and is encouraqed) to change these values if better information on these values is available. The designer 'can "build" several alternate pavement sections, and develop a summary table of initial costs, present worth, and annual costs. Based on theses values, he can make a decision which alternate would be the most economical choice.
All the programs described here are currently in a developmental phase (Beta testing). Updates to the programs will be made periodically to incorporate potential changes in the design criteria. To avoid "contamination" of the original programs, the users will only receive a compiled version of the programs. This will ensure consistency of results throughout the different Engineering districts.
-34-

v. IMPLEMENTATION
The Develop~ent of the PLPMS ws planned in several phases. After the completion of the flexible, rigid pavement, and rehabilitation sections of the project level pavement management study, each segment was implemented. It was decided. that in order for the project level pavement manager to be an effective management tool, it would be a function of Staff Design, working closely with staff Materials. This arranqement allows for a balance between the two sections, thus promoting the concept of optimizing the design and material aspect of pavement design.
Because the design process within the Department is decentralized, the implementation process included a policy directive requiring all pavement designs to be submitted to the pavement manager for review. To assure compliance with design procedures during construction, project extensions, etc., be reviewed and approved by the pavement manager. with the implementation of the PLPMS the Department moved in the direction of providing the designer with the tools needed to develop projects optimizing strategies for design~ng and rehabilita~ing pavements. The network system represents "should" rehabilitation scenarios. This system ws developed with the philosophy of preventative maintenance, i.e. it is more effective and beneficial to treat problems before they become more severe.
Project level deals with "must" rehabilitation conditions. Project level design looks at an array of rehabilitation alternatives for each individual project taking into account information provided by detailed pavement condition surveys. It computes the total costs using life cycle cost for the possible combinations of the various alternates for a given pavement condition.
It is generally accepted that the cost of rehabilitation increases as the pavement condition deteriorates. If rehabilitation projects are· programmed at the earliest signs of ~atigue, the system can be maintained with relatively thin overlays as our network optimization system is based. with funding limitations and lack of detailed pavement performance data, recommended changes are often compromised.
The Department is currently reviewing techniques that will better define project level needs. These includes upgrading current network information with detailed visual distress surveys and
-35-

deflection testing (FWD) on a milepost to milepost basis. Rutting information along with the degree and severity of fatigue damage can be used to establish pavement performance curves. Detailed pavement performance data can be used to develop final statewide programs for construction and rehabilitation by identifying project priorities and relative budget requirements as the pavement continues to deteriorate if action is deferred. In addition to upgrading pavement performance data, the Department is also in the process of reinforcing other factors . that influence both pavement selection and performance. In particular, the need for a comprehensive maintenance crack and joint resealing program has been identified. Pavement performance and pavement selection is greatly influenced by good maintenance practices. Pavement performance models without a high degree of pavement maintenance can do little to either the expected life of a pavement or ultimately, the cost for rehabilitation~
The implementation of the PLPMS also requires the reporting of various design parameters, to establish a database for the purpose of tracking design criteria and performance of different designs. Project managers are to submit this information to the Pavement Engineer on forms as shown in Appendix E.
-36-

APPENDIX A
Pavement Evaluation Checklist

PAVEMENT EVALUATION CHECKLIST FLEXIBLE
LOCATION PROJECT NO. DIRECTION ___________ M.P. ___ TO M.P.
TRAFFIC -Existing ____________ _
-Design
EXISTING PAVEMENT DATA
-Subgrade (AASHTO)
-Bose (type/thickness)
- Pavement Thickness
-Soil Strength (R/MR)
-Roadway Drainage Condition
(good. fair. poor)
- Shoulder Condition
(good. fair, poor)
DISTRESS EVALUATION SURVEY
Type Severity
Alligator Crocking
Bleeding
Block Cracking
Corrugation
Depression
Joint Reflection Cracking
(from PCC Slab)
Lane/Shoulder Joint
Separation
Longitudinal Cracking
Transverse Cracking
Patch Deterioration
Polished Aggregate
Potholes
Raveling/Weathering
Rutting
Slippage Cracking
OTHER
FIGURE 605-1
-
18K ESAL/YR
18K ESAL
Approx. ~

PAVEMENT EVALUATION CHECKUST RIGID
PROJECT NO. DiRECTION
TRAFFIC
LOCATION M.P. TO M.P.
-Existing ____________ _ 18K ESAL/yR ____________ 18K ESAL -Design
EXISTING PAVEMENT DATA
-Subgrade (AASHTO)
-Base (type/thickness)
-Pavement Thickness
-Soil Strength (R/MR)
-Swelling Soil (Yes/No)
-Roadway Drainage Condition
(good. fair. poor)
-Shoulder Condition
(good. fair. poor)
-Joint Sealant Condition
(good. fair. poor)
-Joint Condition
(good. fair. poor)
-Lane Shoulder Separation
(good, foir, poor)
DISTRESS EVALUATION SURVEY
Type Severity
Blowup
Corner Break
Depression
Faulting
Longitudinal Cracking
Pumping
Reactive Aggregate
Rutting
Spoiling
Transverse & Diagonal Cracks
OTHER
FIGURE 605-2
Approx. ~

APPENDIX B
Pavement Condition Factors

PAVEMENT CONDITION ao
1. PCC pavement that is mostly uncracked and stable, exhibiting no evidence of pumping.
2. PCC pavement that is stable, but with some initial cracking or low severity level of alkaline reactivity and no evidence of pumping.
3. PCC pavement that is appreciably cracked or faulted with signs of progressive crack deterioration. Alkaline reactivity may be high, pumping may be present. Slab fragments range in size from 1 to 4 sq. yds. in size.
4. PCC pavement that is very badly cracked or shattered into fragments 2-3 ft. in maximum size with obvious loss of support from the base or subgrade.
FACTOR
0.50
0.40
0.30
0.20

PAVEMENT CONDITION ac
1. PCC pavement that is mostly uncracked and stable, exhibiting no evidence of pumping. The HBP overlay exhibits hairline cracks at the locations of the PCCP joints, with virtually no other cracks or signs of deterioration that may be attributed to the distress in the PCCP.
2. PCC pavement that is stable, but with some initial cracking, or low severity level of alkaline reactivity and no evidence of pumping. The HBP overlay exhibits relatively tight cracks, without spalling, at the location of the PCCP joints. Some initial cracking between the PCCP joints starting to develop, but is relatively tight.
3. PCC pavement that is appreciably cracked or faulted with signs of progressive' crack deterioration. Alkaline reactivity may be high, pumping may be present. Slab fragments may range in size from 1 to 4 sq. yds. in size. The HBP overlay exhibits medium severity joint reflection cracking and medium severity (greater than 3/8") longitudinal and transverse cracking. Low to medium severity block or random cracking beginning to develop. Subbase or subgrade material may be evident, indicating pumping.
4 . PCC pavement that is very badly cracked or shattered into fragments 2-3 ft. in maximum size with obvious loss of support from the base or subgrade. The HBP overlay will show signs of high severity joint reflection cracking (any crack surrounded by medium or high severity random cracking; or a crack of any width where a few inches of pavement around a crack is severely broken, or the crack is severely broken). Medium to high severity random or alligator cracking beginning to develop.
FACTOR
0.5
0.40
0.30
0.20

APPEliIDn: c
User's Manual for Pavement Design Program
CDOH PAVEMENT STRUCTURES DESIGN
COMPUTER PROGRAM GUIDE
Version 1.1
December 1 989
o 1111111111111111 1
B B I II I 0 0
IIJITTI

Int;-oduction
CDOH PAVEMENT STRUCTURES DESIGN PROGRAM GUIDE
(Version 1.1 - December 19.89)
This computer program is a modified version of the Ohio Ready Mixed Concrete Association's (ORKCA) program, which uses the 1986 AASHTO pavement design criteria. The major changes consist of the incorporation of CDOH's specifications in the flexible pavement design, rigid pavement design, and a rehabilitation program. Although not completed at the present time, a Life Cycle Analysis program will be made available in the near future. Other changes in the program consist of facilitating automatic data entry for some of these variables, lock out for out-of-range or zero values, a pavement layer design section, and switching between the design and rehab. program while maintaining the current variable values. Additional code was included to compute the Resident Modules or Subgrade Reaction (flexible design and rigid design, respectively) from the R-value .
Running the Program
As before, the program consists of multiple modules. The main module handles the .rigid and flexible design. Another deals with the rehab design, and the third computes theE18 conversions. All programs are contained on one 360K floppy diskette. The operation can be sped up by operating from a hard disk. Program "Install" will create a subdirectory named .• AASHTO " on your hard dri ve, and copy all necessary files to that directory. Type "Run" to initiate program "ElSDETX", the primary program for flexible or rigid design. The programs run on either Color Display or Monochrome monitors, depending on the reply to the first question by the menu-driven programs.
The first screen is the control screen; Program branching to rigid design, flexible design or E1a conversion, and program exit is possible from this menu screen.
Rigid Pavement Design
Menu selections 1 or 2 from the control screen drive the rigid El8 and depth determination respectively. Data input screens are supported by Help Screens for many of the input variables. These screens are invoked by pressing the <ENTER> key without supplying a value. The values for Overall Deviation, Modulus of Rupture and Elasticity are automatically entered and cannot be altered by the user. After all values are entered, the user has the option of changing all values (except as noted above) or complete the computation by pressing the <ENTER> key. In the case of rigid pavement depth determination, the user can elect to run the Rehabilitation program by selecting option "S" as seen in the possible Program Operation Message at the bottom of the screen.
1

The following is a listing of help screens available in the Depth Determination and rigid El8 Determination programs.
1.
2 .
3.
4.
5.
Reliability -
Load Transfer J -
Modulus of Subgrade Reaction
Drainage Coefficient
PSI Loss
Flexible Pavement Design
The values are in . accordance to CDOH Design Guide Table 603.2E.
Table 604.2E from Design Guide
In addition to the Modulus of Subgrade Reaction values, the user can elect to supply the appropriate R-value. To bypass this input for MR hit <ENTER> without supplying a number.
Suggested values are supplied from Table 604.2D of the Design Guide.
Section 603. 2B of the Design Guide dictates the two values, depending on traffic volumes.
Ela and structural number determination are invoked by selection 3 or 4 from the control screen menu. Data input in either the Ela or structural number determination is assisted by help screens if further explanation is needed by the user. The availability of these screens is indicated by a message at the bottom of a screen and the respective help screens are invoked by pressing <ENTER> wit.hout supplying a number. The overall deviation value is pre-programmed, and cannot be altered by the user. After all numbers are entered satisfactorily, the Ela value or structural number (depending which menu item was selected) will be computed by pressing <ENTER>. Possible program operations are indicated at the bottom of the screen. After a structural number has been determined, the user can select further programs to compute the flexible pavement layer analysis, or a rehabilitation program.
Help screens associated with the flexible design program consist of the following:
1) Reliability
2) Soil resilient modulus - either the modulus or the R-value can be entered.
3) PSI loss
After completing either layer analysis or the rehab computation, the user can return to the main program, and make changes in any of t.he variables. The values will be ret.ained during t.his switching process (except for t.he layer analysis) .
2

Layer Analysis Program
Selecting item 5 from the possible program operation menu will generate the layer component screen. The layer sequence is a from top down approach, layer coefficients, drainage coefficients (only after the top layer) and layer thickness must be supplied. . When prompted for the layer thickness, the thickness required to satisfy the structural number is shown in the right-most column.
If the supplied thickness is not adequate, a new row is initiated for the next layer input. This process is repeated, until the required structural number is achieved.
Note: This portion of the program is currently still under development. Its use is somewhat limited, and the user should be aware of the program limitations.
Pavement Rehabilitation
The rehabilitation program is driven by the main program and cannot be used as a stand-alone program. Depending on a rigid or flexible design, program "REHABCMB" branches to different locations.
Rigid over Rigid - is selected when the rehab program is invoked after computation of the rigid depth determination. The thickness of the "new rigid pavement .. is imported into the rehab program. The user must supply thickness of the existing PCC pavement and condition factor (Help screen for Table 606-9) . The type of overlay is governed by structural integri ty of the existing PCC, and the program will automatically select the unbonded overlay if .the condi tions are not met. Items 2, 3 and 4 can be changed after the overlay thickness has been computed. The results can be printed, and the user has the option of returning to the main program menu .
The flexible rehab program consists of two parts:
a) Flexible over rigid
b) Flexible over flexible on rigid (flexible over composite)
The program is called after computing the structural number for the "new flexible pavement" using menu selection 6. The new structural number is automatically entered, as well as the remaining Life Factors. The remaining values are supplied by the user. Help screens for the structural layer coefficient of the PCCP and drainage coefficient are available if necessary.
Base course strength coefficient can be entered directly if known, or a corresponding R-value can be supplied. The R-value will be converted to a coefficient immediately upon entering the R-value.
The rehab option of flexible over composite input options are similar, except for the strength coefficient and thickness inputs for the existing overlay.
3

The st~ength coefficient for the overlay can be entered directly (if known) o~ a help screen can be selected. This help screen has addi tional help screens for the four items that govern the coefficient. Figure 605-6 from the Design Manual is summarized in these help screens. After computation of the required overlay thickness, the · user has the option of changing the input variables, printing the results, or returning to the main program result screen. Normal exit from the program is via the main program control screen. Flow charts for the programs are included with this manual.
Traffic Conversions to EIS
No major changes were made to the original ORMCA program. instructions were prepared by ORMCA.
The following
This is a separate program which is chained to as needed. This program consists of a help screen. and three separate input, solution, and printer control s creens. Up to 25 different axle configurations can be entered and converted to E18's for each input screen.
E18 Conversion Help Screen - This is the first screen encountered in the program. This screen gives definitions of each of the variables required in the input screens. To exist this screen a choice of one of four operations is allowed. These operations allow you to do the following:
1. Calculate Rigid E1S's Only - Branches to input screen for traffic conversions to rigid E1S's.
2. Calculate Flexible ElS' s Only - Branches to input screen for traffic conversions to flexible ElS's.
3. Calculate Rigid and Flexible E18' s - Branches to input screen for traffic conversions to both rigid and flexible ElS's.
4. Control Screen - Returns to Screen
Input Screens all follow the same procedure. When the input screen first appears, the following data must be entered. Pavement depth and terminal serviceabili ty for rigid conversions, structural number and terminal serviceability for rigid and flexible conversions.
After this initial data is entered, a choice of one of three possible program operations is allowed. These operations do the following:
1. Continue - Allows for input of specific axle configuration data.
2. Change Depth and/or Structural Number and Terminal Serviceability -Allows for immediate change of the initial data before program execution continues.
4

3 . Exit - Retu~s to E18 Conversion Help Screen .
If option 1 is chosen, specific axle configuration data is entered for up to 25 separate axle configurations. After each configuration is entered, cumulative rigid and/or flexible E18' s is shown on the input screen. After each axle configuration is entered three possible program operations exist. These are:
1 . continue - Allows for the input of the next axle configuration.
2. Change Axle Configuration Allows for the re-entry of the configuration just entered in case of mistake. After re-entry the cumulative E1a's are corrected.
3. Exit - Branches program execution to solution screen depending on the type of conversion being made. The solution screen appears to be the same as the input screen, except that the possible program operations are different. It should be noted that the solution screen appears automatically after the 25th axle configuration is entered.
El8 Conversion solution Screen gives the final E1a totals along with a choice of 3 possible program operations which are:
1. Change Depth and/or structural Number and Terminal Serviceability -This allows for the initial pavement section data on which the E18 conversions are based to be changed. Program execution goes back to input screen and allows the new data to be entered. After this data is entered the previously entered axle configurations are reconverted to E1a and the results displayed through solution screen.
2 . Print - Allows access to printer control screen.
3. Exit - Returns to Help Screen .
System Requirements
1. IBM PC (or compatible ) with a 256K RAM
2 . DOS 3.0 or higher
3. Monochrome or color video display
4. 360K (or higher) capacity disk drive (hard drive is preferred for faster access.
5

Control r Screen If\ If' I}
'-V
~ \
~ ~.~ \It > ~ 8 .9!·E ~ 8 ..0 '- ._
co .~! UJ ~ it:~ .!!!.~
W fl II x-a; CDC it:
Reliability Help Screen
RIGID DESIGN FLOW CHART
Exit
> D.O.S Clear SaDWI
c:t.org. It.."
i' Ii' Rigid E 18
71 Determination Screen
Materials Help Screen
Pavement Type Help Screen
I .... ....
.,.,
\1/
ow- Headl"lga
Set TDP.
Printer Control Screen
1-------'>13>1 Print T ex t
..... Exlt
Printer 1------>13>1 Advance Ppge
K-Factor Help Screen
Drainage Help Screen
PSI Loss Help Screen
-~ 1~ ,.----, Exit
i~ \
./ Depth , .....
Determination Screen
'1\
CI"oing8 It"'"
e ..... Sa .....
I'
--"" ......
Printer ContrOl Screen
....
.....1 Print Text Prlntet" I-
t------:>~I Advance Page
II' 1'1\
ki TD.P
a-ueHM~

c ~ ~
o 11\
6 'iii ... Q)
6 o co r-
w
55 Cl>
~
'1'
Clear Screen J Change Item
I \ II Flexible E 18
, Determination ... ./
screen 'Exit
FLEXIBLE DESIGN FLOW CHART
ChonQe Hooad __
Set T.O?
\ II
, Printer ".
Control screen
I ~, ....
-;?'
,.
Reliability PSI Loss Drainage Help Screen Help Screen Help Scree
~ 7\ -7
~
Struct. Num. ... Exit
.... ... Printer
Print Text Printer
Advance Page
, ... Determination Control Screen
Screen ..... .... .... .... ".. "..
i Change It am r 1\ l' 1\
C Set T.O P . 01
Ul 'w Clear Screen O'Iange Headinga
~ 'ai a> >.~ 0 ~~ .n
~ , .s: 11\ ,I, ([
Print Text Printer
Advance Page ! ,
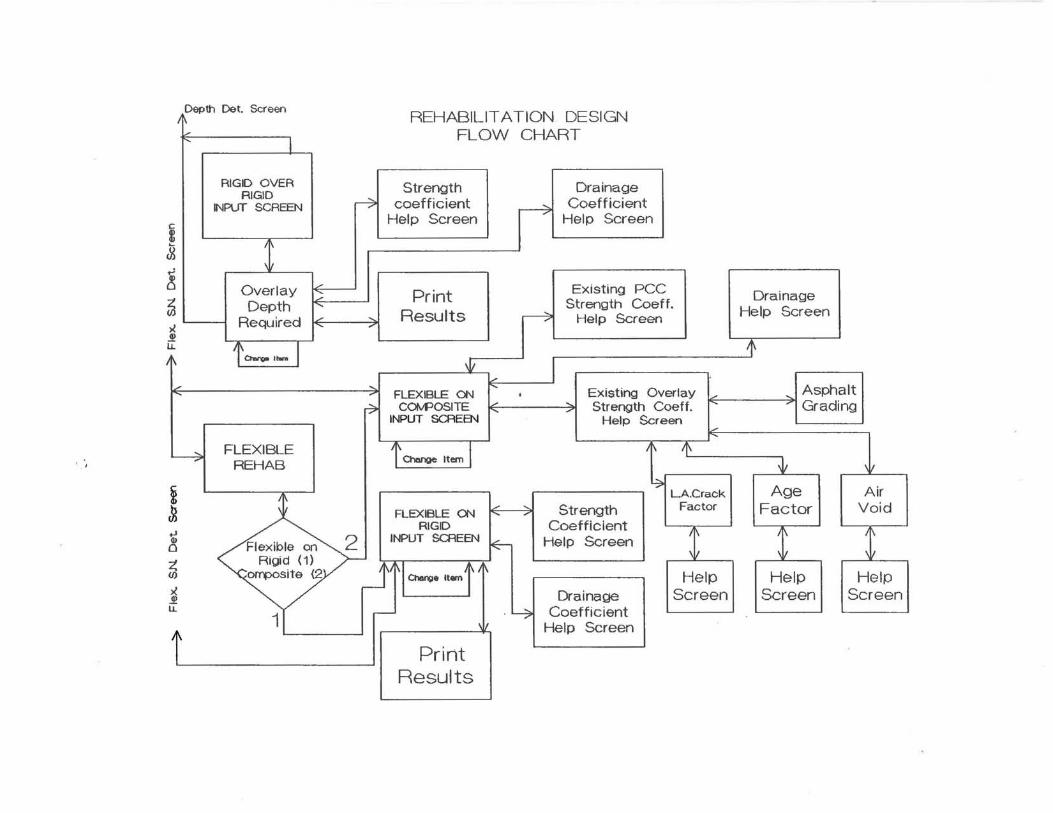
, ,
Depth Det. Screen
i ~ ...: ~ ~ II)
x .!! u. 11\
--
~
i ~ tJ Q)
0
~ II)
x Q)
u:
t
RIGID OVER RIGID
INPUT SCREEN
'" Overlay Depth
Required
i~,-I
FLEXIBLE REHAB
--~ .....
--.....
Flexible on Rigid (1)
orrposita (2
1
REHABILIT A TION DESIGN FLOW CHART
Strength coefficient
Help Screen
Drainage Coefficient
Help Screen
I I Existing PCC Print Strength Coeff. Results .-----? .... Help Screen ..
W l...-
..... I' --.,- FLEXIBLE ON I Existing Overlay
r7 COfvPOSITE ---..... Strength eoeff. I' " INPUT SCREEN Help Screen
---.....
t~ Item I 'I' ~
~ L.A.Crack
FLEXIBLE ON ---... Strength Factor .... ..
RIGID Coefficient
1 2 INPUT SCREEN ~ Help Screen
JI 1\ I CherY;le Item t 11\ Help Drainage Screen
r- . ~ Coefficient ' I, Help Screen
Print Results
Drainage Help Screen
l'
... Asphalt Grading
~ , I,
Age Air Factor Void
t Help Help
Screen Screen

Initial Exit
, .-
'I'
III 'II
~ E 18 Cony. Help Screen
II' I
......
.-
E 18 Conversion Flow Chart
Exit
t a..roo Axle CCf1tl~
D~~.T I ~ f Cent ...... I Exit
Flex. E 18 ...-Flexible "" EKIt
E 18 Cony ...:::. Solution Screen -- Screen .. -.,. ,
-1' Olanae I
Depth P.1.
1 o-.ong. Ax!. Ccnft~ Ol;aooo
I ~ eam.. I ~6WCt. /'Un. P.T
Flex. E 18 Exit Flexible ""'-EKIt I"'" E 18 Cony ... Solution Screen Screen
_ ..... .-
'f0Mlnaa1 Eftruct. IIlm. P. .
I ~ Ax!. Cco\fI~ QlEOOl!
I f eam.. I ~ Depth SN P.T
exit Exit Ricid & Fle)(ible ..... Rigid & ~Iex.
I" E 18 Conv .... E 16 Screen Solution Screen
.." ....
T Olano. J • Dep1tl &N P~.
E><It
ChancJe
I Jt Headings \
" I" Print Text Printer Printer Control Screen
..... Advance Page
It Sat T.O.P. J 1
I Change J" . Headings i
...- Print Text Printer '" Printer Control Screen Advance Page .... .-If Set T.O.P. J
Change
I J" Headings \
...- Print Text Printer '" Printer Control Screen
Advance Page ...:::. ....
'f Set T.O.P. J

APPENDU D
User's Manual for Life-Cyole ADalysis proqram

CDOH PAVEMENT DESIGN PROGRAM GUIDE FOR
L IFE-CYCLE COST ANALYSIS
Vers ion 1.0 April 1990

CDOH PAVEMENT DESIGN
LIFE CYCLE ANALYSIS PROGRAM GUIDE
,(Version 1.0 April 1990)
Introduction
This computer program was designed to facilitate the
computation of a life-cycle cost analysis for paving
projects. Although this programs has no "Help Screens"; it
is relatively easy to use, and by referring to this manual,
and some samples of analyses, the user should have little
difficulty in preparing a life-cycle cost analysis.
Running the program
The necessary programs, along with some sample
datafiles, are supplied on a 360K floppy diskette. For
floppy diskette users, it is suggested 'to copy the entire
disk. For computer users with monochrome displays start the
program by typing LCCMONO and press <ENTER>. For color
display type LCCCOLOR and <ENTER>.
Hard disk users can install the necessary programs by
using the INSTALL (X) program provided on the 5~ inch
diskette. For monochrome display computers use INSTALLM, and
for color display computers use INSTALLC install programs.
The installation routine will create a subdirectory named
" LCC" on your hard drive , and copy the required programs,
1

along with some sample data files to that subdirectory.
start the l ife-cycle program by typing LCC and <ENTER>.
Program description
The first screen to appear will be the MENU screen as
follows:
(1) Project ID section
(2) Display/Change Unit Prices, Initial Project Costs
(3) Input/Change section Geometrics
(4) Print LCC results (Screen or Printer)
(5) Print Summary Table
(6) Exit Program
Select Item No. ( )
For new proj ects select items 1 :to 5 in a sequential
fashion. After the first three menu items have been
selected, and all required data supplied, additional changes
can be made to any of the categories in any order.
(1) Project ID section
The first item to be input is the subaccount number.
After replying with a 5-digit number (suffixes can be used
for different alternate analyses, but with the same
subaccount number Le. 99345 and 99345a etc.) the user is
2

asked if data is to be obtained from a fil e . The reply
should be <N>. if a new analysis is being prepared, <Y> (or
<ENTER> if you want to review a project with this subaccount
number.
The next item is the Project Number. Supply the
appropriate proj ect number for the life-cycle analysis, or
retain a previous number if this is the continuation of a
project by pressing <ENTER>.
Project Location is treated in the same way. Unless
otherwise prompted, pressing the <ENTER> key will retain the
"data from the old file throughout this program.
The Analysis Period is set at 30 years as a default
value for all new analyses. Subsequent analyses will retain
the last value used, unless a different number is supplied
by the user.
The Design Life default value is 20 years, and data
entry rules outlined under Analysis Period apply.
Next, the user is prompted to enter the number of HBP
Rejuvenation periods (or cycles.) The program permits up to
5 cycles. The user is asked for the Year of Rejuvenation!
followed by Pavement Thicknesses and other Costs for the
appropriate rejuvenating strategy. For a new analysis,
simply provide the appropriate values at the various
prompts. In the case of review and change, make your ne\V
selections. Although the thicknesses typically refer to
PMSC's and HBP's, the data can reflect a rubberized wearing
course or HBP' s with a designated grading. (Make sure you
select the appropriate items in the subsequent unit price
table.) Other future costs " are addressed in a separate
screen. Up to 8 items can be entered in this table. A neVl
table can be built for each rejuvenation period. Old data can
be revised, item deleted or added. When all entries are
complete press <ENTER> to return to the Project ID screen.
3
The PCCP rejuvenation periods and associated costs are
input using the HBP guidelines shown above.
After all date entry for the Project ID section is
complete, the computer saves this information in a file
named after the project subaccount number, and return with a
display of the MENU screen.
(2) Display/Change unit Prices, Initial Project costs
After selecting item 2, the user is asked if data is to
be read from the file indicated at the bottom of the screen
(Current Subaccount #.) If a new life-cycle analysis is
being prepared answer <N> and press <ENTER> twice to
establish a new Unit Price Table. If the current subaccount
number file contains the correct price information press <Y>
(or <ENTER> to display the current information. If a unit
price table from some previous analysis is applicable, enter
the corresponding subaccount number after replying <N> to
the initial reply.
The first four items in the table pertain to pavement
surfacing materials, .the next four are associated with base
materials, item 9 pertains to maintenance cost information,
and initial proj ect other costs. Item descriptions can be
changed if the user desires. Item 1 and 2 also require input
of unit weights if they are different from the default
values. The default values for maintenance costs for
flexible, rigid, and composite pavements are supplied by the
program during the initial execution. Subsequent runs retain
previous values, unless a new value is provided. All item
costs (and description if different for the previous table)
pertaining to a particular analysis should be entered in the
table. After supplying the maintenance costs (or default)
the program asks if data for INITIAL PROJECT other costs is
4

available. If there are no changes to the unit price table
or other costs, answer <N> , otherwise reply with <Y> (or
<ENTER> to display the other INITIAL PROJECT cost table, and
make appropriate changes, additions, or deletions (up to 8
items allowed.) After all changes are made press <ENTER> and
make the appropriate reply to the question about saving data
to the current subaccount number file by pressing <ENTER> or
providing an alternate subaccount number as appropriate.
Unit price information and associated other costs data will
be saved, and the user is returned to the main MENU screen.
(3) Pavement Geometries (and Base selection)
A section description is requested first, followed by
pavement width, roadway length, and number of lanes.
Corrections to these entries are possible by selecting the
appropriate item as identified by < > and supplying the
corrected value.
The user is asked if the design is a flexible or rigid
design (lor 2.) In the case of a flexible design, the user
is prompted to provide thickness information for the wearing
and lower HBP course (i.e. PMSC and HBP.) If no base is
being considered type <N> (or press <ENTER>. For bases the
user will next decide which type of base is to be used (i.e.
lime treated, PMBB, etc) as well as the respective depths of
treatments. In addition the user is asked to which design
this base treatment applies. After this the program returns
to the main Menu screen.
For PCCP designs the user is asked for the thickness of
the PCCP pavement. A reminder is given after the input, that
the unit price applies to the bid price on the basis of
thickness.
5

(4) Print LeC results (Screen or Printer)
After selecting item 4, the program performs all
calculations necessary and asks the user if the results are
to be printed to Printer or Screen. Pressing <S> followed by
<ENTER> (or simply <ENTER> results in a display of three
screens.
a) Background information
b) Rejuvenation periods, treatments, PW FActors, and
maintenance costs
c) section description with pavement thicknesses, base
thickness (if applicable) and
Initial Cost
Present Worth
Annual Cost
After pressing <ENTER> to continue, the user has the
following options:
continue with same project
New life-cycle project
. Printer
Exit program
Continuing with same project maintains the current
section geometries (except for thicknesses.) This permits
the user to change items in the unit price table, or the
Project ID section (for example changing the analysis period
etc.) and new results can be computed.
Selecting a New Proj ect Ivill delete information
pertaining to pavement geometrics and require new input when
item (3) is chosen from the MENU screen.
When the user is satisfied with the results as displayed
on screen, he can use the <P>rint option. An audible signal,
6

" I
as ~vell as a flashing warning prompt advises the user to
make sure the printer is on-line. During this print function
data is saved to a summary file table for later retrieval.
Exit from the program is affected' by selecting the
<E>xit option. This will end all computation and return a
DOS prompt.
To gain access to the Summary Table select either <C> or <N>
after the printout of the last alternate section. From the
MENU screen select item 5 and reply with a <N> to the
computer's query about retrieving data from the existing
subaccount file. Press <ENTER> in response to the question
about the subaccount # (be sure the printer is on and
ready. ) The alternate life-cycle design costs as computed
during the session ( and printed to printer !!!!) will be
printed in a summary form. When completed, the user is asked
if the information is to be saved to the current subaccount
number file. If this is the first time the summary table was
printed press <ENTER> to make this save. If no save is
desired answer <N>, and the program returns to then MENU
screen. (This return also is the case with the Save file
mode. )
System Requirements
1. IBM PC (or compatible) with 256K RAM
2. IBM (or PC) DOS 3.0 or higher
3 . Monochrome or Color Video Displays
4. 360k capacity floppy drive (hard disk is preferred for
faster operation and greater file storage capacity)
7

Sample Files :
The following files have been created during a life-cycle
analysis:
Subaccount #
54321A
54321A.DAT
54321B.DAT
54321C.DAT
54321D.DAT
54321. SUM
section Geometries Data:
Pavement width: 38 ft
Pavement Length: 5280 ft
Number of Lanes: 2
Subaccount #
00010A
00010A.DAT
00010B.DAT
OOOlO.SUM
section Geometries Data:
Pavement Width: 96 ft
Pavement Length: 5280 ft
Number of Lanes: 6
File Description
Project ID file
unit price table for Alternate 1
unit price table for Alternate 2
unit price table for Alternate 3
Unit price table for Alternate 4
Summary table for ali Alternates
Alternate 1:
Alternate 2:
Alternate 3:
Alternate 4:
PMSC 0.75 in, HBP 6.5 in
PCCP 9 in
PCCP 11 in
PMSC 0.75 in, HBP 4.25 in
File Description
Project ID file
Unit price table for Alternate 1
Unit price table for Alternate 2
Summary table for all Alternates
Alternate 1: PCCP' 8.75 in
Alternate 2: PMSC 0.75 in HBP 8.5 in
8

APPENDrx B
Pavement Hanaqement Data Sheet

PAVEMENT MANAGEMENT DATA SHEET
Project No. Dist.rict
Location, ________________________________ _ Hile Post ___ _ to M.P.
Using the Reporting Instructions, provide the following coded info~tion:
Reconstruction Type
Rehabilitation/Resurfacing Type
Rehabilitation/Resurfacing Thiekness
Number of Lanes Be£ore Construction
Number of Lanes Affected
Pavement Surface Type
Pavement Surface Thickness
Pavement Base Type .~
Pavement Base Thickness
Pavement Subbase Type
Pavement Subbase Thickness
Pavement Subsurface Drainage
Pavement Shoulder Type

Repo~ting Instructions
Pavement Management Data
(1) Reconstruction Type - This element is to be coded fo~ each p~oject identified as a ~econstruction type of imp~ovement. This should include full depth asphalt conc~ete/asphalt cement (AC) o~ po~tland cement concrete (PCC) ~ecycling. The highest type ~econstruction activity code should be used as follows:
o - Not Applicable 1 - Reconstruct to freeway standa~ds; full access
cont~ol with or without alignment improvements 2 - Reconstruction with lane(s) added; with or without
alignment improvements 3 - Reconstruction with lane(s) widened by one foot o~ mo~e;
with or without alignment improvements 4 - Essentially limited to reconstruction of existing
pavement structure; without alignment imp~ovements 5 - Reconstruction of existing lanes with alignment improvements
(2) Rehabilitation/Resurfacing Type and Rehabilitation Resurfacing Thickness - This element is used when the type of improvement is specified as rehabilitation. which includes resurfacing and restoration; or for minor widening types of improvement which includes rehabilitation of the existing lanes. The thickness should be entered to the nearest tenth of an inch.
00 - Not Applicable 01 - Concrete Pavement Rehabilitation (CPR) techniques
such as subsea1ing. joint repair, diamond grinding, and slab repair (no resurfacing). Enter zero thickness.
02 - Other rehabilitation techniques such as partial - depth milling only. inlays, etc. Enter zero thickness.
61 Flexible over Flexible 62 - Flexible over Rigid (including Flexible over Flexible
already over Rigid) 74 - Rigid over Rigid; bonded or partially bonded 75 - Rigid ove~ Rigid; unbonded (i.e., bond b~eaker used) 76 - Rigid over Flexible
(3) Number of Lanes BeCore Construction/Number of Lanes Affected by the Project - Code as two two-digit numbers (with leading zeros for numbe~s less than ten) indicating the number of traffic lanes existing prior to initiation of the p~oject followed by the number of lanes being affected by the p~oject. For reconstruction work, the '"lanes affected" it.em should indicate the number of lanes actually reconstructed; and for major widening (i.e. lane(s) added), it should indicate the number of lanes added. For minor: widening. the "lanes affected" would indicate the extent of ~ehabilitation work. if coded.

(4) Pavement Surface Type and Pavemenl Surface Thickness - Both description code and thickness (to the nearest lenth of an inch) should be entered for new construction, relocation, major widening. and reconstruction types or improvements. For rehabilitation type projects (including resurfacing), the "Rehabilitalion/Resut"facing Type and Rehabilitation/Resurfacing Thickness" data elemen!;. will be used.
51 - Bituminous surface treatment 52 - Mixed bituminous (base plus sut"face less than 7") 53 - Bituminous penetration 61 - High flexible (base plus surface greater than 7'".) 62 - Composite: Flexible over Rigid 71 - Jointed plain concrete (JPCP) 72 - Jointed reinforced concrete (JRCP) 73 - Continuously reinforced concrete (CRCP) 80 - Brick, block other combinations
(5) Pavement Base Type and Pavement Base Thickness - The information on base type and thickness is required for new construction, relocation, reconstruction, and major widening improvement types. The highest type base material should be coded if more than one malerial t"ype is used. For PCC-type pavements, the material directly below the slab should be considered "base" for coding purposes. Thickness should be reported Lo the nearest tenth of an inch.
~- Roadbed soil 2 - Granular 3 - Cement stabilized 4 - Lime stabilized 5 - Lime/fly ash slabilized 6 - Cement/fly ash slabilized 7 - Cold asphalt stabilized 8 - Hol mix asphalt 9 - Lean concrete
(6) Pavement Subbase Type and Pavement Subbase Thickness - The information on subbase type and thickness is required Cor new construction, relocation, reconstruction, and major widening improvement lypes. The highest type subbase material should be coded if more than one material type is usee. Thickness should be reported to the nearest Lenth or an inch.
o - None or not applicable 1 - Roadbed soil 2 - Granular 3 - Cement stabilized 4 - Lime stabilized 5 - Lime/fly ash stabilized 6 - Cement/fly ash stabilized 7 - Cold asphalt stabilized 8 - Hot mix asphalt 9 - Lean concrete
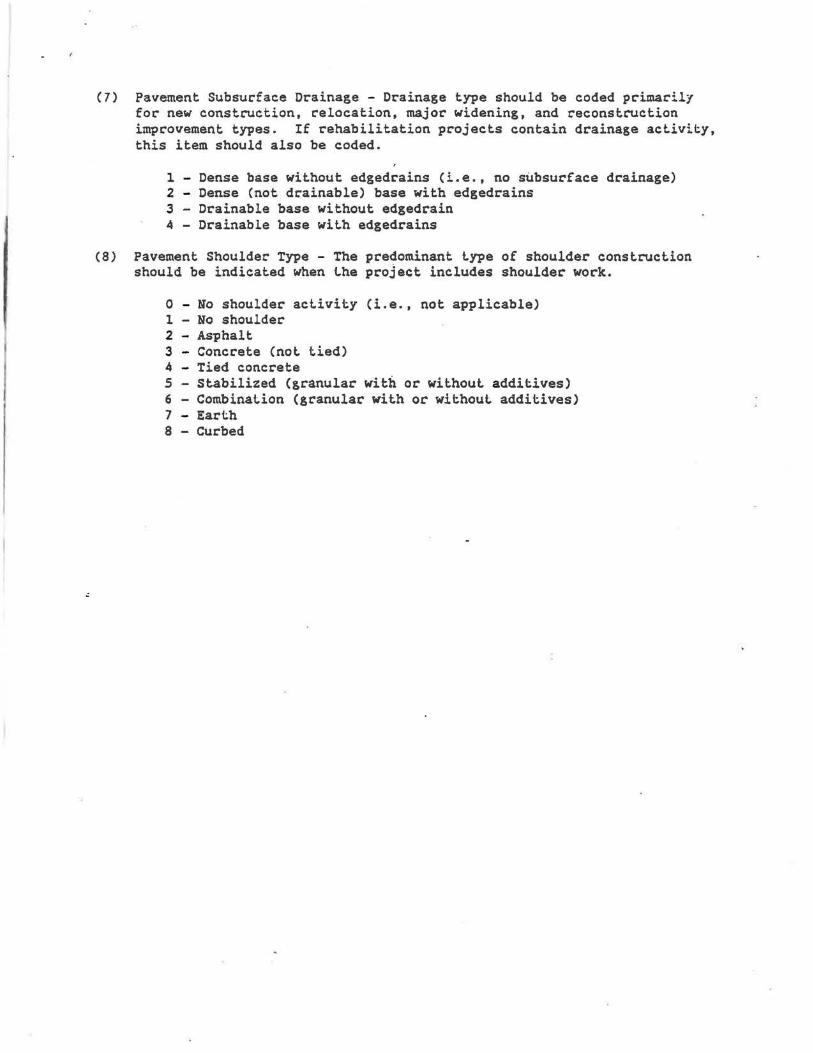
(7) Pavement Subsurface Drainage - Drainage type should be coded primarily for new construction, relocation, major widening, and reconstruction improvement types. If rehabilitation projects contain drainage activity, this item should also be coded.
1 - Dense base without edgedrains (i.e., no subsurface drainage) 2 - Dense (not drainable) base with edgedrains 3 - Drainable base without edged rain 4 - Drainable base with edgedrains
(8) Pavement Shoulder Type - The predominant type of shoulder construction should be indicated when the proJect includes shoulder work.
o - No shoulder activity (i.e., not applicable) 1 - No shoulder 2 - Asphalt 3 - Concrete (not tied) 4 - Tied concrete 5 - Stabilized (granular with or without additives) 6 Combination (granular with or without additives) 7 - Earth 8 - Curbed