project management_2.pdf
TRANSCRIPT
1
Time Management
Project time management project is defined as ‘‘the process used to ensure the timely completion of the
project.’’
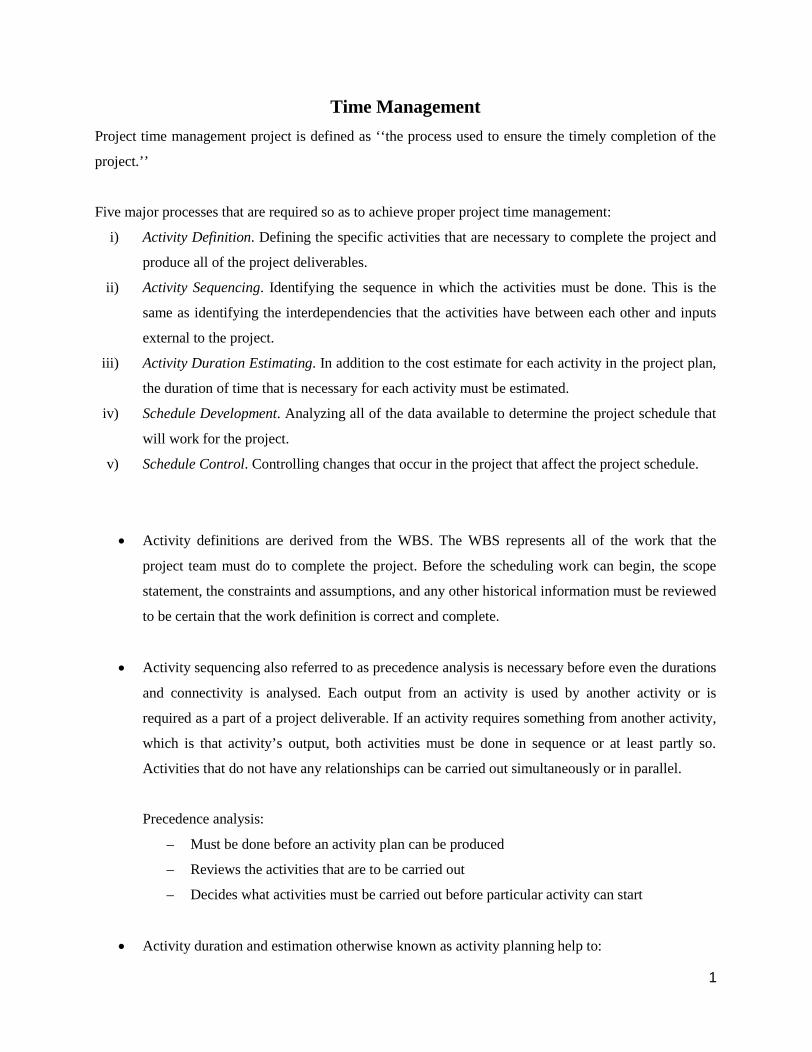
Five major processes that are required so as to achieve proper project time management:
i) Activity Definition. Defining the specific activities that are necessary to complete the project and
produce all of the project deliverables.
ii) Activity Sequencing. Identifying the sequence in which the activities must be done. This is the
same as identifying the interdependencies that the activities have between each other and inputs
external to the project.
iii) Activity Duration Estimating. In addition to the cost estimate for each activity in the project plan,
the duration of time that is necessary for each activity must be estimated.
iv) Schedule Development. Analyzing all of the data available to determine the project schedule that
will work for the project.
v) Schedule Control. Controlling changes that occur in the project that affect the project schedule.
Activity definitions are derived from the WBS. The WBS represents all of the work that the
project team must do to complete the project. Before the scheduling work can begin, the scope
statement, the constraints and assumptions, and any other historical information must be reviewed
to be certain that the work definition is correct and complete.
Activity sequencing also referred to as precedence analysis is necessary before even the durations
and connectivity is analysed. Each output from an activity is used by another activity or is
required as a part of a project deliverable. If an activity requires something from another activity,
which is that activity’s output, both activities must be done in sequence or at least partly so.
Activities that do not have any relationships can be carried out simultaneously or in parallel.
Precedence analysis:
– Must be done before an activity plan can be produced
– Reviews the activities that are to be carried out
– Decides what activities must be carried out before particular activity can start
Activity duration and estimation otherwise known as activity planning help to:

2
– ensure that the appropriate resources will be available precisely when required
– avoid different activities competing for the same resource at the same time
– produce a detailed schedule showing which staff carry out each activity
– Produce a detailed plan against which actual achievement may be measured
– produce a timed forecast
– re-plan the project during its life to correct drift from a target
GANTT CHARTS
• Developed by Henry Gantt, around 1917
• Gantt charts are easy to use and produce
• They are very useful for use on less complex projects
• Commonly used due to their simplicity
• Gantt charts are easily understood and easy to read
Week 1 Week 2 Week 3 Week 4 Week 5 Week 6
Task 1
Task 2
Task 3
Task 4
Task 5
Task 6
The information represented in the diagram is as follows:
– The project will last six weeks and consists of five tasks
– Task 1 starts at the beginning of week 1 and end in the middle of week 2 lasting one and half
weeks.
– Task two is carried out wholly in the second week
– Task 3 starts on week 3 (after completion of task 2) and lasts two and half weeks ending in the
middle of week 5.
– Task 4 starts in the middle of week 2 (after completion of task 1) and lasts two and half weeks
ending in week 4
– Task 5 starts in week 5 (after completion of task 4) and ends in half a week.
– Task 6 starts in the middle of week 5 (after completion of task 3 and task 5) and lasts one nad half
weeks to the end of week 6.

3
NB: Tasks/activities that must be completed before start of a particular activity are called its preceding
activities.
Example: Draw the following Gantt chart given the following information
Task Precedence Duration (Days)
A - 5
B - 4
C A 6
D B 2
E B 5
F C,D 8
Network Planning Models
Two models have been used in network plan modelling.
- PERT (Program Evaluation and Review Technique)
- CPM ( Critical Path Method/Analysis)
PERT was developed by the US Navy with in collaboration with BOOZ-Allen Hamilton and
Lockheed Corporation for the Polaris missile/submarine project in 1958
CPM was developed by DuPont Inc in the Late fifties early sixties to facilitate building of
complex process plant
Though the two were different when developed, the difference between them is not significant currently.
Simple network diagram

4
Terminology
• Activity
– A specific task, uses resources takes time to complete
• Event
– The result of completing/starting an activity
– Events use no resources
– They are instances in time, points on the network, conditions of a system that can be
recognised
• Network
– The combination or all activities (often drawn as lines) and events (often drawn as nodes
at the beginning and end of each line) define the project and the activity precedence
relationship.
– Arrow heads placed on the lines indicate the direction of flow. Before and an event can
be realised all the activities that immediately precede it must be completed
• Path
– The series of connected activities (or intermediate events) between any two events in a
network
• Critical
– Activities, events, or paths, which, if delayed, will delay the completion of the project
– A project’s critical path is understood to mean that sequence of critical activities (and
critical events) that connect the project’s start event to its finish event
On Arrow Network diagram showing critical path in broken lines
5
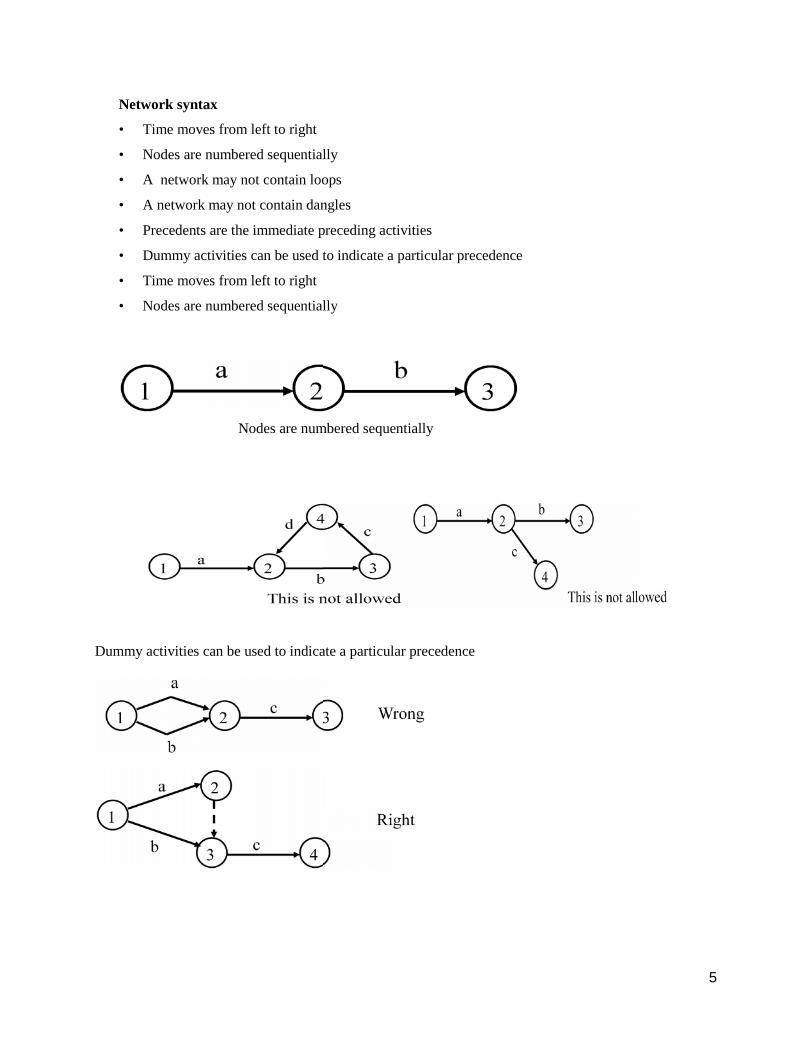
Network syntax
• Time moves from left to right
• Nodes are numbered sequentially
• A network may not contain loops
• A network may not contain dangles
• Precedents are the immediate preceding activities
• Dummy activities can be used to indicate a particular precedence
• Time moves from left to right
• Nodes are numbered sequentially
Nodes are numbered sequentially
Dummy activities can be used to indicate a particular precedence
5
Network syntax
• Time moves from left to right
• Nodes are numbered sequentially
• A network may not contain loops
• A network may not contain dangles
• Precedents are the immediate preceding activities
• Dummy activities can be used to indicate a particular precedence
• Time moves from left to right
• Nodes are numbered sequentially
Nodes are numbered sequentially
Dummy activities can be used to indicate a particular precedence
6
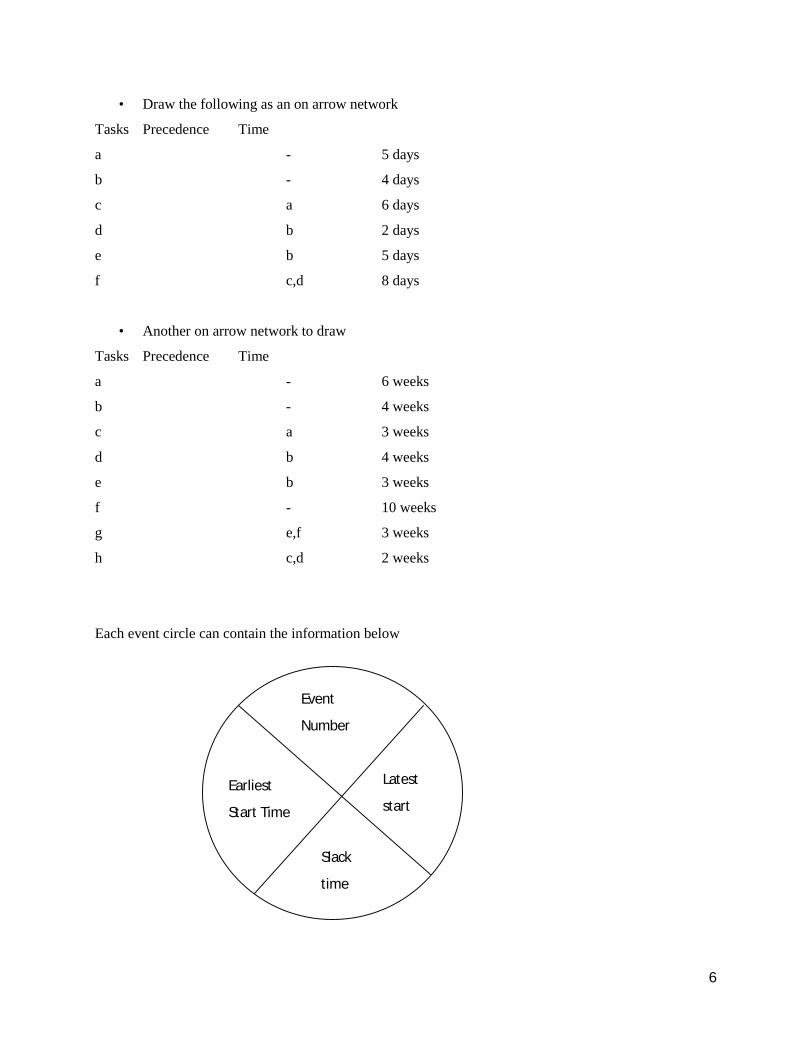
• Draw the following as an on arrow network
Tasks Precedence Time
a - 5 days
b - 4 days
c a 6 days
d b 2 days
e b 5 days
f c,d 8 days
• Another on arrow network to draw
Tasks Precedence Time
a - 6 weeks
b - 4 weeks
c a 3 weeks
d b 4 weeks
e b 3 weeks
f - 10 weeks
g e,f 3 weeks
h c,d 2 weeks
Each event circle can contain the information below
Earliest
Start Time
Event
Number
Latest
start
time
Slack
time

7
Forward pass ( In case of one or more precedents take the one with the highest period/value)
Backward pass (in case of more than one node precedence assume the least value)
7
Forward pass ( In case of one or more precedents take the one with the highest period/value)
Backward pass (in case of more than one node precedence assume the least value)
7
Forward pass ( In case of one or more precedents take the one with the highest period/value)
Backward pass (in case of more than one node precedence assume the least value)
8
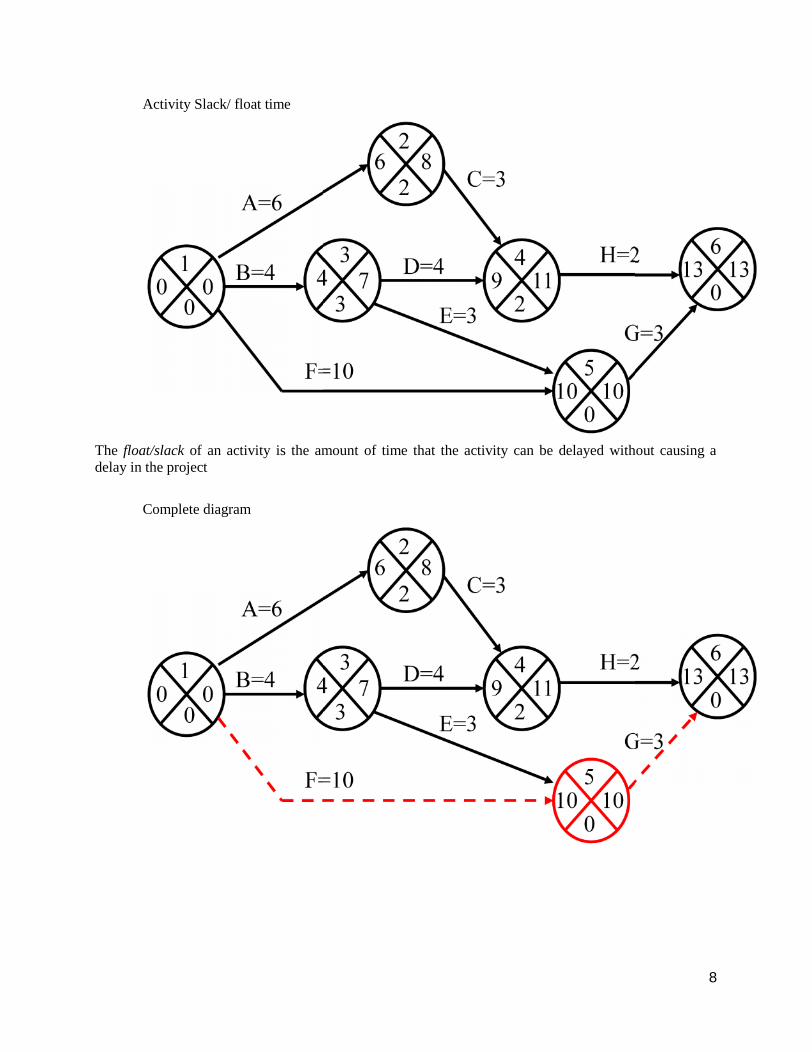
Activity Slack/ float time
The float/slack of an activity is the amount of time that the activity can be delayed without causing adelay in the project
Complete diagram
8
Activity Slack/ float time
The float/slack of an activity is the amount of time that the activity can be delayed without causing adelay in the project
Complete diagram
8
Activity Slack/ float time
The float/slack of an activity is the amount of time that the activity can be delayed without causing adelay in the project
Complete diagram

9
If the predicted date of the schedule is later than the promise date we must compress the schedule.
Crashing or fast tracking must be used. Crashing a schedule is doing anything at all to reduce the
scheduled completion of the project. Examples of crashing would include reducing the scope of the
project, adding additional resources for selected activities, eliminating activities, and changing the process
to eliminate steps.
Precedence Networks
• Syntax the same as for On Arrow networks
– Except there are no dummy activities
– Precedence networks must start with a start node and end with a end node
Simple precedence network
The same information is presented as on-arrow network below

10
Drawing a precedence network and on-arrow networks given the data -
Tasks Precedence Time
a - 5 days
b - 4 days
c a 6 days
d b 2 days
e b 5 days
f c,d 8 days
10
Drawing a precedence network and on-arrow networks given the data -
Tasks Precedence Time
a - 5 days
b - 4 days
c a 6 days
d b 2 days
e b 5 days
f c,d 8 days
10
Drawing a precedence network and on-arrow networks given the data -
Tasks Precedence Time
a - 5 days
b - 4 days
c a 6 days
d b 2 days
e b 5 days
f c,d 8 days

11
• Another on precedence network to draw
Tasks Precedence Time
a - 6 weeks
b - 4 weeks
c a 3 weeks
d b 4 weeks
e b 3 weeks
f - 10 weeks
g e,f 3 weeks
h c,d 2 weeks
• Adding more information to the node
11
• Another on precedence network to draw
Tasks Precedence Time
a - 6 weeks
b - 4 weeks
c a 3 weeks
d b 4 weeks
e b 3 weeks
f - 10 weeks
g e,f 3 weeks
h c,d 2 weeks
• Adding more information to the node
11
• Another on precedence network to draw
Tasks Precedence Time
a - 6 weeks
b - 4 weeks
c a 3 weeks
d b 4 weeks
e b 3 weeks
f - 10 weeks
g e,f 3 weeks
h c,d 2 weeks
• Adding more information to the node

12
Example:
Activity Precedence Duration
A Hardware selection - 6
B Software design - 4
C Install hardware A 3
D Code & test software B 4
E File take-on B 3
F Write user manual - 10
G User training E,F 3
H Install & test system C,D 2
12
Example:
Activity Precedence Duration
A Hardware selection - 6
B Software design - 4
C Install hardware A 3
D Code & test software B 4
E File take-on B 3
F Write user manual - 10
G User training E,F 3
H Install & test system C,D 2
12
Example:
Activity Precedence Duration
A Hardware selection - 6
B Software design - 4
C Install hardware A 3
D Code & test software B 4
E File take-on B 3
F Write user manual - 10
G User training E,F 3
H Install & test system C,D 2
13
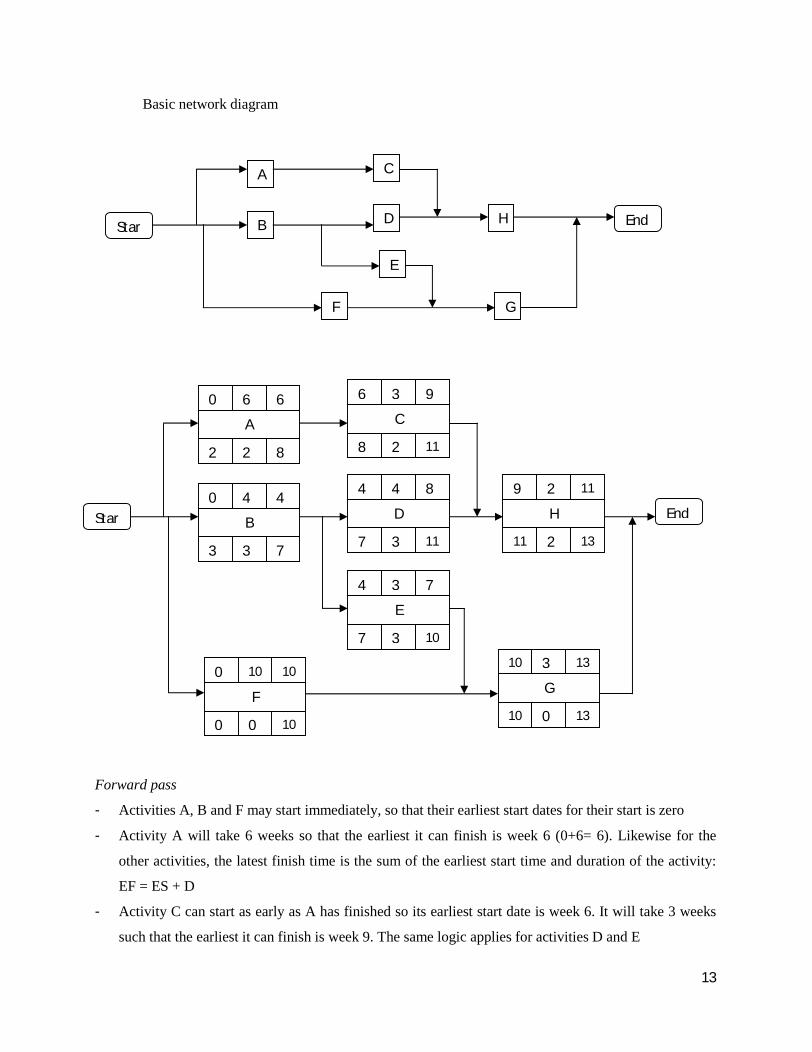
Basic network diagram
Forward pass
- Activities A, B and F may start immediately, so that their earliest start dates for their start is zero
- Activity A will take 6 weeks so that the earliest it can finish is week 6 (0+6= 6). Likewise for the
other activities, the latest finish time is the sum of the earliest start time and duration of the activity:
EF = ES + D
- Activity C can start as early as A has finished so its earliest start date is week 6. It will take 3 weeks
such that the earliest it can finish is week 9. The same logic applies for activities D and E
Star
t
End
A
B
F
A
D
C
E
H
G
EndStar
t
0 44
3 73
B
4 73
7 103
E
9 112
11 132
H
0 1010
0 100
F
10 133
10 130
G
0 66
2 82
A
4 84
7 113
D
6 93
8 112
C

14
- Activity G cannot start until both E and F have been completed. It cannot start therefore until week
10, the later of the two (Activity E = 7 and F= 10). The same logic applies for activity H wich can not
start until activity C is completed (C takes 9 weeks while D takes 8).
- The project will be complete when both activities H and G have been completed. Thus the earliest
project completion date will be the later of the two activities H and G, i.e. 13 weeks.
Backward pass
The backward pass calculates the latest date in which the activity may be started and completed without
delaying the end date of the project. It is assumed that the latest finish date for the project is the same as
the earliest finish date.
- The latest completion date for the activities G and H is assumed to be week 13.
- Activity H must therefore start at week 11 at the latest (13-2) and the latest start date for activity G is
week 10 (13-3).
- The latest completion date for activities C and D is the latest date at which activity H must start – that
is week 11. They therefore have latest start dates of week 8 (11-3) and week 7 (11-4) respectively.
Same logic applies for Activities E and F and A.
- Activity B must be completed by week 7 (the latest start times for both activities D and E) so its latest
start is week 3 (7-4). In cases where say D and E have different start dates, then B should be
completed in the earliest start date of the two.
- The latest start date for the project start is the earliest of the latest start dates for activities A, B and F.
This is week zero.
Critical Path
There is at least one path through the network that defines the duration of the project known as the critical
path. Any delay to any activity on this critical path will delay the completion of the project.
The difference between an activity’s earliest start date and its latest start date is known as ithe activity’s
float – a measure of how much the start or completion of an activity may be delayed without affecting the
end date of the project. Any activity with a float of zero is critical in the sense that any delay in carrying
out the activity will delay the completion date of the project as a whole. There will always be at least one
path through the network joining those critical activities – the critical path.
The significance of the critical activity is two-fold.
15
In managing the project, we must pay particular attention to monitoring activities on the crotical
path so that the effects of any delay or resource unavailability are detected and corrected at the
earliest opportunity.
In planning the project, it is the critical path that we must shorten if we are to reduce the overall
duration of the project.
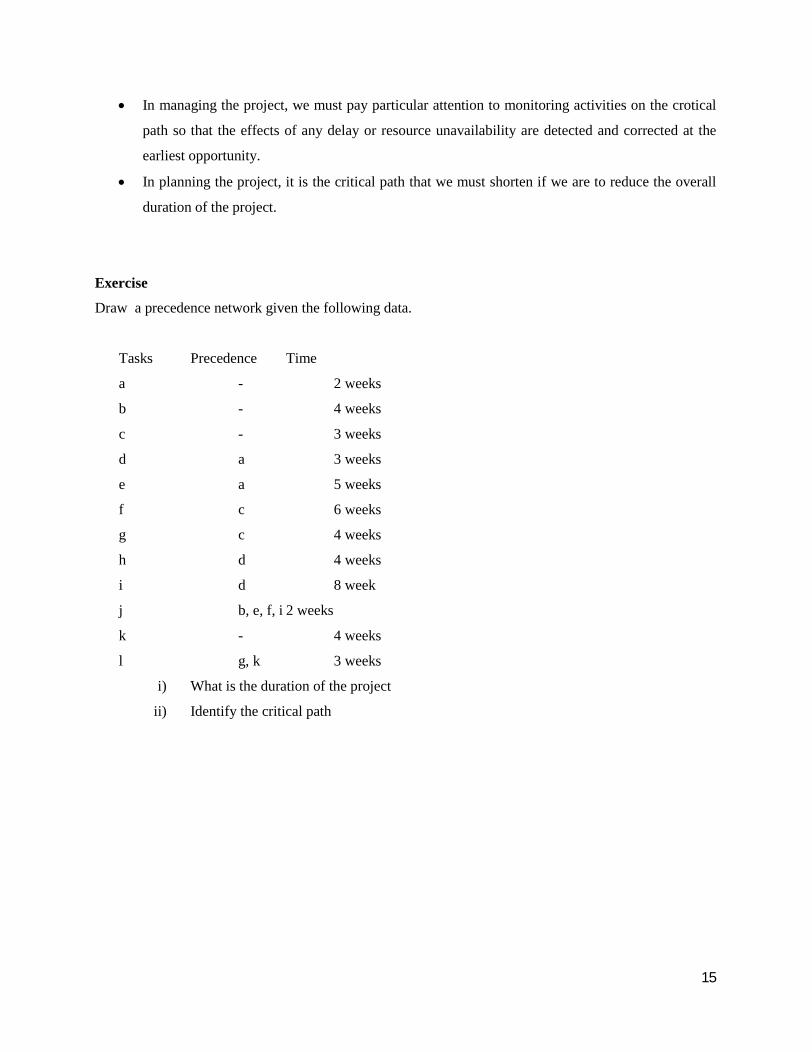
Exercise
Draw a precedence network given the following data.
Tasks Precedence Time
a - 2 weeks
b - 4 weeks
c - 3 weeks
d a 3 weeks
e a 5 weeks
f c 6 weeks
g c 4 weeks
h d 4 weeks
i d 8 week
j b, e, f, i 2 weeks
k - 4 weeks
l g, k 3 weeks
i) What is the duration of the project
ii) Identify the critical path

16
COST MANAGEMENT
Cost management is the completion of the project management triple constraint of cost, schedule, and
scope. Each of these must be completed in order to complete the project on time and on budget and to
meet all of the customer’s expectations. In order to meet the cost goals of the project, the project must be
completed within the approved budget.
It is important to consider the whole life cycle of a project when costing as opposed to up to project
completion and acceptance. Guarantees, warranties, and ongoing services that have to be performed
during the life of the project must be considered.
In order to determine the project cost accurately enough to be considered the project cost baseline, a
bottom-up estimate must be made. Using the WBS, each activity is costed and all added together to give
the final estimate cost. When they are added together, some of the overestimates will cancel out some of
the underestimates
Cost Estimating
Cost estimating is done throughout the project and their accuracy depends on the stage at hand e.g.:
‘‘order of magnitude’’ estimate is performed at the beginning to allow the project to go on, followed by
others.
Order of magnitude estimates: accuracy of _50 percent to _100 percent.
conceptual estimates: accuracy of _30 percent to _50 percent.
Preliminary estimates: accuracy of _20 percent to _30 percent.
Definitive estimate: accuracy of _15 percent to _20 percent.
Finally, the control estimate of _10 percent to _15 percent is done.
Types of estimates
Several types of estimates are in common use. Depending on the accuracy required for the estimate and
the cost and effort that can be expended.
Top-Down Estimates: Used to estimate cost early in the project when information about the project is
very limited. The term top down comes from the idea that the estimate is made at the top level of the
project e.g. the project itself is estimated with one single estimate.

17
Bottom-Up Estimates: Used when the project baselines are required or a control type of estimate is
needed. These types of estimates are called ‘‘bottom up’’ because they begin by estimating the details of
the project and then summarizing the details into summary levels.
Analogous Estimates: Analogous estimates are a form of top-down estimate. This process uses the actual
cost of previously completed similar projects to predict the cost of the project that is being estimated.
Parametric Estimates: Parametric estimates are similar to analogous estimates in that they are also top-
down estimates. The process of parametric estimating is accomplished by finding a parameter of the
project being estimated that changes proportionately with project cost. Mathematically, a model is built
based on one or more parameters.
Control Estimates: Control estimates are of the bottom-up variety. This is the type of estimate that is
used to establish a project baseline or any other important estimate. In a project, the WBS can be used as
the level of detail for the estimate.
Cost Budgeting
Cost budgeting is the process of allocating cost to the individual work items in the project. Project
performance will be determined based on the budget allocated to the various parts of the project. The
result of the cost budgeting process will be to produce the cost baseline of the project.
The cost baseline for the project is the expected actual cost of the project plus the expected value for
risks. A contingency budget is set up for the risks that can be identified but may or may not take place.
The management reserve is money that is budgeted for the project for risks that are not even identified but
where through experience or even intuitive insight we feel that the money will be needed
.
Cost ControlCost control is the process of controlling the project cost and taking corrective action when the control
indicates that corrective action is necessary. It is important that our cost control system be thoroughly
understood by those who are measuring with it as well as by those who are being measured. Inappropriate
responses to cost and schedule variances can result in serious quality problems and higher than acceptable
risk levels.

18
Earned Value Reporting:
This is the most commonly used method of performance measurement and project control currently. Its
popularity is attributed to the fact that it reports performance to cost and performance to schedule in one
report.
In any reporting system, the principle is to set some standard, measure the actual performance to that
standard, and then report on the observed differences. The earned value reporting system uses the planned
budget and schedule and then measure the actual progress in the budget and schedule.
Cumulative Reporting:
Earned value reports are cumulative reports. The values collected for the current reporting period are
added to the values from the last reporting period, and the total is plotted.

19
QUALITY MANAGEMENT
Quality management will include all the work that is necessary to ensure that each of the objectives of the
project is met. Quality should be concerned with prevention rather than detection since the cost of
preventing a defect is much less than the cost of finding a defect and correcting it. It is worse if a defect is
not found early hence having to correct it much later.
Costs and schedule are two out of the triple constraint triangle. Quality management forms the third side.
Stakeholders should get what they pay for, not more, not less. The quality of the item means that it is
indeed what it was intended to be. Project quality management addresses both the quality of the project
and the quality of the product that is produced.
There are three processes for quality management: quality planning, quality assurance, and qualitycontrol.
- Quality planning function is the process that determines which quality standards should be usedto accomplish the goal of ensuring that the scope of the project fulfills the stakeholders’expectations.
- Quality assurance function is a process that monitors the overall ability of the project to meet theexpectations of the stakeholders. The purpose of the quality assurance function is to provide theconfidence that the project will have the proper controls to be able to meet the standards that areexpected by the stakeholders.
- Quality control function is the process used to measure the specific items that must be monitoredto determine that the project will meet the stakeholders’ expectations
Quality Planning
This involves identifying all of the standards that are relevant to the project. For environmental issues, all
government regulations, rules, standards, and guidelines specific to the specific project must be
considered. Generally, this is the common policy that will be used by all projects that the company will
accomplish. Each project and each interrelated project must modify the guidelines and gain approval on
changes that will be required for a particular project.
Quality AssuranceThis is the application of planned and systematic quality activities to ensure that the project will employ
all processes needed to meet all stakeholder expectations and provide the confidence that the product of
the project will fulfill the requirements of quality.

20
- Quality audits are performed to review certain important areas of the project. Audits make it
possible to determine what is happening in the project and whether the project quality is meeting
the standards that were determined in the quality plan.
- The quality assurance function includes the means to continuously improve the quality of future
projects as well. Lessons learned from one project are applied to the quality plans of future
projects so that there can be an ever-improving level of quality in projects completed by the
organization.
Quality ControlThe function of quality control is to monitor specific project results to ensure that the results match the
standards that were set for the project. The quality control function utilizes a number of techniques to
accomplish this. Many of these tools and techniques are rooted in the concepts of probability and
statistics.

21
Human Resources Management
This is necessary so as to make the most efficient use of the project human resources. This includes all of
the people involved in the project— the stakeholders, sponsors, customers, other departments, the project
team, subcontractors, and all others.
Organizational planning involves the organizing of the human resources. These are the roles,
responsibilities, and relationships of the people who are on the project team. HRM takes place throughout
the project.
Staffing Plan
A functional manager (responsible for a unit in the project) must have a staffing plan that allows him or
her to know where the people in the functional organization are committed. If these commitments are not
organized, the utilization of the human resources will be poor. A staffing plan for the functional manager
is similar to the project schedule, except that instead of showing the schedule for each task in the project,
it shows the schedule for each resource in the functional manager’s responsibility.
Training Plan
Sometimes the project work requires skills that are not available. In these situations it may be necessary
for a project to accept a resource who lacks the proper training for the work. A training plan is necessary
to support the training for this type of individual.
Organization Chart
The organizational charts show the reporting hierarchy from the bottom of the project organization to the
project manager. It is important that these charts be circulated widely so that any misunderstandings about
who reports to whom can be avoided.
MotivationMotivated employees come to work every day and produce high quality work. Employees who are not
motivated have high absenteeism, produce lower quality work, and actually work a smaller percentage of
the time.
Procedures vs. Motivation: Research in the areas of procedures and motivation show that the highest
performance was in companies that improved on both. A certain amount of proceduralization in
22
combination with the creation of a motivational environment created the highest performing
organizations.
Expectancy Theory: To a large extent people become or perform according to what is expected of them.
In project management, this concept can be applied by treating people with encouragement, giving them a
sense of recognition and achievement, and giving praise publicly and criticism privately.
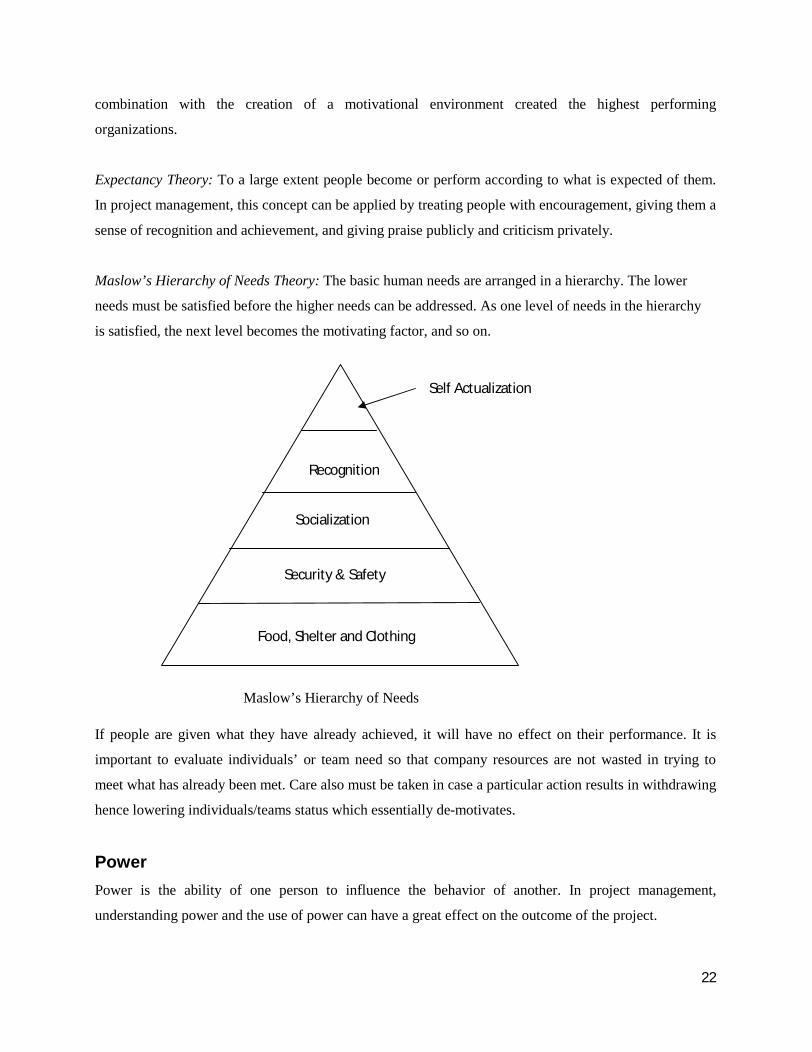
Maslow’s Hierarchy of Needs Theory: The basic human needs are arranged in a hierarchy. The lower
needs must be satisfied before the higher needs can be addressed. As one level of needs in the hierarchy
is satisfied, the next level becomes the motivating factor, and so on.
If people are given what they have already achieved, it will have no effect on their performance. It is
important to evaluate individuals’ or team need so that company resources are not wasted in trying to
meet what has already been met. Care also must be taken in case a particular action results in withdrawing
hence lowering individuals/teams status which essentially de-motivates.
PowerPower is the ability of one person to influence the behavior of another. In project management,
understanding power and the use of power can have a great effect on the outcome of the project.
Food, Shelter and Clothing
Security & Safety
Socialization
Recognition
Self Actualization
Maslow’s Hierarchy of Needs

23
Forms of Power
Coercive : is based on the idea in the mind of the person being influenced that the person having the
influence has the ability to inflict punishment or pain. This pain will be unpleasant, and it will be more
unpleasant than doing the task.
Reward power: is based on the idea in the mind of the person being influenced that the person having the
influence has the ability to administer some sort of reward. This reward will be pleasant, and it will be
more pleasant than any unpleasantness associated with doing the task.
Referent Power: Referent power is based on the idea in the mind of the person being influenced having a
strong desire to identify with the person influencing. A person who leads others by virtue of his or her
charisma has this type of power.
Expert Power: Expert power is based on the idea in the mind of the person being influenced that theperson having the influence has this influence based on special knowledge or ability.
LeadershipTheory X and Theory Y ManagersDouglas McGregor’s theory of X and Y managers says that there are two kinds of managers: type X and
type Y.
Type X managers think that all people are basically lazy and that unless they are threatened or in some
way forced to do work, they will not do any work. These managers direct work to be done and do not
allow very much participation in any decision making, because they feel that the participation by the
workers would only lead to less work being done.
Type Y managers believe that people will do a good job for the sake of doing it. They believe in
participative management and sharing information with the workers. These managers will also listen to
problems that are brought up by their staff.
24
Communications Management
The project team must have a communication plan that determines which items of information need to be
communicated to all of the stakeholders of the project. The communications management plan contains
all of the information regarding the format of the reports, frequency of distribution, and the individual
who has the responsibility for generating the reports and distributing them.
Lessons Learned
The lessons-learned document is a document that captures the good and bad things that happened in the
project. It should also contain a recommendation for how to avoid or minimize the bad things and
enhance the good things. The purpose of the document is to serve other project managers working on
future projects. The lessons-learned documents are an excellent starting place for risk identification.
Databases can be constructed to classify and store lessons-learned data to simplify the lookup process.
Barriers to Communications
There can be many barriers to communications. Messages can be blocked or distorted, and as a result,
their meaning can be changed considerably.
Improving CommunicationsThe following guidelines will help improve your communications:
- Make the Message Relevant for the Receiver
- Reduce the Message to Its Simplest Terms
- Organize the Message into a Series of Stages
- Repeat the Key Points
Verbal and Written CommunicationsVerbal and written communications each have their place, and it is important that the correct medium
be used for each communication.
Verbal communications are faster than written ones; they allow us to keep the message simple and present
one thought at a time to the listener. Because verbal communications are two way, we are able to get
feedback from the receiver before going on. If the feedback coming from the receiver does not confirm
that he or she got the message, the message can be modified and the point made in another way.
Questions can be raised by the receiver to help clarify the point.
Written communications can be more detailed than verbal ones and can be used to explain something that
is quite complex and requires more explanation than the receiver can absorb in a short verbal exchange.
25
The written communication can be better organized than a verbal communication, and if it is properly
organized, the receiver is able to go back and review material already read.
Formal and Informal CommunicationsFormal Communications
Project managers and members of their project teams are frequently required to make formal
presentations to their managers, their customers, and various other stakeholders in the project. In order to
accomplish this, it is necessary for them to have good presentation skills.
Formal communications can also be via, video and audio conferencing and e-mail. It is also possible to
share project data from various parts of a project located in remote parts of the world including combining
with other project data through the Internet
Informal CommunicationsA lot of communication in organizations is informal. This does not require strict adherence to procedure
and can take place almost anywhere. However, care must be taken since informal communication
becomes difficult if the information has to be referred to. The following must be formally communicated:
- When major milestones in the project are being passed
- Agreements with all the stakeholders
- Making authorized project changes
As the number of persons involved in a decision is increased, the need for formal communications
increases.

26
RISK MANAGEMENT
Introduction
- A risk is an uncertain event that has a positive or negative effect on at least one project objective.
- All risks have causes.
- All risks have uncertainty associated with them and all risks have an impact associated with them.
The impacts can affect the project baselines of cost, schedule, and scope.
- The risk may also affect activities in multiple areas of the project as well as activities outside of
the project.
- Risks are justified by the benefits that come as a result of taking them
- In project risk there are many things that can go wrong in the course of the project. The potential
benefits should justify the risks that are taken.
- Risks can have a positive or negative effect. They can produce benefits for the project, or they
can produce loss for the project.
- Risks can be divided into known and unknown risks. Known risks are those risks that can be
identified. Unknown risks are those that cannot be identified
When to Do Risk Management- Risk management must be done during the whole life of the project.
- When risks are identified, they should be recorded in a risk management file or folder so that they
can be dealt with later in the project.
- As time goes by and progress is made on the project, the risks need to be reviewed, and the
identification process must be repeated for the discovery of new risks. As the project advances,
some risks disappear. Other risks that were not thought of earlier will be discovered.
The Risk ProcessThe risk process is divided into six major processes:
i) Risk management planning
ii) Risk identification
iii) Risk assessment
iv) Risk quantification
v) Risk response planning
vi) Risk monitoring and control

27
Risk categories
• Risk types to be found on Project
– those caused by the inherent difficulties of estimation
– those due to assumptions made during the planning process
– those of unforeseen (or at least unplanned) events occurring
• Estimation errors
– some tasks are easier to estimate than others
• manual writing is a reasonably straight forward task
• program testing and debugging may not be
– analysing historic data for similar things can help with deciding the level of
accuracy to be assigned to a particular estimation
• Planning errors
– assumptions are used when planning, if the assumption are wrong then the plan is
at risk
• e.g. the need for rework may not be planned
– when a plan is prepared the assumptions that have been made should listed and
details given to the affect on the plan if the assumption are incorrect
• Eventualities
– some eventualities might never be foreseen
– it has to be accepted that such eventualities do happen, even if they are rare!
– Most unforeseen eventualities generally could have been identified and predicted
• e.g. the required hardware not arriving on time
– plans should be in place to minimise the damage caused by an unforeseen event
Managing risk
• There are various models of risk management
• They are generally similar and identify to main elements
– risk identification
– risk management
• A popular model is the Boehm Risk Engineering Model

28
Risk identification
• Identification of hazards that may affect a project must be the first steps in a risk
assessment
• A hazard is an event that if it occurs may adversely affect the project
• The risk a hazard presents to a particular project must decided
• Checklist are often used to help in identifying hazards
• Knowledge based software is also available to help with the task of hazard identification
• Some hazards will be generic
Other hazards will be project specific
Various categories of factors will need to be considered
o Application factors
the nature of the application
e.g. simple data processing or safety critical system
the size of the system
o Staff factors
e.g. experience and appropriateness of experience
RiskEngineering
Risk Analysis RiskManagement
RiskIdentification
RiskEstimation
Riskevaluation
RiskMonitoring
Risk ControlRisk Planning Risk StaffingRisk Directing

29
skills, turn-over rate, level of absenteeism
Project factors
o definition of the project
o project objectives
o team members understanding of the above
o project quality plan
Hardware / software factors
o the use of new untried hardware carries a higher risk than using existing hardware
o where a system is developed on one type of hardware or software platform for use
on another, then this will carry higher risks
Changeover factor
o An instant change over carries greater risks than an incremental change over
o Parallel running is desirable but has cost implications
Supplier factors
o can be difficult to control suppliers
e.g. installation of phone lines, delivery of equipment
Environmental and social factors
o generally outside the control of the project
e.g. changes in legislation
e.g. public opinion
Health and safety factors
o not generally a major issue for software project when compared to other
engineering projects
o still need to be covered to ensure compliance with statutory obligation
Risk analysis
• Once identified risks should be assessed for their possible affect on the project
• the level of importance of a risk must also be established this is often done by assessing
the risk value
• The importance of a risk is known as the risk value or the the risk exposure
• risk exposure = risk likelihood x risk impact

30
• risk likelihood is the probability of hazard occurring
• risk impact is the effect the resulting problem will have on the project
• Risk impact is estimated in monetary terms
• Risk likelihood is assessed as a probability
• Risk exposure therefore is an expected cost, in a similar manner to a cost-benefit analysis
• Ranking schemes can be used to assess impact and likelihood
• Impact scores should take account of
• the cost of delay to scheduled dates for deliverables
• cost overruns caused by using additional or more expensive resources
• the costs incurred or implicit in any compromise to the system’s quality or functionality
• Managing risk involves the use of two strategies
- reducing the risk exposure by reducing likelihood and impact
- drawing up contingency plans to deal with the risk should it occur
• All attempts to reduce risk exposure will have a cost
• Risk reduction work should be prioritised to obtain best value
• Factor other than risk exposure that should be taken account of when prioritising risk
management
- confidence of risk assessment
- compound risks
- the number of risks
- cost of action
Reducing risks:
• There are five broad categories for risk reduction
- hazard prevention
- likelihood reduction
- risk reduction
- risk transfer
- contingency planning
Risk management:
• Risk Planning
- preparing contingency plans
31
- large project will use a risk manager to do this
• Risk Control
- minimising the affect caused by the problems occurring
• Risk monitoring
- ongoing assessment of the importance and relevance of particular risks
Risk directing and staffing
- the day-on-day management of risk
- risk aversion and problem solving