project report 2016-2017 - drexel...
TRANSCRIPT

PROJECT REPORT 2016-2017
Team Number ECE - 10
Solar Power Forecasting Tool
Team Members Name Department Email Kim Nguyen ECE [email protected] Kara Ogawa ECE [email protected] Stephan Tang ECE [email protected]
Team Advisor(s) Name Department/Company Email Dr. Niebur ECE [email protected]
Group Leader's Signature : ____________________________
Advisor's Signature : ____________________________

2
1. Management Summary
The increase in photovoltaic (PV) panel usage can be attributed to support for green energy and associated financial savings [1]. PV panel usage has lower equipment costs and the ability to sell the excess generated power to the utility. Yet as PV usage increases, there is the growing concern of its output power variability. Storage banks to store and provide power is one expensive solution and greater coordination is another that requires development for faster results. The power industry has begun to use solar forecasts to schedule generation, ensure operating reserves, and maintain flexibility. Different methods can be used to solar forecast depending on the time frame, data available, and planned usage of the forecast [1]. The Drexel Center for Electric Power Engineering seeks to predict future solar power output through the forecasting algorithm method to further understand solar source distribution.
The objective of this project is to develop an accurate solar forecasting algorithm as a method to determine future power output. This is a continuation of the 2015-2016 ECE Team 16 Senior Design Project, the Santino Solar Power Prediction Tool. The hardware comprises of a Master and a Slave Data Acquisition Systems (DAQ). Each DAQ includes a Raspberry Pi and an Arduino which act as a communication between sensors and the web server. The Master DAQ contains a temperature sensor and a pyranometer which measure temperature and solar irradiance around the PV panel on Drexel Main Building roof. The slave DAQ measures open-circuit voltage across the panel in Drexel Power Lab. This real-time data is sent via Drexel’s dragonfly3 Wi-Fi to a Drexel University database and is viewable on a Drexel hosted website. This set of historical data will be used to train the forecasting model. Weather forecast data will also be saved on the database and imported as inputs to said model. Then, the forecasted solar irradiance will be used to determine the solar panel output. The algorithm will be refined and validated as the project continues.

3
Table of Contents
1. Management Summary ......................................................................................... 22. Background and Need for Solution ....................................................................... 43. Problem Statement ................................................................................................ 54. Solutions............................................................................................................... 65. Justification .......................................................................................................... 76. Breakdown of Technical Steps .............................................................................. 87. System Block Diagram ....................................................................................... 118. Circuit Diagram .................................................................................................. 129. Results ................................................................................................................ 1310. Standards and Regulations .................................................................................. 1911. Contributions ...................................................................................................... 2012. Societal Impact of Project ................................................................................... 2113. Timeline ............................................................................................................. 2214. Budget ................................................................................................................ 2315. Acknowledgements............................................................................................. 2416. References .......................................................................................................... 25Appendix A: Student Resumes ..................................................................................... 26
Appendix B: Quad Chart .............................................................................................. 27
Appendix C: User Manual ............................................................................................ 28
List of Figures Fig. 1: NARX network .................................................................................................... 9 Fig. 2: System block diagram ........................................................................................ 11 Fig. 3: Sensor implementation ....................................................................................... 12 Fig. 4: Preparing the Master DAQ ................................................................................. 13 Fig. 5: Forecasted vs. actual irradiance in the first period ............................................... 17 Fig. 6: Forecasted vs. actual irradiance in the second period .......................................... 18 Fig. 7: Timeline schedule .............................................................................................. 22
List of Tables Table 1: Input Test on yearly data set for the NARX model with a delay of 20. ............. 14 Table 2: Delay Test on yearly data set for the NARX model with all the inputs. ............ 15 Table 3: Delay Test on seasonal data for the NARX model with all the inputs. .............. 15 Table 4: Kernel test for the SVMR model. ..................................................................... 16 Table 5: Comparison of SVRM and NARX models. ...................................................... 16 Table 6: Industrial budget .............................................................................................. 23 Table 7: Out-of-pocket budget ....................................................................................... 23

4
2. Background and Need for Solution
The increase in photovoltaic (PV) panel usage can be attributed to support for green energy and associated financial savings [1]. PV panel usage has lower equipment costs and the ability to sell the excess generated power to the utility. Yet as PV usage increases, there is the growing concern of its output power variability. Storage banks to store and provide power is one expensive solution and greater coordination is another that requires development for faster results. The power industry has begun to use solar forecasts to schedule generation, ensure operating reserves, and maintain flexibility. Different methods can be used to solar forecast depending on the time frame, data available, and planned usage of the forecast [1]. The Drexel Center for Electric Power Engineering seeks to predict future solar power output through the forecasting algorithm method to further understand solar source distribution.
The objective of this project is to develop an accurate solar forecasting algorithm as a method to determine future power output. This is a continuation of the 2015-2016 ECE Team 16 Senior Design Project, the Santino Solar Power Prediction Tool. The hardware comprises of a Master and a Slave Data Acquisition Systems (DAQ). Each DAQ includes a Raspberry Pi and an Arduino which act as a communication between sensors and the web server. The Master DAQ contains a temperature sensor and a pyranometer which measure temperature and solar irradiance around the PV panel on Drexel Main Building roof. The slave DAQ measures open-circuit voltage across the panel in Drexel Power Lab. This real-time data is sent via Drexel’s dragonfly3 Wi-Fi to a Drexel University database and is viewable on a Drexel hosted website. This set of historical data will be used to train the forecasting model. Weather forecast data will also be saved on the database and imported as inputs to said model. Then, the forecasted solar irradiance will be used to determine the solar panel output. The algorithm will be refined and validated as the project continues.

5
3. Problem Statement
Balancing authorities, grid operators, and utility companies use forecasted data from all generation plants to allocate power from load forecasts and storage to minimize cost and predict any potential reliability concerns that may occur on the grid. The demand for more renewable resources is heavily increasing due to the need for more environmentally friendly electricity. Solar power with its potential for vast reliability especially in areas of high solar irradiance, stands out as the best option. However, since solar energy depends heavily on weather, which is uncontrollable in nature, accurately forecasting solar power generated is a challenge when trying to integrate solar power into the grid.
This project proposes a solution to the above problem. The solar power forecasting tool will forecast the power generated by the Drexel solar panel feeding to the power lab at a certain point within 24 hours. Forecasting solar power includes two parts: forecasting weather elements and forecasting power generated based on obtained weather data. The proposed solar power forecasting tool utilizes forecasted weather data from a weather channel application program interface (API), together with historical data collected locally in real time to predict future solar irradiance. Solar irradiance will be used to predict power produced by the panel at a certain point in time.

6
4. Solutions
A. Existing Solutions
There are existing models and research into algorithms to predict solar panel production for either short term or long term. These models utilize a hybrid method called the Physic Hybrid Artificial Neural Network (PHANN) which is made up of the deterministic Clear Sky Solar Radiation Model (CSRM) and the stochastic Artificial Neural Network (ANN) method. [2].
The existing solutions do not provide a focus on incorporating localized data into their models with a hardware component which is explored in this project.
B. Proposed Solution
The proposed solution consists of a hardware component, software component and algorithm development. The hardware component consists of two data acquisition systems (DAQs) which serve to collect localized solar panel data, specifically irradiance, temperature, and open circuit voltage. The software component is comprised of a database on Drexel’s server to host the data collected. The website (solar.ece.drexel.edu) displays real-time data and integrates forecasted data from Dark Sky, a weather application programming interface (API). Machine learning will be used to forecast irradiance within a day based on weather data collected from the API and the sensors. The irradiance with the measured voltage are used to find current and calculate power. The two machine learning algorithms compared are the Nonlinear Autoregressive Network with Exogenous Inputs (NARX) method and the Support Vector Machine Regression model (SVMR) method.

7
5. Justification
The particular solution is chosen to provide an end product for the user to remove the unpredictable nature of their solar panels and better understand the expected power output. The hardware serves to provide data specific to each end user in order to minimize variability and error from using data from the internet which can be vary due to the location of data collection.
The software (namely the website and database) provides an interface to view and interact with the data as well as serving a location to store all the collected data. The collected data provides a training set in order to better the algorithm for future predictions.
The algorithm provides a method to predict what the power output of the solar panel is by using localized data to the panel in conjunction with collected data from other sources. This solution would be applicable to various problems and uses as it could be modified for other applications in predictions of solar panel power output.
The various components of the solution are feasible and geared towards the application of individuals though the algorithm has application for utilities and solar companies as well. The hardware component is inexpensive in its current state, however future implementations may become expensive due to the localizing of more sensors to localize the collected dataset instead of pulling from an external source.

8
6. Breakdown of Technical Steps
A. Hardware
The hardware installed on the roof of the Main building by last year’s senior design team had stopped recording data due to unavailability of the database and website. The team prioritized fixing the hardware to begin recording localized data for use in the algorithm. The team observed that the circuit board was not well protected and that wires were exposed in the master box, potentially allowing shorts. It was decided that the team would design and obtain a printed circuit board (PCB) to be connected from the temperature and irradiance sensors to the Arduino. The wireless connection also had connectivity issues so another process was added to the code to ensure connection. A new communication between the two DAQs, the new website and database needed to be established to ensure the continuous data stream to the database. Before the DAQs were installed, the data from the sensors was confirmed to be within an acceptable range and sent successfully to the database.
B. Software
Moving the last year’s website to the Drexel server allows for security and stability, maintaining continuation of data. A new process was added to the website to query observed weather data from the Dark Sky API and store this data in the database. This data is accumulated to prepare for future training of the algorithm once more data is collected from the DAQs. A similar process was created for the forecasted weather data to automate the forecasting process. The forecasting algorithm developed in MATLAB was integrated with the website to display forecasted results and allow comparison to actual outputs. The user manual is also accessible from the website.
C. Forecasting Tool
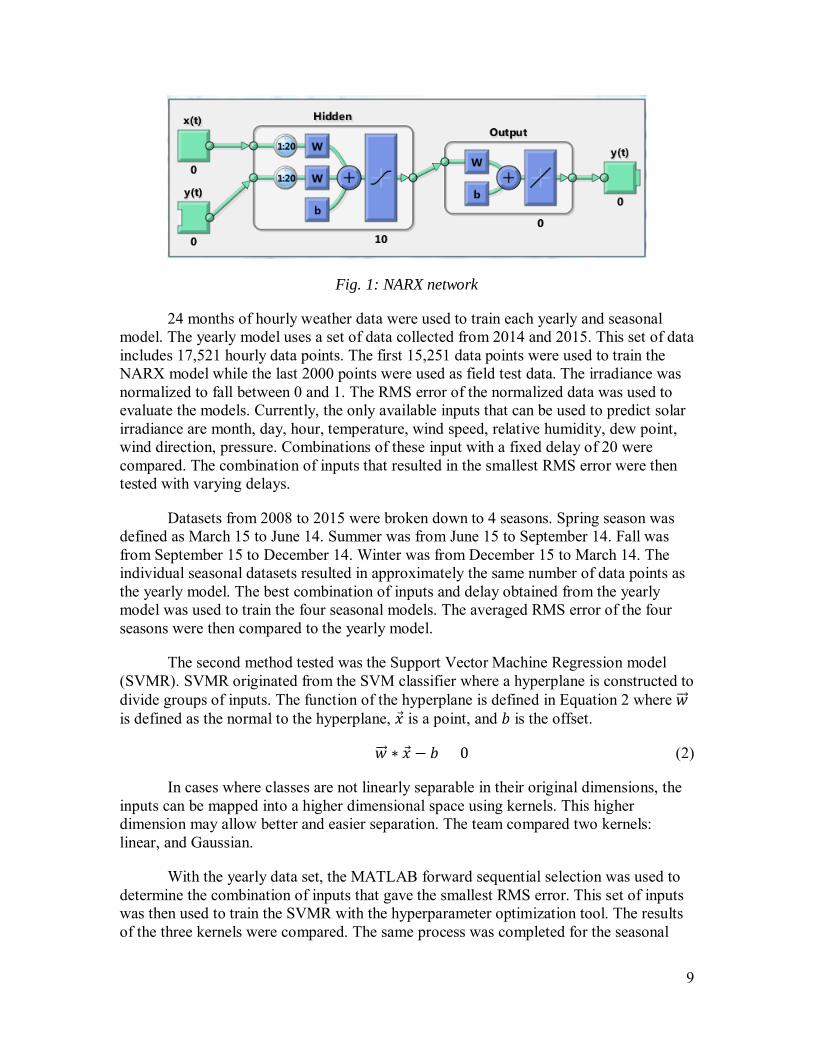
There were two methods tested for developing an algorithm to predict the solar panel power production. The first tested was the Nonlinear Autoregressive Network with Exogenous Inputs (NARX) method. The team utilized MATLAB’s Neural Network Toolbox to train and test different NARX models. NARX models uses a set of inputs, x[n], and a set of delayed outputs, y[n-1], y[n-2], …, y[n-d] where d is a specified delay, to predict an output y[n].
𝑦𝑦[𝑛𝑛] = 𝑓𝑓(𝑥𝑥[𝑛𝑛],𝑦𝑦[𝑛𝑛 − 1],𝑦𝑦[𝑛𝑛 − 2], … ,𝑦𝑦[𝑛𝑛 − 𝑑𝑑]) (1)
The Levenberg–Marquardt algorithm was used during the NARX training process to minimize the error. Though the simulation with Levenberg–Marquardt algorithm took longer than other training functions, it resulted in a lower error.
9
Fig. 1: NARX network
24 months of hourly weather data were used to train each yearly and seasonal model. The yearly model uses a set of data collected from 2014 and 2015. This set of data includes 17,521 hourly data points. The first 15,251 data points were used to train the NARX model while the last 2000 points were used as field test data. The irradiance was normalized to fall between 0 and 1. The RMS error of the normalized data was used to evaluate the models. Currently, the only available inputs that can be used to predict solar irradiance are month, day, hour, temperature, wind speed, relative humidity, dew point, wind direction, pressure. Combinations of these input with a fixed delay of 20 were compared. The combination of inputs that resulted in the smallest RMS error were then tested with varying delays.
Datasets from 2008 to 2015 were broken down to 4 seasons. Spring season was defined as March 15 to June 14. Summer was from June 15 to September 14. Fall was from September 15 to December 14. Winter was from December 15 to March 14. The individual seasonal datasets resulted in approximately the same number of data points as the yearly model. The best combination of inputs and delay obtained from the yearly model was used to train the four seasonal models. The averaged RMS error of the four seasons were then compared to the yearly model.
The second method tested was the Support Vector Machine Regression model (SVMR). SVMR originated from the SVM classifier where a hyperplane is constructed to divide groups of inputs. The function of the hyperplane is defined in Equation 2 where 𝑤𝑤 is defined as the normal to the hyperplane, 𝑥 is a point, and 𝑏𝑏 is the offset.
𝑤𝑤 ∗ 𝑥 − 𝑏𝑏 = 0 (2)
In cases where classes are not linearly separable in their original dimensions, the inputs can be mapped into a higher dimensional space using kernels. This higher dimension may allow better and easier separation. The team compared two kernels: linear, and Gaussian.
With the yearly data set, the MATLAB forward sequential selection was used to determine the combination of inputs that gave the smallest RMS error. This set of inputs was then used to train the SVMR with the hyperparameter optimization tool. The results of the three kernels were compared. The same process was completed for the seasonal

10
data sets using only the Gaussian and Linear kernels and the averaged RMS error was compared to the yearly model.

11
7. System Block Diagram
Fig. 2: System block diagram

12
8. Circuit Diagram
Fig. 3: Sensor implementation

13
9. Results
A. Hardware
The scripts on the data acquisition systems (DAQs) were updated to communicate with the new website and database. Sensor communication was validated.
Since the Master DAQ would be placed on the roof of Drexel University’s Main Building, the Raspberry Pi and Arduino were secured inside the Master DAQ’s weatherproof box and the box was screwed shut. The opening for wires to the sensors was sealed with a flexible outdoor sealant that was chosen to keep water out. The prepared Master DAQ is shown in Fig. 1. The Slave DAQ’s Raspberry Pi was taped shut and exposed wires were covered with electrical tape.
Fig. 4: Preparing the Master DAQ
On February 24th, both DAQs were installed with the assistance of Drexel Facilities and the Drexel Power Lab. On March 18th, the DAQs stopped recording data. The team retrieved the Master DAQ from the roof and after restarting the DAQ, the sensors resumed communication. On April 14th, the team reinstalled the Master DAQ and the sensors again stopped recording data on April 21st. On May 2nd, the team observed the Master DAQ on the roof and determined that the temperature sensor had been water damaged. Corrosion was observed on the sensor and an error between the Pi and the sensor was indicated. Since this incident occurred a few weeks before the report and presentation deadline, the team was unable to fix the hardware.

14
B. Software
The website and database were built on the Drexel server. An automated forecasting tool was desired but unable to be implemented since the COE server does not have MATLAB and Java installed. Therefore, users are required to obtain the MATLAB package and have the ability to run MATLAB to implement the forecast.
Additionally, the NARX simulation tab was created to display the simulation results as discussed below in the Forecasting Algorithm section.
C. Forecasting Algorithm
I. NARX
Table 1: Input Test on yearly data set for the NARX model with a delay of 20.
RMS Error (Train)
RMS Error (Test)
Month Day Hour Temperature Wind speed
Relative Humidity
Dew Point
Wind Direction Pressure
0.1418 0.5634 x
0.1425 0.214 x x
0.139 0.5656 x x
0.1425 0.2074 x x x
0.1387 0.2097 x x x x
0.1398 0.2176 x x x x x
0.1355 0.2187 x x x x x x
0.1372 0.1968 x x x x x
0.1452 0.5627 x x x
0.1387 0.1927 x x x x
0.1424 0.9723 x x x
0.1416 0.2847 x x x
0.1409 0.2059 x x x x x x x x
0.136 0.1893 x x x x x x x x x
The combination of month, day, hour, temperature, wind speed, relative humidity, and wind direction was found to have the smallest RMS error. This set of inputs was used in the delay test.

15
Table 2: Delay Test on yearly data set for the NARX model with all the inputs.
Delay RMS Error (Train)
RMS Error (Test)
0 0.3138 0.3012
1 0.1389 0.6538
5 0.1385 0.1872
10 0.1391 0.1832
15 0.1381 0.187
19 0.1379 0.1969
20 0.1381 0.1892
21 0.1352 0.1794
22 0.1384 0.1943
25 0.1361 0.1966
30 0.1359 0.1828
The best delay found for the yearly data was a delay of 21 with an RMS training error of 0.1352 and a RMS test error of 0.1704.
Table 3: Delay Test on seasonal data for the NARX model with all the inputs.
Delay RMS Error Set Fall Winter Summer Spring Average RMS
0 Train 0.3060 0.2906 0.3234 0.3157 0.3089
Test 0.3219 0.2865 0.3262 0.3444 0.3198
20 Train 0.1280 0.1266 0.1380 0.1414 0.1335
Test 0.2288 0.3165 0.2158 0.2707 0.2580
21 Train 0.1241 0.1250 0.1371 0.1384 0.1312
Test 0.2821 0.2292 0.2702 0.4053 0.2967
30 Train 0.1358 0.1298 0.1402 0.1423 0.1370
Test 0.2309 0.2431 0.2147 0.6896 0.3446
The best delay found for the seasonal data was a delay of 21 with an RMS train error of 0.1312 and a RMS test error of 0.2967. Since the ideal RMS error would have both a small train and test error, the yearly data set was determined to have better results.
II. SVMR
The combination of month, day, hour, temperature, wind speed, relative humidity, and wind direction was found to have the smallest RMS error. A comparison of the kernel functions with the seasonal and yearly data sets is shown in Table 5.
16
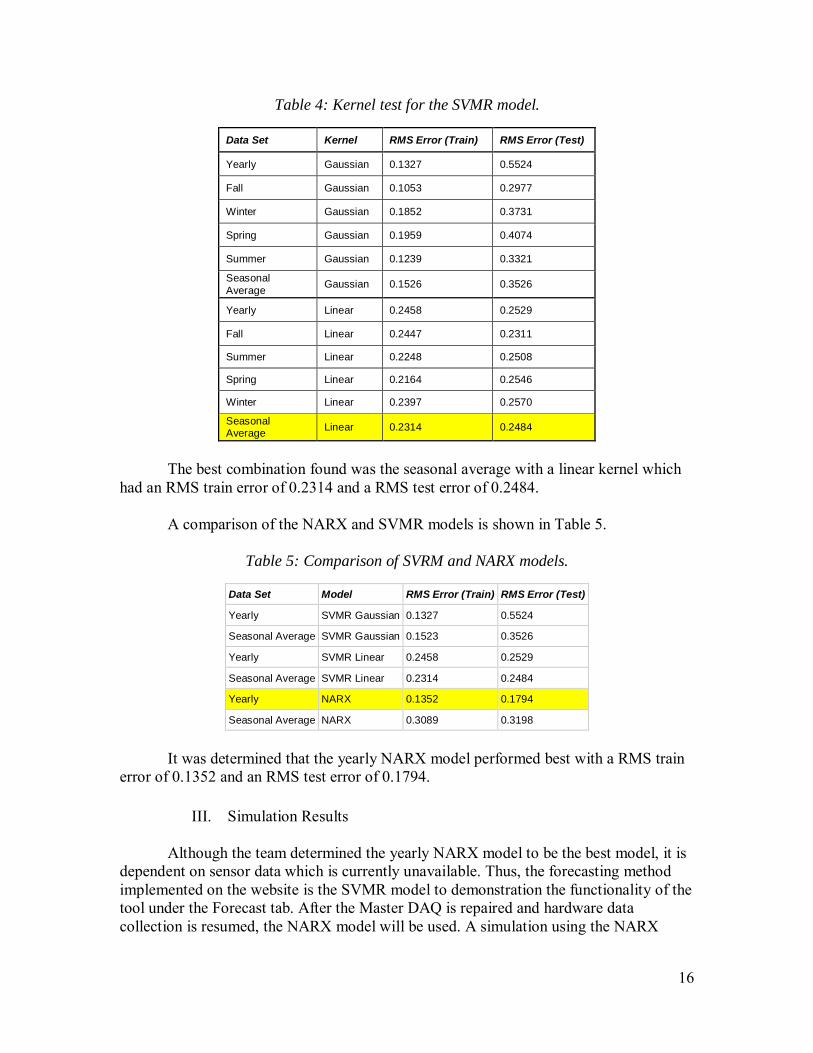
Table 4: Kernel test for the SVMR model.
Data Set Kernel RMS Error (Train) RMS Error (Test)
Yearly Gaussian 0.1327 0.5524
Fall Gaussian 0.1053 0.2977
Winter Gaussian 0.1852 0.3731
Spring Gaussian 0.1959 0.4074
Summer Gaussian 0.1239 0.3321
Seasonal Average Gaussian 0.1526 0.3526
Yearly Linear 0.2458 0.2529
Fall Linear 0.2447 0.2311
Summer Linear 0.2248 0.2508
Spring Linear 0.2164 0.2546
Winter Linear 0.2397 0.2570
Seasonal Average Linear 0.2314 0.2484
The best combination found was the seasonal average with a linear kernel which had an RMS train error of 0.2314 and a RMS test error of 0.2484.
A comparison of the NARX and SVMR models is shown in Table 5.
Table 5: Comparison of SVRM and NARX models.
Data Set Model RMS Error (Train) RMS Error (Test)
Yearly SVMR Gaussian 0.1327 0.5524
Seasonal Average SVMR Gaussian 0.1523 0.3526
Yearly SVMR Linear 0.2458 0.2529
Seasonal Average SVMR Linear 0.2314 0.2484
Yearly NARX 0.1352 0.1794
Seasonal Average NARX 0.3089 0.3198
It was determined that the yearly NARX model performed best with a RMS train error of 0.1352 and an RMS test error of 0.1794.
III. Simulation Results
Although the team determined the yearly NARX model to be the best model, it is dependent on sensor data which is currently unavailable. Thus, the forecasting method implemented on the website is the SVMR model to demonstration the functionality of the tool under the Forecast tab. After the Master DAQ is repaired and hardware data collection is resumed, the NARX model will be used. A simulation using the NARX

17
model with previously collected data is shown on the website under the NARX Simulation tab.
Since there was an interruption in the data collection, the results were plotted in two separate periods. The first period is from February 24th to March 19th with an RMS error of 0.26478.
Fig. 5: Forecasted vs. actual irradiance in the first period
The second period is from April 15th to April 22nd and has an RMS error of 0.25686.

18
Fig. 6: Forecasted vs. actual irradiance in the second period

19
10. Standards and Regulations
[1] Walking-Working Surfaces, OSHA Standard 1910.23, Feb. 10, 1984.
[2] National Electric Code, Article 690 Solar Photovoltaic (PV) Systems, 2014.
[3] Standard for Audio, Video, and Similar Electronic Apparatus - Safety Requirements. UL 60065, 05/11/2012.
[4] Safety Requirements for Electrical Equipment for Measurement, Control, and Laboratory Use - Part 1: General Requirements. UL 61010-1, 09/30/2015.

20
11. Contributions
Kim Nguyen • Forecasting algorithm research• Development of seasonal models• Yearly model optimization• Input test program development
Kara Ogawa • Website development• External point of contact• User manual
Stephan Tang • Hardware modifications/troubleshooting• Algorithm testing• PHP development

21
12. Societal Impact of Project
The Solar Power Forecasting tool would have an extensive impact if completed. The ability to predict the output of a solar panel would remove one of its significant drawbacks of being unpredictable and not constant, resulting in the intermittent services. The tool would serve to allow engineers at the distribution level to predict how solar power will be generated and how much power they need to bring in from other sources.
Since the tool would help improve the function of solar panels, solar power would increase in popularity. Solar power is a source of green energy and renewable. Solar cells produce significantly less pollutants into the environment than other traditional sources of energy, such as coal or oil. This will be beneficial in combating with air pollution and protecting the environment. Production of the solar panels are not as sustainable as they have high initial installation cost; however, this could be offset by the lifetime of the panel. There are other drawbacks as everything comes at a price. As solar power becomes more popular, the market share of other energies decreases. For example, solar energy implementation would reduce the need for coal and consequently, reduce the number of jobs in the coal industry.

22
13. Timeline
Fig. 7: Timeline schedule
10/16 12/16 2/17 3/17 5/17
Database ConstructionWebsite Construction
PCB Design/TestingSensor Communication
Algorithm Approach DesignTest Data Collection
UI Refinement & ValidationWeather API Integration
Software IntegrationAccuracy Testing
Algorithm Refinement & ValidationPerformance Testing
Hardware DocumentationInfrastructure Documentation
Algorithm Documentation
Date in Months/YearTa
sk/R
espo
nsib
ilitie
s

23
14. BudgetTable 6: Industrial budget
Category Expense Cost per Unit Total Units Total Cost
Design
Temperature Sensor $20.00 1 $20.00 Pyranometer $200.00 1 $200.00 Arduino $20.00 2 $40.00 Raspberry Pi $35.00 2 $70.00 Protective Case (Master) $15.00 1 $15.00 Protective Case (Slave) $5.00 1 $5.00
Labor Engineering Labor $80,000.00 3 $240,000.00 Fringe Benefits $18,000.00 3 $54,000.00
Overhead Workspace $15,000.00 12 $180,000.00 Office Supplies $60.00 12 $720.00
Total $475,070.00
Table 7: Out-of-pocket budget
Parts Quantity Status Cost Out-of-Pocket
Voltage Sensor 1 Procured from last group $120.00 $0 Temperature Sensor 1 Procured from last group $20.00 $0 Pyranometer 1 Procured from last group $200.00 $0 Arduino 2 Procured from last group $40.00 $0 Raspberry Pi 2 Procured from last group $70.00 $0 Printed Circuit Board 1 Procured from ECE lab $70.00 $0 Protective Cases 2 Procured from last group $20.00 $0 Sealant & Caulk Gun 1 Purchased $8.37 $8.37 Electrical Tape 1 Procured from ECE lab $5.00 $0 Mini LCD Display 1 Purchased $31.99 $31.99 Wireless Keyboard 1 Purchased $14.83 $14.83 HDMI Cable (6ft) 1 Purchased $5.35 $5.35 Micro USB Cable (6ft) 1 Purchased $5.08 $5.08 Out-of-Pocket Cost $ 65.62

24
15. Acknowledgements
We would like to thank Dr. Dagmar Niebur for her insight and patience as she served as our senior design advisor. We are also thankful to Nicholas Coleman and the CEPE lab, and the Drexel Facilities Staff, specifically Jaime Barbaro, for their assistance guidance, and supervision. Thanks to Dr. Gail Rosen for her knowledge and input in algorithm techniques and Andrew Marx from the COE Computing and Technical Services for his knowledge and assistance in web development.

25
16. References
[1] A. Tuohy, J. Zack, S. Haupt, J. Sharp, M. Ahlstrom, S. Dise, E. Grimit, C. Mohrlen, M. Lange, M. Garcia Casado, J. Black, M. Marquis, C. Collier, “Solar Forecasting: Methods, Challenges, and Performance,” IEEE Power and Energy Mag, vol. 13, no. 6, pp. 50-59, Nov.-Dec. 2015. Available: http://ieeexplore.ieee.org/document/7299804/
[2] A. Dolara, S. Leva, M. Mussetta and E. Ogliari, "PV hourly day-ahead power forecasting in a micro grid context," 2016 IEEE 16th International Conference on Environment and Electrical Engineering (EEEIC), Florence, 2016, pp. 1-5. doi: 10.1109/EEEIC.2016.7555636

26
Appendix A: Student Resumes

Kim Liu3516 Spring Garden Street, Apt. B15
Philadelphia, PA 19125267-816-5905
EDUCATION Drexel University, Philadelphia, PABachelor of Science in Electrical Engineering, Anticipated Graduation: June 2017GPA: 3.81
EXPERIENCE Tangibl Group, Inc., Radnor, PAAssociate Engineer, December 2016 to Present
• Working with PECO to improve reliability of Customers Experiencing Multiple Interruptions(CEMI) pockets
• Analyzing targeted circuits and identify major causes of interruptions• Developing potential solutions to minimize outages experienced by CEMI customers• Conducting cost analysis and drafting product diagram for project approval
Maida Engineering, Inc., Philadelphia, PACo-op, March 2016 to September 2016
• Modeled power system for arc flash studies using SKM Power Tool• Assisted in designing power and control system for a wind tunnel facility• Utilized AutoCAD for plant, power, and single line drawings• Assisted in creating GUI for PLC HMI using FactoryTalk View• Documented project progress, user manuals, reports
Comcast Corporation, Philadelphia, PAProduct Engineering Co-op, April 2015 to September 2015
• Designed and managed the development of new customer outreach tactics to improveefficiency and minimize the cost
• Managed the design and development process of a new customer satisfaction web survey togather customer feedback and decrease the number of escalations
• Maintained and analyzed customer and market data• Generated and audited weekly and ad hoc reports
PJM Interconnection, Norristown, PANERC & Regional Coordination Co-op, March 2014-September 2014
• Updated and maintained references in the CATSWeb Compliance Management System• Updated evidence mapping documents to reflect manual updates • Researched and worked with Subject Matter Expert to find evidence for NERC and NAESB
(regulatory entities)'s standards
ENGINEERING PROJECT Solar Panel Power Prediction Tool, Drexel UniversityTeam Captain, September 2016-Present
• Designing a tool that uses weather data to predict power supplied to Drexel Power Lab bysolar panel
• Programming Raspberry Pi, Arduino, and sensors to collect weather and voltage data• Developing a forecasting algorithm to predict solar irradiance data using machine learning
SKILLS Software: ModelSim, Xilinx, AutoCAD, Creo Parametric, QuickBooks, PSPICE, SQLDeveloper, Microsoft Office SuiteProgramming Language: Java, MATLAB, VHDLLanguage: Fluent Vietnamese
HONORS & AWARDS • Dean's List, 2013-2017• Dean's Scholarship, 2013-2017• Phi Theta Kappa Scholarship, 2013-2017• Dragon Alumni Scholarship, 2013-2017

Kara Lynne A. Ogawa [email protected]•3410HamiltonStreet,Philadelphia,PA19104•(808)292-7387
EducationDrexelUniversity,Philadelphia,PA Graduation:June2017
B.S.ElectricalEngineering(Power),PennoniHonorsCollege,GPA:3.63 StudyAbroad,UniversityofSheffield,UnitedKingdom SeptembertoDecember2014
CertificationPassedtheFEElectricalandComputerExam,September2016
ExperienceDrexelUniversityCenterforElectricPowerEngineering,Philadelphia,PAUndergraduateResearchAssistant,September2016toPresent• DevelopingsoftwareinVisualBasicforfuturesolarmicrogridlaboratoryexperiments• ContributortoIEEEPES2017meetingpaper,“HardwareSetupofaSolarMicrogridLaboratory”• SupportingDrexelUniversityPowerLabresearchandequipmenttesting
NicobarGroup,Shanghai,ChinaTechnicalAnalyst,April2016toSeptember2016• DevelopedscoringsystemsofChinesenuclearcompaniesforclientsconsideringmarketentry• SupportedNicobarandtheU.S.CommercialServiceatChina’slargestnuclearindustryconference• Designedclient-specificmarketingandbrandidentitymaterials
BurnsEngineering,Inc.,Philadelphia,PAAirfieldElectricalEngineeringIntern,April2015toApril2016• DraftedandsupporteddesignofairfieldlightingcircuitschematicsforaJFKrunwayrehabilitation• SizedcableandconduitoncurrentregulatorsforaPhiladelphiaInternationalAirportextension• DesignedgraphicsfortheTransportationResearchBoardAirfieldLEDMaintenanceGuide
PhiladelphiaElectricCompany(PECO),Philadelphia,PAElectricalEngineeringIntern,April2014toSeptember2014• ManagedthePhiladelphiacablehistorydatabaseinMicrosoftAccess• Reviewedthedatabaseforrepeatedfailurestorequestformaintenanceorreplacement• Conductedcircuitpatrolsinthefieldandsubmittedworkorderstoimprovereliability
PearlHarborNavalFacilitiesEngineeringCommandHawaii,Honolulu,HIUtilitiesDivisionIntern,Summer2012andSummer2013• CollectedpowerloaddatausingLotusApproachandExcelforaninterconnectionstudy• Createdastandardoperatingprocedurefortheutilitiesbranch
PublicationsandPresentationsN.S.Coleman,J.Hill,J.Berardino,K.Ogawa,R.Mallgrave,Y.Qian,R.Sandoval,L.Zhu,K.N.Miu,C.Nwankpa,“HardwareSetupofaSolarMicrogridLaboratory,”inIEEEPower&EnergySocietyGeneralMeeting,Chicago,IL,2017.DrexelAmericanSocietyforEngineeringEducationUndergraduateResearchPanelist,November2016
DesignProjectSolarPowerForecastingToolDrexelUniversitySeniorDesignProjectTeamMember,September2016toPresent• DevelopingaPVpowerpredictionalgorithmusingreal-timeandforecastedenvironmentaldata• Creatingdatabaseandwebsitefordatastorageandvisualization:http://solar.ece.drexel.edu/
ComputerSkills:AutoCAD,Java,MATLAB,MicrosoftOffice,PSpice,SolidWorks
InterestsandActivitiesPhotography,tennis,skateboarding,guitar,shortstorywritingMusicianandWomen'sGroupLeader,DrexelStudentsforChrist,2012toPresentVolunteer,EmmanuelHomelessMinistry,2014to2016

Stephan Tang
2510 22nd Street, Philadelphia, PA 19145 - (267) 335-6898 – [email protected]
EDUCATION
2012-Present B.S/M.S Drexel University Philadelphia, PA Major in Electrical Engineering, concentration in Power Anticipated Graduation June 2017
GPA 3.43 WORK EXPERIENCE AND PROJECTS
April 2016- Lockheed Martin MST/RMS Camden, NJ Present Systems Engineering Technical Specifications Co-op
Performed various system traceability tasks on a variety different projects include system definitions, interface block diagrams, and technical data packages
Assisted Senior level engineers with many different project tasks Communicated with government officials regarding technical specifications and details Maintained documentation on a wide range of system changes Created high level systems engineering diagrams
September 2014- Jacobs Engineering Group Philadelphia, PA March 2015 Electrical Engineering Design Intern
Produced and modified construction blueprints in AutoCAD, MicroStation, and Revit for electrical and telecom departments
Performed modeling and calculations for electrical systems such as transient analysis and generator in rush studies utilizing various software such as SKM Power Tools (Arc Flash Evaluation, and CAPTOR)
Collaborated with Professional Engineers (electrical, mechanical, civil, and architectural), drafters across various disciplines (MEP, IT), and architects on small and large scale projects in person as well as global
Attended various seminars offered in order to reinforce and learn new concepts in the field of electrical engineering as well as up and coming technologies and advancements
September 2013- Haverford College Haverford, PA March 2014 Information Technology Support Associate
Provided direct technical support, computer lab configuration, computer hardware configuration and repair Assisted in large scale software deployment in an active directory environment, and network troubleshooting Supported clients of various backgrounds and achievements with a spectrum of knowledge in computing Collaborated in a team to problem solve issues in a swift and prompt manner to minimize client downtime
March 2013- Animatronic Head Engineering Design Project Philadelphia, PA
June 2013 Team Leader and Primary Programmer
Engineered an animatronic head to mimic facial expressions Documented progress using Blogger and composed all reports Designed the electrical circuit components using stepper motors and a motor controller Utilized NI Labview programming to code the movement of the head Manufactured physical parts of the mechanical design using CreoParametric and rapid prototyping
RELATED ACTIVITIES
2012-Present Drexel Harvest Christian Fellowship, Member 2012-Present Drexel Thai Student Association, Founding Member, Marketing/Activities/Co-Fundraising Chair 2013-Present Drexel Society of Asian Scientists and Engineers (SASE), Member AWARDS
March 2013 Drexel University; Dean’s List 2012-Present Drexel University; A.J Drexel Scholarship 2012-Present Drexel University; Pennoni Honors College 2011-Present Spring-Ford High School; National Honor Society Member, National Honor Society ADDITIONAL
Technology: Microsoft Word, Excel, PowerPoint, MATLAB, Creo Parametric (ProE), AutoCAD(2015), Maple 16, Visual Analysis, SKM Power Tools (Arc Flash Evaluation, and CAPTOR), Revit (2014), MicroStation (V8i), JAVA, VBA Languages: Conversational Spanish and Mandarin Chinese

27
Appendix B: Quad Chart

Solar Power Forecasting ToolECE-10
Key Milestones
• Reliably forecast the power produced by a solar panel within 24 hours using localized data
• Improve the durability of the hardware exposed to weather• Move the website and database to the Drexel server for increased
security and continuation of data collection• Improve the existing NARX forecasting model and research
additional predictive methods
Approach• Replace the current circuit board with a PCB, remove all
unused parts, and troubleshoot hardware components• Create a new website and database on the Drexel server and
integrate these changes to all software• Improve NARX inputs and parameters and compare NARX
results with SVR model results• Build seasonal models and compare these to a year long model
• Hardware Completion 01/17• Website Prototype 01/17• Data Collection 02/17• Forecasting Algorithm 03/17• Software Integration 04/17• Testing and Quality Assurance 04/17• Final Documentation 05/17
Breakdown of the three main components (hardware, forecasting algorithm, and server)
This project is a continuation of the Santino Solar Power Forecasting tool created by the 2015-2016 ECE Senior Design Team 16.
Objective

28
Appendix C: User Manual

1 of 16
USER MANUAL
Team Number ECE-10
Solar Power Forecasting Tool
Team Members Name Department Email Kim Nguyen ECE [email protected]
Kara Ogawa ECE [email protected]
Stephan Tang ECE [email protected]
Team Advisor Name Department Email
Dr. Niebur ECE [email protected]

2 of 16
Date : 13 May, 2017 Revision : 00 Prepared by : ECE Group 10: Kim Nguyen, Kara Ogawa, Stephan Tang Distribution : Senior Design 2016-2017

3 of 16
Table of Contents 1. Introduction 4
1.1. Document Identification 4 1.2. System Overview 4 1.3. Document Overview 4 1.4. Reference Documents 4
1.4.1. Acronyms and Abbreviations 4
2. System Description 4 2.1. Introduction 4 2.2. Operational Scenarios 4 2.3. Conceptual Design 5
3. The Solar Array 6 3.1. Location 6 3.2. Technical Details 6
4. Data Acquisition Systems 7 4.1. Scope of Hardware System 7 4.2. Hardware Design 7
4.2.1. Power Supply 7 4.2.2. Script Design 7
4.3. Installation Details 10 4.3.1. Master DAQ 10 4.3.2. Slave DAQ 11
4.4. Hardware Validation 11 4.5. Hardware Calibration Procedures 11 4.6. Hardware Maintenance and Adjustment 11
5. Database 12 5.1. Logging In 12 5.2. Tables 12
6. User Interface Design 13 6.1. Classes of Users 13 6.2. Developer Files 13
6.2.1. Raw File Access 13 6.2.2. General Appearance 13 6.2.3. Webpages 14
7. Software Design 15 7.1. Algorithm Design Process 15
7.1.1. Model Testing for Selection 15 7.2. Software Design Description 15
7.2.1. Software Components 15 7.3. Preconditions for Software 15
7.3.1. Preconditions for System 15 7.4. Running the Software 15

4 of 16
1. Introduction
1.1. Document Identification This user manual describes the design of the Drexel University senior design project, the Solar Power Forecasting Tool. This document is prepared by ECE Group 10 as a final deliverable.
1.2. System Overview The objective of the senior design project is to develop an accurate solar forecasting algorithm as a method to determine future power output for the solar array installation at Drexel University. The system designed for this project consists of a user interface, hardware, and software components. This tool is a continuation of the 2015-2016 ECE Team 16 Senior Design Project, the Santino Solar Power Prediction Tool.
1.3. Document Overview The purpose of this document is to provide a detailed guide for the operation of the solar power forecasting tool. It is to supplement the progress report, which describes the design and work completed on this project.
1.4. Reference Documents The present document is prepared on the basis of the following reference documents, and should be read in conjunction with them.
— “Progress Report, Spring 2016-2017 Solar Power Forecasting Tool”. ECE Group 10, Philadelphia, May 2017.
1.4.1. Acronyms and Abbreviations Table 1-1 lists the acronyms and abbreviations used in this document.
Table 1-1: Acronyms and Abbreviations.
Acronym Meaning DAQ Data Acquisition System SVMR Support Vector Machine Regression Model NARX Nonlinear Autoregressive Exogenous Model
2. System Description
2.1. Introduction The hardware system includes a Master and a Slave Data Acquisition Systems (DAQ). Each DAQ includes a Raspberry Pi and an Arduino which act as a communication between sensors and the web server. The Master DAQ contains a temperature sensor and an irradiance sensor (pyranometer) which measure temperature and solar irradiance around the PV panel on Drexel Main Building roof. The slave DAQ measures open-circuit voltage across the panel in Drexel Power Lab. This real-time data is sent via Drexel’s dragonfly3 Wi-Fi to a Drexel University database. The user interface is the website where this data is viewable. The software system includes the forecasting algorithm based on the support vector machine regression model (SVMR). It uses historical data from the National Renewable Energy Laboratory (NREL) to train the forecasting model and uses real-time data from the hardware system to forecast solar power up to a day ahead.
2.2. Operational Scenarios This system is designed for daily use to collect real-time data and forecast solar power output up to a day ahead. Website users will be able to see forecasted weather data, real-time irradiance, temperature, and solar panel voltage, as well as forecasted solar power output.

5 of 16
Over time with regular training of weather data, the algorithm will be able to predict output power more accurately.
2.3. Conceptual Design The overall breakdown of the hardware, server, and forecasting algorithm is shown in Fig. 1. These components are detailed in the following sections.
Fig. 1. Conceptual Design of System.

6 of 16
3. The Solar Array
3.1. Location The Drexel University solar array was installed for research by the Center for Electric Power Engineering. It is located on the roof of the Main Building and is accessible with assistance from Drexel Facilities through a door on the 4th floor of the Main Building. Since there are only four facilities managers for Drexel University, advance scheduling for roof access is required. The team’s contact was Jaime Barbaro at [email protected]
Fig. 2. Solar array location.
3.2. Technical Details The array consists of 8 Kyocera KD210GX-LP panels. The solar output DC power comes into the Drexel University power lab behind the transfer panel where the slave DAQ can be connected to read voltage. Either outlet beneath the solar panel as shown in red in Fig. 3 can be utilized to power the master DAQ.
Fig. 3. Master DAQ location beneath array.

7 of 16
4. Data Acquisition Systems
4.1. Scope of Hardware System The autonomous DAQ system consists of both a master DAQ at the solar panel on the roof of Main Building and a slave DAQ located in the Power Lab. The master DAQ consists of a temperature sensor and irradiance sensor connected to an Arduino. The Arduino collects the data from the sensors and directs the information to the Raspberry Pi through the Serial Port. The slave DAQ consists of an Arduino measuring voltage across the solar panel voltage terminals. This Arduino is also connected to a Raspberry Pi. Both Raspberry Pi’s send data autonomously via Drexel Wi-Fi dragonfly3 to the pi_get.php script at http://solar.ece.drexel.edu/pi_get.php. The pi_get.php script organizes the data coming in asynchronously from the master and slave DAQs and sends it to the database. Information about accessing website files can be found in the User Interface Design section.
Fig. 4. Data Acquisition System Diagram
4.2. Hardware Design
4.2.1. Power Supply Both the master and slave DAQs are powered through the Raspberry Pi, which requires a 5 V supply through a micro-USB. The power cord can be plugged into a standard U.S. power outlet.
4.2.2. Script Design The master DAQ collects temperature and irradiance data in 5 minute intervals as value0 (PV temperature), value1 (irradiance), and value2 (die temperature) and sends these values to http://solar.ece.drexel.edu/pi_get.php. The PHP script connects to the database and populates a new row with these values as well as a value of -1 for the voltage value. The slave DAQ collects voltage data and also sends this value to http://solar.ece.drexel.edu/pi_get.php. The PHP script recognizes this data as voltage data and instead searches for the previous row with a value of “-1” to swap with the real voltage value.

8 of 16
4.2.2.1. Master DAQ The weatherproofed master DAQ is shown in Fig. 5.
Fig. 5. Inside of the master DAQ.
The original circuit schematic for the temperature and irradiance sensors to the Arduino on the master DAQ is shown in Fig. 6.
Fig. 6. Circuit schematic of master DAQ.
For greater durability, a printed circuit board was built. The schematic for the updated board is shown in Fig. 7 with the same connections of the temperature sensor at A4 and A5 and the irradiance sensor at A0.

9 of 16
Fig. 7. PCB schematic for master DAQ.
4.2.2.1.1. Temperature Sensor The temperature sensor utilized is the Texas Instrument’s TMP006, which detects infrared waves and measures temperature without contact. This sensor was chosen for its low cost and Adafruit support with an Arduino library. It was purchased from Adafruit already mounted on a breakout board. Two temperatures are measured by the temperature sensor: the PV temperature and the die temperature.
The guide from Adafruit is available at: https://learn.adafruit.com/infrared-thermopile-sensor-breakout/overview
4.2.2.1.2. Irradiance Sensor
The irradiation sensor utilized is the Apogee Instruments’ SP-110 Pyranometer. It has a silicon cell photodiode and is fully weatherproof.
4.2.2.2. Slave DAQ
The circuit schematic for the voltage sensor to the Arduino on the slave DAQ is shown in Fig. 8.
Fig. 8. Circuit schematic of the slave DAQ.

10 of 16
4.2.2.2.1. Voltage Measurement
A breadboard with a 267.3 Ω resistor and a 9.9 Ω resistor in series is connected to the solar array terminals in the Power Lab. The Arduino measures a portion of the open circuit voltage across the 9.9 Ω resistor. This resistor is in series with a 267.3 Ω resistor on a breadboard to limit voltage seen at the Arduino input.
4.3. Installation Details
4.3.1. Master DAQ The master DAQ was installed on the roof of Main Building beneath the solar panel. The irradiance sensor was installed 1.5 inches beneath the array and angled with the panel tilt as shown in Fig. 9.
Fig. 9. Irradiance sensor mounted.
The temperature sensor was mounted on a pole 23 inches beneath the array and its edges were covered with electrical tape to further weatherproof it as shown in Fig. 10.
Fig. 10. Temperature sensor mounted.
The full set-up is shown in Fig. 11.

11 of 16
Fig. 11. Master DAQ set-up.
4.3.2. Slave DAQ The Slave DAQ was installed in the Power Lab at the terminals behind the transfer panel as shown in Fig. 12. The Arduino is not pictured.
Fig. 12. Slave DAQ set-up.
4.4. Hardware Validation The temperature measurements can be validated by comparing the measured temperature data to known temperature data.
The irradiance measurements are difficult to validate as irradiance data is not readily available. However, the irradiance sensor is pre-calibrated by Apogee Instruments and measurements can be compared to previously observed values.
The solar panel voltage measurements can be validated by connecting the slave DAQ to a power supply and comparing the measured voltage to multimeter measurements at the terminals. These were within a 5 V range of the multimeter.
4.5. Hardware Calibration Procedures No additional calibration is required once the hardware is installed.
4.6. Hardware Maintenance and Adjustment Routine maintenance can be performed for both DAQs by checking sensor positions and reinforcing weatherproofing as needed. This is more important for the master than the slave DAQ as it is stationary on the roof of Main Building.

12 of 16
5. Database
5.1. Logging In The database credentials can be found in the file “databasecredentials.txt” in the website PHP files folder. The database can be accessed from Drexel University computers or from personal computers via Drexel’s Virtual Private Network (VPN). Users requiring access to these files are advised to contact Andrew Marx/IRT at Drexel University Computing and Technical Services at: [email protected].
Windows users: \\solar.ece.drexel.edu\Sites\Custom ECE Solar Senior Design
Non-windows users: smb://solar.ece.drexel.edu\Sites\Custom ECE Solar Senior Design
The database is accessible at: https://tech.coe.drexel.edu/phpmyadmin/
5.2. Tables The info_storage2 table stores the real-time data sent from the DAQ system. This is displayed on the Ras-Pi Data page on the website.
The info_storage4 table stores the forecasted weather data queried from the DarkSky API. It is triggered by pressing the “Get Forecast” button on the Forecast page on the website.

13 of 16
6. User Interface Design
The server design, incorporating the website user interface, is shown in Fig. 13.
Fig. 13. Server Design Diagram.
6.1. Classes of Users There will be one class of users viewing the website. All users will be able to access the forecasted weather data from the DarkSky API and the sensor data from the hardware DAQ system. The project website is: http://solar.ece.drexel.edu/
6.2. Developer Files
6.2.1. Raw File Access All php files can be accessed from Drexel University computers or from personal computers via Drexel’s Virtual Private Network (VPN). Users requiring access to these files are advised to contact Andrew Marx/IRT at Drexel University Computing and Technical Services at: [email protected]
Windows users: \\solar.ece.drexel.edu\Sites\Custom ECE Solar Senior Design
Non-windows users: smb://solar.ece.drexel.edu\Sites\Custom ECE Solar Senior Design
6.2.2. General Appearance Files to update the header, footer, and pictures are found in the “includes” folder.

14 of 16
6.2.3. Webpages
Fig. 14. Current project website.
6.2.3.1. Drexel Solar/Homepage - index.php
This is the homepage containing a brief description of the project.
6.2.3.2. Forecast - get_forecast.php
This forecast uses SVMR to forecast in real-time.
The “Get Forecast” button calls the weather forecast for the next 48 hours from DarkSky API and stores this information in the database. Request format information can be found here: https://darksky.net/dev/docs/forecast
After the SVMR forecast MATLAB file is run, the Irradiance and Power columns are updated with forecasted irradiance and power values.
6.2.3.3. NARX Simulation – NARX_simulation.php
This is a forecast simulation compiled with data previously collected using the NARX model to forecast. The forecasted data from DarkSky is shown alongside the data from the DAQs and the forecasted data based on the NARX model.
The NARX model was determined to be the best model but is unable to be implemented as the forecasting algorithm since the hardware is not functioning.
6.2.3.4. Ras-Pi Data - info_storage.php
The data from the database received from the DAQs is displayed with the forecasted irradiance and power based on the NARX model.
6.2.3.5. Irradiance - irradiance2.php
Irradiance (W/m2) and voltage (V) measurements collected by the DAQs are plotted together.
6.2.3.6. Progress - progress.php
Progress on the senior design project is briefly documented here.
6.2.3.7. Contact - contact.php
This is a contact form that currently sends queries to [email protected]. It should be updated to reflect the contact information of a current team member.
6.2.3.8. Manual
This is the location to download the most recent User’s Manual.

15 of 16
7. Software Design
The software includes the SVMR model files that use the forecasted and real-time data to predict power from the Drexel University solar array. After the Master DAQ is repaired and the data collection is resumed, the NARX model should be used.
7.1. Algorithm Design Process
7.1.1. Model Testing for Selection Data from the National Renewable Energy Laboratory (NREL) were compiled into yearly and seasonal data sets. Yearly data was divided into four data sets with three months of data to create a season (Fall, Winter, Spring, and Summer) to create the seasonal data sets. Input data for the training set included month, day, hour, temperature, windspeed, relative humidity, dew point, wind direction, and pressure. The comparison of the algorithm RMS train and test errors is shown in Table 2. The yearly NARX model was determined to be the best model. However, it is dependent on sensor data which is currently unavailable.
Table 2. Algorithm Error Comparisons
Data Set Model RMS Error (Train) RMS Error (Test) Yearly SVMR Gaussian 0.1327 0.5524
Seasonal Average SVMR Gaussian 0.1523 0.3526 Yearly SVMR Linear 0.2458 0.2529
Seasonal Average SVMR Linear 0.2314 0.2484 Yearly NARX 0.1352 0.1794
Seasonal Average NARX 0.3089 0.3198
7.2. Software Design Description These components are all required by the MATLAB file, “SVMforecast.m” which is used to forecast solar irradiance, current, and thus output power.
7.2.1. Software Components 7.2.1.1. Model File - SVMmodel.mat The SVMR model file 7.2.1.2. Database Communication - mysql-connector -java-5.1.41-bin.jar The database communication between the MATLAB file, website, and database is established. 7.2.1.3. IV Power Calculation - iv_power_calculation.m, iadj.mat, vadj.mat The IV curve from the Kyocera datasheet was digitized into the iadj.mat and vadj.mat files for current and voltage data points, respectively. The iv_power_calculation.m file plots these points and uses the measured irradiance to predict current. Current and voltage are multiplied to calculate output power.
7.3. Preconditions for Software
7.3.1. Preconditions for System The user running the SVMforecast.m file must be on Drexel Wi-Fi to access the database during the forecast.
7.4. Running the Software 1) Select the “Forecast” tab on the project website, solar.ece.drexel.edu and press “Get
Forecast.” Wait until the word “Ready” appears on the bottom left of the page.
2) Run the SVMforecast.m MATLAB file. Wait until the “Forecast Complete” window appears in MATLAB.

16 of 16
3) Refresh the “Forecast” tab on the project website. The “Irradiance” and “Power” columns will be updated with the forecasted solar irradiance and power data.