project report on a comparison and analysis of ... · a comparison and analysis of...
TRANSCRIPT

PROJECT REPORT
On
A COMPARISON AND ANALYSIS OF MACROINVERTEBRATE
COMMUNITY HEALTH BETWEEN THE TYSON AND ALCAN
BRANCHES (PETTIS CO., MISSOURI)
Prepared by the Central Plains Center for Bioassessment (CPCB) Kansas Biological Survey, University of Kansas, Lawrence, Kansas
Submitted to:
Missouri Department of Natural Resources
Division of Environmental Quality 1110 S College Ave
Columbia, MO 65201
by
R. William Bouchard Jr. Dr. Donald G. Huggins
and Dr. Barbara Hayford
Central Plains Center for BioAssessment Kansas Biological Survey
University of Kansas 2101 Constant Ave.
Lawrence, KS 66047-3759
July 2000
Report Number 110 of the Kansas Biological Survey

Table of Contents Introduction……………………………………………………………………………………....1 Methods and Data Analysis……………………………………………………………………..1 Results…………………………………………………………………………………………….2 Discussion………………………………………………………………………………………...3 References………………………………………………………………………………………..6 Tables……………………………………………………………………………………………..9 Appendix………………………………………………………………………………………...14

1
Introduction The Central Plains Center for Bioassessment (CPCB), a non-regulatory, non-management
research organization established to provide biological expertise for the Central Plains and
United States Environmental Protection Agency Region 7, was asked to participate in the
analysis of invertebrate samples from the Alcan and Tyson Branches in Missouri in order to
identify possible impact. Samples were sorted, identified and analyzed in a double blind manner
in which we were not involved in sampling or aware of sampling methods. Conversely, field
personnel from the Missouri Department of Natural Resources have not participated in
identification and analysis. Herein, we report on the results of this study.
Methods and Data Analysis Four (6 square foot) benthos samples collected in July and August from the Tyson and
Alcan Branches were sorted and identified using Johannsen (1935a, 1935b), Johannsen &
Thomsen (1937), Mackie & Huggins (1983), Merrit & Cummins (1996), Pennak (1978), Pflieger
(1996) and Thorp & Covich (1991). Chironomidae larvae and pupae were slide mounted and
identified to genus using Coffman & Ferrington (1996), Epler (1995), Johannsen (1936),
Johannsen & Thomsen (1937), Wiederholm (1983) and Wiederholm (1986). Nine invertebrate
and six Chironomidae metrics (Table 1) from the “Development of Biological Criteria for the
Macroinvertebrates of the Western Corn Belt Plains Ecoregion” (Donley 1999) were calculated.
These metrics were selected because they have been shown to be reliable measures of
invertebrate communities and stream health in the Midwest. Semi-aquatic and terrestrial
specimens were not included in the calculation of metrics since they are not a part of the aquatic
community or are only partially dependant upon water quality conditions associated with the
stream ecosystem because they often rely on atmospheric oxygen as a primary source of oxygen,
are mobile taxa and may or may not live fully exposed to ambient stream conditions. Specimens
were identified to genus when possible, but due to the difficulty of identifying some immatures
without rearing or comparisons, some taxa (Corduliidae/Libellulidae, Corixidae, Veliidae,
Dytiscidae, Ephydridae, Muscoidea, Stratiomyidae, Tabanidae, Copepoda, Oligochaeta,
Glossiphoniidae, Annelida and Physa) were separated into morphotaxa (distinct taxa in the
collections based on differences in morphological characteristics (Rosenberg & Resh 1996)) and

2
included in the analysis. Specimens that could not be designated as distinct taxa (Tanypodinae)
were only included in total abundance metrics.
Two changes were made to the original list of metrics from the Donley (1999) study.
Sensitive Taxa Richness was replaced with Nutrient and Oxygen Demanding Substance (NOD)
Sensitive Taxa Richness for both the invertebrates and Chironomidae because NOD tolerances
are better at identifying possible point source pollution. Tolerance values were taken from
Huggins and Moffett (1988). Taxa with NOD tolerances below 3 (0-5 scale) were considered
sensitive. A second change was the replacement of Percent Tribe Tanytarsini for Percent
Chironomus riparius (Meigen) because of the small number of Tanytarsini in the collections.
Chironomus riparius is often the dominant insect species found in the effluent of sewage
treatment plants and in streams enriched with organic nutrients (Epler 1995). It’s high tolerance
to sedimentation and low oxygen levels make it’s presence a good indicator of stream
impairment (Ferrington 1990).
The Invertebrate Community Index (ICI) (OEPA 1987) was also computed for each
sample. The ICI was calculated as the sum of individual scores from each of the nine
invertebrate metrics. Each metric was scored on a scale of 1, 3, or 5 and the sum of these scores
produced a value (ICI) between 9 and 45 (9 = most impacted and 45 = least impacted).
Proportional Similarity (Kane 1990) was calculated in order to compare invertebrate
samples between the Alcan Branch and Tyson Branch and to compare samples from the same
site between July and August. This index was calculated to determine how different the sites are
from each other and how much variation is present within the sites at different sampling dates.
The metrics, ICI and Proportional Similarity were calculated using Microsoft Excel.
In order to compare Alcan and Tyson Branch samples, the 15 metrics and the ICI were
graphed as a high/low box plots by combining the values from both dates (Appendix). Box plots
were created in Sigma Plot 2000.
Results A total of 4074 aquatic invertebrates comprising 44 taxa were identified from four
samples (Table 2). Of this total, 247 specimens the dipteran family Chironomidae were
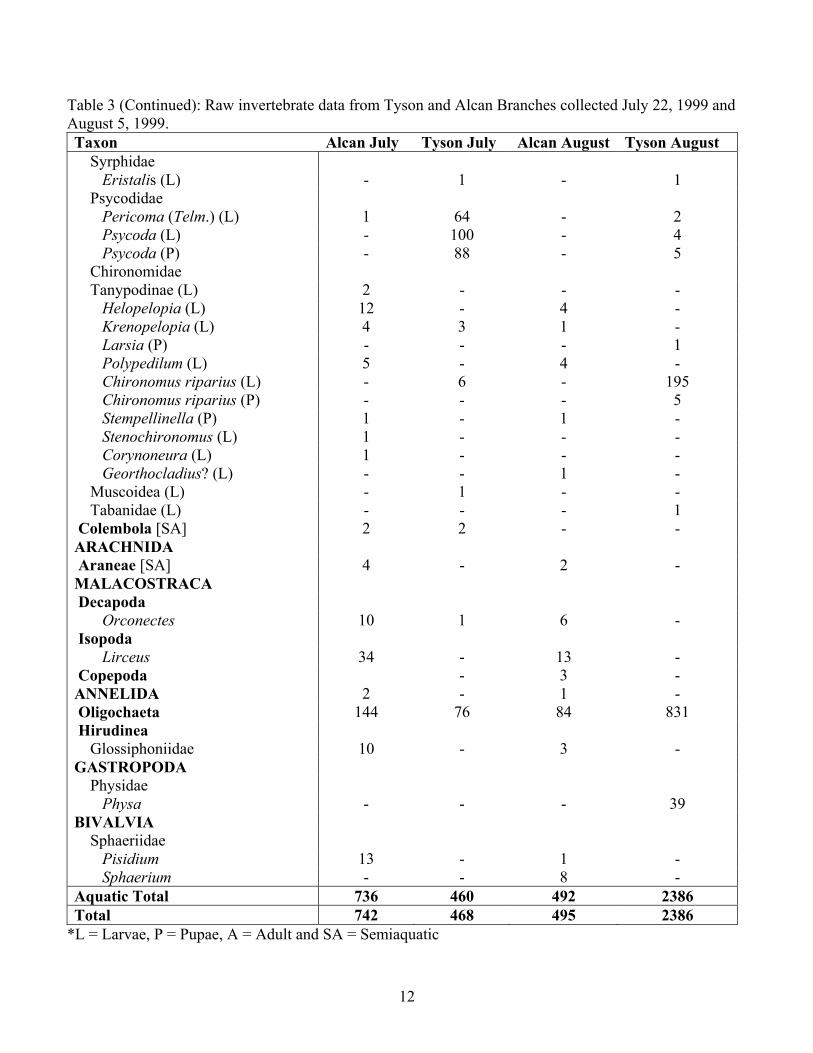
identified and placed in 9 taxa. Tyson Branch was dominated by the dipteran genera Culex
(mosquito), Psycoda (moth fly) and Chironomus (midge-fly) (Table 3). Oligochaete annelids

3
were also abundant taxa in the Tyson Branch. The number of Culex in the Tyson Branch August
sample was greater than the total number of individuals from both Alcan Branch samples. The
Alcan Branch was dominated by Stenacron (mayfly), Argia (damselfly), Stenelmis (riffle beetle)
and Oligochaeta taxa. Taxa Richness, Ephemeroptera, Plecoptera, and Trichoptera (EPT)
Richness, Total EPT Abundance, Margelef’s Diversity Index, Margelef’s Chironomidae
Diversity Index and Shannon’s Chironomidae Diversity Index were highest in the Alcan Branch
during August (Table 2). NOD Sensitive Taxa Richness, Shannon’s Diversity Index,
Chironomidae Richness and NOD Sensitive Chironomidae Richness was greatest in the Alcan
Branch during July. Ephemeroptera Richness was greatest during both collection dates in the
Alcan Branch. Diptera Richness, Total Invertebrate Richness, Percent Dominant Chironomidae
and Percent Chironomus riparius were highest at the Tyson Branch during August. The Alcan
Branch scored a 31 on Invertebrate Community Index for both collection dates while Tyson
Branch scored a 17 and 19 for July and August respectively. The Alcan and Tyson Branch
communities were very different and had a Proportional Similarity between 16 and 21 percent
(Table 4). The Alcan Branch had a similarity of 71 percent between the July and August sample
while Tyson Branch’s similarity was 41 percent between to two collection dates.
Discussion All but three metrics and indices (Diptera Richness, Total Invertebrate Abundance and
Chironomidae NOD Sensitive Taxa Richness) clearly identify impact in the Tyson Branch when
compared to the Alcan Branch. Since neither watershed or water quality data were available to
us, we can not say that the Alcan Branch represents reference conditions, however the
community composition and diversity of Tyson Branch is drastically different from Alcan
Branch and indicative of an impaired community based on the remaining 13 metrics.
In aquatic systems where nutrient loading creates a large amount of biomass, there is a
huge demand for dissolved oxygen (DO) known as Biological Oxygen Demand (BOD) (Novotny
& Chesters 1981). An increase in the BOD from a sewage treatment plant, farm waste or
agriculture often contributes to decreased DO levels and a shift in the biota to a less diverse
community capable of surviving in an environment low in DO (Johnson et al. 1993). Alcan
Branch and Tyson Branch have two very different invertebrate communities as illustrated by the
low Proportional Similarity values found in Table 4. Ephemeroptera and Elmidae, taxa which

4
require a relatively large amount of DO, dominate the Alcan Branch while the Tyson Branch is
dominated by Diptera taxa and Oligochaeta (Table 3) which are capable of surviving at very low
levels of DO. The shift from organisms requiring high levels of DO in the Alcan Branch to those
adapted very low levels of DO in the Tyson Branch indicates that Tyson Branch is a perturbed
ecosystem. The total lack of EPT in the Tyson Branch (Figure 5 & 7, Appendix) is a sign that
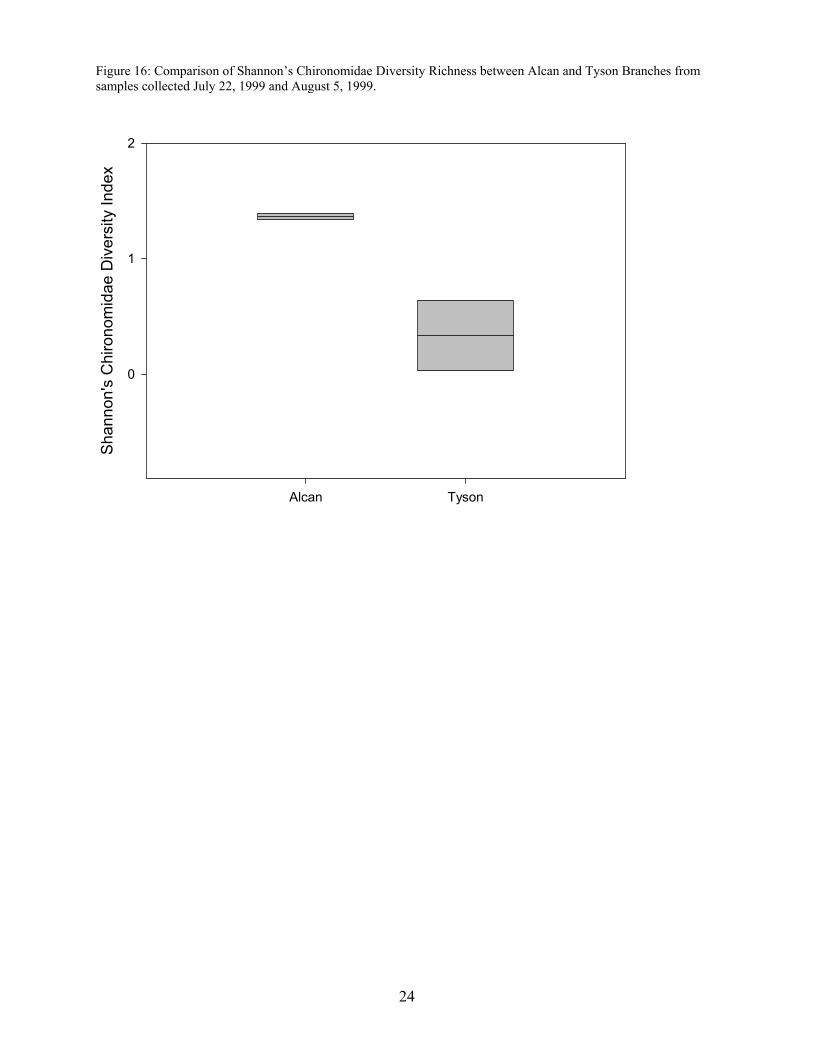
Tyson branch is severely impacted (Gaufin et al. 1974). Diversity indices measure the richness
and evenness of a community thus the decrease in diversity from the Alcan to the Tyson Branch
is strongly suggestive of a disturbed system (Figures 8, 9, 15, & 16, Appendix) (Magurran 1988).
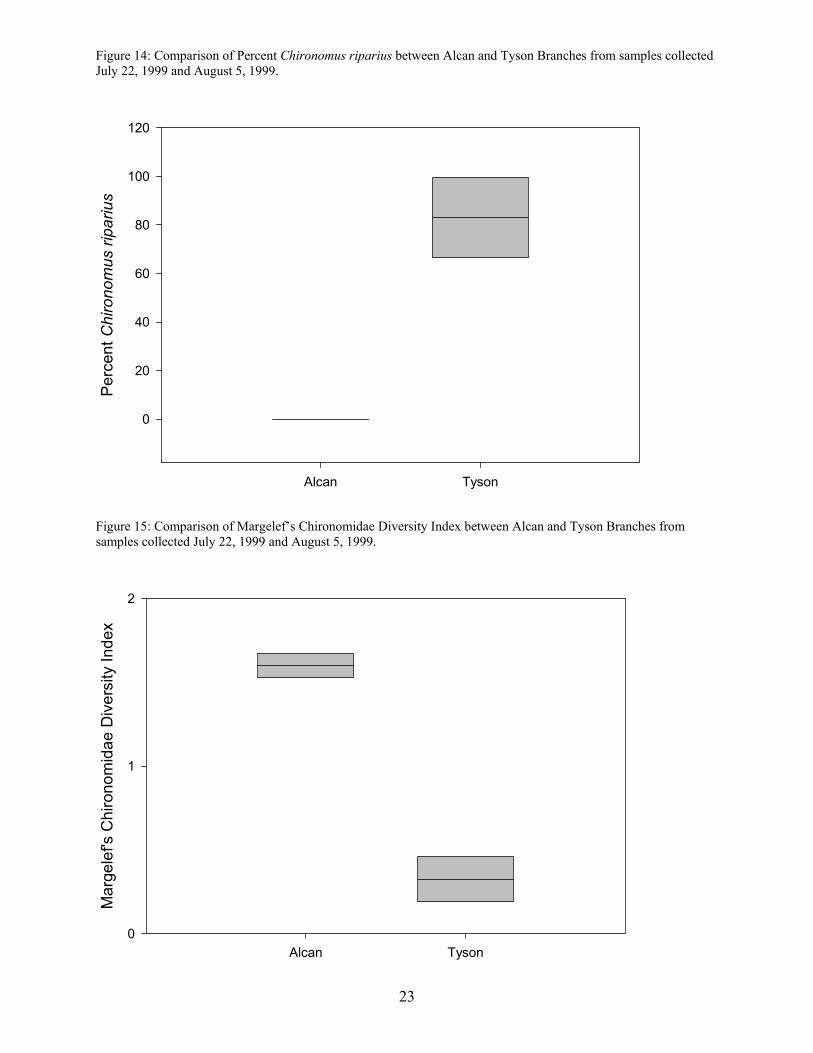
Another sign of perturbation is the abundance of Chironomus riparius (Ferrington & Crisp 1989)
in the Tyson Branch since this species is completely absent from the Alcan Branch (Figure 14,
Appendix). Alcan Branch also scored considerably higher (12-14 points) on the ICI (Figure 10,
Appendix) than did Tyson Branch.
Three metrics were unable to detect impairment because of the nature of the stream
disturbance and sampling methods. Diptera Taxa Richness (Figure 3, Appendix) is affected by
nutrient loading since many dipteran species are adapted to living in low oxygen conditions, thus
Diptera richness can increase in nutrient enriched environments or environments with a large
oxygen demand. Although the Tyson Branch is severely impaired, it is not sterile and is still
able to support a tolerant invertebrate community. Many of the species in the Tyson samples are
indirect air breathers (Culex, Eristalis, Pericoma, Psycoda) (Paine & Gaufin 1956 and Eriksen et
al. 1996) or possess hemoglobin (Chironomus, Oligochaeta) (Weber 1980 and Eriksen et al.
1996) enabling them to survive in aquatic systems with low oxygen levels as a result of nutrient
loading. Total Invertebrate Abundance (Figure 6, Appendix) is a variable metric, which may
increase due to the input of nutrients into the system (Wiederholm 1984). An increase in
abundance accompanied by a reduction in diversity, is often an indication of nutrient loading,
explaining the high abundance in the Tyson Branch August sample. The Chironomidae NOD
Sensitive Taxa Richness metric (Figure 12, Appendix) was unable to detect impairment due to
the small sample size and the lack of intolerant Chironomidae species in both branches. Since
many sensitive chironomid species are small, they may be missed during sampling (Storey &
Pinder 1985 and Ferrington 1990), accounting for the small number of these species in the
samples. Since we are not aware of sampling methods, little more can be said regarding this
problem.

5
Whatever the cause of the perturbation, it is clear that the biological community of Tyson
Branch represents an impaired community when compared to the Alcan Branch and the
literature. Although our biological assessment indicated that decreases in DO due to a high
nutrient load is the probable and principal cause of perturbation in the Tyson Branch, without
further data we can not rule out increased sedimentation, habitat variation or toxic substances
such as ammonia. However, it is unlikely that sediment or habitat alterations alone could cause
the type of drastic invertebrate community shift seen in the Tyson Branch. The Tyson Branch
did not support a diverse aquatic community most often associated with relatively unimpaired
streams. The large number of Diptera in the Tyson Branch probably results in the occurrence of
large numbers of nuisance insects such as mosquitoes and midges. Based on the invertebrate
samples and our assessment of the metrics derived from them, we must conclude that the Tyson
Branch is a very disturbed water body probably suffering from high organic loadings (or nutrient
loading) and severe dissolved oxygen fluxes and oxygen depletions during some parts of the
year.

6
References
Coffman & Ferrington. 1996. Chironomidae. In R.W. Merrit & K.W. Cummins (eds.), An introduction to aquatic insects of North America, 3rd ed. Kendall/Hunt Publishing. Dubuque, Iowa. pp. 635-754.
Donley, S.R. 1999. Development of biological criteria for macroinvertebrates for streams of the
Western Corn Belt Plains ecoregion. M.S. Thesis, University of Kansas. 82 pp.
Epler, J.H. 1995. Identification manual for the larval Chironomidae (Diptera) of Florida. Report for the State of Florida, Department of Environmental Protection. Tallahassee, FL.
Eriksen, C.H., G.A. Lamberti & V.H. Resh. 1996. Aquatic insect respiration. In R.W. Merrit &
K.W. Cummins (eds.), An introduction to aquatic insects of North America, 3rd ed. Kendall/Hunt Publishing. Dubuque, Iowa. pp. 29-40.
Ferrington, L.C. Jr. & N.H. Crisp. 1989. Water chemistry characteristics of receiving streams
and the occurrence of Chironomus riparius and other Chironomidae in Kansas. Acta. Biol. Debr. Oecol. Hung. 3: 115-126.
Ferrington, L.C. Jr. 1990. Assessment of the longitudinal distribution, population densities and
life cycle dynamics of Chironomus riparius in Indian Creek near the middle basin plant. Kansas Biological Survey. Lawrence KS. Report no. 43
Gaufin, A.R., R. Clubb & R. Newell. 1974. Studies on the tolerance of aquatic insects to low
oxygen concentrations. Great Basin Naturalist. 34(1): 45-59. Johannsen, O.A. 1935a. Aquatic Diptera. Part I. Nemocera, exclusive of Chironomidae and
Ceratopogonidae. Mem. Cornell Univ. Agric. Experiment Station. Ithaca, NY. pp. 95. Johannsen, O.A. 1935b. Aquatic Diptera. Part II. Orthorrhapha-Brachycera and Cyclorrhapha.
Mem. Cornell Univ. Agric. Experiment Station. Ithaca, NY. pp. 74. Johannsen, O.A. 1936. Aquatic Diptera. Part III. Chironomidae: Subfamilies Tanypodinae,
Diamesinae and Orthocladiinae. Mem. Cornell Univ. Agric. Experiment Station. Ithaca, NY. pp. 102.
Johannsen, O.A. & L.C. Thomsen. 1937. Aquatic Diptera. Part IV. Chironomidae: Subfamily
Chironomidae and Part V. Ceratopogonidae. Mem. Cornell Univ. Agric. Experiment Station. Ithaca, NY. pp. 98.
Johnson, R.K., T. Wiederholm & D.M. Rosenberg. 1993. Freshwater biomonitoring using
individual organisms, population, and species assemblages of benthic macroinvertebrates. In D.M. Rosenberg & V.H. Resh (eds.), Freshwater biomonitoring and benthic macroinvertebrates. Chapman & Hall. New York, NY. pp. 40-125.

7
Kane, K. 1990. Methods in ecology, 3rd ed. Wm. C. Brown. Dubuque, IA. 315 pp. Huggins, D.G. & M.F. Moffett. 1988. Proposed biotic and habitat indices for use in Kansas
streams. Kansas Biological Survey. Lawrence, Kansas. Report no. 35. Mackie, G.L. & D.G. Huggins. 1983. Sphaeriacean clams of Kansas. Kansas Biological Survey.
Lawrence, KS. Report no. 14. Magurran, A.E. 1988. Ecological diversity and its measurement. Princeton University. Princeton,
NJ. 179 pp. Merrit, R. W. & K.W Cumins (eds.). 1996. An introduction to the aquatic insects of North
America, 3rd ed. Kendall/Hunt Publishing. Dubuque, Iowa. 862 pp.
Novotny, V. & G. Chesters. 1981. Handbook of nonpoint pollution: sources and management. Van Nostrand Reinhold. New York, NY. 555 pp.
OEPA (Ohio Environmental Protection Agency). 1987. Biological criteria for the protection of aquatic life: Volume II. Users Manual for biological field assessment of Ohio surface waters. WQMA-SWS-6. Division of Water Quality Monitoring and Assessment, Ohio Environmental Protection Agency, Columbus, OH.
Paine, G.H. Jr. & A.R. Gaufin. 1956. Aquatic Diptera as indicators of pollution in a Midwestern
stream. Ohio Journal of Science. 56(5): 291-304. Pennak, R.W. 1978. Freshwater invertebrates of the United States, 2nd ed. John Wiley & Sons.
New York, NY. 803 pp. Pflieger, W.L. 1996. The Crayfishes of Missouri. Missouri Department of Conservation.
Jefferson City, MO. 152 pp. Rosenberg, D.M. & V.H. Resh. 1996. Use of aquatic insects in biomonitoring. In R.W. Merrit &
K.W. Cummins (eds.), An introduction to aquatic insects of North America, 3rd ed. Kendall/Hunt Publishing. Dubuque, Iowa. 87-97 pp.
Storey, A.W. & L.C.W. Pinder. 1985. Mesh-size and efficiency of sampling of larval
Chironomidae. Hydrobiologia. 124:193-7. Thorp, J.H. & A.P. Covich. 1991. Ecology and classification of North American freshwater
invertebrates. Academic Press. San Diego, CA. 911 pp. Weber, R.E. 1980. Functions of invertebrate hemoglobins with special reference to adaptations
to environmental hypoxia. American Zoology. 20: 79-101. Wiederholm, T. (Ed.). 1983. Chironomidae of the Holarctic Region. Keys and diagnoses. Part 1.
Larvae. Entomologica Scandinavica Supplement 19: 1-457.

8
Wiederholm, T. (Ed.). 1986. Chironomidae of the Holarctic Region. Keys and diagnoses. Part 2.
Pupae. Entomologica Scandinavica Supplement 28: 1-482. Wiederholm, T. 1984. Responses of aquatic insects to environmental pollution. In V.H. Resh &
D.M. Rosenberg (eds.), The ecology of aquatic insects. Praeger Publishers. New York, NY. 508-557 pp.

9
Table 1: Metrics and indices used in Alcan and Tyson study samples, July 22, 1999 and August 5, 1999 (Modified from Donley 1999). Metric Description of Metric Response to Impact Invertebrate Richness Taxa Richness Total number of taxa Decrease NOD Sensitive Taxa Richness Total number of taxa less tolerant to NOD Decrease Diptera Richness Total number of “true fly” taxa Decrease Ephemeroptera Richness Total number of mayfly taxa Decrease EPT Richness Total number of EPT taxa Decrease Invertebrate Abundance Total Insect Abundance Total number of insects Variable Total EPT Abundance Total numbers of EPT Decrease Invertebrate Diversity Margelef’s Diversity Measure of taxa richness and evenness Decrease Shannon’s Diversity Measure of taxa richness and evenness Decrease Chironomidae Richness Chironomidae Richness Total number of Chironomidae Genera Decrease NOD Sensitive Chironomidae Richness Total number of Chironomidae taxa less tolerant to NOD Decrease Chironomidae Composition % Dominant Chironomidae Measures dominance of most abundant taxon Increase % Chironomus riparius Percent Chironomus riparius Increase Chironomidae Diversity Margelef’s Chironomidae Diversity Measure of Chironomidae taxa richness and evenness Decrease Shannon’s Chironomidae Diversity Measure of Chironomidae taxa richness and evenness Decrease Indices Invertebrate Community Index Measure of insect community health Decrease
* NOD = Nutrients and Oxygen Demanding Substances ** EPT = Ephemeroptera, Plecoptera and Trichoptera

Table 2: Metric scores for Alcan and Tyson Branches collected on July 22, 1999 and August 5, 1999.
Metric
Alcan July
Tyson July
Alcan August
Tyson August
Alcan Ave
Tyson Ave
Total
Taxa Richness 19 13 23 16 21.0 14.5 44 NOD Sensitive Taxa Richness 5 2 4 1 4.5 1.5 8 Diptera Richness 8 9 6 12 7.0 10.5 22 Ephemeroptera Richness 2 0 2 0 2.0 0.0 2 EPT Richness 2 0 3 0 2.5 0.0 3 Total Invertebrate Abundance 736 460 492 2386 614.0 1423.0 4073 Total EPT Abundance 231 0 242 0 236.5 0.0 473 Margelef’s Diversity 2.73 1.96 3.55 1.93 3.14 1.94 * Shannon’s Diversity 1.71 1.54 1.68 1.04 1.69 1.29 * ICI 31 17 31 19 31.0 18.0 * Chironomidae Richness 6 2 5 2 5.5 2.0 9 NOD Sensitive Chironomidae Taxa Richness 2 0 0 0 1.0 0.0 2 % Dominant Chironomidae 46.2% 66.7% 36.4% 99.5% 41.3% 83.1% * % Chironomus riparius 0.0% 66.7% 0.0% 99.5% 0.0% 83.1% * Margelef’s Chironomidae Diversity 1.53 0.46 1.67 0.19 1.60 0.32 * Shannon’s Chironomidae Diversity 1.34 0.64 1.39 0.03 1.36 0.33 * *Total values for diversity and composition metrics are not included because they do not reflect actual communities.
10

11
Table 3: Raw invertebrate data from Tyson and Alcan Branches collected July 22, 1999 and August 5, 1999. Taxon* Alcan July Tyson July Alcan August Tyson August INSECTA Ephemeroptera Baetidae Baetis Heptageniidae
1
-
2
-
Stenacron 230 - 239 - Ondonata Coenagrionidae Argia 28 - 53 - Corduliidae/Libellulidae - 1 - - Hemiptera Corixidae - - 1 - Veliidae - - 2 - Notonectidae Notonecta - - 1 - Gerridae Trepobates - - - 1 Trichoptera Philopotamidae Chimarra - - 1 - Coleoptera (sp 1) [SA] (L) - 1 - - Coleoptera (sp 2) [SA] (L) - 1 - - Dytiscidae (L) 1 - - - Laccophilus (L) - - - 2 Oreodytes (L) - - 1 - Elmidae Stenelmis (L) 210 5 59 - Stenelmis (A) 25 - 2 - Hydrophiloidea [SA] (L) - 4 - - Staphylinidae [SA] (A) - - 1 - Diptera Stratiomyidae (L) - - 1 - Allognosta (L) - - - 2 Ceratopogonidae Atrichopogon (L) - 1 - 1 Bezzia (Palp.) (L) 1 - - - Stilobezzia (P) - - - - Ephydridae (L) - - - 1 Brachydeutera (L) - 5 - 2 Brachydeutera (P) - 2 - - Culicidae Culex (L) - 72 - 982 Culex (P) - 34 - 311
12
Table 3 (Continued): Raw invertebrate data from Tyson and Alcan Branches collected July 22, 1999 and August 5, 1999. Taxon Alcan July Tyson July Alcan August Tyson August Syrphidae Eristalis (L) - 1 - 1 Psycodidae Pericoma (Telm.) (L) 1 64 - 2 Psycoda (L) - 100 - 4 Psycoda (P) - 88 - 5 Chironomidae Tanypodinae (L) 2 - - - Helopelopia (L) 12 - 4 - Krenopelopia (L) 4 3 1 - Larsia (P) - - - 1 Polypedilum (L) 5 - 4 - Chironomus riparius (L) - 6 - 195 Chironomus riparius (P) - - - 5 Stempellinella (P) 1 - 1 - Stenochironomus (L) 1 - - - Corynoneura (L) 1 - - - Georthocladius? (L) - - 1 - Muscoidea (L) - 1 - - Tabanidae (L) - - - 1 Colembola [SA] 2 2 - - ARACHNIDA Araneae [SA] 4 - 2 - MALACOSTRACA Decapoda Orconectes 10 1 6 - Isopoda Lirceus 34 - 13 - Copepoda - 3 - ANNELIDA 2 - 1 - Oligochaeta 144 76 84 831 Hirudinea Glossiphoniidae 10 - 3 - GASTROPODA Physidae Physa - - - 39 BIVALVIA Sphaeriidae Pisidium 13 - 1 - Sphaerium - - 8 - Aquatic Total 736 460 492 2386 Total 742 468 495 2386
*L = Larvae, P = Pupae, A = Adult and SA = Semiaquatic

13
Table 4: Proportional similarity values for Alcan and Tyson Branch samples collected on July 22, 1999 and August 5, 1999.
Alcan July Tyson July Alcan August Tyson August Alcan July - - - - Tyson July 19% - - -
Alcan August 71% 18% - - Tyson August 20% 41% 17% -

14
Appendix: Box plot comparisons of Alcan and Tyson Branches for community metrics and the ICI from samples collected July 22, 1999 and August 5, 1999. Data is comprised of two data points for each stream representing values from each of the two collection dates. Top and bottom lines represent high and low values for a site, respectively, and box midlines represent the median value. Box figures represented as a line are comprised of two data points with the same value.

15
Figure 1: Comparison of Macroinvertebrate Taxa Richness between Alcan and Tyson Branches from samples collected July 22, 1999 and August 5, 1999.
Alcan Tyson
Taxa
Ric
hnes
s
0
5
10
15
20
25
Figure 2: Comparison of Macroinvertebrate NOD Sensitive Taxa Richness between Alcan and Tyson Branches from samples collected July 22, 1999 and August 5, 1999.

16
Alcan Tyson
NO
D S
ensi
tive
Taxa
Ric
hnes
s
0
1
2
3
4
5
6
Figure 3: Comparison of Diptera Taxa Richness between Alcan and Tyson Branches from samples collected July 22, 1999 and August 5, 1999.
Alcan Tyson
Dip
tera
Tax
a R
ichn
ess
0
2
4
6
8
10
12
14

17
Figure 4: Comparison of Ephemeroptera Richness between Alcan and Tyson Branches from samples collected July 22, 1999 and August 5, 1999.
Alcan Tyson
Eph
emer
opte
ra T
axa
Ric
hnes
s
0
1
2
3
Figure 5: Comparison of Ephemeroptera, Plecoptera and Trichoptera (EPT) Taxa Richness between Alcan and Tyson Branches from samples collected July 22, 1999 and August 5, 1999.
Alcan Tyson
EP
T Ta
xa R
ichn
ess
0
1
2
3
4

18
Figure 6: Comparison of Macroinvertebrate Total Abundance between Alcan and Tyson Branches from samples collected July 22, 1999 and August 5, 1999.
Alcan Tyson
Tota
l Abu
ndan
ce
0
500
1000
1500
2000
2500
3000
Figure 7: Comparison of Total Ephemeroptera, Plecoptera and Trichoptera (EPT) Abundance between Alcan and Tyson Branches from samples collected July 22, 1999 and August 5, 1999.

19
Alcan Tyson
Tota
l EP
T A
bund
ance
0
50
100
150
200
250
300
Figure 8: Comparison of Margelef’s Diversity Index between Alcan and Tyson Branches from samples collected July 22, 1999 and August 5, 1999.
Alcan Tyson
Mar
gele
f's D
iver
sity
Inde
x
0
1
2
3
4

20
Figure 9: Comparison of Shannon’s Diversity Index between Alcan and Tyson Branches from samples collected July 22, 1999 and August 5, 1999.
Alcan Tyson
Sha
nnon
's D
iver
sity
Inde
x
0
1
2
Figure 10: Comparison of the Invertebrate Community Index (ICI) between Alcan and Tyson Branches from samples collected July 22, 1999 and August 5, 1999.
Alcan Tyson
Inve
rtebr
ate
Com
mun
ity In
dex
0
5
10
15
20
25
30
35

21
Figure 11: Comparison of Chironomidae Taxa Richness between Alcan and Tyson Branches from samples collected July 22, 1999 and August 5, 1999.
Alcan Tyson
Chi
rono
mid
ae T
axa
Ric
hnes
s
0
1
2
3
4
5
6
7
Figure 12: Comparison of Chironomidae NOD Sensitive Taxa Richness between Alcan and Tyson Branches from samples collected July 22, 1999 and August 5, 1999.

22
Alcan Tyson
Chi
rono
mid
ae N
OD
Sen
sitiv
e Ta
xa R
ichn
ess
0
1
2
3
Figure 13: Comparison of Percent Dominant Chironomidae Taxa between Alcan and Tyson Branches from samples collected July 22, 1999 and August 5, 1999.
Alcan Tyson
Per
cent
Dom
inan
t Chi
rono
nmid
ae T
axa
0
20
40
60
80
100
120
23
Figure 14: Comparison of Percent Chironomus riparius between Alcan and Tyson Branches from samples collected July 22, 1999 and August 5, 1999.
Alcan Tyson
Perc
ent C
hiro
nom
us ri
pariu
s
0
20
40
60
80
100
120
Figure 15: Comparison of Margelef’s Chironomidae Diversity Index between Alcan and Tyson Branches from samples collected July 22, 1999 and August 5, 1999.
Alcan Tyson
Mar
gele
f's C
hiro
nom
idae
Div
ersi
ty In
dex
0
1
2
24
Figure 16: Comparison of Shannon’s Chironomidae Diversity Richness between Alcan and Tyson Branches from samples collected July 22, 1999 and August 5, 1999.
Alcan Tyson
Sha
nnon
's C
hiro
nom
idae
Div
ersi
ty In
dex
0
1
2