project title: carrots: incidence of cavity spot in
TRANSCRIPT
2011 Agriculture and Horticulture Development Board
1
Project title: Carrots: Incidence of cavity spot in
Commercial Crops
Project number: FV 373
Project leader: David Martin, Plantsystems Limited
Report: Annual report, March 2011
Previous report: None
Key staff: Colin Noble
James Martin
Tom Will, VCS
Location of project: England and Scotland
Industry Representative: Martin Evans BCGA
Date project commenced: 01/04/2010
Date project completed (or expected completion date):
31/03/2013
2011 Agriculture and Horticulture Development Board
2
DISCLAIMER: AHDB, operating through its HDC division seeks to ensure that the information contained
within this document is accurate at the time of printing. No warranty is given in respect
thereof and, to the maximum extent permitted by law the Agriculture and Horticulture
Development Board accepts no liability for loss, damage or injury howsoever caused
(including that caused by negligence) or suffered directly or indirectly in relation to
information and opinions contained in or omitted from this document.
Copyright, Agriculture and Horticulture Development Board 2011. All rights reserved.
No part of this publication may be reproduced in any material form (including by photocopy
or storage in any medium by electronic means) or any copy or adaptation stored, published
or distributed (by physical, electronic or other means) without the prior permission in writing
of the Agriculture and Horticulture Development Board, other than by reproduction in an
unmodified form for the sole purpose of use as an information resource when the
Agriculture and Horticulture Development Board or HDC is clearly acknowledged as the
source, or in accordance with the provisions of the Copyright, Designs and Patents Act
1988. All rights reserved.
AHDB (logo) is a registered trademark of the Agriculture and Horticulture Development
Board.
HDC is a registered trademark of the Agriculture and Horticulture Development Board, for
use by its HDC division.
All other trademarks, logos and brand names contained in this publication are the
trademarks of their respective holders. No rights are granted without the prior written
permission of the relevant owners.
The results and conclusions in this report are based on an investigation conducted over a
one-year period. The conditions under which the experiments were carried out and the
results have been reported in detail and with accuracy. However, because of the biological
nature of the work it must be borne in mind that different circumstances and conditions
could produce different results. Therefore, care must be taken with interpretation of the
results, especially if they are used as the basis for commercial product recommendations.

2011 Agriculture and Horticulture Development Board
3
AUTHENTICATION We declare that this work was done under our supervision according to the procedures described herein and that the report represents a true and accurate record of the results obtained. [Name] [Position] [Organisation] Signature ............................................................ Date ............................................ [Name] [Position] [Organisation] Signature ............................................................ Date ............................................ Report authorised by: [Name] [Position] [Organisation] Signature ............................................................ Date ............................................ [Name] [Position] [Organisation] Signature ............................................................ Date ............................................
2011 Agriculture and Horticulture Development Board
4
CONTENTS
Grower Summary ..................................................................................................... 5
Headline.................................................................................................................. 5
Background ............................................................................................................. 5
Summary of the project and main conclusions ....................................................... 6
Financial benefits .................................................................................................. 12
Action points for growers ...................................................................................... 12
Science Section ..................................................................................................... 13
Introduction ........................................................................................................... 13
Materials and methods ......................................................................................... 14
Results .................................................................................................................. 18
Discussion ............................................................................................................ 22
Conclusions .......................................................................................................... 23
Knowledge and Technology Transfer ................................................................... 23
References ........................................................................................................... 24
‘Update entire table’
2011 Agriculture and Horticulture Development Board
5
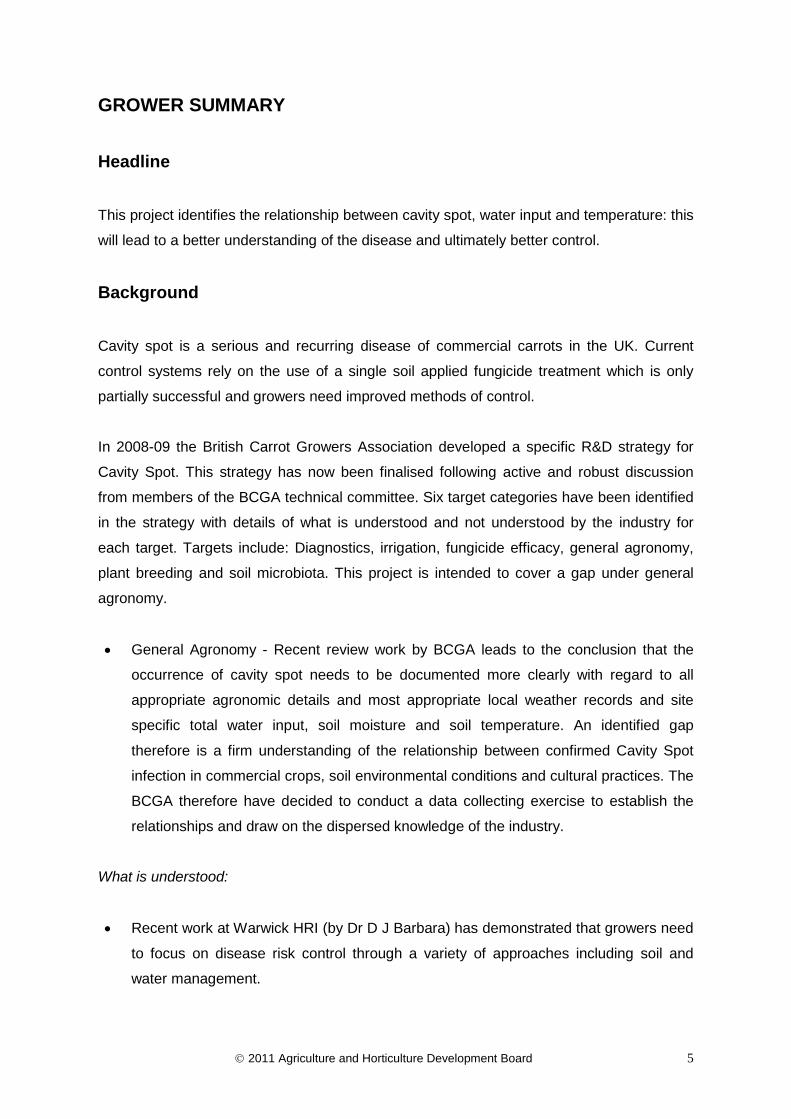
GROWER SUMMARY
Headline This project identifies the relationship between cavity spot, water input and temperature: this
will lead to a better understanding of the disease and ultimately better control.
Background Cavity spot is a serious and recurring disease of commercial carrots in the UK. Current
control systems rely on the use of a single soil applied fungicide treatment which is only
partially successful and growers need improved methods of control.
In 2008-09 the British Carrot Growers Association developed a specific R&D strategy for
Cavity Spot. This strategy has now been finalised following active and robust discussion
from members of the BCGA technical committee. Six target categories have been identified
in the strategy with details of what is understood and not understood by the industry for
each target. Targets include: Diagnostics, irrigation, fungicide efficacy, general agronomy,
plant breeding and soil microbiota. This project is intended to cover a gap under general
agronomy.
• General Agronomy - Recent review work by BCGA leads to the conclusion that the
occurrence of cavity spot needs to be documented more clearly with regard to all
appropriate agronomic details and most appropriate local weather records and site
specific total water input, soil moisture and soil temperature. An identified gap
therefore is a firm understanding of the relationship between confirmed Cavity Spot
infection in commercial crops, soil environmental conditions and cultural practices. The
BCGA therefore have decided to conduct a data collecting exercise to establish the
relationships and draw on the dispersed knowledge of the industry.
What is understood:
• Recent work at Warwick HRI (by Dr D J Barbara) has demonstrated that growers need
to focus on disease risk control through a variety of approaches including soil and
water management.

2011 Agriculture and Horticulture Development Board
6
What is not understood:
• All commercial growers have experiences of disease in their crops and some growers
have tried to relate the occurrence of the disease to their particular circumstances.
However, little data has been collected across the industry on the incidence of disease
in relation to rotations and agronomic conditions. Consequently much that is said
about cavity spot is based on poor evidence and there is little certainty about how
particular rotations or management practices have affected its occurrence and
expression.
This study aims to document, as far as possible, the conditions relating to new outbreaks of
cavity spot which together with site history and site conditions will add considerably to the
knowledge bank and should help identify situations which should be avoided.
Summary of the project and main conclusions Thirty commercial carrot production sites provided by members of the BCGA were
monitored for total water input (precipitation and irrigation), soil moisture and soil
temperature. At each site the incidence and severity of cavity spot disease was established
by sampling prior to harvest and relationships were sought between the recorded site
conditions and the incidence of disease.

2011 Agriculture and Horticulture Development Board
7
Table 1: Sites monitored in 2010
ID Name Longitude Latitude
1 Sherwood Thoresby -1.051829 53.233297
2 FG Caistor -0.359861 53.50699
3 Sherwood Apley Head -1.017921 53.28844
4 KPL Rameldry -3.089274 56.245054
5 HF Norton -0.769297 54.125680
6 Sherwood Carburton -1.093142 53.258428
7 MF Plex Moss Lane -2.992245 53.583655
8 FG Retford -0.983141 53.337364
9 Taylor Hine Heath -2.614129 52.81251
10 VCS Elveden 0.6190 52.3384
11 3M Greenwell 1.4673 52.0992
12 VCS TBG Sutton 1.3688 52.0604
13 VCS Raker 0.8352 52.5271
14 3M Westrope 1.3687 52.0287
15 AG Mayhew 1.2845 52.0137
16 MF Rennacres Lane -2.951787 53.597494
17 Farley Collumpton 3.3977 50.8220
18 WP Cockley Cley 0.6718 52.5864
19 3M Wantisden 1.4500 52.1061
20 TBG Isleham 0.3790 52.3608
21 WP Drayton 1.2376 52.6903
22 TG Houghton 0.6327 52.8154
23 SL Torworth -1.01802 53.368489
24 SL Tichwell 0.5956 52.9338
25 VCS TBG Westrope 1.3784 52.0396
26 HPF Thornton Grange -0.862963 53.906796
27 KPL Edenwood -3.043140 56.293134
28 KPL Raecruick -3.206958 56.275221
29 SL Rainworth -1.070114 53.118082
30 PSL W Pinchbeck -0.2466665 52.837510
At each site an automatic soil moisture station was installed in a representative area of the
field. This consisted of a Remote Transmission Unit (RTU) and SIM set up to use the
GPRS network together with an automatic tipping bucket total water input sensor (resolution
0.2mm per tip) and soil moisture (SM) probe using an SDi12 interface. The SM probe

2011 Agriculture and Horticulture Development Board
8
consisted of a sealed tube containing capacitance sensors at 100, 200 and 300mm depths
and an integrated temperature sensor at the middle level.
The station recorded the total water input (precipitation plus irrigation), soil temperature
(degrees C) and soil moisture (% soil moisture at 3 levels).
Figure 1: Monitoring station showing RTU and total water input sensor
Figure 2: Soil moisture sensor showing insertion into carrot bed alongside rows
Figure 3: Soil moisture sensor showing internal construction
2011 Agriculture and Horticulture Development Board
9
Data was collected from all of the RTUs from the time of installation (normally shortly after
seeding) to just prior to harvest of the crop or just prior to strawing down. The resultant data
file was converted to hourly values and then to daily summaries for analysis.
Crops were sampled when mature and before harvesting or strawing. At each site samples
were collected and washed to reveal any cavity spot lesions. Each sample was recorded for
the incidence of disease lesions (% roots affected) and the severity of the disease (scale 1
to 5)
2011 Agriculture and Horticulture Development Board
10
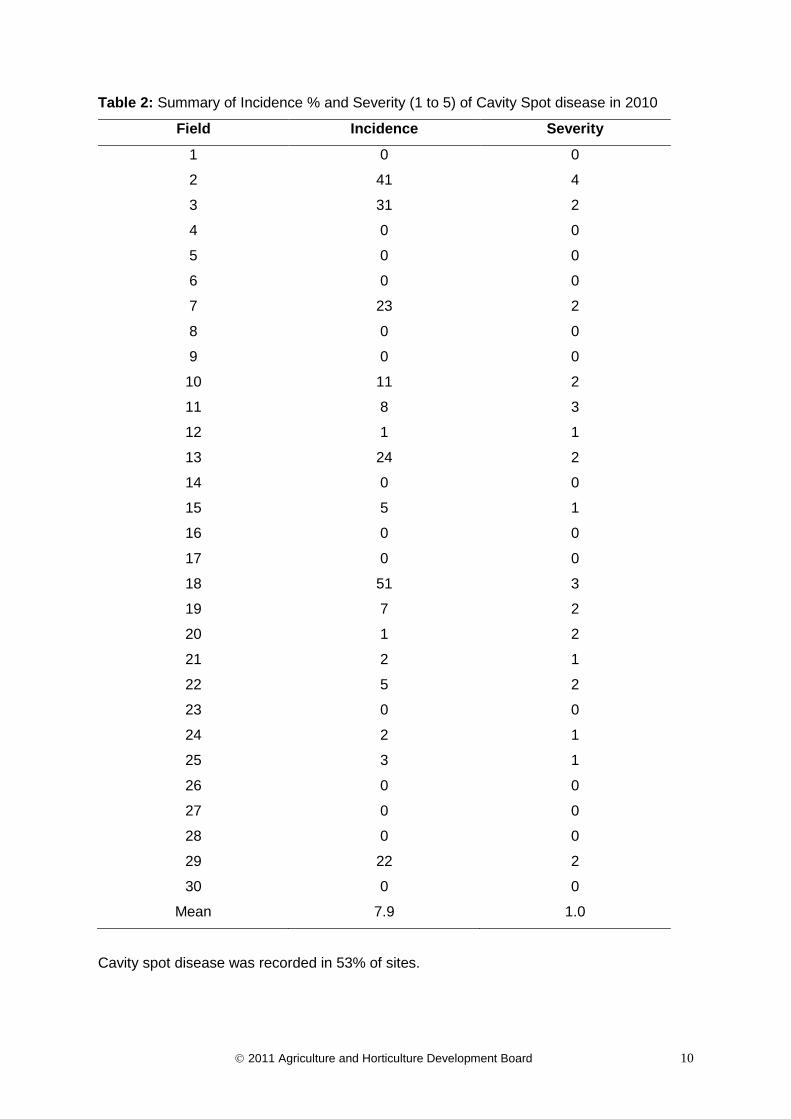
Table 2: Summary of Incidence % and Severity (1 to 5) of Cavity Spot disease in 2010
Cavity spot disease was recorded in 53% of sites.
Field Incidence Severity
1 0 0
2 41 4
3 31 2
4 0 0
5 0 0
6 0 0
7 23 2
8 0 0
9 0 0
10 11 2
11 8 3
12 1 1
13 24 2
14 0 0
15 5 1
16 0 0
17 0 0
18 51 3
19 7 2
20 1 2
21 2 1
22 5 2
23 0 0
24 2 1
25 3 1
26 0 0
27 0 0
28 0 0
29 22 2
30 0 0
Mean 7.9 1.0

2011 Agriculture and Horticulture Development Board
11
For each of the recorded site conditions (total water input, soil temperature and soil
moisture), multiple 7 day periods were used to calculate values (correlation coefficients)
starting with week 23 (Jun 6th). So for ‘total water input’ values were calculated each week
from week 23 for the following 8 weeks and this was repeated up to Week 38 (19th Sept).
The calculation was then repeated for the other two site conditions – ‘soil moisture’ and ‘soil
temperature’. This allows us to see if there is any relationship between the presence of
cavity spot and any of the site condition variables (total water input, soil temperature and
soil moisture).
The range of correlations was examined and those that produced significant results
(P<0.05) were noted and used in a regression analysis in order to determine those weather
variables that gave an indication that there was a likelihood of diseases being present.
Table 3: Correlation between total water input and presence of disease.
Week 28 Week 29 Week 30 Week 31 Week 32 Week 33 Week 34
1wk -0.31 -0.12 0.43 0.25 0.39 -0.03 0.55
2wks -0.26 0.19 0.42 0.48 0.28 0.51 0.38
3wks -0.06 0.29 0.53 0.43 0.54 0.34 0.27
4wks 0.06 0.44 0.53 0.58 0.43 0.23 0.22
5wks 0.24 0.43 0.61 0.47 0.35 0.19 0.25
6wks 0.22 0.59 0.53 0.42 0.31 0.24 0.20
7weeks 0.52 0.45 0.50 0.36 0.35 0.18 0.26
Table 3 highlights those periods where there was a significant correlation between total
water input and presence of the disease. It shows that the total water input around week 30
(25th July) gives the best correlations and the best correlation is obtained using the total

2011 Agriculture and Horticulture Development Board
12
water input in the 5 weeks following week 30 and indicates that the likelihood of disease
increases as the total water input increases.
A similar procedure was carried out for soil temperature and soil moisture but significant
relationships were not obtained for these variables – see Science Section for more details.
Financial benefits In this study of commercial crops the average loss due to cavity spot was almost 8%
representing a loss of c£20 million retail sales value (RSV). On completion of the project
and implementation of improved management practices and controls this loss should be
able to be reduced.
Action points for growers The results from year 1 lead to an indication that growers should ensure that total water
input (precipitation plus irrigation) during August is minimised. Whilst it is not possible to
influence precipitation, the management of irrigation is at the grower’s command and it may
be possible to reduce disease through less irrigation.
2011 Agriculture and Horticulture Development Board
13
SCIENCE SECTION Introduction Cavity spot is an intractable disease problem and there has been a lot of effort in the last
20 years to try and understand it. The projects listed below were conducted largely by a
team at HRI lead by Dr Geoff White during the 1990’s:
FV 5: Investigation and control of carrot cavity spot disease Fv 5a: Carrot detection of cavity spot pathogens in soil
FV 5b: carrots: an integrated approach to the control of cavity spot
FV 5c: Carrots: production of antibodies to Pythium violae and Pythium sulcatum in large volumes
for diagnostic services
FV 5d: Carrots: screening fungicides for the control of the Pythium spp. which cause cavity spot
FV 5e: Carrots: a review of cavity spot disease
FV 5f: Carrot: the control and biology of cavity spot
Fv 5g Optimization and field evaluation of PCR assays to quantify cavity spot pathogens
(P.violae and P.sulcatum) in soils and to rapidly identify them in carrot tissues
FV 249: Carrots: a cost-benefit study in the control of free-living nematodes, soil diseases and
volunteer potatoes by comparing specific management systems before and during cropping.
Defra HH1746SFV: Detection methods for Pythium (cavity spot of carrots & ornamental pathogens).
Defra HH3230SFV: Factors Affecting the Inoculum potential of soil-borne plant pathogens
More recent projects have been conducted by Dr Dez Barbara at WHRI. Following the
development of the Cavity Spot R&D strategy in 2009 the following project, FV 353, was
commissioned to answer key gaps in that strategy whilst the PhD studentship CP 46 will
answer some questions not covered by earlier work done in the 1990’s.
FV 353: Carrot cavity spot: (i) using quantitative PCR to 'predict disease in strawed crops;
(ii) controlling soil moisture for optimum disease management
CP 46: Carrot cavity spot – the effects of non-carrot crops on levels of relevant Pythium
spp. in the soil (PhD)
The current cost of cavity spot outbreaks is minimised by growers through active salvage –
the implementation of emergency harvesting and marketing operations. This has costs in
terms of disruption to normal operations and through taking price discounts to move large
volumes of distressed crops. If disease is well developed, whole crop loss is inevitable.
Even with effective active salvage it is estimated that the incidence of cavity spot in carrots
2011 Agriculture and Horticulture Development Board
14
in the UK in a typical season costs growers around £3 to 5 million in direct crop loss. Data
from the first year of this study suggests this estimate agrees well with a loss in Retail Sales
Value of around £20 million.
This report summarises the monitoring exercises and records obtained during the first year
of this 3-year study.
Materials and methods Members of the BCGA were contacted in the spring of 2010 and asked to identify
commercial production sites which could be studied during the growing season. Thirty sites
were selected to represent the main growing areas and typical soil types of England and
Scotland and which might be ‘risky’ in terms of cavity spot disease. Such sites would
normally have grown carrots before but would have not been cropped with carrots or related
crops during the preceding 5 or 6 seasons. A wide geographic spread of sites from Fife,
Yorks & Lancs, the East Midlands and East Anglia was selected to ensure, as far as
possible, that representative conditions were obtained together with a good chance of
disease expression.
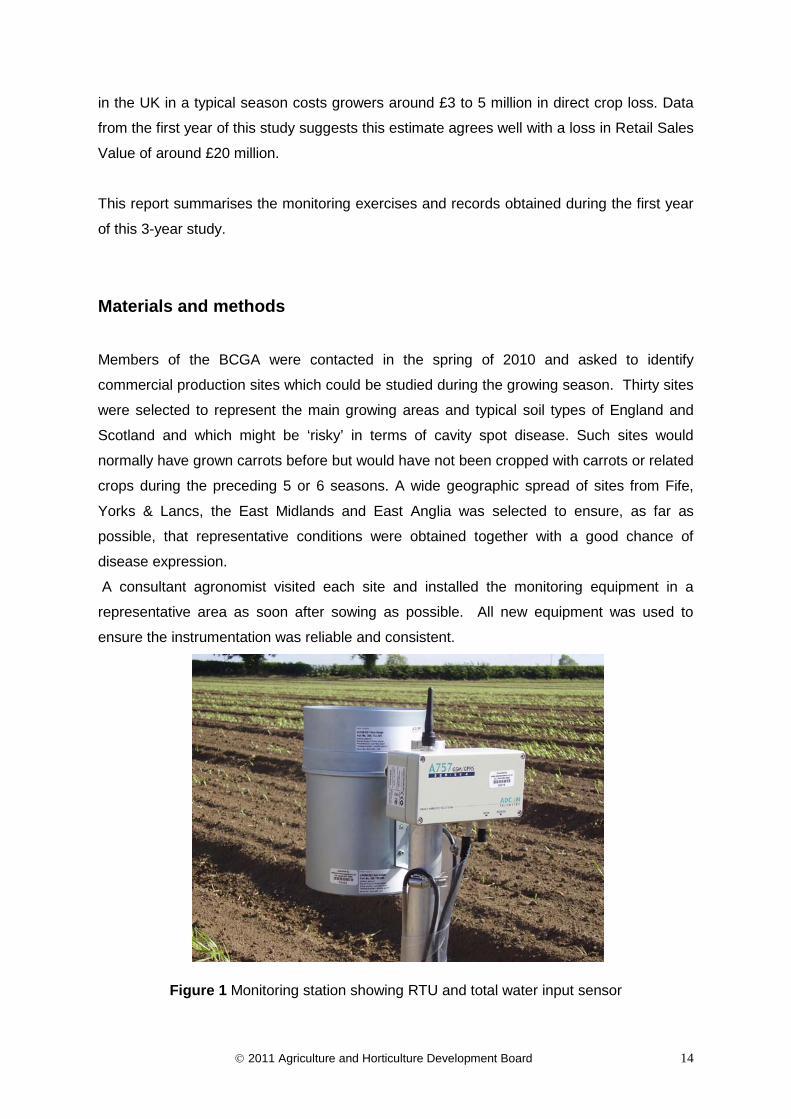
A consultant agronomist visited each site and installed the monitoring equipment in a
representative area as soon after sowing as possible. All new equipment was used to
ensure the instrumentation was reliable and consistent.
Figure 1 Monitoring station showing RTU and total water input sensor

2011 Agriculture and Horticulture Development Board
15
Figure 2 Soil moisture sensor showing insertion into carrot bed alongside rows
Figure 3 Soil moisture sensor showing internal construction
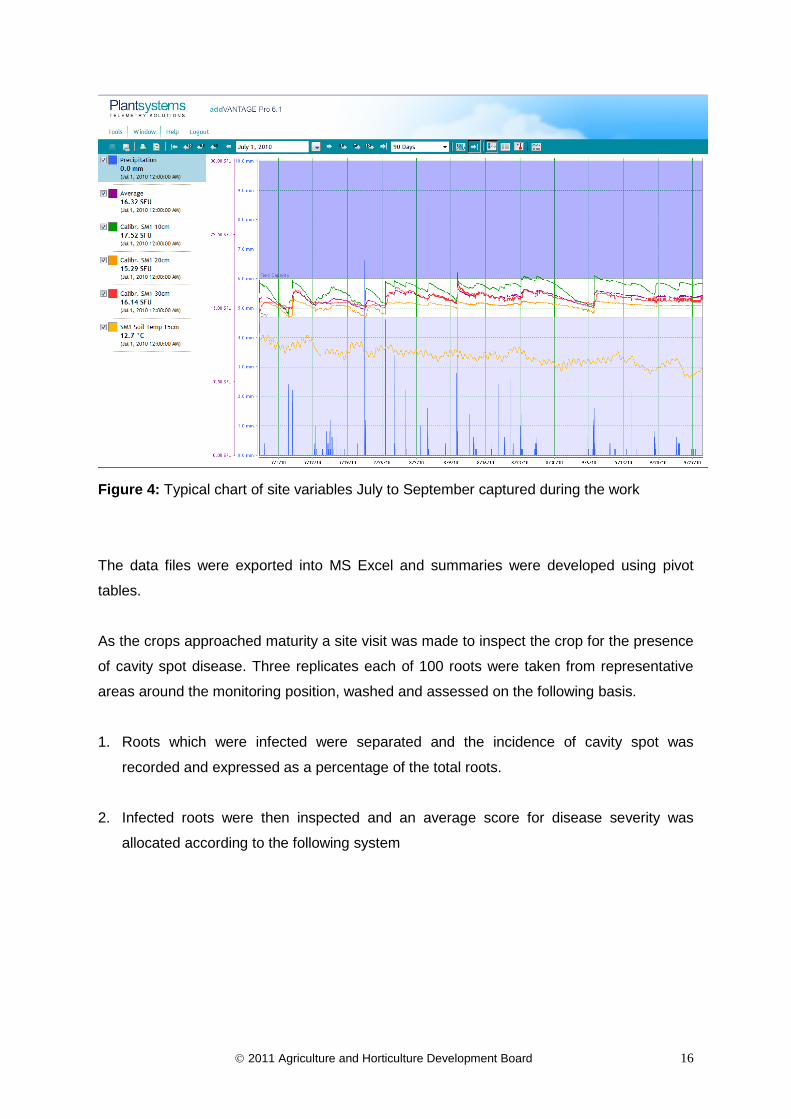
Data capture was initiated immediately and the quality of the data was verified. The data
capture and visualisation software used in the work allowed for continual charting of the
conditions in each site.
2011 Agriculture and Horticulture Development Board
16
Figure 4: Typical chart of site variables July to September captured during the work
The data files were exported into MS Excel and summaries were developed using pivot
tables.
As the crops approached maturity a site visit was made to inspect the crop for the presence
of cavity spot disease. Three replicates each of 100 roots were taken from representative
areas around the monitoring position, washed and assessed on the following basis.
1. Roots which were infected were separated and the incidence of cavity spot was
recorded and expressed as a percentage of the total roots.
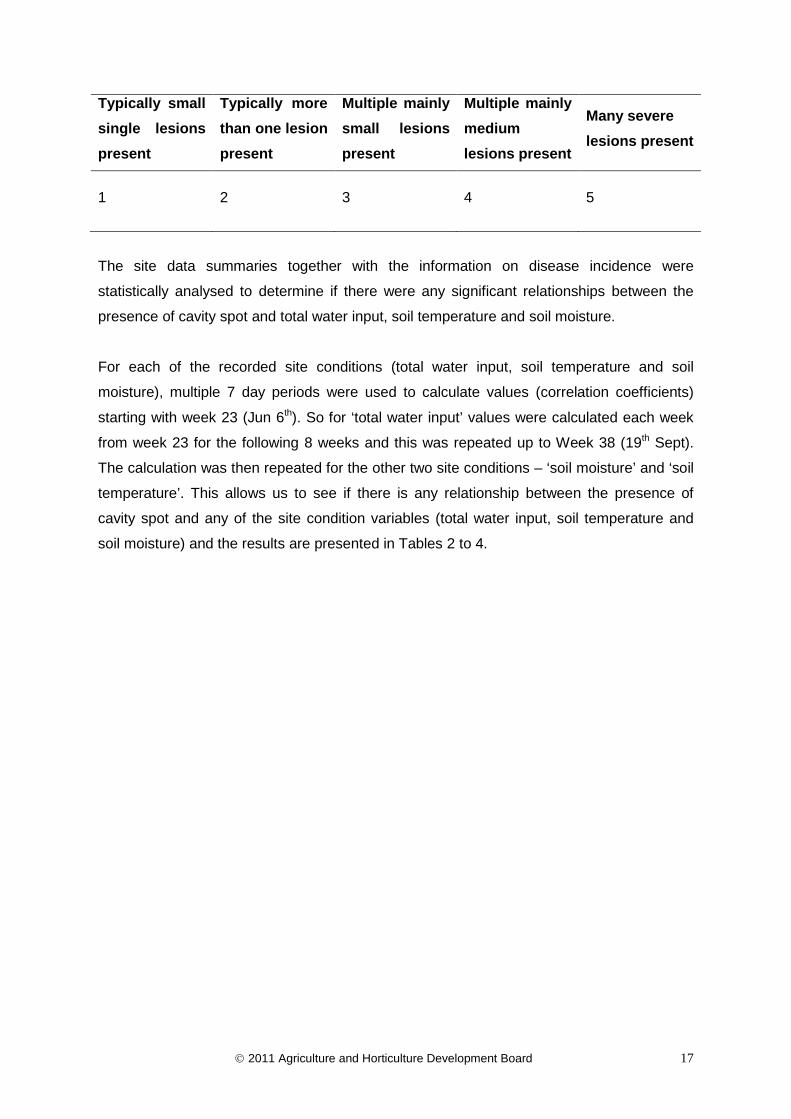
2. Infected roots were then inspected and an average score for disease severity was
allocated according to the following system
2011 Agriculture and Horticulture Development Board
17
Typically small single lesions present
Typically more than one lesion present
Multiple mainly small lesions present
Multiple mainly medium lesions present
Many severe lesions present
1 2 3 4 5
The site data summaries together with the information on disease incidence were
statistically analysed to determine if there were any significant relationships between the
presence of cavity spot and total water input, soil temperature and soil moisture.
For each of the recorded site conditions (total water input, soil temperature and soil
moisture), multiple 7 day periods were used to calculate values (correlation coefficients)
starting with week 23 (Jun 6th). So for ‘total water input’ values were calculated each week
from week 23 for the following 8 weeks and this was repeated up to Week 38 (19th Sept).
The calculation was then repeated for the other two site conditions – ‘soil moisture’ and ‘soil
temperature’. This allows us to see if there is any relationship between the presence of
cavity spot and any of the site condition variables (total water input, soil temperature and
soil moisture) and the results are presented in Tables 2 to 4.

2011 Agriculture and Horticulture Development Board
18
Results Table 1: Assessments of cavity spot in monitored crops
Field Date of assessment
Incidence % Severity 1 to 5
1 19/10/2010 0 0 2 19/10/2010 41 4 3 19/10/2010 31 2 4 15/10/2010 0 0 5 15/10/2010 0 0 6 19/10/2010 0 0 7 19/10/2010 23 2 8 19/10/2010 0 0 9 21/08/2010 0 0 10 20/10/2010 11 2 11 19/10/2010 8 3 12 20/10/2010 1 1 13 22/07/2010 24 2 14 19/10/2010 0 0 15 20/10/2010 5 1 16 01/10/2010 0 0 17 27/09/2010 0 0 18 20/10/2010 51 3 19 19/10/2010 7 2 20 19/10/2010 1 2 21 20/10/2010 2 1 22 11/10/2010 5 2 23 19/10/2010 0 0 24 26/10/2010 2 1 25 20/10/2010 3 1 26 28/09/2010 0 0 27 15/10/2010 0 0 28 15/10/2010 0 0 29 02/11/2010 22 2 30 15/09/2010 0 0
Mean 7.9 1.0
Cavity spot disease was recorded in 53% of sites.

2011 Agriculture and Horticulture Development Board
19
Incidence % Roots Affected
0
10
20
30
40
50
60
1 2 3 4 5 6 7 8 9 10 11 12 13 14 15 16 17 18 19 20 21 22 23 24 25 26 27 28 29 30
Severity 1 to 5
0
0.5
1
1.5
2
2.5
3
3.5
4
4.5
1 2 3 4 5 6 7 8 9 10 11 12 13 14 15 16 17 18 19 20 21 22 23 24 25 26 27 28 29 30
Figure 5: Summary of Incidence of cavity spot across all sites
Figure 6: Summary of severity of cavity spot across all sites

2011 Agriculture and Horticulture Development Board
20
Table 2 shows the correlation between ‘total water input’ and the presence of cavity spot,
for a 7-week period following the beginning of each period from week 28 to week 34. Each
of the values is a ‘correlation coefficient’ where a value of 1 indicates a perfect correlation
between the two factors analysed (‘total water input’ and presence of cavity spot). The data
therefore shows that at a probability of 5% (P<0.05) the values of 0.51 and above are a
good correlation. The results indicate that ‘total water input’ gives the best correlation with
presence of cavity spot in the 5 wks following week 30. Therefore the likelihood of disease
increases as the ‘total water input’ increases at this time of year.
Table 2: Correlation between total water input and presence of disease (P<0.05)*
Week 28 Week 29 Week 30 Week 31 Week 32 Week 33 Week 34
1wk -0.31 -0.12 0.43 0.25 0.39 -0.03 0.55
2wks -0.26 0.19 0.42 0.48 0.28 0.51 0.38
3wks -0.06 0.29 0.53 0.43 0.54 0.34 0.27
4wks 0.06 0.44 0.53 0.58 0.43 0.23 0.22
5wks 0.24 0.43 0.61 0.47 0.35 0.19 0.25
6wks 0.22 0.59 0.53 0.42 0.31 0.24 0.20
7weeks 0.52 0.45 0.50 0.36 0.35 0.18 0.26
*P=probability
Table 3: Correlation between soil temperature and presence of disease
Week 23 Week 24 Week 25 Week 26 Week 27 Week 28
1wk -0.05 -0.36 -0.02 0.38 0.46 0.46
2wks -0.31 -0.28 0.27 0.42 0.46 0.44
3wks -0.25 -0.01 0.34 0.45 0.45 0.42
4wks -0.07 0.18 0.38 0.44 0.44 0.39
5wks 0.10 0.25 0.38 0.43 0.42 0.38
6weeks 0.14 0.27 0.39 0.42 0.42 0.37
2011 Agriculture and Horticulture Development Board
21
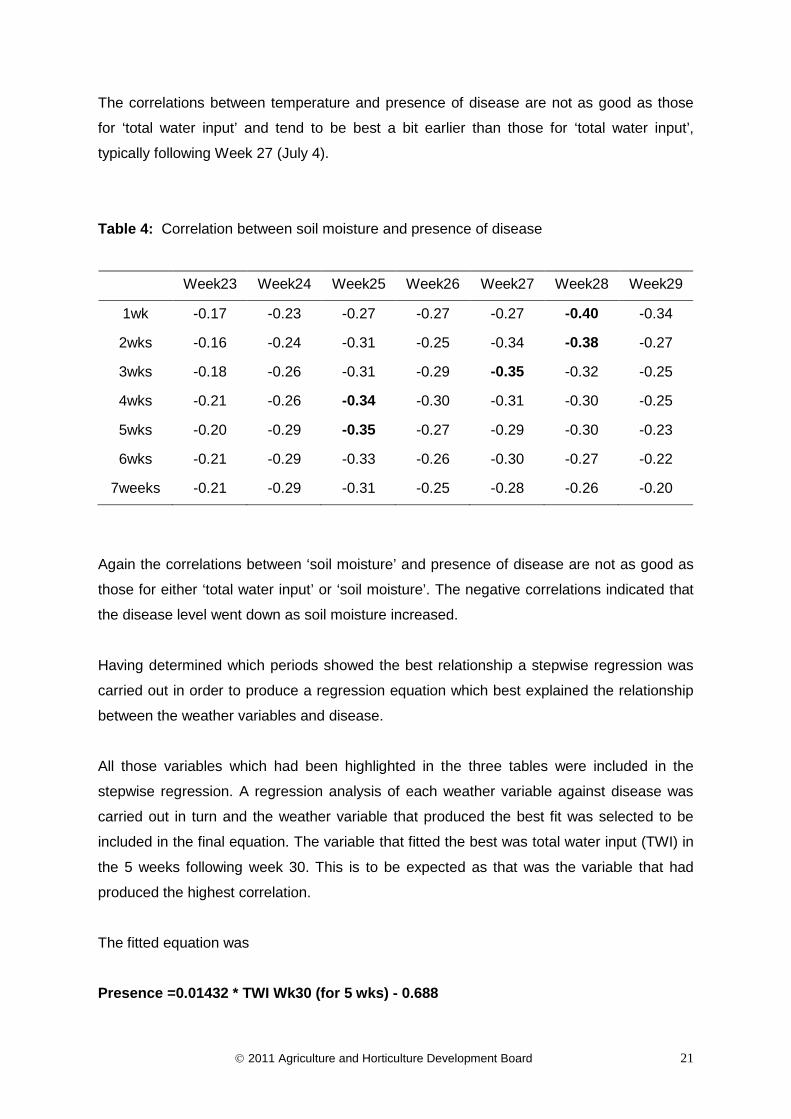
The correlations between temperature and presence of disease are not as good as those
for ‘total water input’ and tend to be best a bit earlier than those for ‘total water input’,
typically following Week 27 (July 4).
Table 4: Correlation between soil moisture and presence of disease
Week23 Week24 Week25 Week26 Week27 Week28 Week29
1wk -0.17 -0.23 -0.27 -0.27 -0.27 -0.40 -0.34
2wks -0.16 -0.24 -0.31 -0.25 -0.34 -0.38 -0.27
3wks -0.18 -0.26 -0.31 -0.29 -0.35 -0.32 -0.25
4wks -0.21 -0.26 -0.34 -0.30 -0.31 -0.30 -0.25
5wks -0.20 -0.29 -0.35 -0.27 -0.29 -0.30 -0.23
6wks -0.21 -0.29 -0.33 -0.26 -0.30 -0.27 -0.22
7weeks -0.21 -0.29 -0.31 -0.25 -0.28 -0.26 -0.20
Again the correlations between ‘soil moisture’ and presence of disease are not as good as
those for either ‘total water input’ or ‘soil moisture’. The negative correlations indicated that
the disease level went down as soil moisture increased.
Having determined which periods showed the best relationship a stepwise regression was
carried out in order to produce a regression equation which best explained the relationship
between the weather variables and disease.
All those variables which had been highlighted in the three tables were included in the
stepwise regression. A regression analysis of each weather variable against disease was
carried out in turn and the weather variable that produced the best fit was selected to be
included in the final equation. The variable that fitted the best was total water input (TWI) in
the 5 weeks following week 30. This is to be expected as that was the variable that had
produced the highest correlation.
The fitted equation was
Presence =0.01432 * TWI Wk30 (for 5 wks) - 0.688

2011 Agriculture and Horticulture Development Board
22
This equation explained 44.2 % of the variance.
Once this variable had been fitted none of the other variables improved the fit of the
equation significantly, so it would appear that the total water input in August seemed to be
the main factor in determining disease.
We then looked at the mean precipitation of sites with ‘no disease’ compared to those ‘with
disease’ in this five-week period and the difference is quite pronounced (79 against 140).
The results here are based on a fairly small set of data and as such can be influenced by
variability, i.e. where the results are extreme. Hopefully with another year's data we will be
able to better consistency from year to year.
Discussion The first year of this project indicates that the incidence of cavity spot disease appears to be
linked to the total water input (irrigation plus precipitation) and to a lesser degree soil
temperature, as recorded at each site. Furthermore there appeared to be a significant
period when total water input had a major impact and the critical period was of a 5-week
duration from week 30 (25th July). Soil moisture did not seem to have an effect and this is
surprising given that increasing total water input would normally lead directly to an increase
in soil moisture and therefore a relationship would be expected.
We know from observations and records of commercial results that cavity spot can be
severe in early maturing crops harvested during summer so we cannot presume that the
critical period for total water input is fixed to calendar dates. It seems more likely that if the
effect is real it is related to a crop development stage. In this study of mostly maincrop
carrots it seems that late July and August is the critical time for this cultural category and
this would correspond to a crop stage of around late pencil to early bulking. We could
suggest that this proposition could be applied to other crop cultures but further evidence is
required and the second and third year of this study may produce information to clarify this.
This project explores some of the environmental and agronomic factors which are thought
to have a major impact on disease so that after the project there may be a much improved
understanding of disease outbreaks and how these can be minimised through improved
cultural practices. Although growers do not have the opportunity to influence the

2011 Agriculture and Horticulture Development Board
23
precipitation or temperature at each of their sites, they are able to manage the irrigation and
through this may be able to reduce the incidence of cavity spot and its financial impact.
Conclusions
• Thirty commercial carrot crops were studied in 2010 and cavity spot disease was
recorded in 53% of the sites.
• The incidence of disease was related to site total water input (precipitation plus
irrigation)
• Sites which recorded greater total water input during the period from late July
through August tended to have more disease
• Soil temperature had less effect than total water input.
Knowledge and Technology Transfer Articles for the HDC News and the BCGA Newsletter are planned on completion of this
report. A combined paper at the Carrot Conference in November 2011 will include findings
of this study.

2011 Agriculture and Horticulture Development Board
24
References
Hiltunen, L.H. and White, J.G. (2002) Cavity spot of carrot (Daucus carota). Annals of
Applied Biology141:201-223.
Perry, D.A. and Harrison, J.G. (1979) Cavity spot of carrots. II. The effect of soil conditions
and the role of pectolytic anaerobic bacteria.
Suffert, F., Delalande, D., Prunier, M. and Andrivon, D. (2008). Modulation of primary and
secondary infections in epidemics of carrot cavity spot through agronomic management
practices. Plant Pathology 57: 109-121.
Whipps, J., Clarkson, J. and Barbara D.J. (2009) Factors affecting the inoculum potential of
soil-borne plant pathogens. Defra Final report project HH3203SFV.
Barbara, D.J. (2010) Carrot cavity spot: (i) using quantitative PCR to predict disease in
strawed crops; (ii) controlling moisture for optimum disease management. AHDB Final
report project FV353.
Pettit, T. and Gladders, P. (2003). Carrot cavity spot. Horticultural Development Council
Factsheet 03/03.