project title goes here - attendance · pdf filekent isd administrative data was analyzed to...
TRANSCRIPT
Prepared by: Community Research Institute Nancy Koester Research Manager Bicycle Factory, Suite 200 201 Front Ave SW Grand Rapids, MI 49504 [email protected] tel: 616-331-9030 fax: 616-331-7592
Prepared for: Kent ISD Ron Koehler Assistant Superintendent 2930 Knapp Street NE Grand Rapids, MI 49525 Web site: www.kentisd.org Tel: 616-364-1333 Fax: 616-364-1488
FINAL REPORT Chronic Early Absenteeism: Prevalence and MEAP Performance in Kent ISD Kent County, Michigan
Johnson Center for Philanthropy I Community Research Institute © 2011 Grand Valley State University
ACKNOWLEDGEMENTS This report is the result of the efforts and cooperation of many individuals and institutions. The Kent ISD and the Mott Foundation provided funding. The Kent County Family and Children’s Coordinating Council (KCFCCC) and the Kent School Services Network (KSSN) first brought concerns about chronic early absenteeism and its consequences forward for study. The study was developed and implemented through the Community Research Institute (CRI) at the Johnson Center for Philanthropy, a unit of Grand Valley State University’s College of Community and Public Service (CCPS). This report is a quantitative assessment of the prevalence and consequences of chronic early absenteeism in Kent ISD. It is a complimentary report to a qualitative assessment of school district attendance policies: Chronic Early Absenteeism: Analysis of Kent ISD Public School District Attendance Policies, released December 2010. Dr. Christine Yalda, CCPS faculty research fellow and a faculty member in the School of Criminal Justice, served as principal investigator for the project and leader of the policy analysis team. Nancy Koester, Research Manager at CRI, served as the project leader for the quantitative assessment. The quantitative team included Gustavo Rotondaro, CRI Interim Director; Eleibny Santana Feliz, Data Security and Database Manager; Eric Prince and Andrea Barger, student data analysts; Dr. Daniel Frobish, GVSU Department of Statistics faculty member, as statistical consultant; Aaron Kates, student map developer; Nathan Gras and Laura Schmidt for policy analysis; Dr. Michael Moody for valuable editorial comments, and Dr. James Edwards, executive director of the Johnson Center for Philanthropy for supervision and overall guidance.
The project team wishes to thank everyone associated with KCFCCC, KSSN, and Kent ISD for their cooperation, assistance, and support of data collection efforts including Carol Paine-McGovern, Ron Koehler, Matthew VanZetten, Glen Finkel, and the superintendents and support staff of the public school districts in Kent County. The report offers conclusions drawn by the project team and do not necessarily reflect the positions of KSFCCC, Kent ISD, Kent School Services Network, the Johnson Center for Philanthropy, or Grand Valley State University.
For further information, please contact: Nancy Koester, M.S., Research Manager Community Research Institute, Johnson Center for Philanthropy, Grand Valley State University 201 Front Ave., SW, Grand Rapids, MI 49504 [email protected] 616-331-9030
i Johnson Center for Philanthropy I Community Research Institute © 2011 Grand Valley State University
TABLE OF CONTENTS Acknowledgements ...........................................................................................................................
Table of Contents ............................................................................................................................. i
List of Figures ...................................................................................................................................ii
List of Tables ....................................................................................................................................ii
Executive Summary ......................................................................................................................... 3
Findings ....................................................................................................................................... 3
Summary ..................................................................................................................................... 4
Introduction .................................................................................................................................... 5
Purpose of this Report .................................................................................................................... 5
Method ........................................................................................................................................... 6
Definitions ................................................................................................................................... 6
Research Questions .................................................................................................................... 7
Data Analysis ............................................................................................................................... 7
Findings ........................................................................................................................................... 8
The Relationship between Absenteeism and MEAP Proficiency Standards .............................. 8
Prevalence of Chronic Absenteeism in Kent ISD Districts and Schools ...................................... 9
Race/Ethnicity by District with Percent Chronic Absenteeism ............................................. 10
Geographic Location of Schools with High Percentages of Chronic Absenteeism ............... 11
Relationship between Chronic Absenteeism and Race/Ethnicity ............................................ 13
Relationship between Chronic Absenteeism and Poverty ....................................................... 14
Summary of Findings................................................................................................................. 15
Profile of Public Schools in Kent ISD in this Report ...................................................................... 17
Scope of Chronic Absenteeism in Kent ISD ............................................................................... 17
Student Absenteeism from First to Third Grade .................................................................. 17
Absenteeism Over Time: 2006 to 2009 .................................................................................... 17
Discussion and future research..................................................................................................... 18
References .................................................................................................................................... 19
ii Johnson Center for Philanthropy I Community Research Institute © 2011 Grand Valley State University
Appendix A .................................................................................................................................... 20
Schools with Chronic Absenteeism in Kent ISD ........................................................................ 20
LIST OF FIGURES Figure 1: Students within Each Absenteeism Category Who Did Not Meet MEAP Proficiency
Standard ........................................................................................................................... 9
Figure 2: Percent of Chronically Absent Students by District ....................................................... 10
Figure 3: Race/Ethnicity of School Districts by Percent of Chronic Absenteeism ........................ 11
Figure 4: Location of Schools with More than Ten Percent of Students Chronically Absent in Rural, Suburban, and Urban Communities .................................................................... 12
Figure 5: Percent of Chronic Absenteeism by Race/Ethnicity ...................................................... 13
Figure 6: Chronic Absenteeism and Poverty in Grades One through Three ................................ 14
Figure 7: Location of Schools with More than Ten Percent of Students Chronically Absent by Geographic Areas Defined by Percent of Population Living Below Poverty Level ........ 15
LIST OF TABLES Table 1: Student Absenteeism Categories ...................................................................................... 6
Table 2: Number of Students by Grade and Year ......................................................................... 17
Table 3: Districts and Schools with 10% or more of the Students Chronically Absent ................ 20

3 Johnson Center for Philanthropy I Community Research Institute © 2011 Grand Valley State University
Chronic Early Absenteeism: Prevalence and MEAP Performance in Kent ISD 2006 – 2009
EXECUTIVE SUMMARY Kent ISD administrative data was analyzed to assess the prevalence and consequences of chronic absenteeism in Kent County among first, second and third grade students from 2006 to 2009 in twenty school districts. In this report the results are presented to identify and map trends in chronic early absenteeism in public elementary schools in Kent County and to inform leadership about the prevalence and consequences associated with chronic early absenteeism in Kent County, Michigan. The findings presented here are the results of quantitative data analysis based on administrative data provided by Kent ISD. The context of the school community or the perspectives of students and parents of students who exhibit chronic absenteeism are not represented in this report.
Student absenteeism is defined as the percent of days absent out of total possible days for each school year. Students who were absent less than 5 percent of the total possible days are identified as having satisfactory absenteeism; students with absenteeism between 5 percent and 9.9 percent of the total possible days are labeled moderate; students with absenteeism between 10 percent and 19.9 percent of the total days are considered to exhibit chronic absenteeism and those with absenteeism more than 20 percent of the time are considered to exhibit extreme chronic absenteeism.
MEAP is the acronym for the Michigan Education Assessment Program. The MEAP is a state mandated measure to comply with federal guidelines to meet the No Child Left Behind standards. In this report there are four MEAP scores presented: reading and math for third grade and fourth grade. Absenteeism in the previous school year is used to assess the relationship between absenteeism and meeting MEAP proficiency standards.
Findings
Students exhibiting chronic absenteeism in second or third grade yielded a higher percentage of students not meeting the MEAP proficiency standard in third or fourth grade (respectively) than students who exhibited moderate or satisfactory absenteeism.
More than 10 percent of the students were chronically absent in four Kent ISD school districts between 2006 and 2009.
4 Johnson Center for Philanthropy I Community Research Institute © 2011 Grand Valley State University
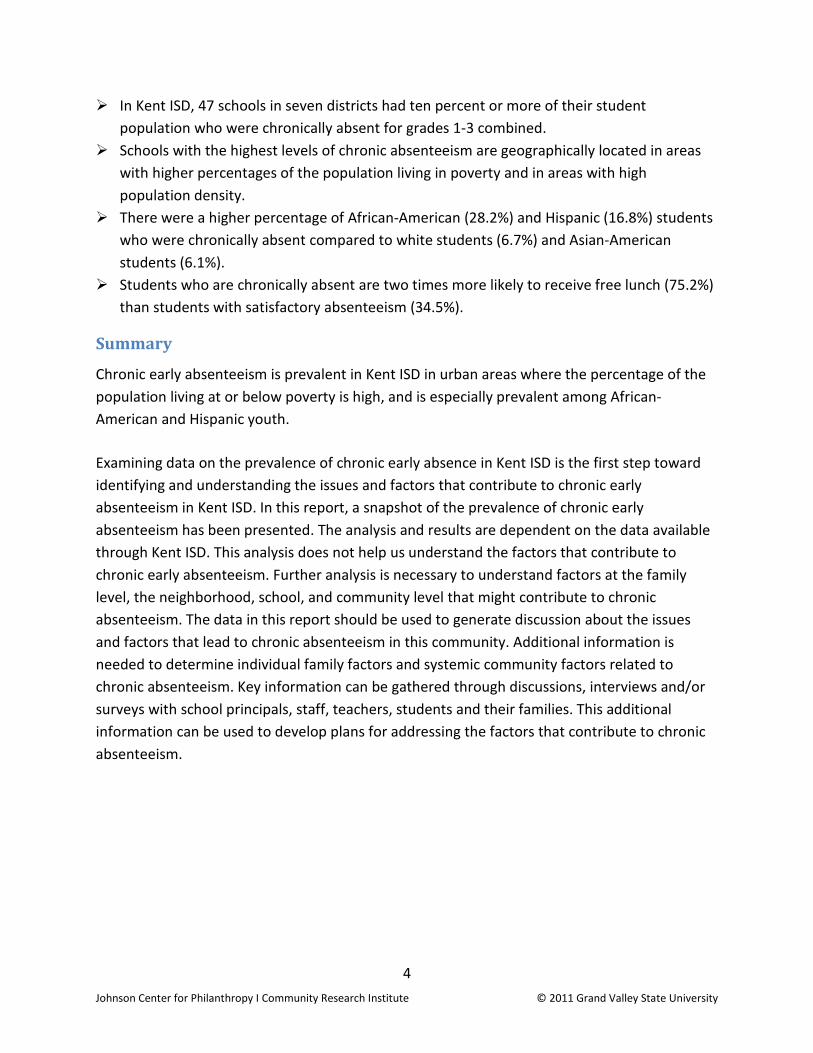
In Kent ISD, 47 schools in seven districts had ten percent or more of their student population who were chronically absent for grades 1-3 combined.
Schools with the highest levels of chronic absenteeism are geographically located in areas with higher percentages of the population living in poverty and in areas with high population density.
There were a higher percentage of African-American (28.2%) and Hispanic (16.8%) students who were chronically absent compared to white students (6.7%) and Asian-American students (6.1%).
Students who are chronically absent are two times more likely to receive free lunch (75.2%) than students with satisfactory absenteeism (34.5%).
Summary
Chronic early absenteeism is prevalent in Kent ISD in urban areas where the percentage of the population living at or below poverty is high, and is especially prevalent among African-American and Hispanic youth.
Examining data on the prevalence of chronic early absence in Kent ISD is the first step toward identifying and understanding the issues and factors that contribute to chronic early absenteeism in Kent ISD. In this report, a snapshot of the prevalence of chronic early absenteeism has been presented. The analysis and results are dependent on the data available through Kent ISD. This analysis does not help us understand the factors that contribute to chronic early absenteeism. Further analysis is necessary to understand factors at the family level, the neighborhood, school, and community level that might contribute to chronic absenteeism. The data in this report should be used to generate discussion about the issues and factors that lead to chronic absenteeism in this community. Additional information is needed to determine individual family factors and systemic community factors related to chronic absenteeism. Key information can be gathered through discussions, interviews and/or surveys with school principals, staff, teachers, students and their families. This additional information can be used to develop plans for addressing the factors that contribute to chronic absenteeism.
5 Johnson Center for Philanthropy I Community Research Institute © 2011 Grand Valley State University
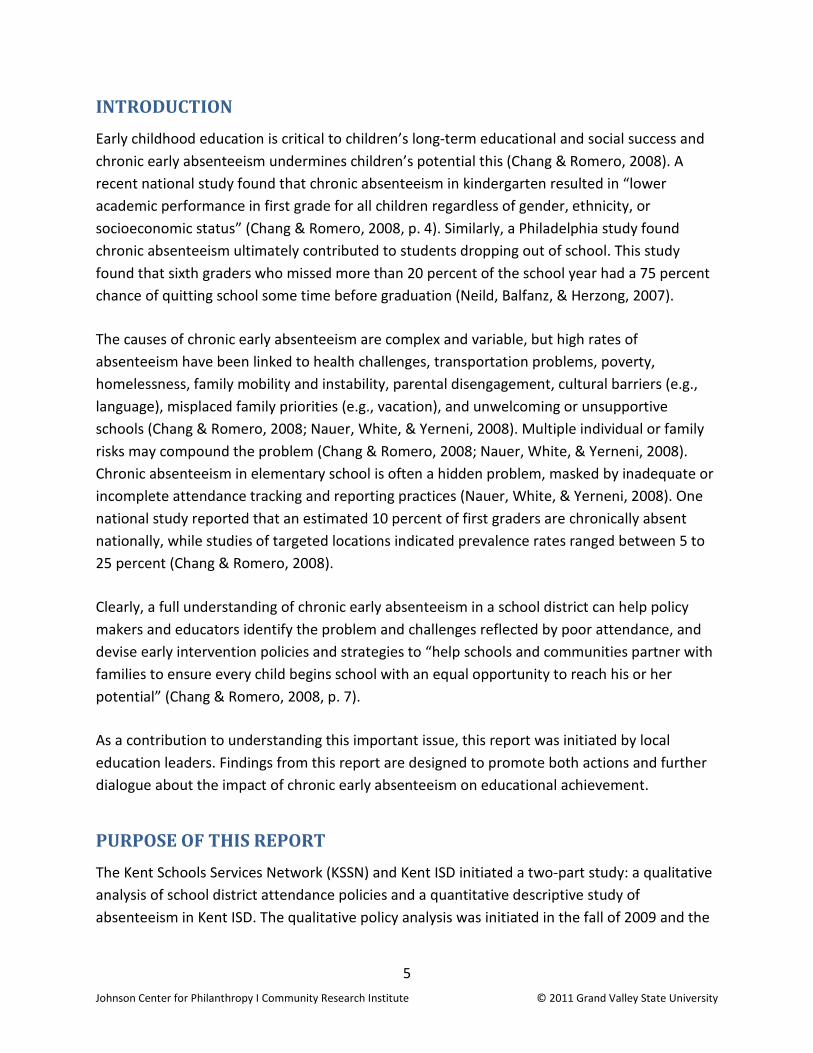
INTRODUCTION Early childhood education is critical to children’s long-term educational and social success and chronic early absenteeism undermines children’s potential this (Chang & Romero, 2008). A recent national study found that chronic absenteeism in kindergarten resulted in “lower academic performance in first grade for all children regardless of gender, ethnicity, or socioeconomic status” (Chang & Romero, 2008, p. 4). Similarly, a Philadelphia study found chronic absenteeism ultimately contributed to students dropping out of school. This study found that sixth graders who missed more than 20 percent of the school year had a 75 percent chance of quitting school some time before graduation (Neild, Balfanz, & Herzong, 2007).
The causes of chronic early absenteeism are complex and variable, but high rates of absenteeism have been linked to health challenges, transportation problems, poverty, homelessness, family mobility and instability, parental disengagement, cultural barriers (e.g., language), misplaced family priorities (e.g., vacation), and unwelcoming or unsupportive schools (Chang & Romero, 2008; Nauer, White, & Yerneni, 2008). Multiple individual or family risks may compound the problem (Chang & Romero, 2008; Nauer, White, & Yerneni, 2008). Chronic absenteeism in elementary school is often a hidden problem, masked by inadequate or incomplete attendance tracking and reporting practices (Nauer, White, & Yerneni, 2008). One national study reported that an estimated 10 percent of first graders are chronically absent nationally, while studies of targeted locations indicated prevalence rates ranged between 5 to 25 percent (Chang & Romero, 2008).
Clearly, a full understanding of chronic early absenteeism in a school district can help policy makers and educators identify the problem and challenges reflected by poor attendance, and devise early intervention policies and strategies to “help schools and communities partner with families to ensure every child begins school with an equal opportunity to reach his or her potential” (Chang & Romero, 2008, p. 7).
As a contribution to understanding this important issue, this report was initiated by local education leaders. Findings from this report are designed to promote both actions and further dialogue about the impact of chronic early absenteeism on educational achievement.
PURPOSE OF THIS REPORT The Kent Schools Services Network (KSSN) and Kent ISD initiated a two-part study: a qualitative analysis of school district attendance policies and a quantitative descriptive study of absenteeism in Kent ISD. The qualitative policy analysis was initiated in the fall of 2009 and the
6 Johnson Center for Philanthropy I Community Research Institute © 2011 Grand Valley State University
report released in 2010 (Yalda & Curry Van Ee, 2010). The quantitative absenteeism analysis began in the winter of 2010.
In this report the results of the quantitative absenteeism analysis are presented to identify and map trends in chronic early absenteeism in public elementary schools in Kent County and to inform leadership about the prevalence and consequences associated with chronic early absenteeism in Kent County, Michigan. The data from both reports will be combined in a brief following this report. The findings will be reviewed by Kent ISD leadership to develop plans for reducing chronic absenteeism in Kent County.
METHOD
Definitions1
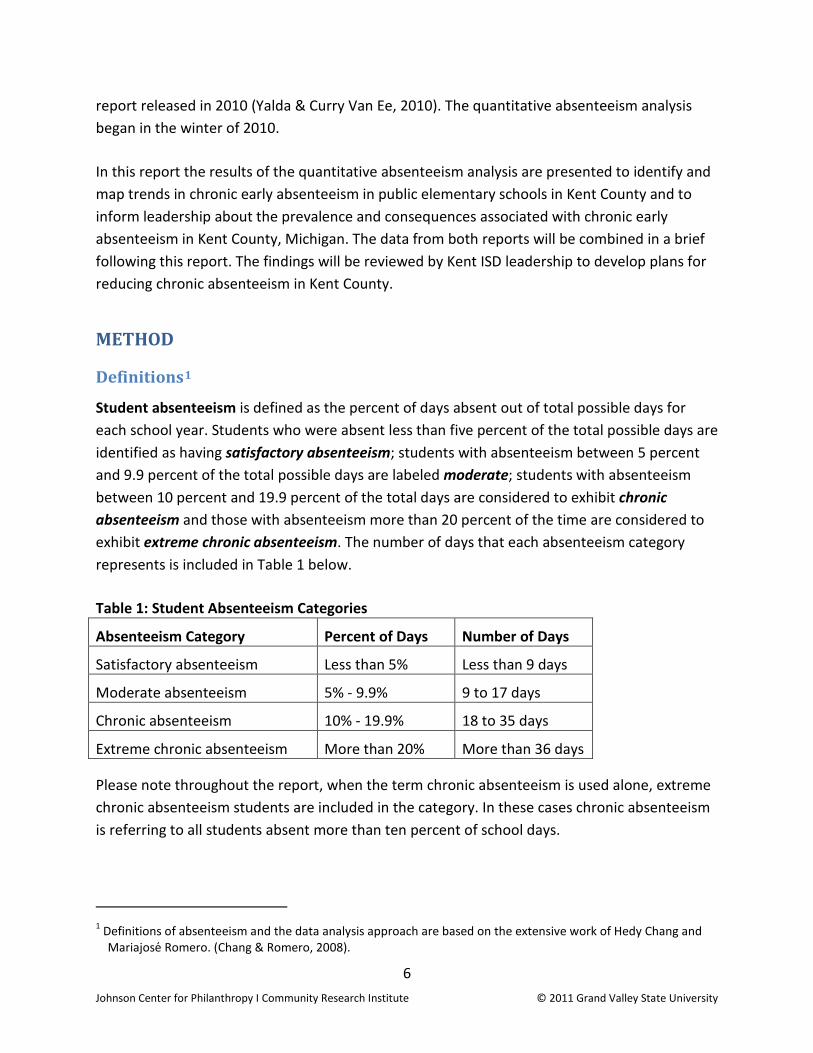
Student absenteeism is defined as the percent of days absent out of total possible days for each school year. Students who were absent less than five percent of the total possible days are identified as having satisfactory absenteeism; students with absenteeism between 5 percent and 9.9 percent of the total possible days are labeled moderate; students with absenteeism between 10 percent and 19.9 percent of the total days are considered to exhibit chronic absenteeism and those with absenteeism more than 20 percent of the time are considered to exhibit extreme chronic absenteeism. The number of days that each absenteeism category represents is included in Table 1 below.
Table 1: Student Absenteeism Categories
Absenteeism Category Percent of Days Number of Days
Satisfactory absenteeism Less than 5% Less than 9 days
Moderate absenteeism 5% - 9.9% 9 to 17 days
Chronic absenteeism 10% - 19.9% 18 to 35 days
Extreme chronic absenteeism More than 20% More than 36 days
Please note throughout the report, when the term chronic absenteeism is used alone, extreme chronic absenteeism students are included in the category. In these cases chronic absenteeism is referring to all students absent more than ten percent of school days.
1 Definitions of absenteeism and the data analysis approach are based on the extensive work of Hedy Chang and Mariajose̒ Romero. (Chang & Romero, 2008).
7 Johnson Center for Philanthropy I Community Research Institute © 2011 Grand Valley State University
School absent rate refers to the percent of students in a school who are absent more than 10 percent of the total days; that is, the percent of students who exhibit chronic or extreme chronic absenteeism. The categories used for analysis in this report to describe districts and schools are:
• fewer than five percent of the students chronically absent, • five percent to 9.9% of the students chronically absent, • ten percent to 19.9% of the students chronically absent, and • twenty percent or more of the students chronically absent.
MEAP is the acronym for the Michigan Education Assessment Program. The MEAP is a state mandated measure to comply with federal guidelines to meet the No Child Left Behind standards. In this report there are four MEAP scores presented: reading and math for third grade and fourth grade. Absenteeism in the previous school year is used to assess the relationship between absenteeism and meeting MEAP proficiency standards.
Research Questions
1. What is the relationship between a student’s level of chronic absenteeism and their performance on the MEAP proficiency test?
2. What is the prevalence of chronic early absenteeism across schools and districts in Kent ISD?
3. What is the 4-year trend of chronic absenteeism over time? 4. Which socio-demographic factors are associated with chronic absenteeism?
Data Analysis
Data analysis was conducted on a dataset of Kent ISD students who had attendance data on the June 30 count day in 2006, 2007, 2008, or 2009; in first, second, or third grade. Data analysis included:
• Descriptive statistics of districts and schools: mean and percent chronically absent. • Cross-tabs of absent rate and MEAP categories. • Descriptive characteristics of schools with more than 10 percent of students chronically
absent including students receiving free lunch (a proxy measure for poverty), race/ethnicity, and gender.
• Trend analysis of percent of student absent rate by school by year. • Descriptive characteristics of students who were chronically absent more than 10
percent of total possible days, including free lunch, race/ethnicity, and gender. • Trend analysis of students chronically absent in first grade.
8 Johnson Center for Philanthropy I Community Research Institute © 2011 Grand Valley State University
• Prevalence of moderate, chronic and extreme absenteeism by race/ethnicity, free lunch, and gender.
• Geographic presentation of absent rate of schools within neighborhood characteristics.
The data analyzed for this report includes all students in Kent ISD in grades one, two, and three between 2006 and 2009. It is considered to be the population of students, not a sample for which statistical inferences would be made. The data is descriptive of the population. A summary of selected findings is provided in this report.
FINDINGS Kent ISD administrative data was analyzed to assess the prevalence and consequences of chronic absenteeism in Kent County among first, second and third grade students from 2006 to 2009 in twenty school districts. In this report the results are presented to identify and map trends in chronic early absenteeism in public elementary schools in Kent County and to inform leadership about the prevalence and consequences associated with chronic early absenteeism in Kent County, Michigan. The findings presented here are the results of quantitative data analysis based on administrative data provided by Kent ISD. The context of the school community and the perspectives of students and parents of students who exhibit chronic absenteeism are not represented in this report.
The relationship between chronic early absenteeism and performance on the MEAP is provided first, to present data on a potential consequence of being absent from school. Following this section is data on the location of chronic early absenteeism in Kent ISD, the relationship with race/ethnicity, and examination of the relationship with poverty.
The Relationship between Absenteeism and MEAP Proficiency Standards
Students take the Michigan Education Assessment Program (MEAP) in the fall. The previous school year is the time when students learn the math and reading skills that are tested with the MEAP. This analysis was conducted to assess whether absenteeism is related to acquiring knowledge and skills as reflected in MEAP scores. This data analysis includes MEAP scores from tests taken in third and fourth grade between 2007 and 2010. There are four MEAP scores presented: reading and math for third grade and fourth grade.
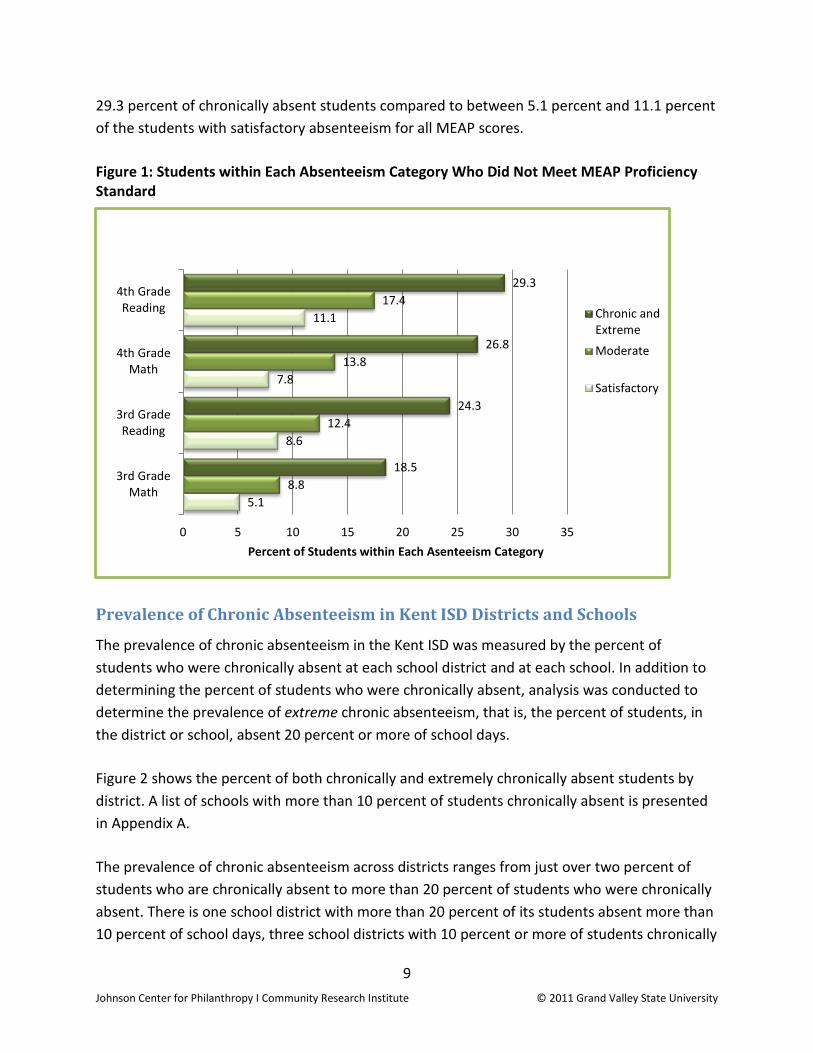
As shown in Figure 1, the analysis revealed that moderate absenteeism and above, in second or third grade, yielded a higher percentage of students not meeting the MEAP proficiency standard in third or fourth grade (respectively) than students who had satisfactory absenteeism. More specifically, the MEAP proficiency standard was not met by 18.5 percent to
9 Johnson Center for Philanthropy I Community Research Institute © 2011 Grand Valley State University
29.3 percent of chronically absent students compared to between 5.1 percent and 11.1 percent of the students with satisfactory absenteeism for all MEAP scores.
Figure 1: Students within Each Absenteeism Category Who Did Not Meet MEAP Proficiency Standard
Prevalence of Chronic Absenteeism in Kent ISD Districts and Schools
The prevalence of chronic absenteeism in the Kent ISD was measured by the percent of students who were chronically absent at each school district and at each school. In addition to determining the percent of students who were chronically absent, analysis was conducted to determine the prevalence of extreme chronic absenteeism, that is, the percent of students, in the district or school, absent 20 percent or more of school days.
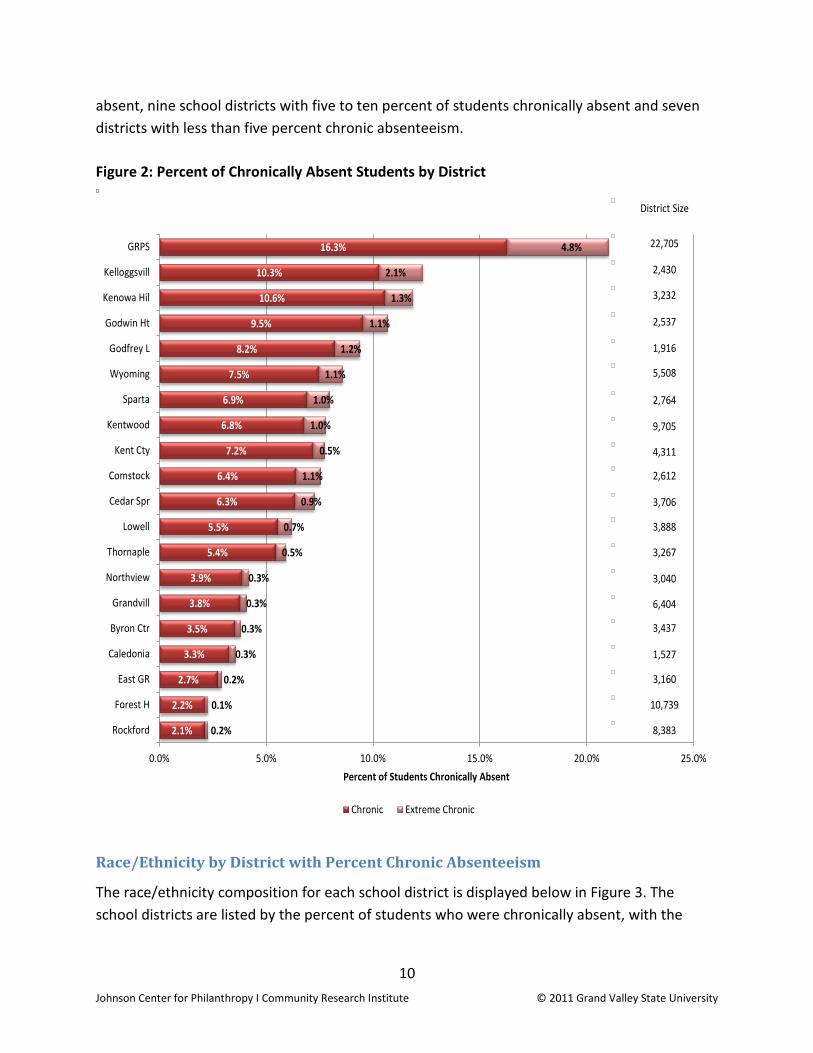
Figure 2 shows the percent of both chronically and extremely chronically absent students by district. A list of schools with more than 10 percent of students chronically absent is presented in Appendix A.
The prevalence of chronic absenteeism across districts ranges from just over two percent of students who are chronically absent to more than 20 percent of students who were chronically absent. There is one school district with more than 20 percent of its students absent more than 10 percent of school days, three school districts with 10 percent or more of students chronically
5.1
8.6
7.8
11.1
8.8
12.4
13.8
17.4
18.5
24.3
26.8
29.3
0 5 10 15 20 25 30 35
3rd GradeMath
3rd GradeReading
4th GradeMath
4th GradeReading
Percent of Students within Each Asenteeism Category
Chronic andExtreme
Moderate
Satisfactory
10 Johnson Center for Philanthropy I Community Research Institute © 2011 Grand Valley State University
absent, nine school districts with five to ten percent of students chronically absent and seven districts with less than five percent chronic absenteeism.
Figure 2: Percent of Chronically Absent Students by District
Race/Ethnicity by District with Percent Chronic Absenteeism
The race/ethnicity composition for each school district is displayed below in Figure 3. The school districts are listed by the percent of students who were chronically absent, with the
2.1%
2.2%
2.7%
3.3%
3.5%
3.8%
3.9%
5.4%
5.5%
6.3%
6.4%
7.2%
6.8%
6.9%
7.5%
8.2%
9.5%
10.6%
10.3%
16.3%
0.2%
0.1%
0.2%
0.3%
0.3%
0.3%
0.3%
0.5%
0.7%
0.9%
1.1%
0.5%
1.0%
1.0%
1.1%
1.2%
1.1%
1.3%
2.1%
4.8%
0.0% 5.0% 10.0% 15.0% 20.0% 25.0%
Rockford
Forest H
East GR
Caledonia
Byron Ctr
Grandvill
Northview
Thornaple
Lowell
Cedar Spr
Comstock
Kent Cty
Kentwood
Sparta
Wyoming
Godfrey L
Godwin Ht
Kenowa Hil
Kelloggsvill
GRPS
Percent of Students Chronically Absent
Chronic Extreme Chronic
22,705
2,430
3,232
2,537
1,916
5,508
2,764
9,705
4,311
2,612
3,706
3,888
3,267
3,040
6,404
3,437
1,527
3,160
10,739
8,383
District Size
11 Johnson Center for Philanthropy I Community Research Institute © 2011 Grand Valley State University
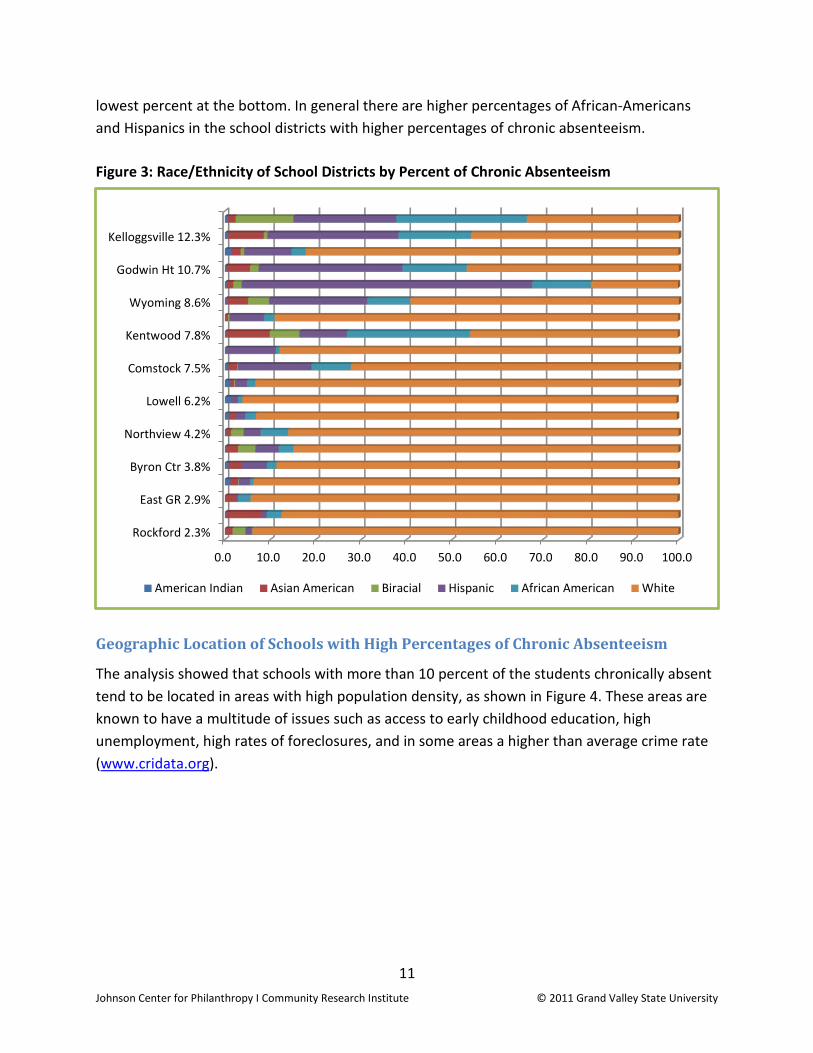
lowest percent at the bottom. In general there are higher percentages of African-Americans and Hispanics in the school districts with higher percentages of chronic absenteeism.
Figure 3: Race/Ethnicity of School Districts by Percent of Chronic Absenteeism
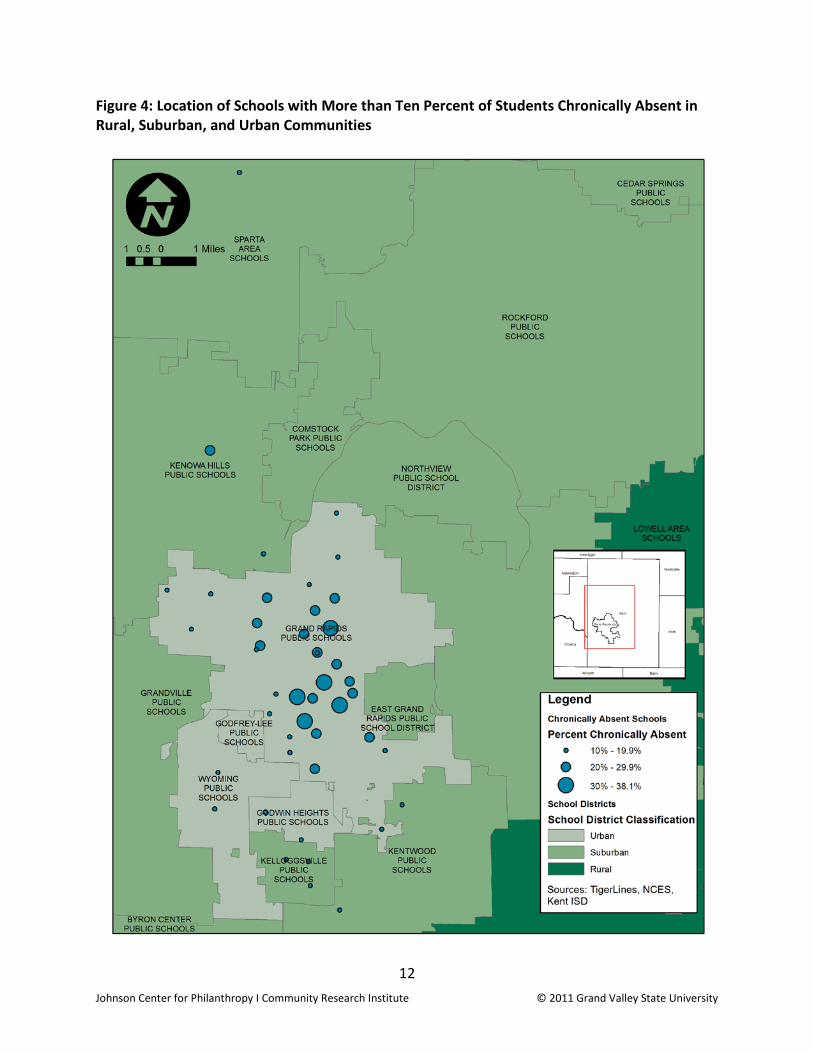
Geographic Location of Schools with High Percentages of Chronic Absenteeism
The analysis showed that schools with more than 10 percent of the students chronically absent tend to be located in areas with high population density, as shown in Figure 4. These areas are known to have a multitude of issues such as access to early childhood education, high unemployment, high rates of foreclosures, and in some areas a higher than average crime rate (www.cridata.org).
0.0 10.0 20.0 30.0 40.0 50.0 60.0 70.0 80.0 90.0 100.0
Rockford 2.3%
East GR 2.9%
Byron Ctr 3.8%
Northview 4.2%
Lowell 6.2%
Comstock 7.5%
Kentwood 7.8%
Wyoming 8.6%
Godwin Ht 10.7%
Kelloggsville 12.3%
American Indian Asian American Biracial Hispanic African American White
12 Johnson Center for Philanthropy I Community Research Institute © 2011 Grand Valley State University
Figure 4: Location of Schools with More than Ten Percent of Students Chronically Absent in Rural, Suburban, and Urban Communities
13 Johnson Center for Philanthropy I Community Research Institute © 2011 Grand Valley State University
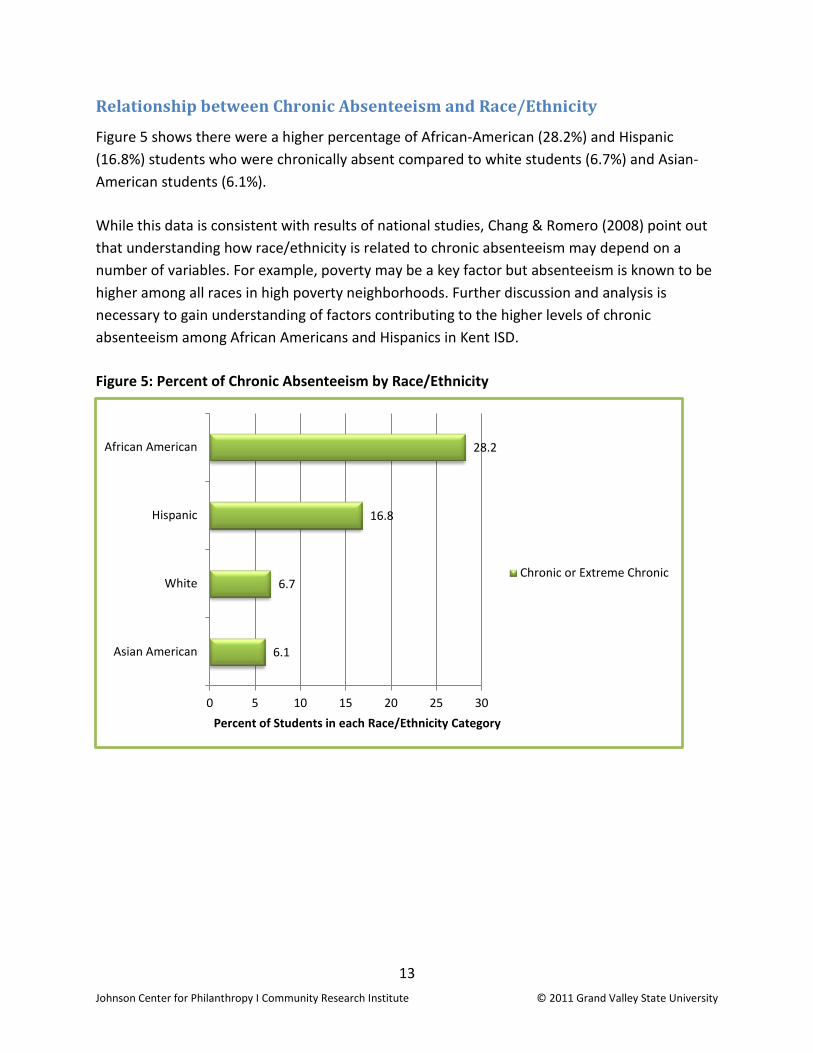
Relationship between Chronic Absenteeism and Race/Ethnicity
Figure 5 shows there were a higher percentage of African-American (28.2%) and Hispanic (16.8%) students who were chronically absent compared to white students (6.7%) and Asian-American students (6.1%).
While this data is consistent with results of national studies, Chang & Romero (2008) point out that understanding how race/ethnicity is related to chronic absenteeism may depend on a number of variables. For example, poverty may be a key factor but absenteeism is known to be higher among all races in high poverty neighborhoods. Further discussion and analysis is necessary to gain understanding of factors contributing to the higher levels of chronic absenteeism among African Americans and Hispanics in Kent ISD.
Figure 5: Percent of Chronic Absenteeism by Race/Ethnicity
6.1
6.7
16.8
28.2
0 5 10 15 20 25 30
Asian American
White
Hispanic
African American
Percent of Students in each Race/Ethnicity Category
Chronic or Extreme Chronic
14 Johnson Center for Philanthropy I Community Research Institute © 2011 Grand Valley State University
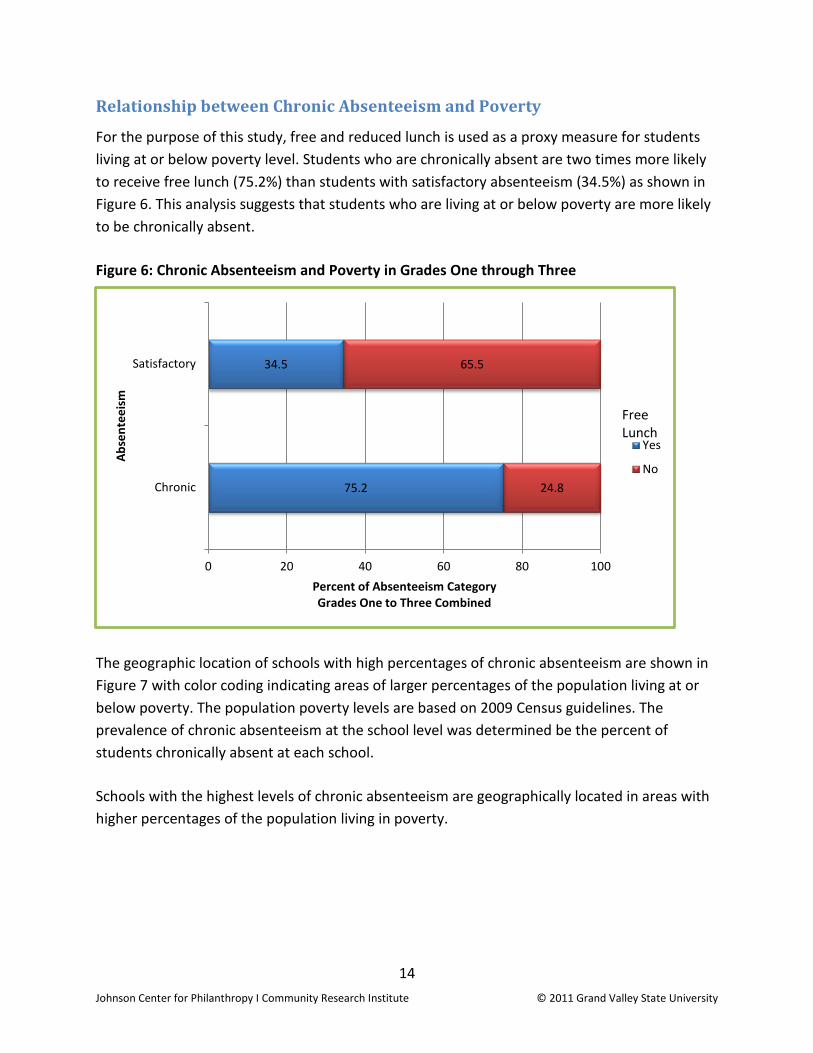
Relationship between Chronic Absenteeism and Poverty
For the purpose of this study, free and reduced lunch is used as a proxy measure for students living at or below poverty level. Students who are chronically absent are two times more likely to receive free lunch (75.2%) than students with satisfactory absenteeism (34.5%) as shown in Figure 6. This analysis suggests that students who are living at or below poverty are more likely to be chronically absent.
Figure 6: Chronic Absenteeism and Poverty in Grades One through Three
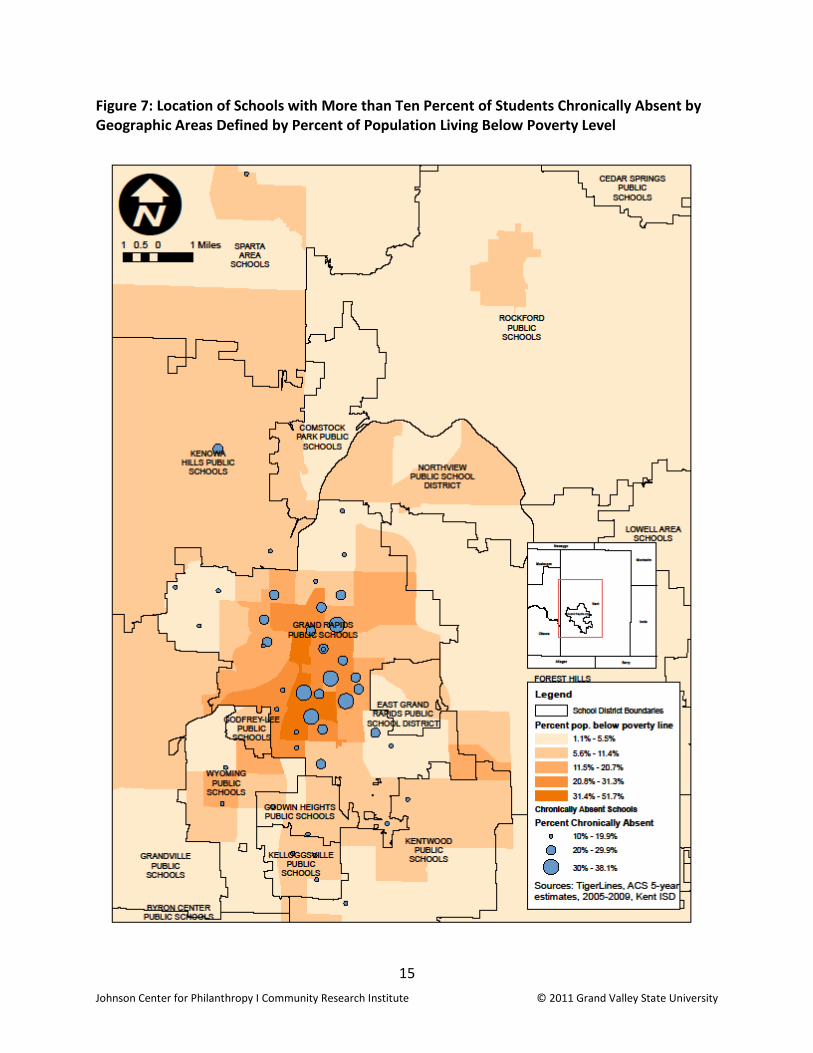
The geographic location of schools with high percentages of chronic absenteeism are shown in Figure 7 with color coding indicating areas of larger percentages of the population living at or below poverty. The population poverty levels are based on 2009 Census guidelines. The prevalence of chronic absenteeism at the school level was determined be the percent of students chronically absent at each school.
Schools with the highest levels of chronic absenteeism are geographically located in areas with higher percentages of the population living in poverty.
75.2
34.5
24.8
65.5
0 20 40 60 80 100
Chronic
Satisfactory
Percent of Absenteeism Category Grades One to Three Combined
Abse
ntee
ism
Yes
No
Free Lunch
15 Johnson Center for Philanthropy I Community Research Institute © 2011 Grand Valley State University
Figure 7: Location of Schools with More than Ten Percent of Students Chronically Absent by Geographic Areas Defined by Percent of Population Living Below Poverty Level

16 Johnson Center for Philanthropy I Community Research Institute © 2011 Grand Valley State University
Summary of Findings
Chronic absenteeism in Kent County is not pervasive throughout the county but there are substantial levels of chronic early absenteeism in urban areas with higher levels of poverty. Although a disproportionately higher percentage of African-American and Hispanic students were chronically absent, the highest number of chronically absent students is white students.
Chronic early absenteeism was shown to be related to not meeting the MEAP proficiency standards. High percentages of chronic early absenteeism were also shown to be in geographic areas with higher population density and in areas with more people living at or below poverty level. Chronically absent students were 2 times as likely as students with satisfactory attendance to receive free lunch, another indicator of living at or below poverty level.
17 Johnson Center for Philanthropy I Community Research Institute © 2011 Grand Valley State University
PROFILE OF PUBLIC SCHOOLS IN KENT ISD IN THIS REPORT
Scope of Chronic Absenteeism in Kent ISD
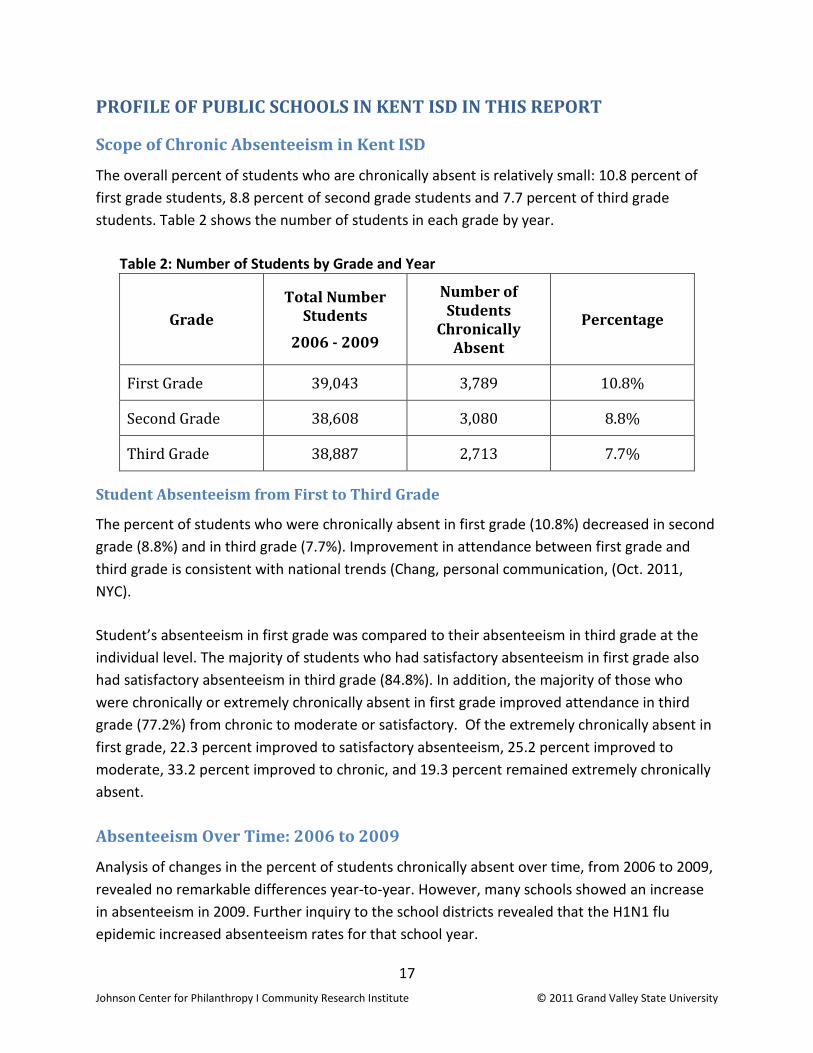
The overall percent of students who are chronically absent is relatively small: 10.8 percent of first grade students, 8.8 percent of second grade students and 7.7 percent of third grade students. Table 2 shows the number of students in each grade by year.
Table 2: Number of Students by Grade and Year
Grade Total Number
Students
2006 - 2009
Number of Students
Chronically Absent
Percentage
First Grade 39,043 3,789 10.8%
Second Grade 38,608 3,080 8.8%
Third Grade 38,887 2,713 7.7%
Student Absenteeism from First to Third Grade
The percent of students who were chronically absent in first grade (10.8%) decreased in second grade (8.8%) and in third grade (7.7%). Improvement in attendance between first grade and third grade is consistent with national trends (Chang, personal communication, (Oct. 2011, NYC).
Student’s absenteeism in first grade was compared to their absenteeism in third grade at the individual level. The majority of students who had satisfactory absenteeism in first grade also had satisfactory absenteeism in third grade (84.8%). In addition, the majority of those who were chronically or extremely chronically absent in first grade improved attendance in third grade (77.2%) from chronic to moderate or satisfactory. Of the extremely chronically absent in first grade, 22.3 percent improved to satisfactory absenteeism, 25.2 percent improved to moderate, 33.2 percent improved to chronic, and 19.3 percent remained extremely chronically absent.
Absenteeism Over Time: 2006 to 2009
Analysis of changes in the percent of students chronically absent over time, from 2006 to 2009, revealed no remarkable differences year-to-year. However, many schools showed an increase in absenteeism in 2009. Further inquiry to the school districts revealed that the H1N1 flu epidemic increased absenteeism rates for that school year.
18 Johnson Center for Philanthropy I Community Research Institute © 2011 Grand Valley State University
DISCUSSION AND FUTURE RESEARCH Chronic early absenteeism is prevalent in Kent ISD in urban areas where the percentage of the population living at or below poverty is high, and is especially prevalent among African-American and Hispanic youth.
Research suggests that the consequences of chronic early absenteeism include lack of academic achievement, less likelihood of graduating from high school, and less likelihood of interrupting the cycle of poverty. Chang & Romero (2008) point out that the factors that affect the absenteeism of a particular child can vary depending on local circumstances and context. For example, when absenteeism is relatively low in a community, it may be economic and/or social challenges of an individual family that affect the child’s ability to attend school regularly. However, in schools with high percentages of chronic absenteeism attendance may be related to larger systemic issues related to the school or in the community (Chang & Romero, 2008, p. 17).
Examining data on the prevalence of chronic early absenteeism in Kent ISD is the first step toward identifying and understanding the factors that contribute to this issue. This report provides a snapshot of the prevalence of chronic early absenteeism based on the data available through Kent ISD. However, this analysis does not identify or discuss the factors that contribute to chronic early absenteeism; further analysis is necessary to understand factors at the family, neighborhood, school, and community level that might contribute to this issue. The data in this report should be used to generate discussion about the information needed to determine the individual factors related to chronic absenteeism. This information can be gathered through discussions, interviews and/or surveys with school principals, staff, teachers, students and their families. Further work could focus on how to then use this information to decrease the systemic factors that perpetuate the occurrence of chronic early absenteeism in this community.
There will be a supplemental brief that will present the results from the analysis of the school district policies in relation to the prevalence of chronic absenteeism in the school districts.
19 Johnson Center for Philanthropy I Community Research Institute © 2011 Grand Valley State University
REFERENCES Chang, H. & Romero, M. (2008). Present, engaged, and accounted for: The critical importance of addressing chronic absence in the early grades. New York, NY: National Center for Children in Poverty.
DiMaggio, P. J. & Powell, W. W. (1983). The iron cage revisited: Institutional isomorphism and collective rationality in organizational fields. American Sociological Review, 48 (2), 147-160.
Nauer, K., White, A. & Yerneni, R. (2008). Strengthening Schools by Strengthening Families: Community Strategies to Reverse Chronic Absenteeism in the Early Grades and Improve Supports for Children and Families.
Neild, R.C., Balfanz, R., & Herzog, L. (2007). An early warning system: By promptly reacting to student distress signals, schools can redirect potential dropouts onto the path to graduation. Educational Leadership, 28–33.
Yalda, C., Curry Van Ee, E., (2010). Chronic Early Absenteeism: Analysis of Kent ISD Public School Attendance Policies. Available at: www.cridata.org.
20 Johnson Center for Philanthropy I Community Research Institute © 2011 Grand Valley State University
APPENDIX A
Schools with Chronic Absenteeism in Kent ISD
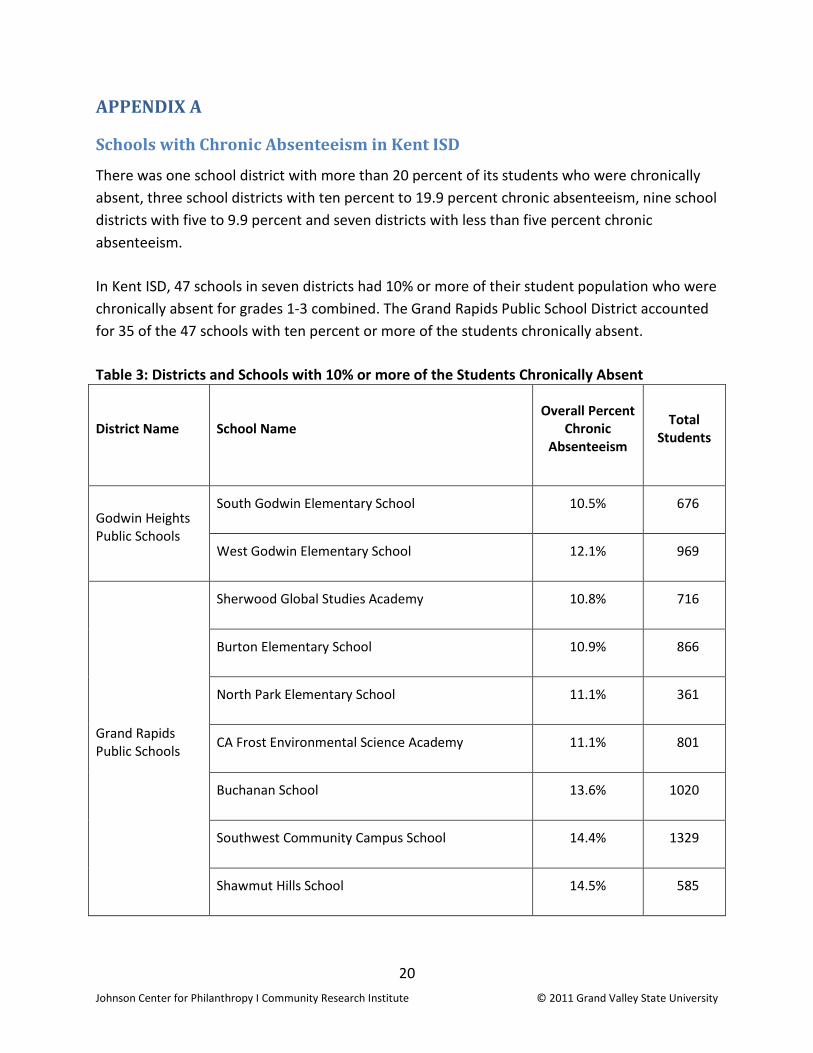
There was one school district with more than 20 percent of its students who were chronically absent, three school districts with ten percent to 19.9 percent chronic absenteeism, nine school districts with five to 9.9 percent and seven districts with less than five percent chronic absenteeism.
In Kent ISD, 47 schools in seven districts had 10% or more of their student population who were chronically absent for grades 1-3 combined. The Grand Rapids Public School District accounted for 35 of the 47 schools with ten percent or more of the students chronically absent.
Table 3: Districts and Schools with 10% or more of the Students Chronically Absent
District Name School Name Overall Percent
Chronic Absenteeism
Total Students
Godwin Heights Public Schools
South Godwin Elementary School 10.5% 676
West Godwin Elementary School 12.1% 969
Grand Rapids Public Schools
Sherwood Global Studies Academy 10.8% 716
Burton Elementary School 10.9% 866
North Park Elementary School 11.1% 361
CA Frost Environmental Science Academy 11.1% 801
Buchanan School 13.6% 1020
Southwest Community Campus School 14.4% 1329
Shawmut Hills School 14.5% 585
21 Johnson Center for Philanthropy I Community Research Institute © 2011 Grand Valley State University
District Name School Name Overall Percent
Chronic Absenteeism
Total Students
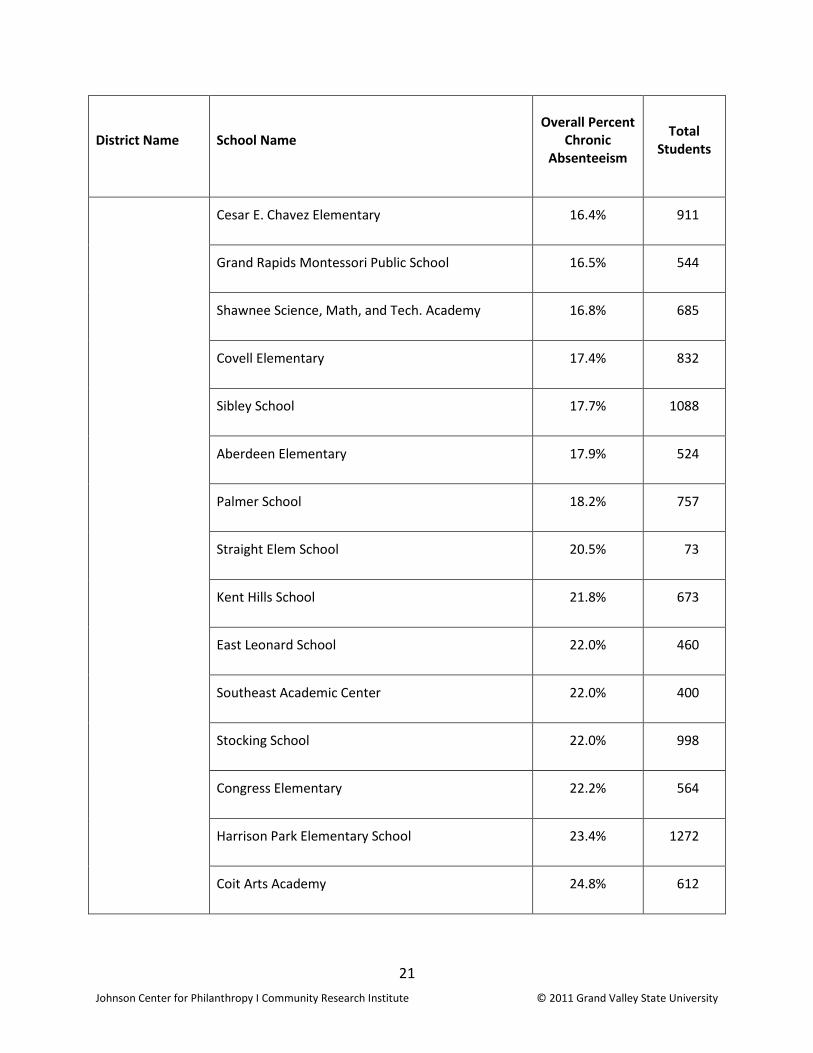
Cesar E. Chavez Elementary 16.4% 911
Grand Rapids Montessori Public School 16.5% 544
Shawnee Science, Math, and Tech. Academy 16.8% 685
Covell Elementary 17.4% 832
Sibley School 17.7% 1088
Aberdeen Elementary 17.9% 524
Palmer School 18.2% 757
Straight Elem School 20.5% 73
Kent Hills School 21.8% 673
East Leonard School 22.0% 460
Southeast Academic Center 22.0% 400
Stocking School 22.0% 998
Congress Elementary 22.2% 564
Harrison Park Elementary School 23.4% 1272
Coit Arts Academy 24.8% 612
22 Johnson Center for Philanthropy I Community Research Institute © 2011 Grand Valley State University
District Name School Name Overall Percent
Chronic Absenteeism
Total Students
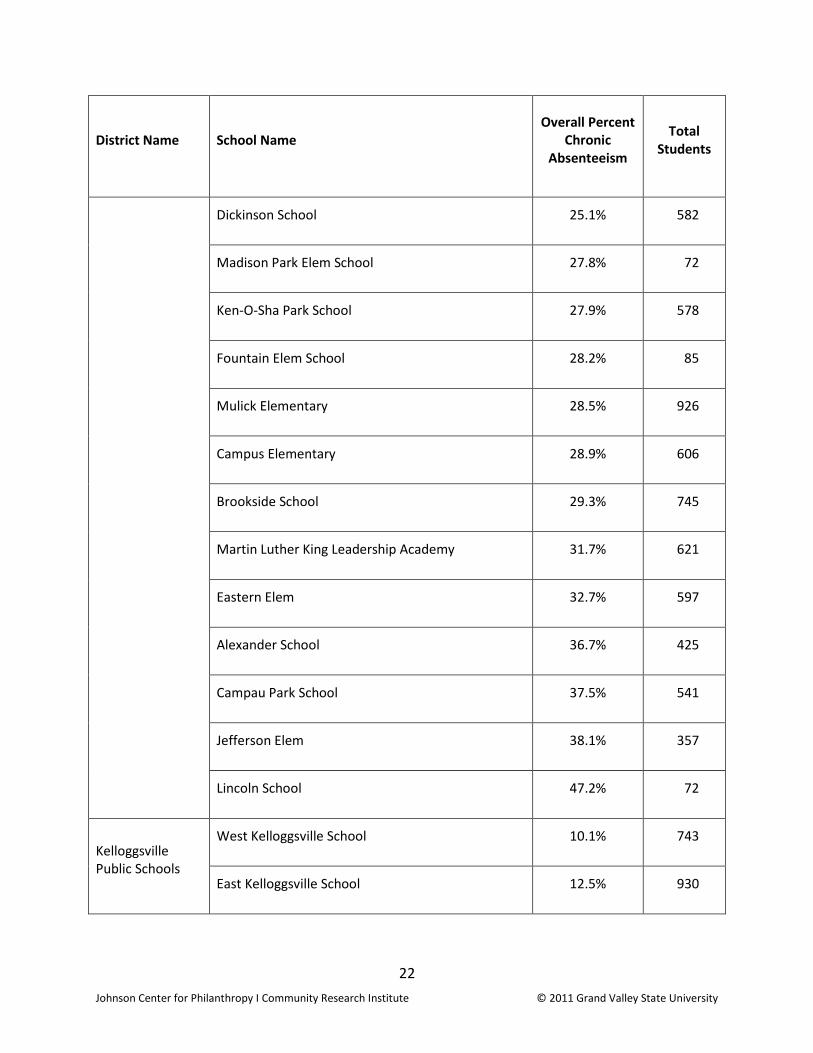
Dickinson School 25.1% 582
Madison Park Elem School 27.8% 72
Ken-O-Sha Park School 27.9% 578
Fountain Elem School 28.2% 85
Mulick Elementary 28.5% 926
Campus Elementary 28.9% 606
Brookside School 29.3% 745
Martin Luther King Leadership Academy 31.7% 621
Eastern Elem 32.7% 597
Alexander School 36.7% 425
Campau Park School 37.5% 541
Jefferson Elem 38.1% 357
Lincoln School 47.2% 72
Kelloggsville Public Schools
West Kelloggsville School 10.1% 743
East Kelloggsville School 12.5% 930
23 Johnson Center for Philanthropy I Community Research Institute © 2011 Grand Valley State University
District Name School Name Overall Percent
Chronic Absenteeism
Total Students
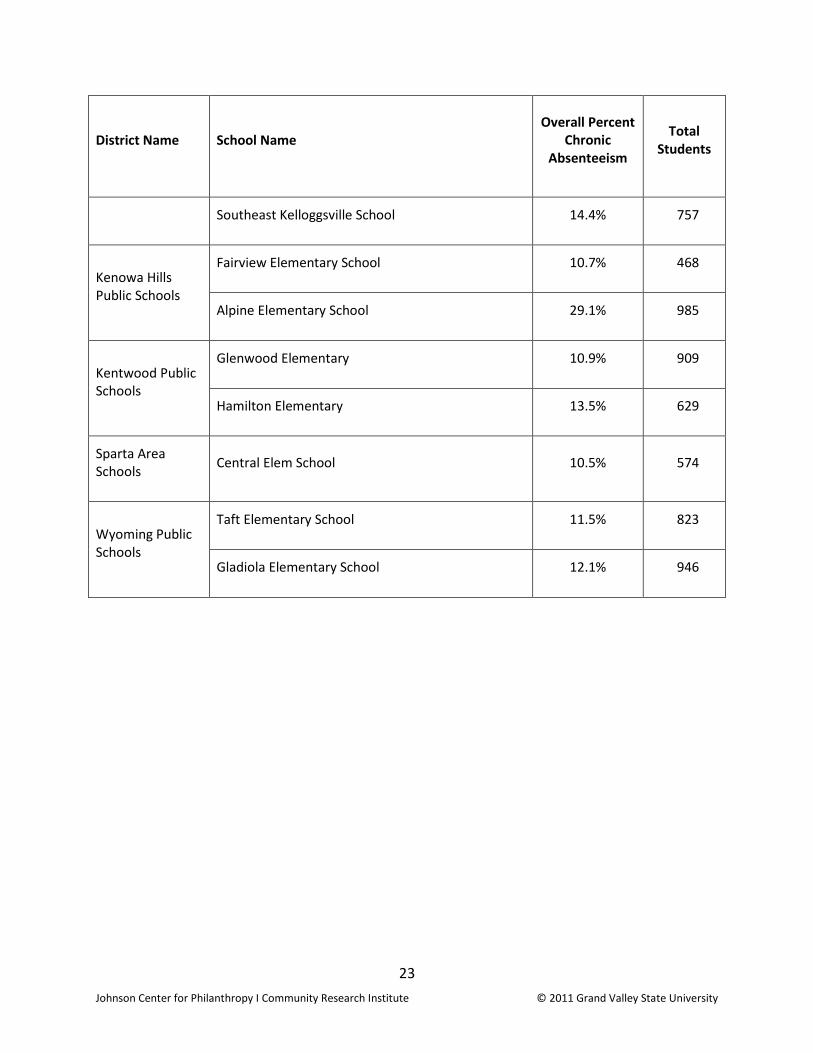
Southeast Kelloggsville School 14.4% 757
Kenowa Hills Public Schools
Fairview Elementary School 10.7% 468
Alpine Elementary School 29.1% 985
Kentwood Public Schools
Glenwood Elementary 10.9% 909
Hamilton Elementary 13.5% 629
Sparta Area Schools Central Elem School 10.5% 574
Wyoming Public Schools
Taft Elementary School 11.5% 823
Gladiola Elementary School 12.1% 946