project title: pesticide indicators
TRANSCRIPT

TheThe FirstFirst WorkshopWorkshop on on PesticidePesticide IndicatorsIndicators VilniusVilnius , 2, 2--3 3 AprilApril 20072007
Central Statistical Office Central Statistical Office
of Polandof Poland
State Plant Health and Seed State Plant Health and Seed Inspection ServiceInspection Service
Plant Protection Institute, Plant Protection Institute, SoSośśnicowicenicowiceBranchBranch
11
THE PLANT PROTECTION PRODUCTS USAGE STATISTICS IN POLAN DPART II
GENERAL ISSUES AND REFINING THE SYSTEM
Project Title:PESTICIDE INDICATORS
Authors:
GraŜyna Berent-Kowalska – Central Statistical Office of Po land
e-mail: [email protected] , web.: www.stat.gov.pl
Katarzyna Prugar – State Plant Health and Seed Inspectio n Service
e-mail: [email protected] , web.: www.piorin.gov.pl
Stanisław Stobiecki – Plant Protection Institute So śnicowice Branch
e-mail: [email protected] , web.: www.ior.gliwice.pl
22
PRESENTATION PLAN
� Presentation of the system for collecting data on p esticide sales in Poland.
� Changes in direction of pesticide sales statistics.
� Comparison of data on pesticide sales statistics wi th data on pesticide usage statistics after 4-year cycle.
� Major problem in monitoring pesticide usage – sample representativeness.
� Changes in direction of pesticide usage statistics.
� PLAN for usage statistics for 2007.

33
SYSTEM FOR COLLECTING DATA ON PESTICIDE SALES
IN POLAND
Participating Institutions: Central Statistical Off ice (GUS), Ministry of Agriculture and Rural Development
Data collected by GUS:
� pesticide name
� formulation code as per current code list
� amount of formulation sold and in-stock at the end of reporting period in kg/liter
� formulation code according to FAO, CN and Eurostat C lassification
� producers and importers submit data electronically in a predefined form
� data do not include identifying information
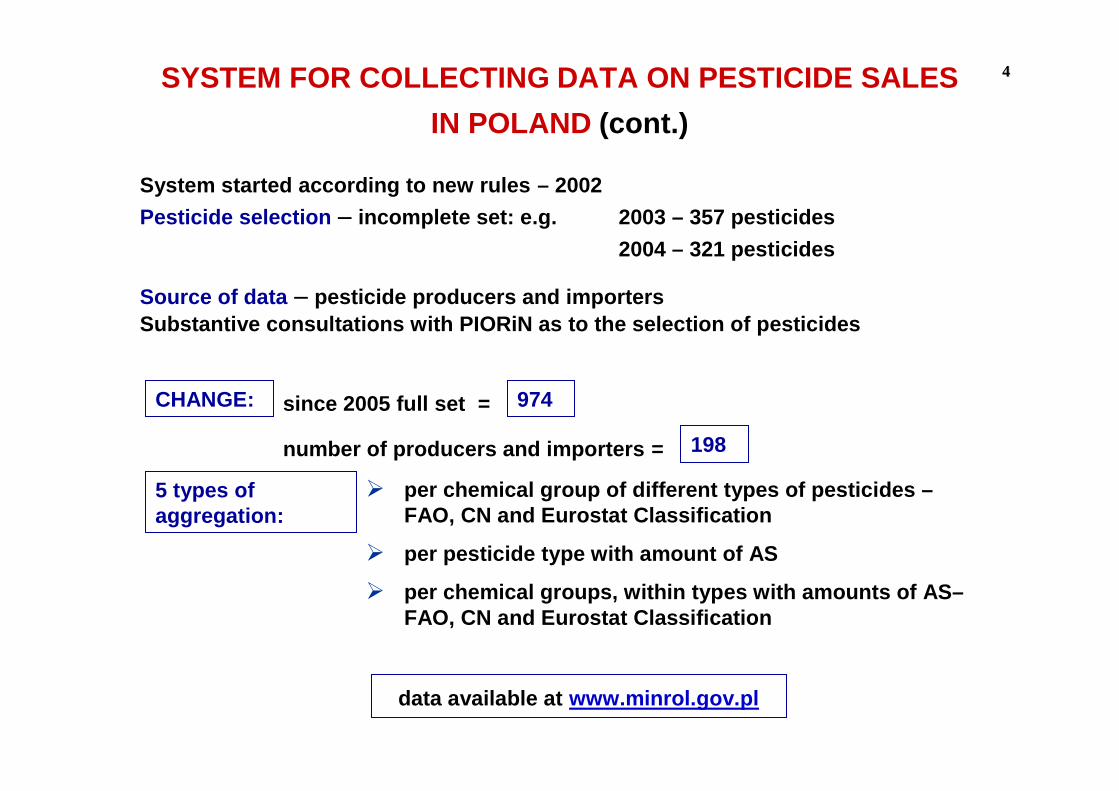
44SYSTEM FOR COLLECTING DATA ON PESTICIDE SALES
IN POLAND (cont.)
System started according to new rules – 2002
Pesticide selection – incomplete set: e.g. 2003 – 357 pesticides
2004 – 321 pesticides
Source of data – pesticide producers and importersSubstantive consultations with PIORiN as to the sele ction of pesticides
CHANGE: since 2005 full set = 974
5 types of aggregation:
� per chemical group of different types of pesticides –FAO, CN and Eurostat Classification
� per pesticide type with amount of AS
� per chemical groups, within types with amounts of A S–FAO, CN and Eurostat Classification
data available at www.minrol.gov.pl
number of producers and importers = 198
55
ANALYSYS OF SOURCE DATA REGARDING PESTICIDE SALES
� Verification of correctness of data and aggregation at the level of
pesticides and product categories .
� Calculation of active substances (A.S.) per kg., in sold pesticides, after
standardization of units .
� Matching A.S. with appropriate product categories a nd chemical
classes .
� Data aggregation per A.S. and chemical class .
� Calculating the mean pesticide use in kg of A.S./ha .
66
PROPOSED (RECOMMENDED) DIRECTIONS OF CHANGE
IN THE SYSTEM IN POLAND
SALES
� Conversion of GUS questionnaires into electronic fo rm .
� Automatization of the system = internet filing by th e respondents directly into the central system .
� Change in software for data collection.
� Change in software for data processing (aggregation , publication).
� Communication with existing databases (in Poland an d EU).
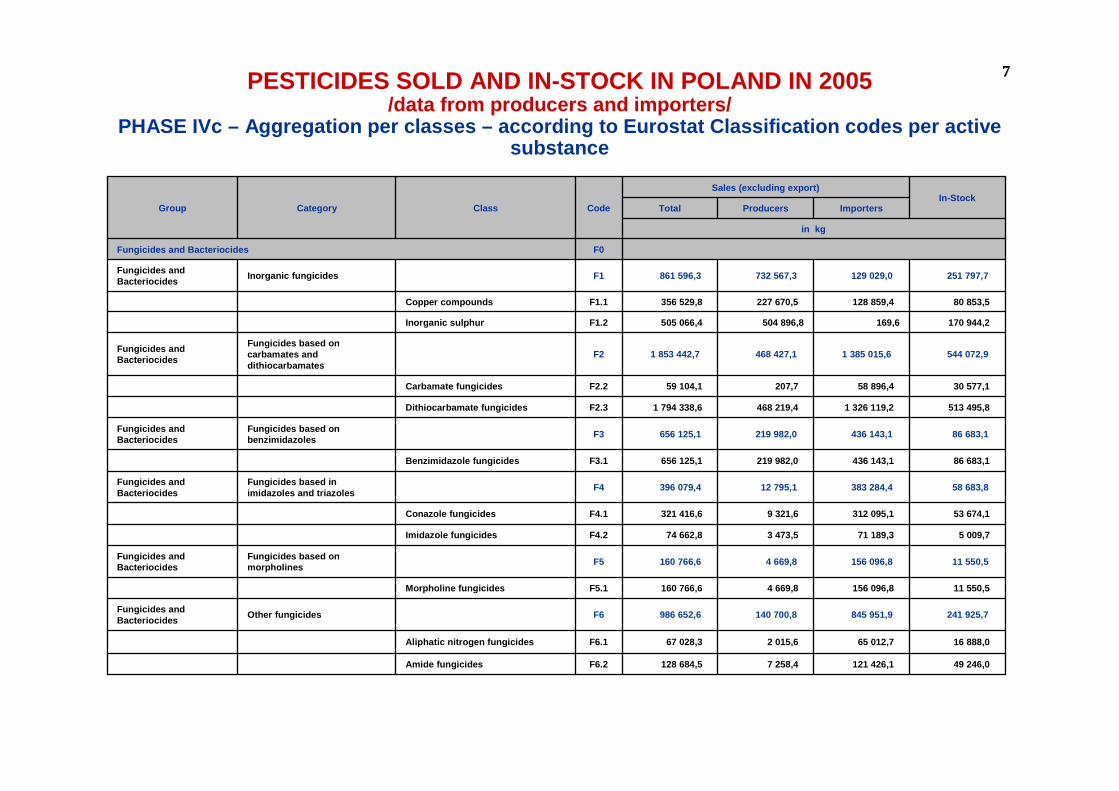
77PESTICIDES SOLD AND IN-STOCK IN POLAND IN 2005/data from producers and importers/
PHASE IVc – Aggregation per classes – according to Eur ostat Classification codes per active substance
49 246,0 121 426,1 7 258,4 128 684,5 F6.2Amide fungicides
16 888,0 65 012,7 2 015,6 67 028,3 F6.1Aliphatic nitrogen fungicides
241 925,7 845 951,9 140 700,8 986 652,6 F6Other fungicidesFungicides and Bacteriocides
11 550,5 156 096,8 4 669,8 160 766,6 F5.1Morpholine fungicides
11 550,5 156 096,8 4 669,8 160 766,6 F5Fungicides based on morpholines
Fungicides and Bacteriocides
5 009,7 71 189,3 3 473,5 74 662,8 F4.2Imidazole fungicides
53 674,1 312 095,1 9 321,6 321 416,6 F4.1Conazole fungicides
58 683,8 383 284,4 12 795,1 396 079,4 F4Fungicides based in imidazoles and triazoles
Fungicides and Bacteriocides
86 683,1 436 143,1 219 982,0 656 125,1 F3.1Benzimidazole fungicides
86 683,1 436 143,1 219 982,0 656 125,1 F3Fungicides based on benzimidazoles
Fungicides and Bacteriocides
513 495,8 1 326 119,2 468 219,4 1 794 338,6 F2.3Dithiocarbamate fungicides
30 577,1 58 896,4 207,7 59 104,1 F2.2Carbamate fungicides
544 072,9 1 385 015,6 468 427,1 1 853 442,7 F2Fungicides based on carbamates and dithiocarbamates
Fungicides and Bacteriocides
170 944,2 169,6 504 896,8 505 066,4 F1.2Inorganic sulphur
80 853,5 128 859,4 227 670,5 356 529,8 F1.1Copper compounds
251 797,7 129 029,0 732 567,3 861 596,3 F1Inorganic fungicidesFungicides and Bacteriocides
F0Fungicides and Bacteriocides
in kg
ImportersProducersTotalIn-Stock
Sales (excluding export)
CodeClassCategoryGroup

88
3 249 957,9 9 923 050,8 6 116 079,8 16 039 130,6 TOTAL
114 826,5 274 404,1 594 355,8 868 759,9 ZR0Other Plant Protection Products – TOTAL
73 400,0 188 683,8 264 831,1 453 514,9 ZR5.2Other Plant Protection Products
73 400,0 188 683,8 264 831,1 453 514,9 ZR5All other plant protection products
Other Plant Protection Products
8 831,2 11 021,9 1 241,0 12 263,0 ZR4.1Rodenticides
8 831,2 11 021,9 1 241,0 12 263,0 ZR4RodenticidesOther Plant Protection Products
2 185,8 14 325,8 16 080,8 30 406,6 ZR3.2Other soil sterilants
27 440,0 53 655,0 -53 655,0 ZR3.1Methyl bromide
29 625,8 67 980,8 16 080,8 84 061,6 ZR3Soil sterilants (incl. Nematicides)
Other Plant Protection Products
184,0 -58 053,6 58 053,6 ZR2.1Vegetal oil
184,0 -58 053,6 58 053,6 ZR2Vegetal oilsOther Plant Protection Products
2 785,5 6 717,6 254 149,3 260 866,9 ZR1.1Mineral oil
2 785,5 6 717,6 254 149,3 260 866,9 ZR1Mineral oilsOther Plant Protection Products
ZR0Other Plant Protection Products
359 269,0 858 775,1 512 281,9 1 371 057,0 PGR0Plant Growth Regulators – TOTAL
4 124,5 13 466,0 1 612,0 15 078,0 PGR3.1Other plant growth regulators
4 124,5 13 466,0 1 612,0 15 078,0 PGR3Other plant growth regulatorsPlant Growth Regulators
355 144,5 845 309,1 510 669,9 1 355 979,0 PGR1.1Physiological Plant growth regulators
355 144,5 845 309,1 510 669,9 1 355 979,0 PGR1Physiological Plant growth regulators
Plant Growth Regulators
PGR0Plant Growth Regulators
PESTICIDES SOLD AND IN-STOCK IN POLAND IN 2005/data from producers and importers/ (cont.)
PHASE IVc – Aggregation per classes – according to Eur ostat Classification codes per active substance

99
COMPARISON OF SALES AND USAGE STATISTICS
� Total of 30974 surveys.
� Protected (treated) land area 401456 ha.
� Pesticide active substance use 747 646 kg.
� mean usage = 1,86 kg AS/ha
SALES STATISTICSIn 2005 – 16 039 130 kg AS were sold.
Agricultural crop and orchard area ~12 530 thousand ha.
mean usage PL = 1,28 kg AS/ha
USAGE STATISTICS
Over a four-year cycle (2002-2005) pesticide usage was studied for 21 crops or
crop groups.
1010
WORKING GROUP ON PESTICIDE STATISTICS
In 2006, GUS established a working group on standar dizing systems of data
collection regarding pesticide usage and sales, whi ch includes
representatives from the following:
� Ministry of Agriculture and Rural Development
� Central Statistical Office
� State Plant Health and Seed Inspection Service
� Plant Protection Institute

1111
WORKING GROUP ON PESTICIDE STATISTICS (cont.)
Tasks of the Working group on standardization of da ta collectionsystems regarding pesticide usage and sales:
� analyze and recommend changes in the proposed regul ation
� evaluate both monitoring systems within the context of changes introduced by the new European Parliament regulation
� identify and coordinate efforts to be taken in orde r to adjust both systems to meet the EU requirements
1212
REQUIREMENTS FOR PESTICIDE USAGE STATISTICS
In order to meet the EU requirements, studies on pe sticide usage will need to introduce new rules with regard to:
� selecting representative sample of farms
� choosing crops to be surveyed
� adjusting cycles of data collection
� reporting to Eurostat
� data aggregation within the information system

1313
CHANGE IN THE WAY OF SELECTING A SAMPLE OF FARMS
TO BE SURVEYED REGARDING PESTICIDE USE
� Guidelines on acquiring and collecting statistics o n pesticide usage
assume that farm sample selection proceeds accordin g to quota
sampling.
� The proposed European Parliament and Council regula tion
recommends that farm sample selection is done using random
sampling.
� Necessity to replace quota sampling with random sam pling.

1414
GUIDELINES ON ACQUIRING AND COLLECTING STATISTICS
ON PESTICIDE USAGE
The system of quota sampling relied on:
� division of farms into farm size groups,
� establishing the number and size of farms within ea ch group,
� setting the number of surveys.

1515
GUIDELINES ON ACQUIRING AND COLLECTING STATISTICS
ON PESTICIDE USAGE IN POLAND
Advantages of quota sampling
� Sample selection at the voivodship level and selecti ng the size according to financial and organizational capabilities of the voivodship inspectorate.
� Ability to collect data at all farms within the ran domly selected town as long as the farms grow crops selected for survey s (less expensive studies).
� Collected data allow for findings regarding pestici de usage at the voivodship level, and, following aggregation, the en tire country.

1616
GUIDELINES ON ACQUIRING AND COLLECTING STATISTICS
ON PESTICIDE USAGE
Disadvantages of quota sampling
� Farm selection is not random, despite the town wher e the survey is conducted, being selected randomly.
� Lack of ability to calculate standard error with qu ota sampling.
1717
PROPOSED EUROPEAN PARLIAMENT AND COUNCIL
REGULATION ON PESTICIDE STATISTICS
Random sampling – recommended by the European Union
Advatages:
� Selection of samples at the central level by GUS.
� Ability to estimate standard error.
� Proper estimation of study results onto the entire country because of the random selection.

1818
PROPOSED EUROPEAN PARLIAMENT AND COUNCIL
REGULATION ON PESTICIDE STATISTICS
Random sampling
Disadvantages:
� Concentration of sample units (large number of ques tionnaires) within a particular region of the country causing a possible overload of work for a voivodship inspectorate.
� Large dispersion of sample farms (transportation to farms).
� Results representative for the country, not for eac h voivodship.
� Higher cost of random sampling as opposed to quota sampling.

1919
RANDOM SAMPLING – UNEVEN OVERLOAD OF WORK
FOR VOIVODSHIP INSPECTORATES

2020
PROPOSED EUROPEAN PARLIAMENT AND COUNCIL
REGULATION ON PESTICIDE STATISTICS
Random sampling
� For all crops covered by monitoring the farms will be sampled by the Central Statistical Office (GUS).
� Farm sampling will be based on the Register of Agri cultural and Forest Farms run by GUS (The Register includes information on farm total area, types of crop and crop area).
� Selecting farms to be surveyed will be done regardl ess on the typeof ownership, i.e. it will include both the farms o wned by legal persons and those owned by organizational units, who do not posses legalpersonality.
2121
PROPOSED (RECOMMENDED) DIRECTIONS OF CHANGE
IN THE SYSTEM IN POLAND
USAGE
� Improving the sample representativeness under the cu rrent system.
� Changing the way and organization of data collectio n.
� Developing a comprehensive information system for d ata collection, processing and system management.
� Organizing an informational campaign directed at fa rmers regarding the importance of keeping the treatment data.
� Wider application of survey results for strategies and policies in agriculture, public health and environmental pro tection.

2222
CROPS SELECTED TO BE SURVEYED IN 2007.
It is estimated that the size of the random sample will not exceed 10 000 farms
� 6 crops – winter wheat, spring wheat, rye, sugar beet, apple trees, plum trees
� GUS will select:� 5000 farms– growing cereal crops� 2000 farms– growing beets� 3000 farms– growing orchard crops

2323
SURVEYED FARM
According to the assumptions, 3 cereal crops select ed to be monitored in 2007 can be surveyed during the same visit at the farm, provided that the farm actually
grows them (the same principle applies to orchard c rops)
PRINCIPLES OF MONITORING PESTICIDE USAGE
IN THE NEW SYSTEM
CEREAL SAMPLE5000 farms ORCHARD CROPS
SAMPLE3000 farms
BEET SAMPLE 2000 farms