project workbook - nyuadamodar/pdfiles/execs/projworkbook.pdf · project workbook! “talk is...
TRANSCRIPT

1!
Project Workbook!
“Talk is cheap. Time for action”
2!
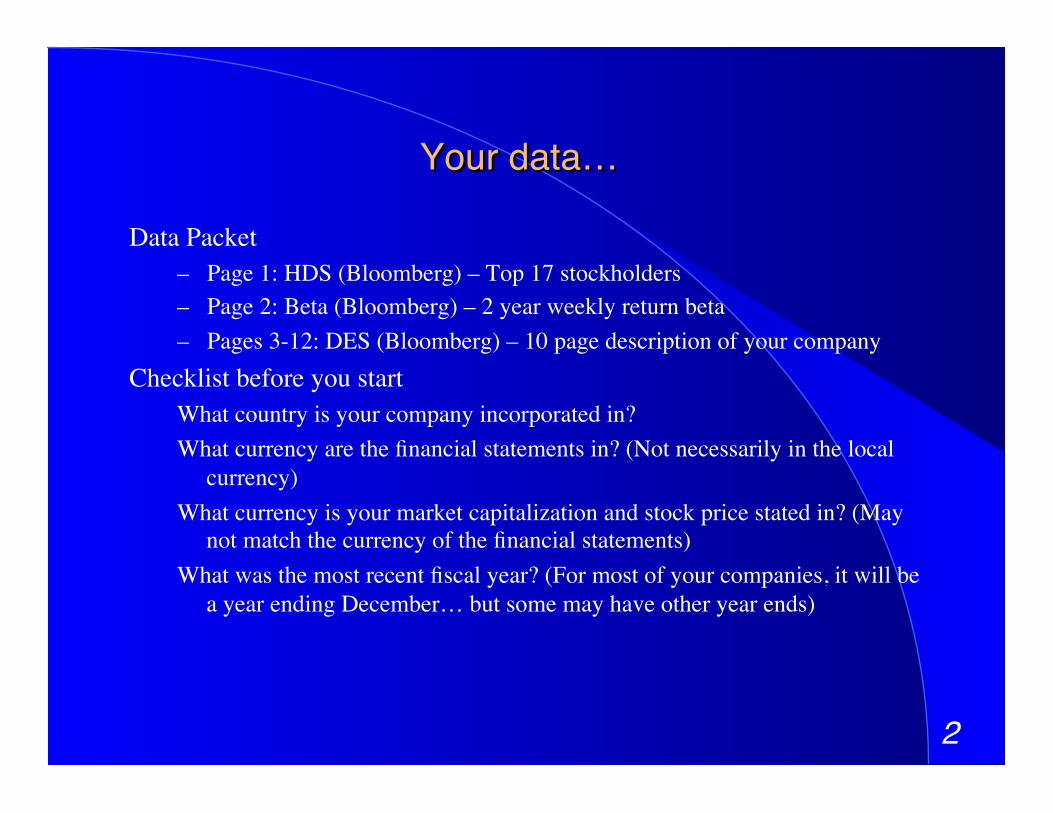
Your data…!
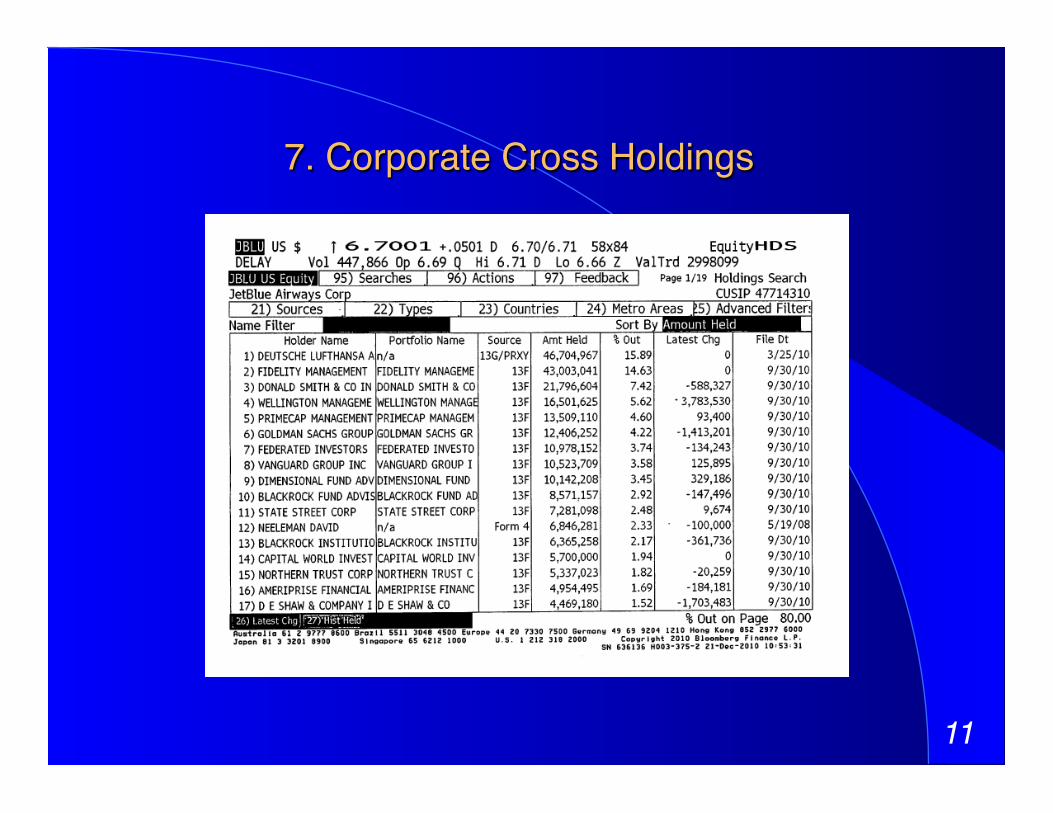
Data Packet – Page 1: HDS (Bloomberg) – Top 17 stockholders – Page 2: Beta (Bloomberg) – 2 year weekly return beta – Pages 3-12: DES (Bloomberg) – 10 page description of your company
Checklist before you start What country is your company incorporated in? What currency are the financial statements in? (Not necessarily in the local
currency) What currency is your market capitalization and stock price stated in? (May
not match the currency of the financial statements) What was the most recent fiscal year? (For most of your companies, it will be
a year ending December… but some may have other year ends)
3!
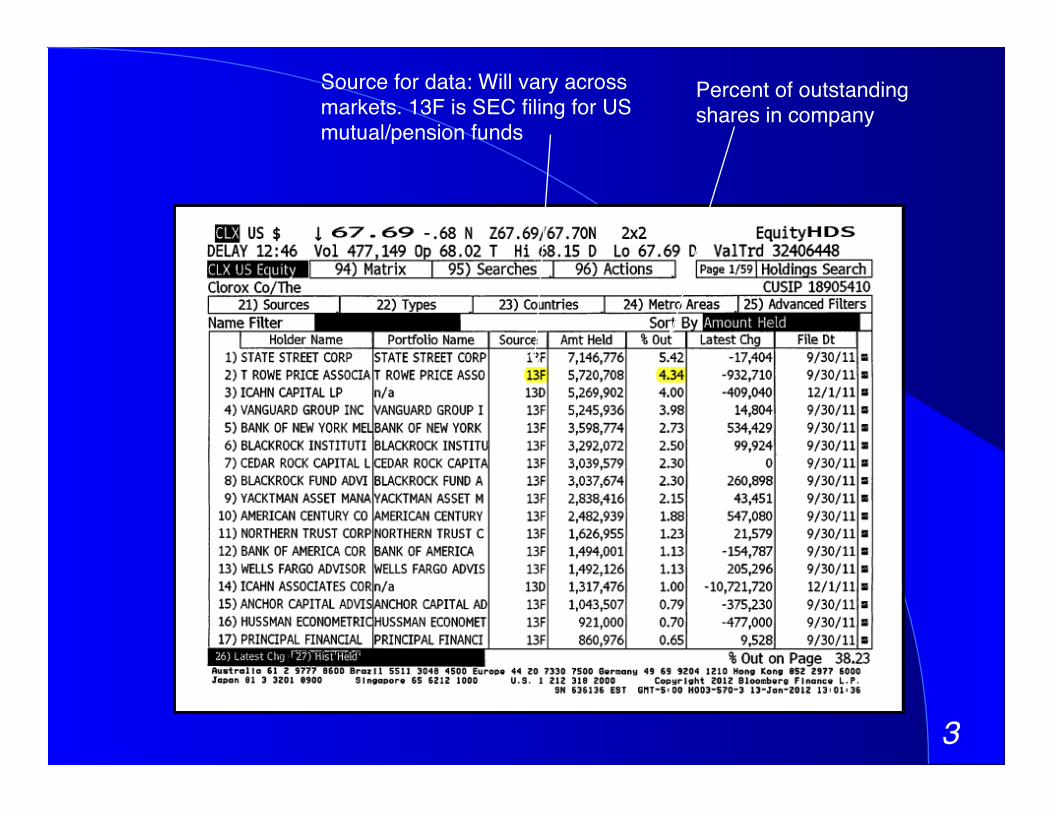
Percent of outstanding shares in company!
Source for data: Will vary across markets. 13F is SEC filing for US mutual/pension funds!

4!
Corporate Governance: Assessing where the power lies and potential conflicts of interest!

5!
1. Institutional Default!

6!
2. Self Holdings?!

7!
3. The Government Influence? !
8!
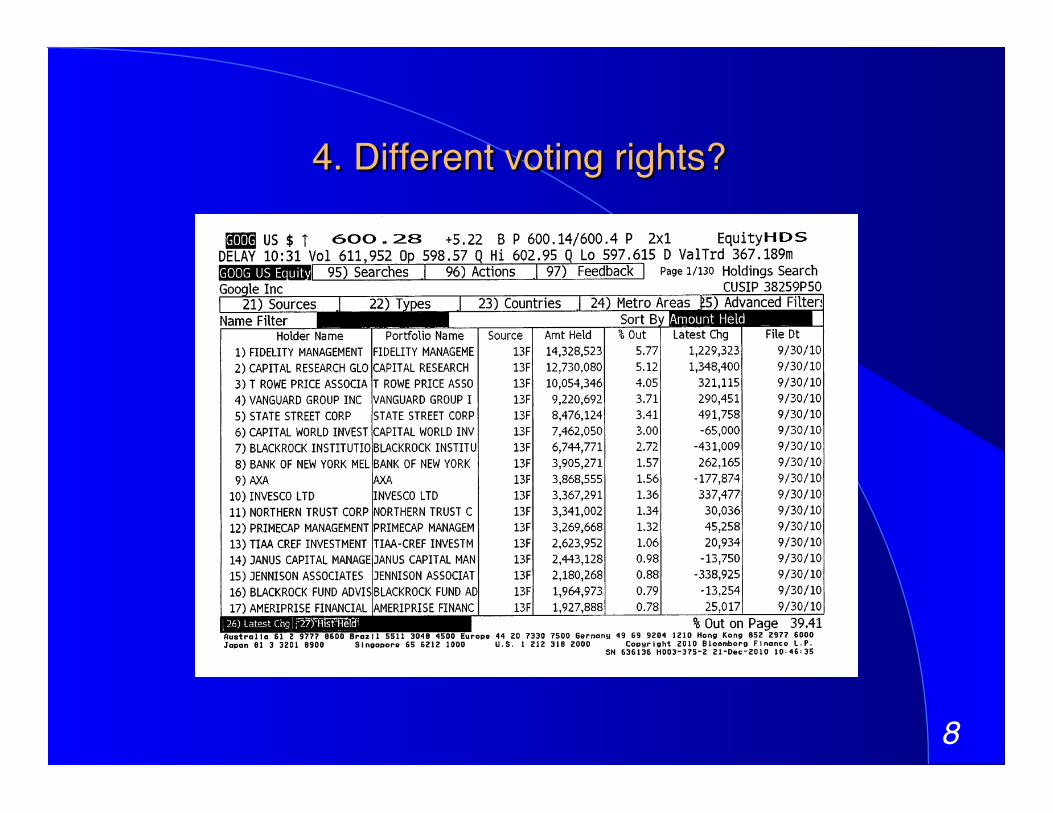
4. Different voting rights? !

9!
5. Family Group Companies!
10!
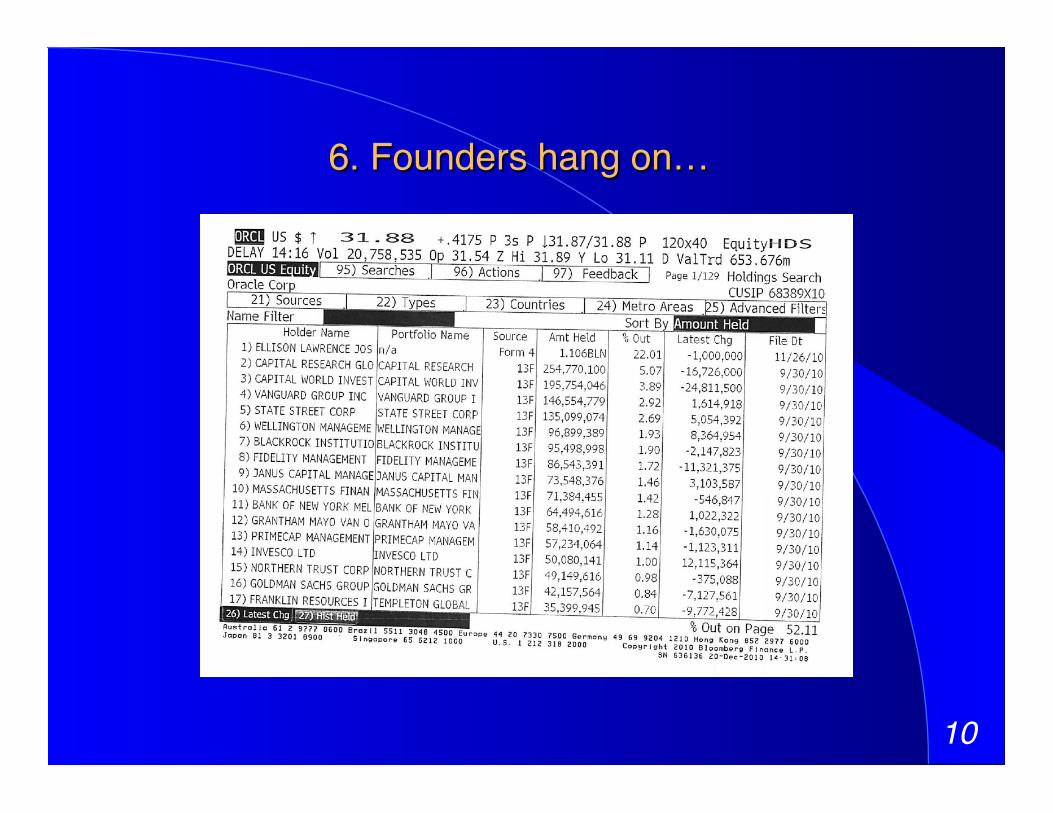
6. Founders hang on…!
11!
7. Corporate Cross Holdings !

12!
8. Activist investors!
13!
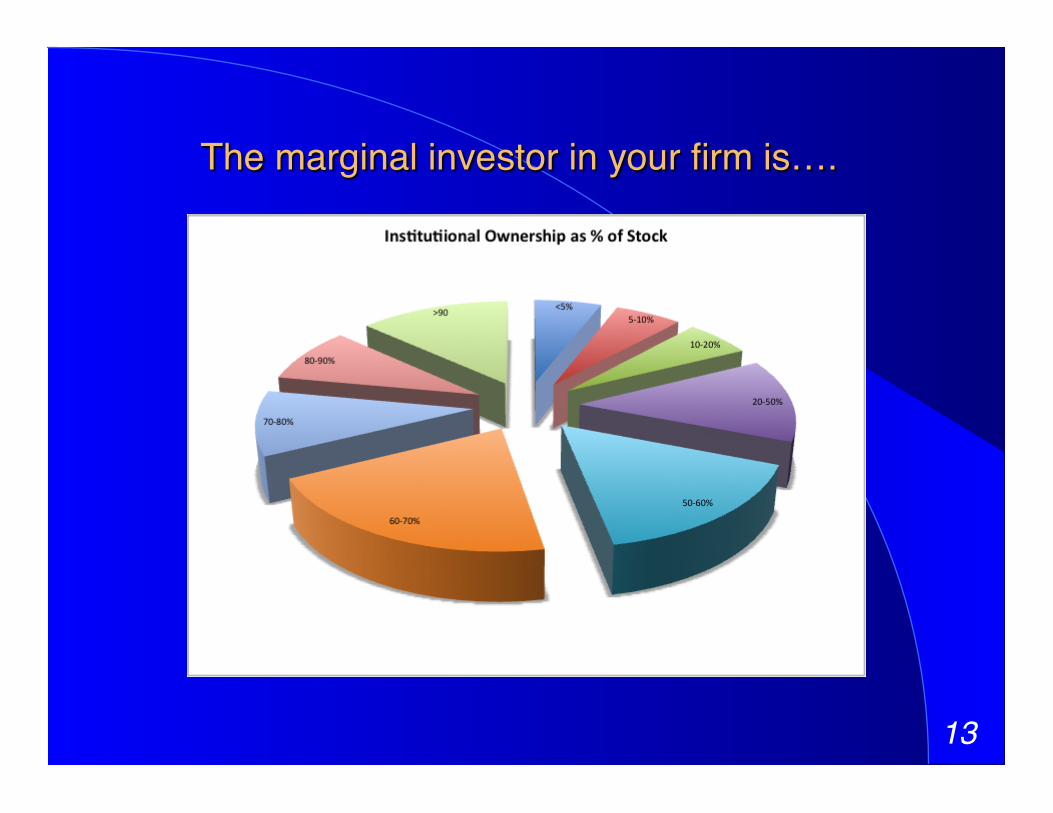
The marginal investor in your firm is….!
14!
15!
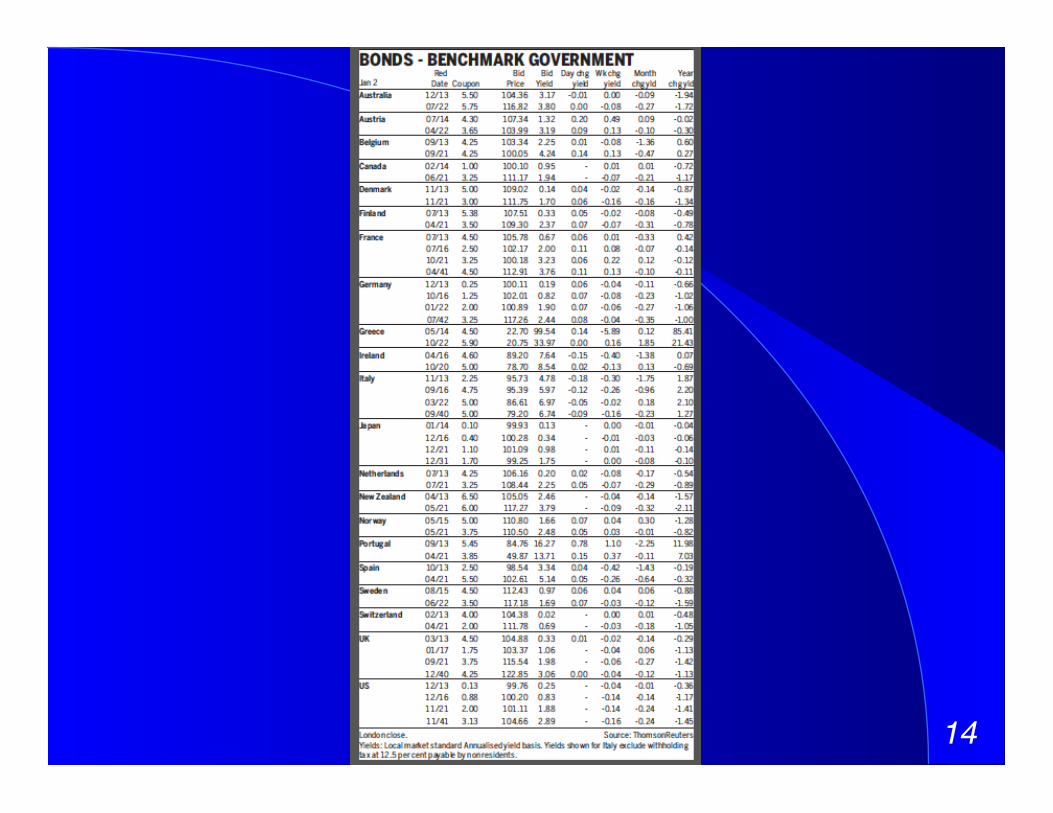
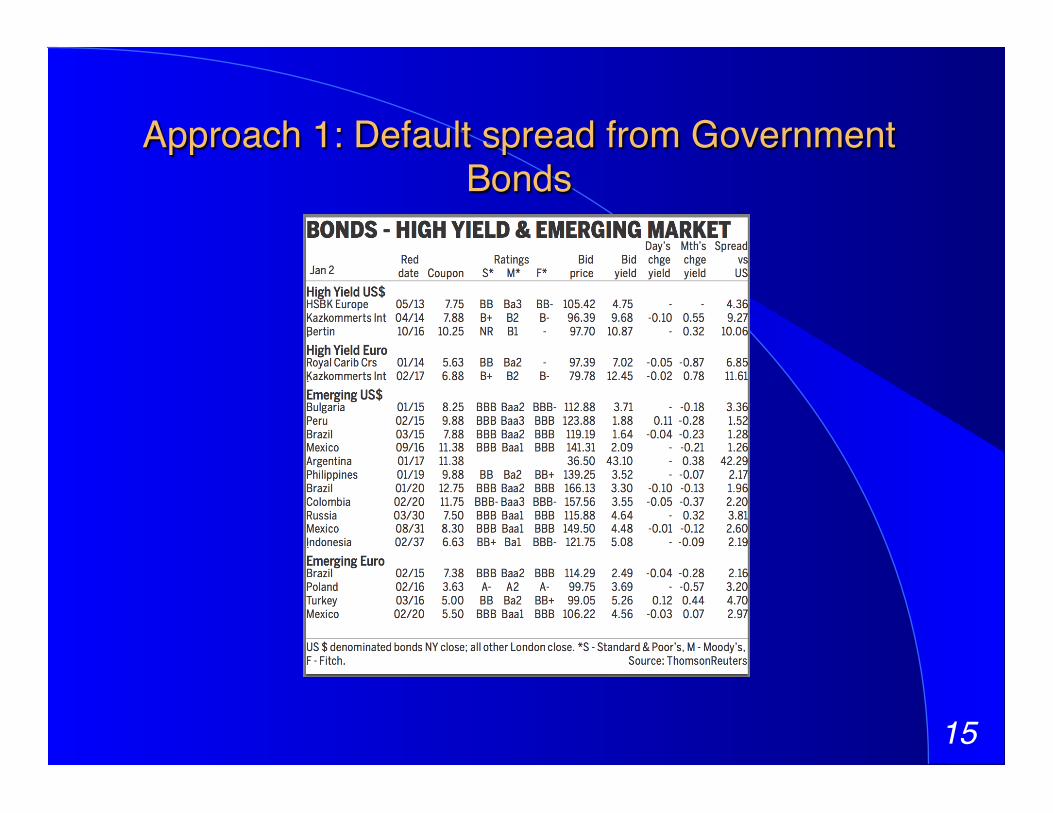
Approach 1: Default spread from Government Bonds!

16!
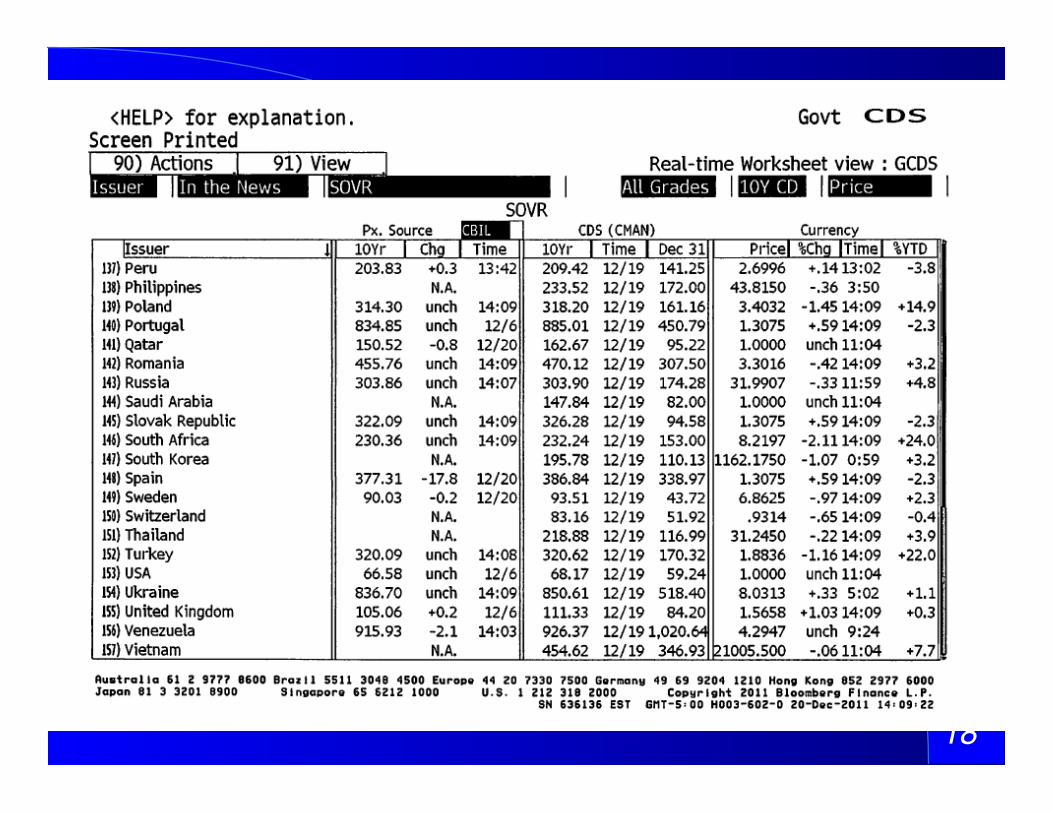
Approach 2: CDS spreads!
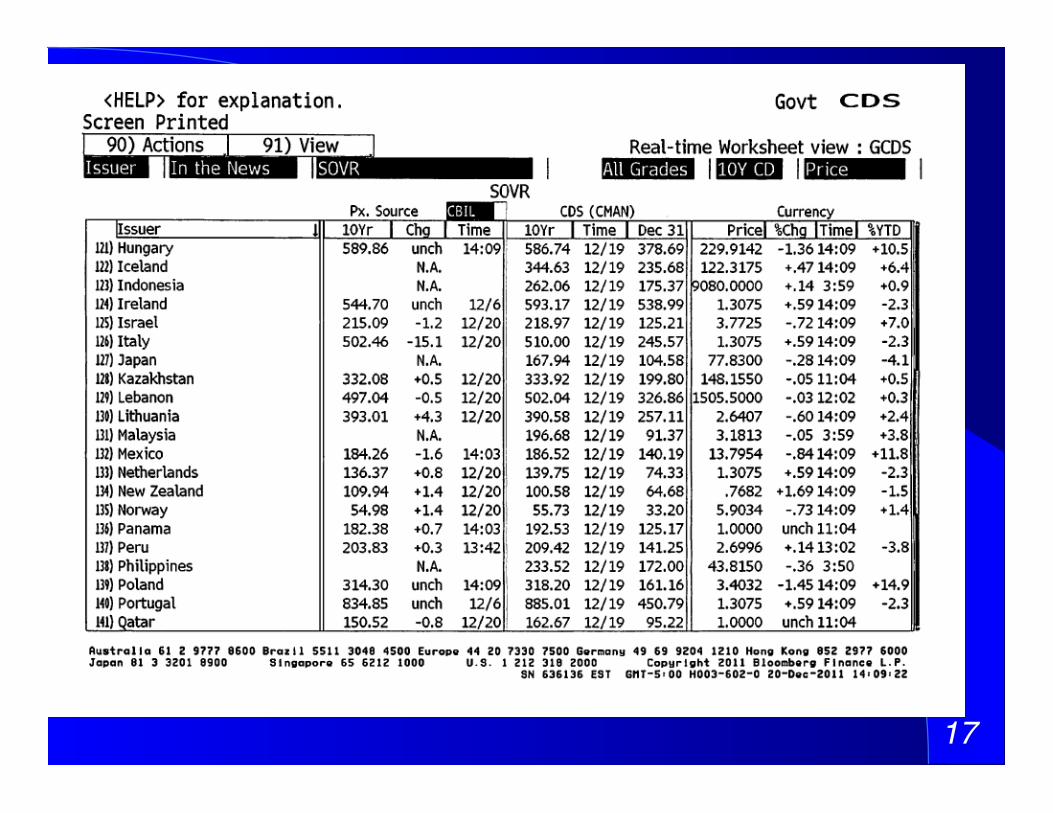
17!
18!
19!
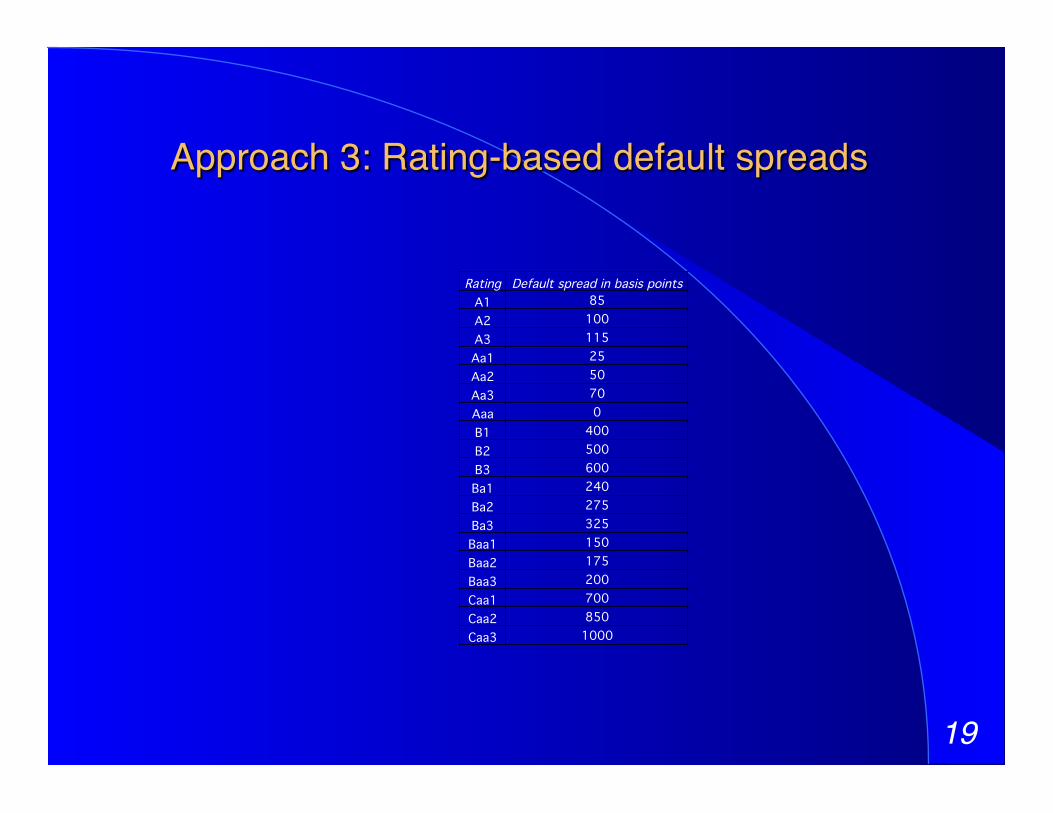
Approach 3: Rating-based default spreads!
Rating! Default spread in basis points!A1! 85!A2! 100!A3! 115!Aa1! 25!Aa2! 50!Aa3! 70!Aaa! 0!B1! 400!B2! 500!B3! 600!Ba1! 240!Ba2! 275!Ba3! 325!Baa1! 150!Baa2! 175!Baa3! 200!Caa1! 700!Caa2! 850!Caa3! 1000!
20!
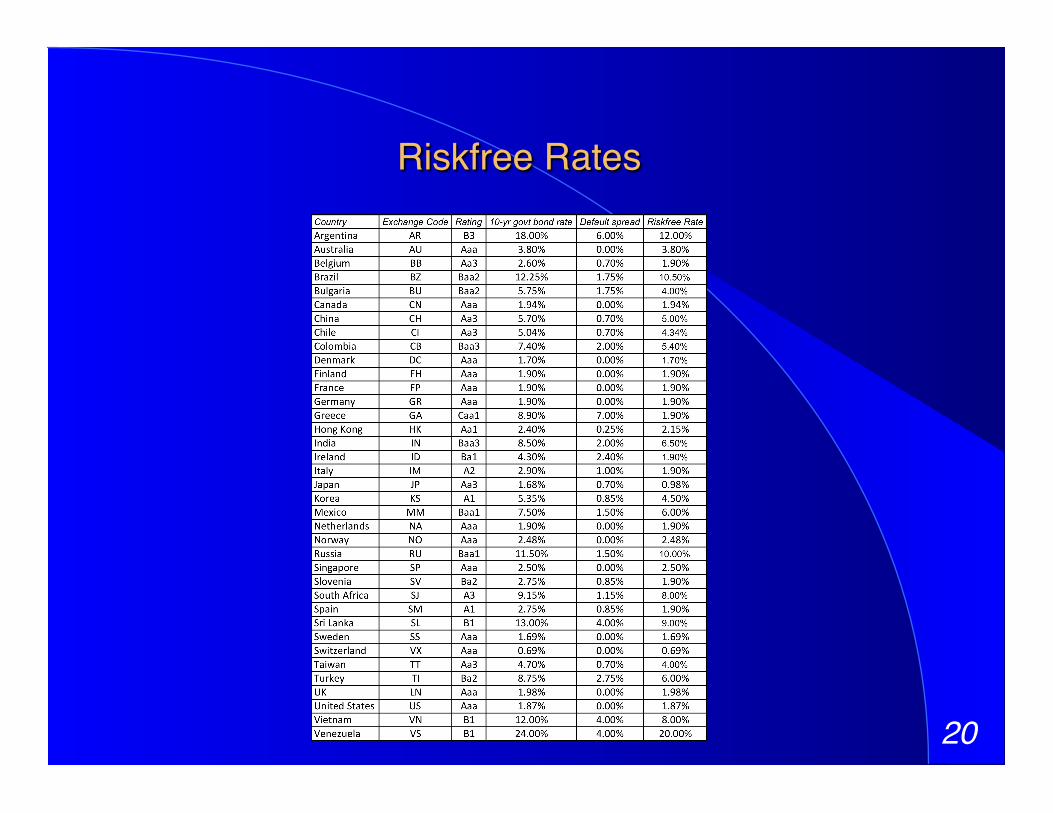
Riskfree Rates!
21!
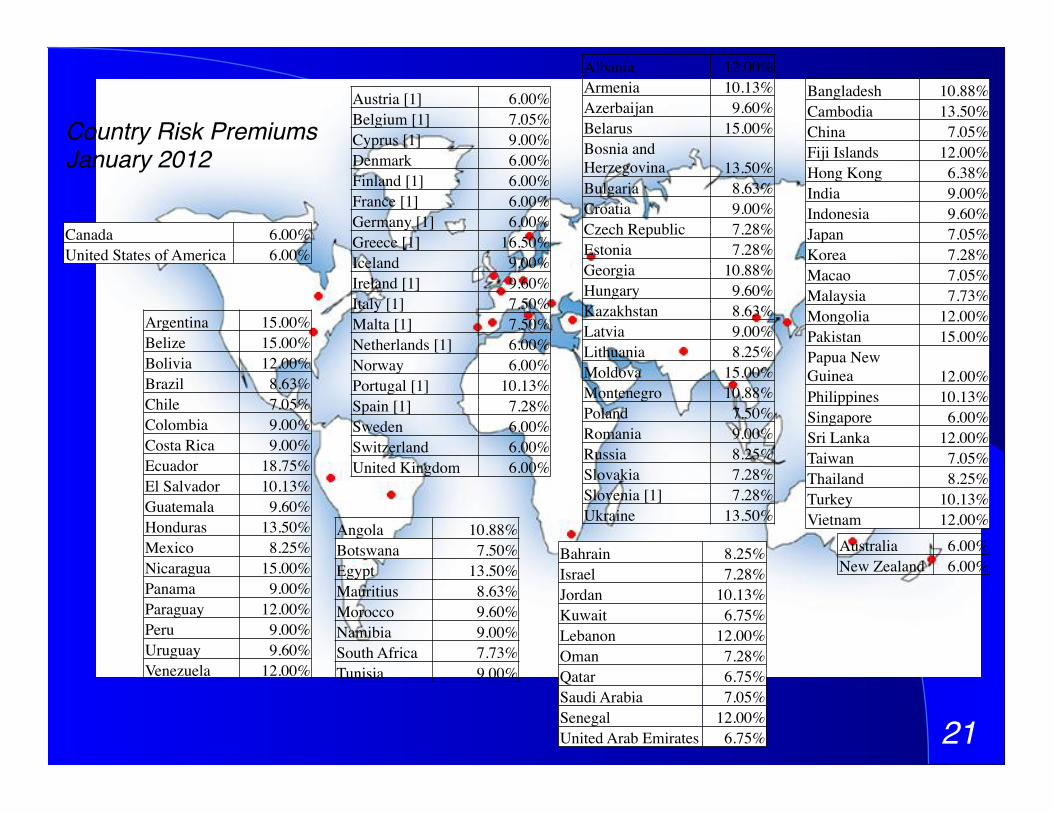
Country Risk Premiums!January 2012!
Angola 10.88% Botswana 7.50% Egypt 13.50% Mauritius 8.63% Morocco 9.60% Namibia 9.00% South Africa 7.73% Tunisia 9.00%
Bangladesh 10.88% Cambodia 13.50% China 7.05% Fiji Islands 12.00% Hong Kong 6.38% India 9.00% Indonesia 9.60% Japan 7.05% Korea 7.28% Macao 7.05% Malaysia 7.73% Mongolia 12.00% Pakistan 15.00% Papua New Guinea 12.00% Philippines 10.13% Singapore 6.00% Sri Lanka 12.00% Taiwan 7.05% Thailand 8.25% Turkey 10.13% Vietnam 12.00%
Australia 6.00% New Zealand 6.00%
Argentina 15.00% Belize 15.00% Bolivia 12.00% Brazil 8.63% Chile 7.05% Colombia 9.00% Costa Rica 9.00% Ecuador 18.75% El Salvador 10.13% Guatemala 9.60% Honduras 13.50% Mexico 8.25% Nicaragua 15.00% Panama 9.00% Paraguay 12.00% Peru 9.00% Uruguay 9.60% Venezuela 12.00%
Albania 12.00% Armenia 10.13% Azerbaijan 9.60% Belarus 15.00% Bosnia and Herzegovina 13.50% Bulgaria 8.63% Croatia 9.00% Czech Republic 7.28% Estonia 7.28% Georgia 10.88% Hungary 9.60% Kazakhstan 8.63% Latvia 9.00% Lithuania 8.25% Moldova 15.00% Montenegro 10.88% Poland 7.50% Romania 9.00% Russia 8.25% Slovakia 7.28% Slovenia [1] 7.28% Ukraine 13.50%
Bahrain 8.25% Israel 7.28% Jordan 10.13% Kuwait 6.75% Lebanon 12.00% Oman 7.28% Qatar 6.75% Saudi Arabia 7.05% Senegal 12.00% United Arab Emirates 6.75%
Canada 6.00% United States of America 6.00%
Austria [1] 6.00% Belgium [1] 7.05% Cyprus [1] 9.00% Denmark 6.00% Finland [1] 6.00% France [1] 6.00% Germany [1] 6.00% Greece [1] 16.50% Iceland 9.00% Ireland [1] 9.60% Italy [1] 7.50% Malta [1] 7.50% Netherlands [1] 6.00% Norway 6.00% Portugal [1] 10.13% Spain [1] 7.28% Sweden 6.00% Switzerland 6.00% United Kingdom 6.00%

22!
Equity Risk Premiums!
23!
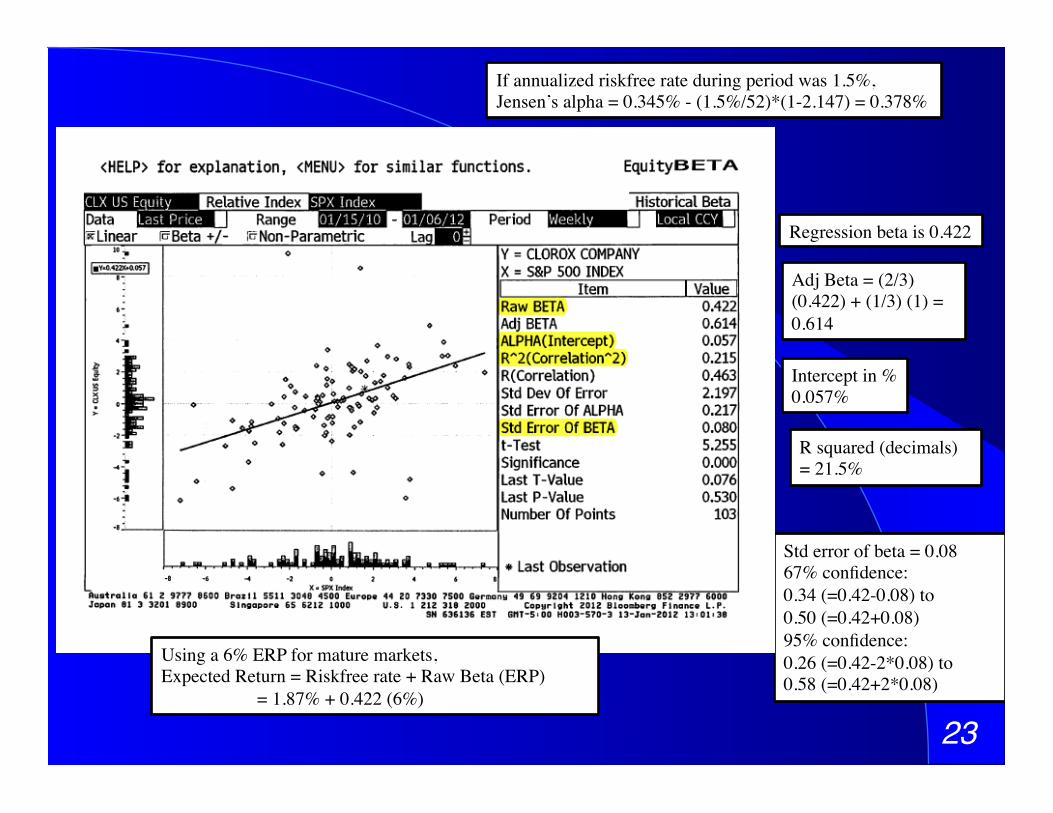
Regression beta is 0.422
Intercept in % 0.057%
Adj Beta = (2/3)(0.422) + (1/3) (1) = 0.614
R squared (decimals) = 21.5%
Std error of beta = 0.08 67% confidence: 0.34 (=0.42-0.08) to 0.50 (=0.42+0.08) 95% confidence: 0.26 (=0.42-2*0.08) to 0.58 (=0.42+2*0.08)
If annualized riskfree rate during period was 1.5%, Jensen’s alpha = 0.345% - (1.5%/52)*(1-2.147) = 0.378%
Using a 6% ERP for mature markets, Expected Return = Riskfree rate + Raw Beta (ERP)
= 1.87% + 0.422 (6%)
24!
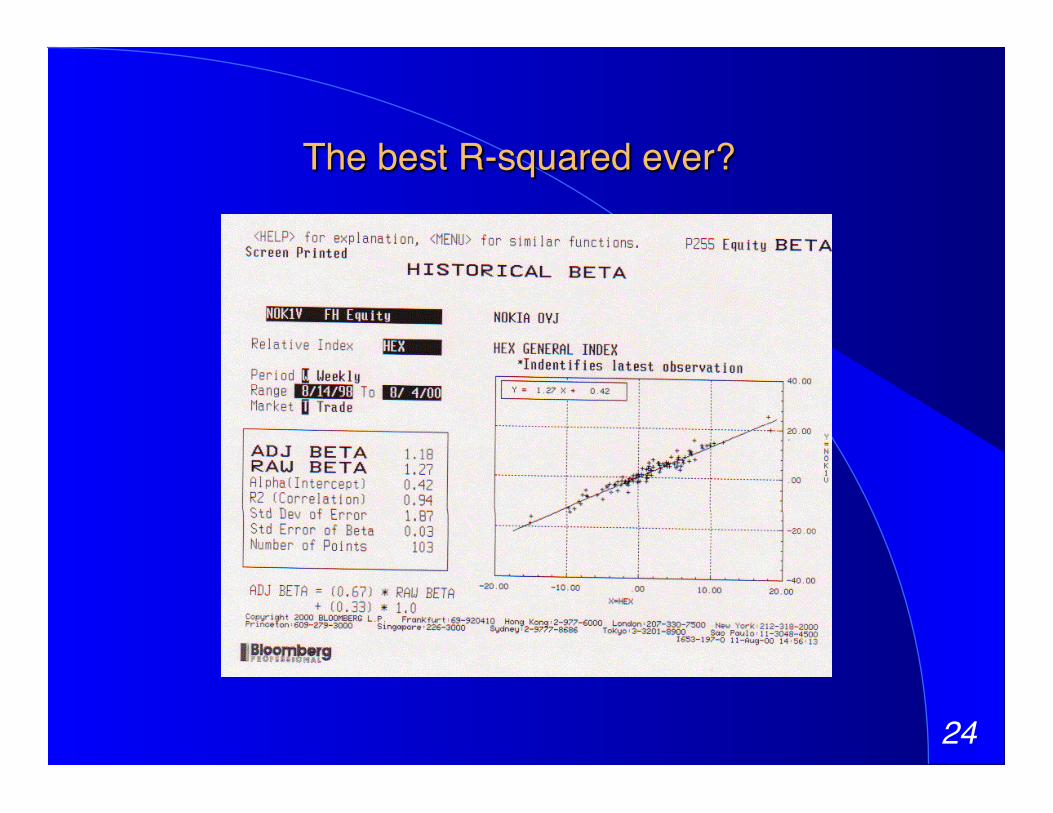
The best R-squared ever?!

25!
26!

27!
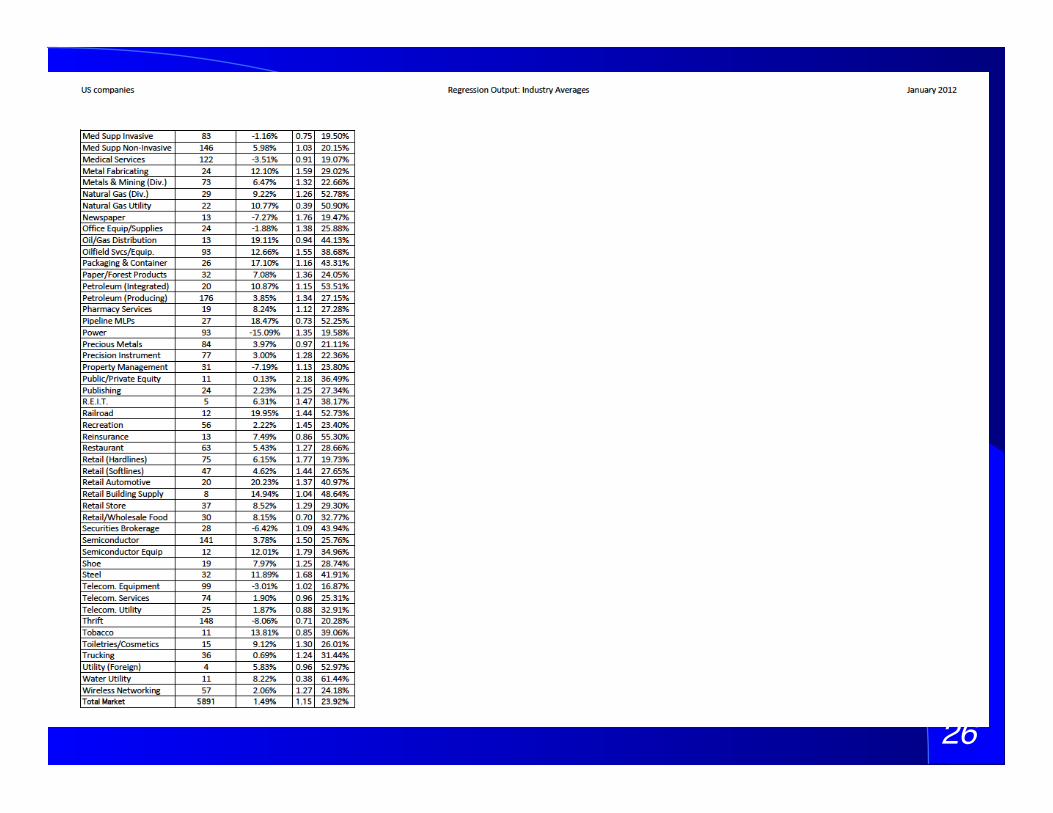
What sector is your firm in?!Bloomberg sector category
Read the description and make your own judgment
28!
29!
30!
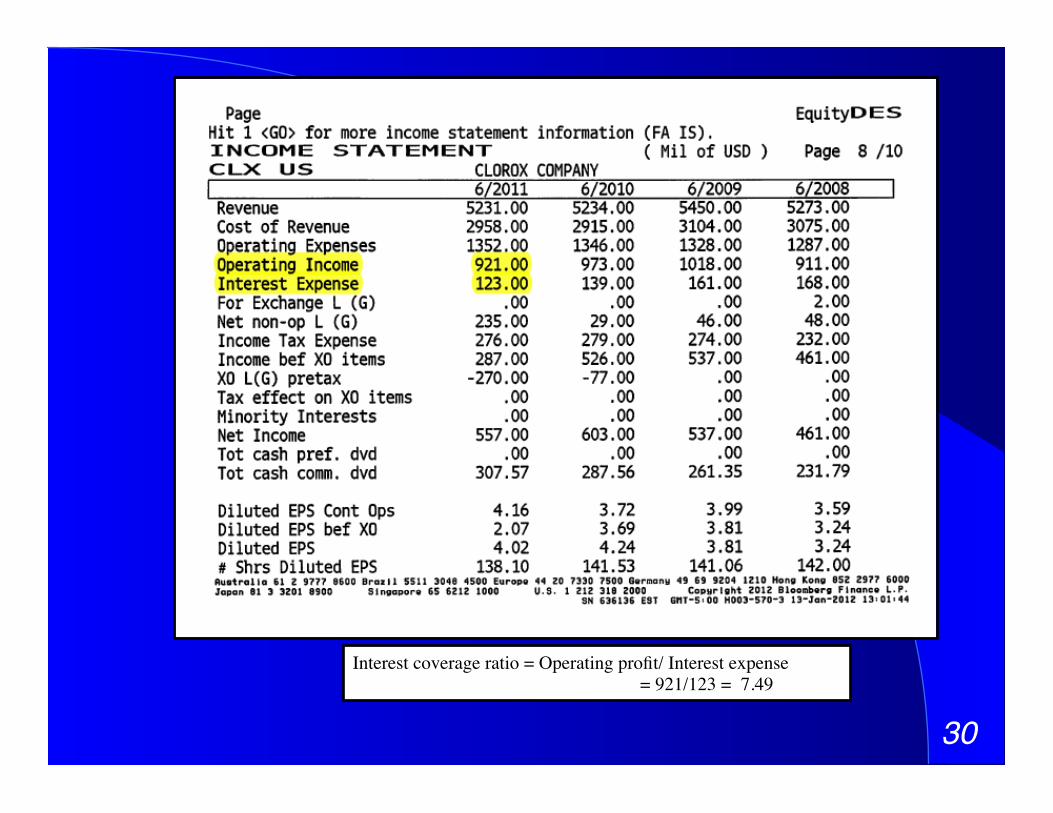
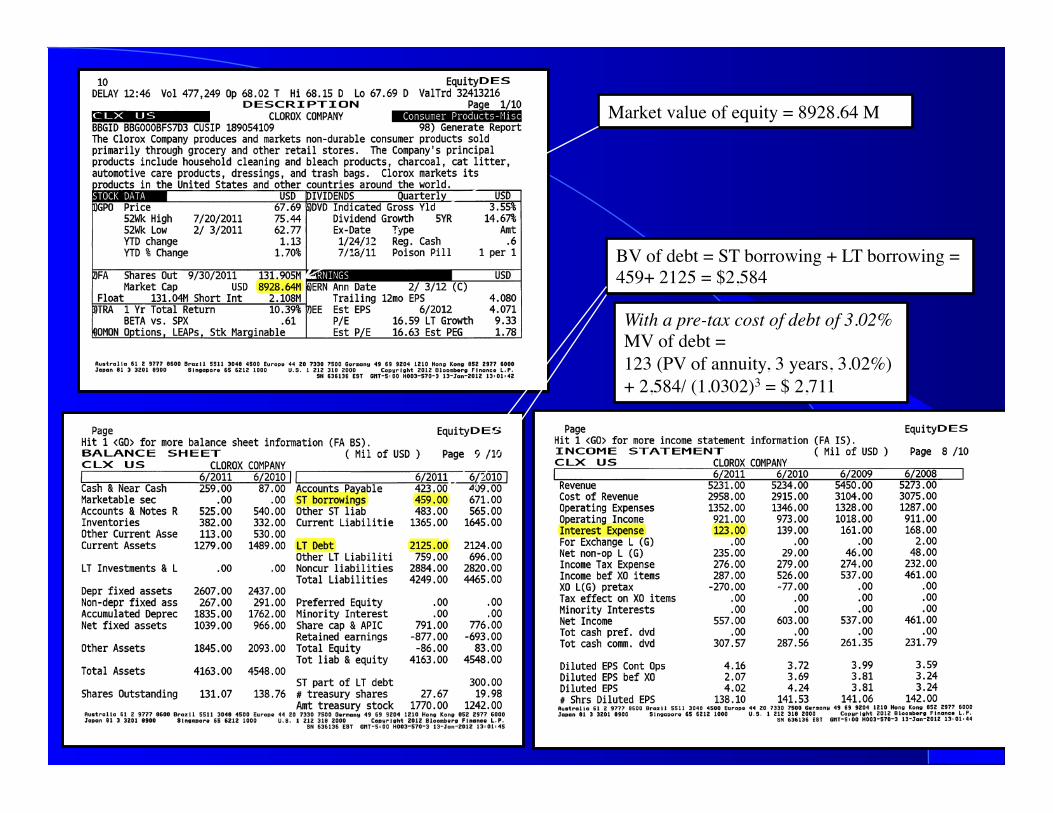
Interest coverage ratio = Operating profit/ Interest expense = 921/123 = 7.49
31!
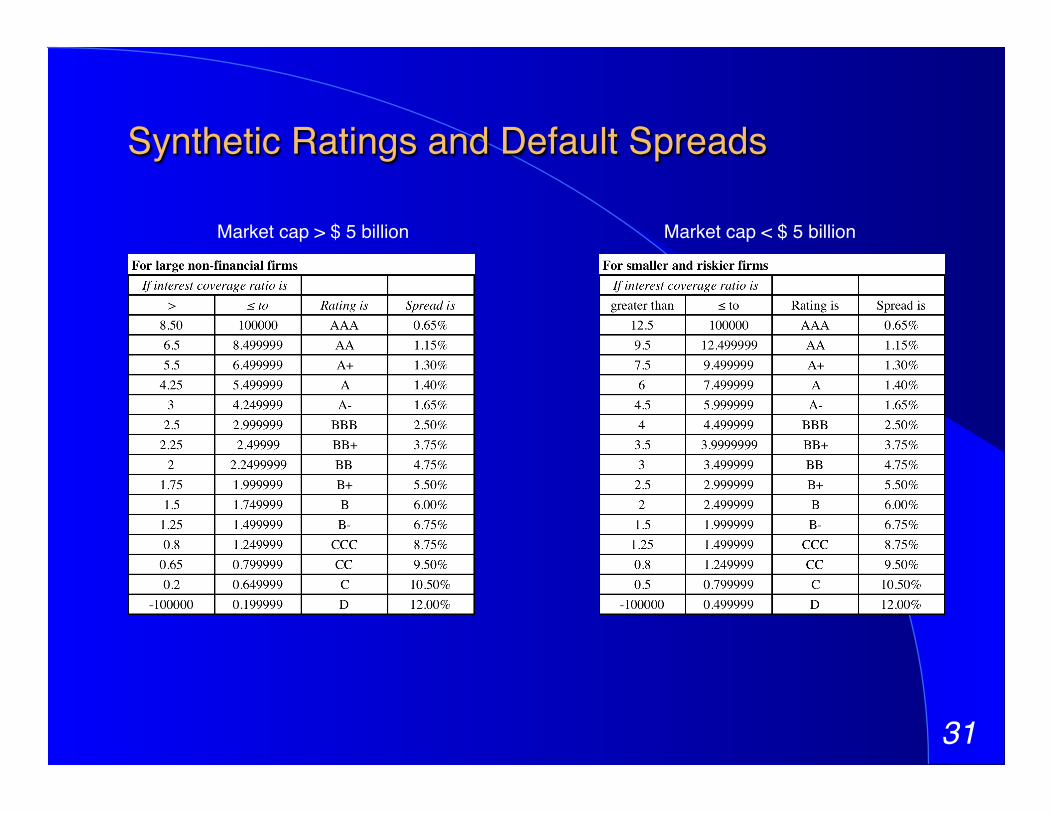
Synthetic Ratings and Default Spreads!
Market cap > $ 5 billion! Market cap < $ 5 billion!
32!
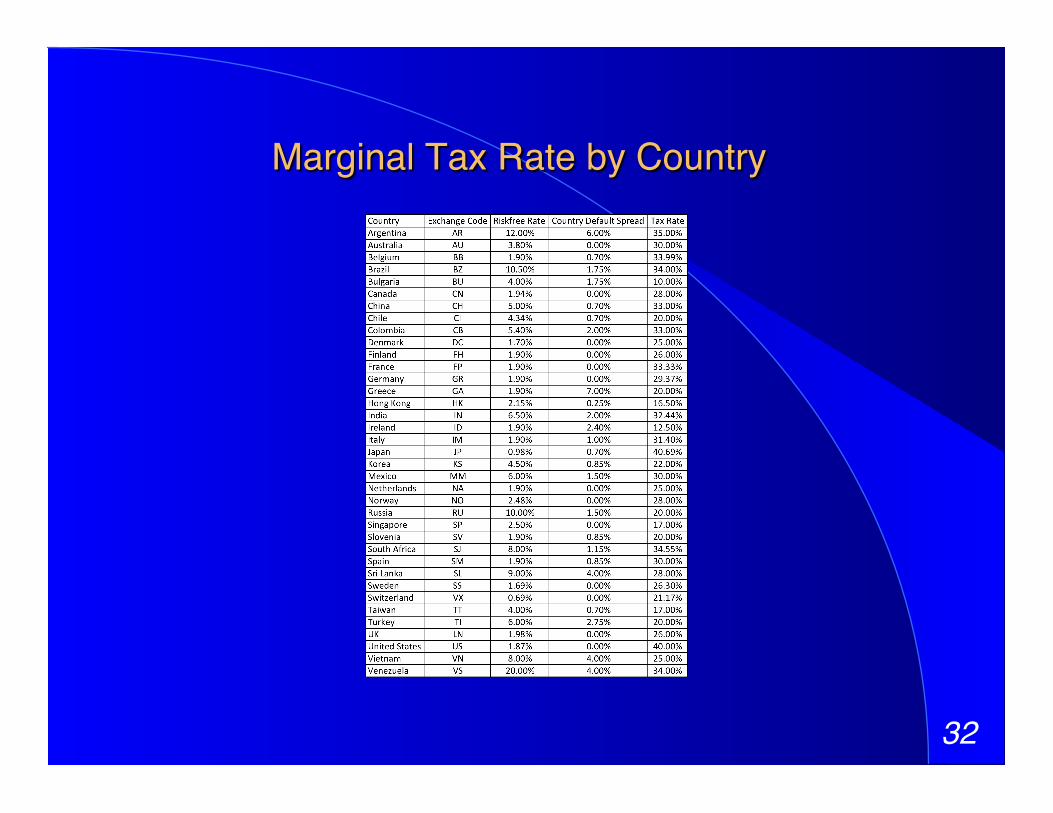
Marginal Tax Rate by Country!
33!
Market value of equity = 8928.64 M
BV of debt = ST borrowing + LT borrowing = 459+ 2125 = $2,584
With a pre-tax cost of debt of 3.02% MV of debt = 123 (PV of annuity, 3 years, 3.02%) + 2,584/ (1.0302)3 = $ 2,711
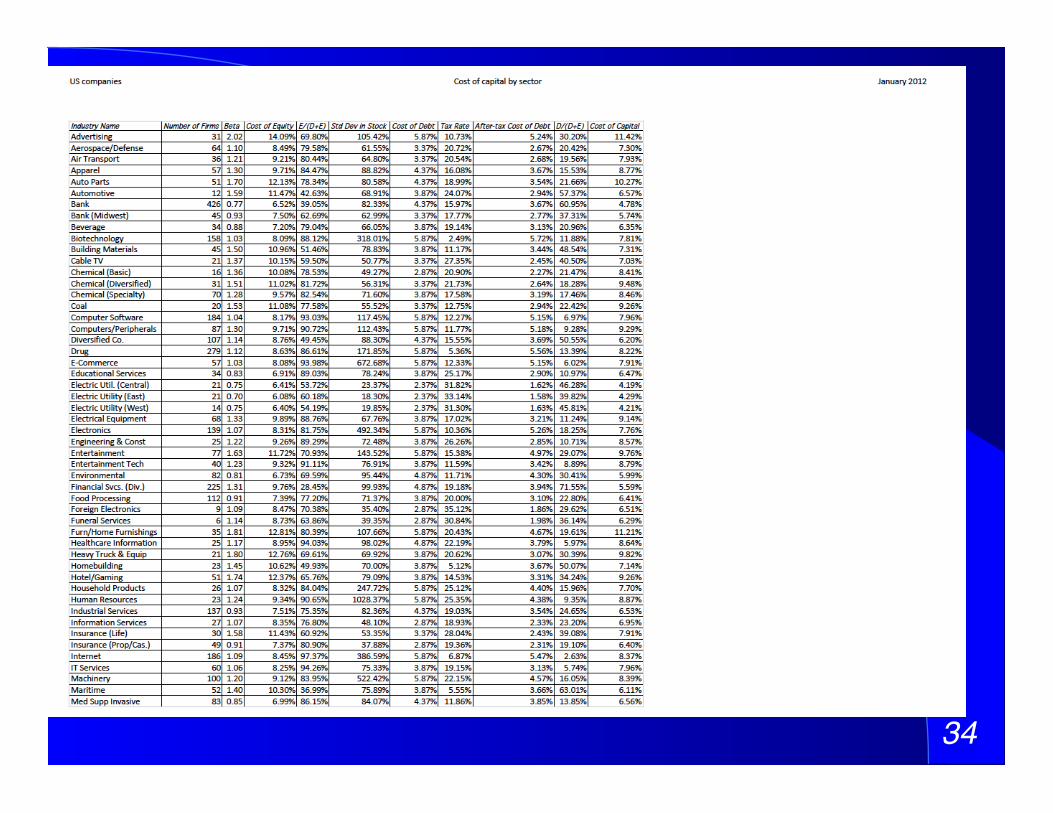
34!

35!
36!
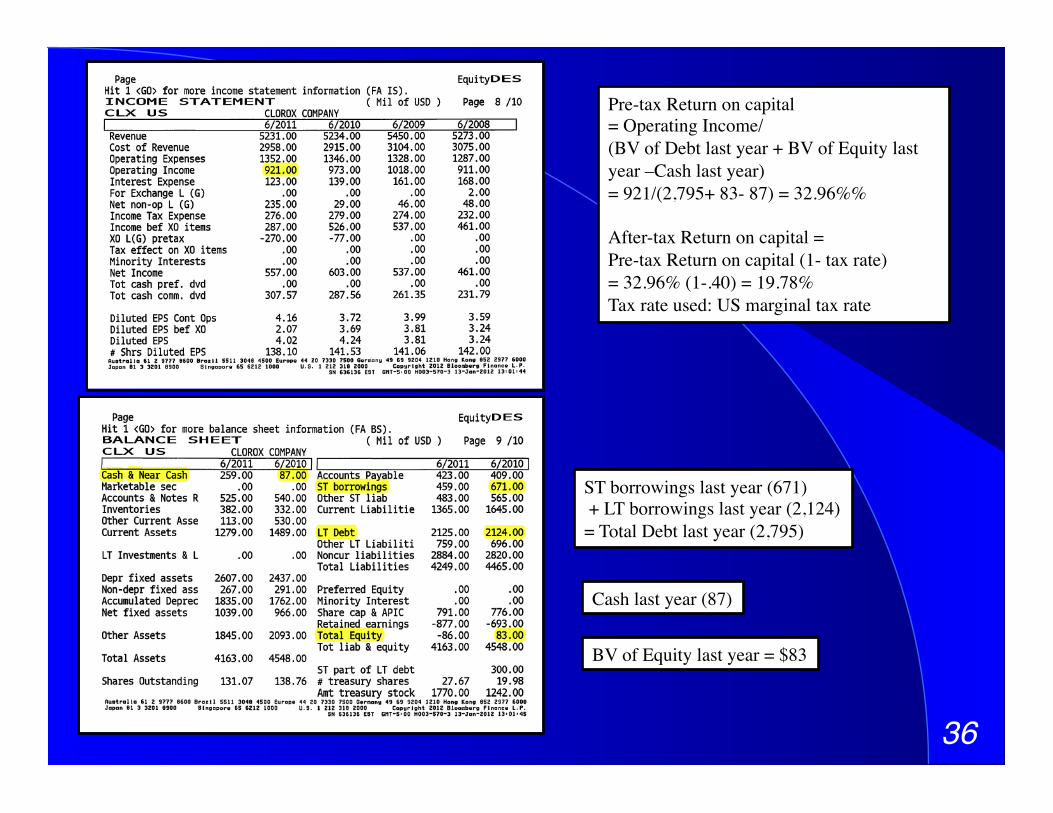
Pre-tax Return on capital = Operating Income/ (BV of Debt last year + BV of Equity last year –Cash last year) = 921/(2,795+ 83- 87) = 32.96%% After-tax Return on capital = Pre-tax Return on capital (1- tax rate) = 32.96% (1-.40) = 19.78% Tax rate used: US marginal tax rate
BV of Equity last year = $83
ST borrowings last year (671) + LT borrowings last year (2,124) = Total Debt last year (2,795)
Cash last year (87)

37!
38!
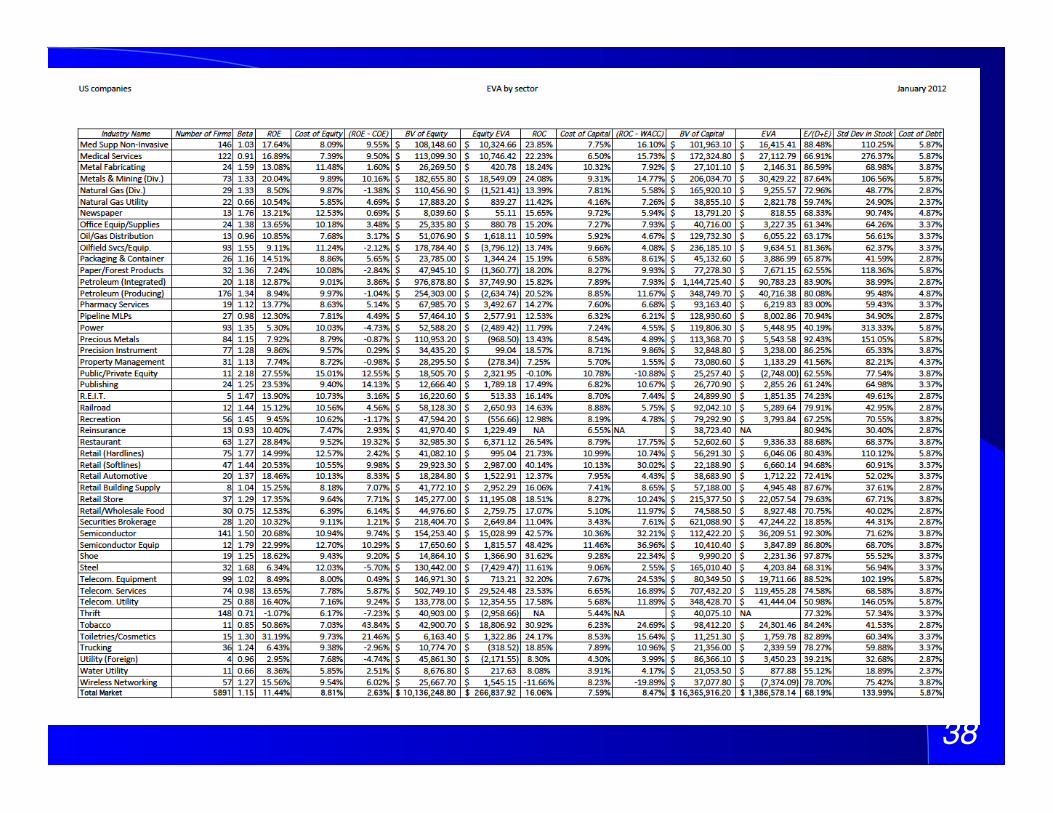
39!

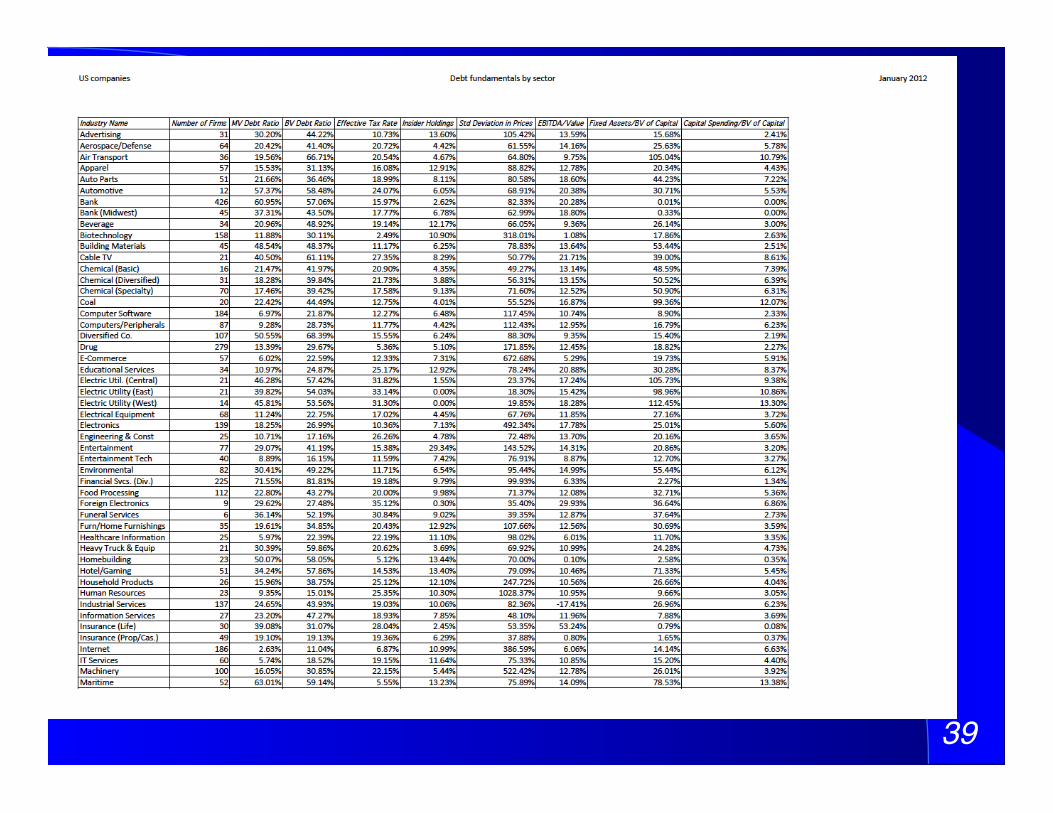
40!

41!
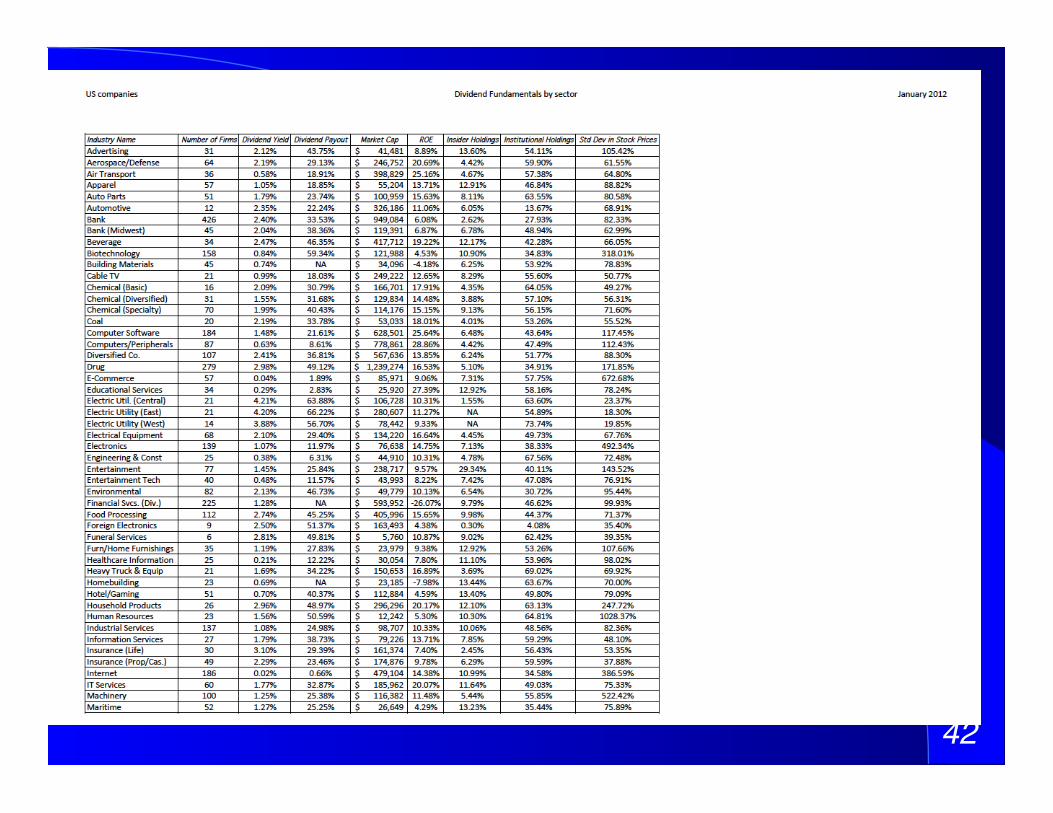
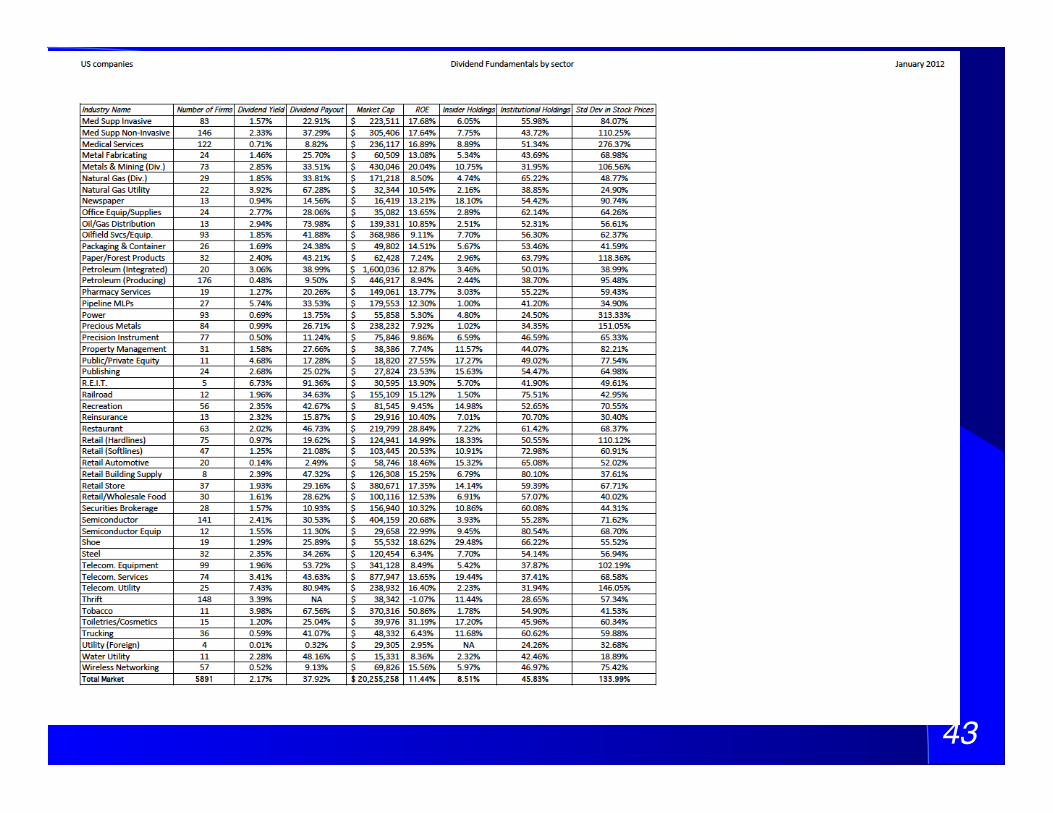
Dividend yield and payout!
42!
43!
44!
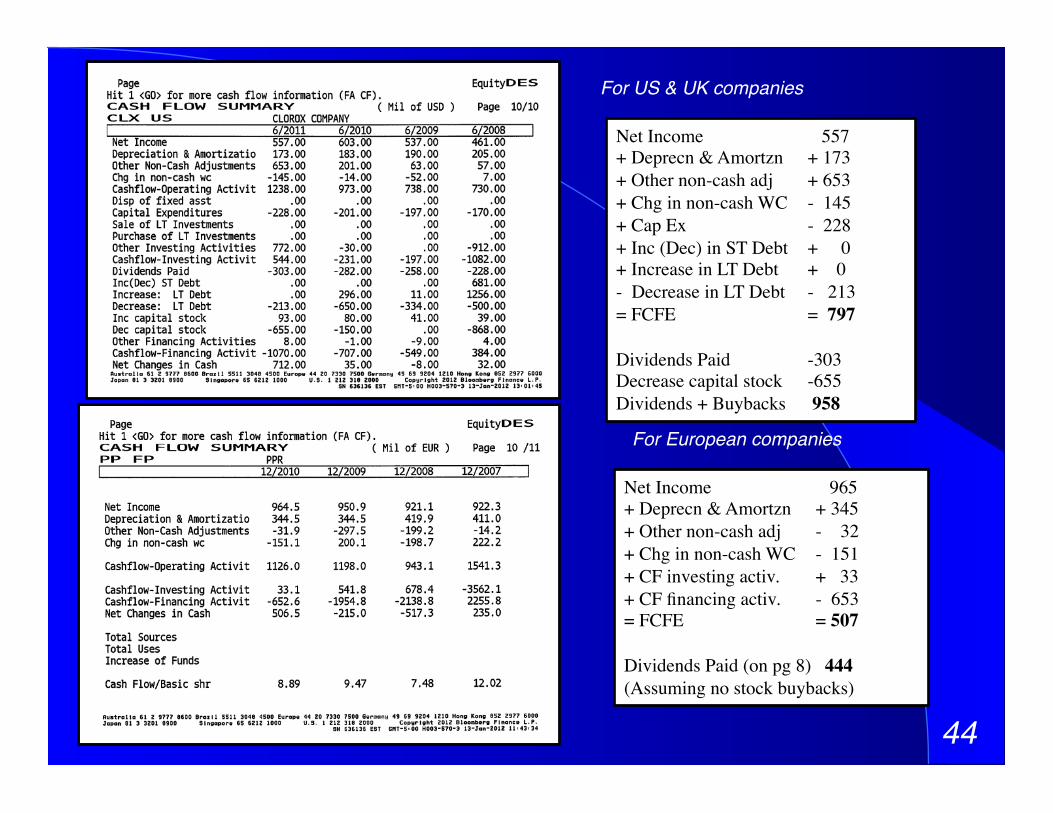
For US & UK companies!
Net Income 557 + Deprecn & Amortzn + 173 + Other non-cash adj + 653 + Chg in non-cash WC - 145 + Cap Ex - 228 + Inc (Dec) in ST Debt + 0 + Increase in LT Debt + 0 - Decrease in LT Debt - 213 = FCFE = 797 Dividends Paid -303 Decrease capital stock -655 Dividends + Buybacks 958
For European companies!
Net Income 965 + Deprecn & Amortzn + 345 + Other non-cash adj - 32 + Chg in non-cash WC - 151 + CF investing activ. + 33 + CF financing activ. - 653 = FCFE = 507 Dividends Paid (on pg 8) 444 (Assuming no stock buybacks)
45!
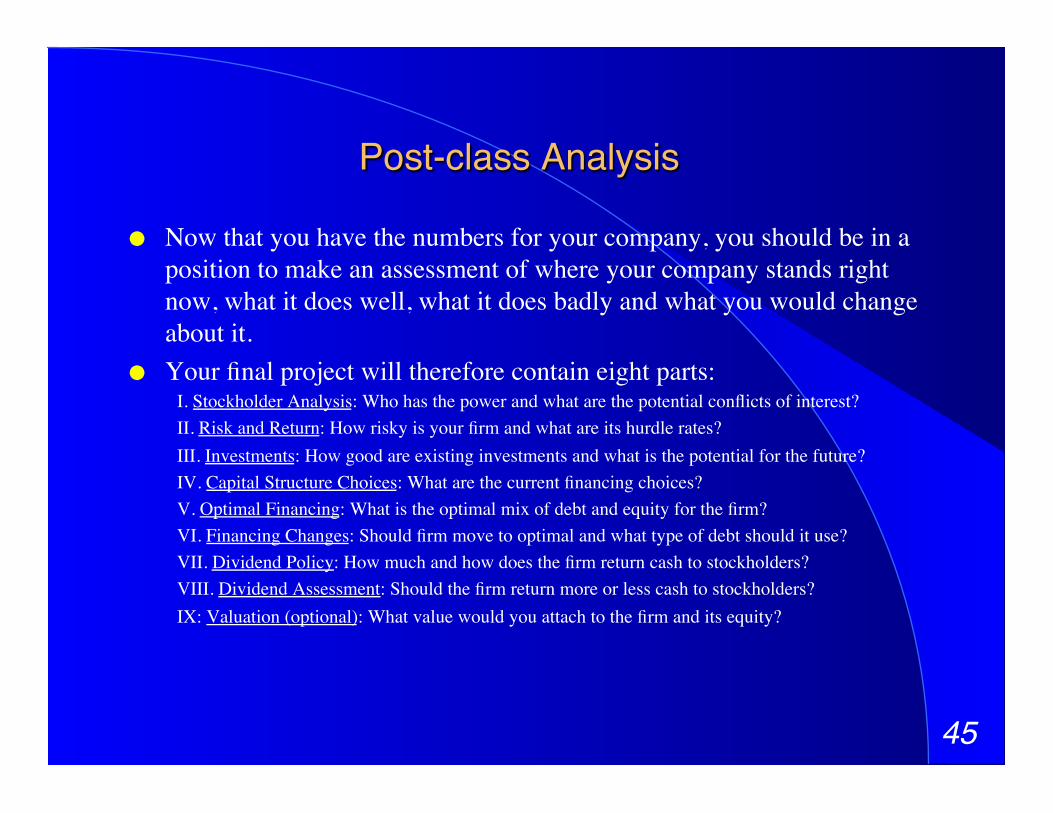
Post-class Analysis!
Now that you have the numbers for your company, you should be in a position to make an assessment of where your company stands right now, what it does well, what it does badly and what you would change about it.
Your final project will therefore contain eight parts: I. Stockholder Analysis: Who has the power and what are the potential conflicts of interest? II. Risk and Return: How risky is your firm and what are its hurdle rates? III. Investments: How good are existing investments and what is the potential for the future? IV. Capital Structure Choices: What are the current financing choices? V. Optimal Financing: What is the optimal mix of debt and equity for the firm? VI. Financing Changes: Should firm move to optimal and what type of debt should it use? VII. Dividend Policy: How much and how does the firm return cash to stockholders? VIII. Dividend Assessment: Should the firm return more or less cash to stockholders? IX: Valuation (optional): What value would you attach to the firm and its equity?