projected 3 year budget: lake elsinore & canyon lake … · project administration (10% of...
TRANSCRIPT

Approved Budget 2013-14
Draft Budget 2014-15
Draft Budget 2015-16
Draft Budget 2016-17 link
1. 50,000$ 80,000$ 80,000$ 80,000$
2. 50,000$ 50,000$ 50,000$ 50,000$
3. -$ 40,000$ -$ -$ -$ 20,000$ -$ -$ -$ 20,000$ -$ -$
4. -$ 175,000$ 175,000$ -$ -$ 100,000$ 100,000$ -$ -$ 75,000$ 75,000$ -$
5 50,000$ -$ -$ -$ 50,000$ -$ -$ -$
6 -$ -$ -$ 100,000$ 7 15,000$ 34,500$ 30,500$ 13,000$
165,000$ 379,500$ 335,500$ 243,000$
1.
85,000$ 85,000$ 85,000$ 85,000$ 70,000$ 70,000$ 70,000$ 70,000$
-$ -$ -$ -$ 15,000$ 15,000$ 15,000$ 15,000$
-$ -$ -$ -$ -$ -$ 100,000$ 100,000$ -$ -$ 100,000$ 100,000$ -$ -$ -$ -$ -$ -$ -$ -$
2.
-$ -$ -$ -$ -$ -$ -$ -$ -$ -$ -$ -$ -$ -$ -$ -$ -$ -$ -$ -$ -$ -$ -$ -$
3. 330,000$ 245,392$ 249,814$ 253,000$ 270,000$ 187,840$ 188,590$ 190,000$ <---30,000$ -$ -$ -$ <---
-$ -$ -$ -$ -$ -$ -$ -$ -$ -$ -$ -$
35,244$ 38,514$ 40,000$ -$ -$ -$ -$
30,000$ 22,308$ 22,710$ 23,000$
415,000$ 330,392$ 434,814$ 438,000$
Prop 84 Round 2 IRWM Funding Draft Budget 2014-15
Draft Budget 2014-15
Draft Budget 2015-16
Draft Budget 2016-17
Canyon Lake Hybrid Treatment process - Phase 1 125,000$ 245,392$ 129,608$ Total Grant Funding 125,000$ 245,392$ 129,608$ -$
455,000$ 464,500$ 640,707$ 681,000$
Effectiveness Monitoring O&M Project Administration (10% of budgeted expenses)
TMDL Task Force Implementation Budget
TMDL Task Force Budget :
Canyon Lake Project Alternatives Chemical Additions - Alum Dosing (2 applications annually) Consulting Support O&M Agreement Detailed Design Construction
Aeration & Destratification System O&M (to be handled by separate agreement) O&M Project Administration (10% of budgeted expenses)
Fishery Management O&M Carp Removal Program Project Administration (10% of budgeted expenses)
Stream gauge O&M (RCFC&WCD)Lake Elsinore Nutrient Monitoring Program
Lake Elsinore Nutrient Monitoring & Lab Analysis (EVMWD)Canyon Lake Nutrient Monitoring Program
Canyon Lake Nutrient Monitoring & Lab Analysis (EVMWD)Lake Elsinore Project Alternatives
Part B: TMDL Implementation Project BudgetTMDL Compliance Monitoring
Watershed-wide Nutrient Monitoring Program Watershed-wide Nutrient Monitoring & Report Preparation (Weston Solutions) Wet Year Watershed-wide Monitoring (weather dependant) (RCFC&WCD) Lab Analysis, Watershed-wide Monitoring (RCFC&WCD)
in-lake ModelingReview and Revision of Water Quality Objectives Revise Water Quality Targets
Contingency (10% of budgeted project expenses) TMDL Task Force Regulatory/Administrative Budget
Revise TMDL
Grant Preparation/AdministrationTMDL Compliance ExpertRisk Sciences
Update of Watershed and In-Lake Nutrient Models Watershed Modeling
Projected 3 Year Budget: Lake Elsinore & Canyon Lake TMDL Task Force
Summary Task Force Expenditures
Part A: Task Force Regulatory/Administrative BudgetTask Force AdministrationTask Force Administrator (LESJWA)Annual Water Quality Reporting and Database Management
Update of Watershed and In-Lake Nutrient Monitoring Program Plans Watershed Monitoring in-lake Monitoring

1
Navigating a Mid-Course Correction for the Nutrient TMDL in Lake Elsinore and Canyon Lake
Background 1) EPA approved the TMDL in fall of 2005 (8 years ago). 2) Task Force organized in 2006 and agreement was signed in spring of 2007 3) Lake Elsinore Sediment Nutrient Reduction Plan approved in Nov., 2007. 4) Aeration Project commenced operations in 2008. 5) Updated watershed runoff models in 2010. 6) Deferred TMDL revision; reallocated monitoring funds to mitigation projects 2012-2014. 7) Comprehensive Nutrient Reduction Plan approved in summer of 2013. 8) Alum applications initiated in fall of 2013.
Key Deadlines 1) MS4 Report of Waste Discharge (RoWD) due in June of 2014 2) MS4 Permits expire in January of 2015 3) Conditional Waiver issued to agricultural operators (likely in 2014-15) 4) TMDL Interim Response Targets (DO & Chl-a) must be met by Dec., 2015
Attainment Assessment
2015 Interim Targets Canyon Lake Lake Elsinore
Chlorophyll-a1 Probable Attainment Attainment Unlikely
Dissolved Oxygen2 Probable Attainment Probable Attainment
Compliance Assessment
2020 TMDL Requirements3 Canyon Lake Lake Elsinore
Total Phosphorous
Total Nitrogen
1 The summer average must be <40 ug/L in Lake Elsinore; the annual average must be <40 ug/L in Canyon Lake.
2 In Lake Elsinore the depth average must be >5 mg/L; in Canyon Lake DO must be >5 mg/L above the thermocline. 3 Load Allocations and Waste Load Allocations are all expressed as 10-year rolling averages.

2
Key Tasks 1) Estimate new external nutrient loads (2011-2013) to calculate 10-year rolling average. 2) Clarify specific methods to evaluate attainment of TMDL Response Targets A) Define "summer" compliance period (and first summer of compliance) B) Define averaging method and period C) Define number and location of compliance monitoring stations D) Define depth increments for depth averages E) Consider a volume-weighted average 3) Develop and implement metrics to demonstrate project effectiveness. A) Aeration/mixing system B) Fishery management (carp reduction, fish stocking) C) Recycled water D) Alum application E) Other BMPs 4) Update Lake Models A) Asymmetric nutrient loading B) Asymmetric lake levels C) Extended decay coefficient D) Salinity limitations on zooplankton E) Long-term model evaluation (40-50 years) 5) Update Watershed Models used in Waste Load Allocation and Load Allocation A) Adjust loading estimates for subsidence in Mystic Lake B) Correct land use(s) C) Reassess role of sediment transport and particulate loads D) Evaluate effect of urbanization (w/ LID and on-site retention requirements) 6) Update TMDL A) Revise and refine dissolved oxygen targets (spatial and temporal averaging) B) Establish exceedance frequency for asymmetric natural background loads C) Authorize in-lake treatment as reasonable compliance alternative D) Authorize exception for nutrient loads from ag lands <20 acres E) Develop Zero-Based Nutrient Budgets for WLA and LA F) Consider site-specific objective for chlorophyll-a based on salinity limitations G) Authorize use of performance-based effluent limits for implementation H) Develop compliance "credit" for participation in recycled water project I) Define attainment of Response Targets as functionally-equivalent compliance with Causal Targets, WLA and LA J) Implementation Plan for Phase-II Project(s) in Lake Elsinore

M E M O R A N D U M
Canyon Lake Alum Treatment Effectiveness Monitoring 1 OF 2
To: Rick Whetsel, LESJWA Date: October 22, 2013
From: Sarah Garber, MWH Reference: 10503347
Subject: Canyon Lake Alum Treatment Effectiveness Water Quality Monitoring – Initial Results
Water quality monitoring on Canyon Lake for the Alum Treatment program was conducted by California State University San Bernardino (CSUSB) starting in September 2013. The field program is supervised by Dr. James Noblet. The student sampling crew includes:
Ingrid Williams - Laboratory Analyst and junior Chemistry major
Emmett Campbell - Senior Laboratory Analyst and senior Biochemistry major
Crystal Carver Steil - Laboratory Analyst and senior Chemistry major
Steve Merrill – Laboratory Analyst and sophomore Biochemistry major Pre-alum treatment monitoring was conducted on Canyon Lake on September 17, 2013. Alum application was conducted from September 23rd to 27th. Post-alum treatment water quality sampling occurred on October 1st, October 8th, and October 15th. Water quality sampling stations are:
CL7 - deepest part of the lake near the dam
CL8 - mid-lake, main body of lake
CL9 - shallow site in the East Bay
CL10 - shallow site without thermal stratification in the East Bay Sample analysis is ongoing for most laboratory parameters. Table 1 summarizes pre- and post-alum treatment results by station for select parameters.

Memo to Rick Whetsel, LESJWA
Canyon Lake Alum Treatment Effectiveness Monitoring 2 OF 2
Table 1 Canyon Lake Water Quality Pre- and Post-Alum Treatment – Initial Results
(average values for Integrated samples) Monitoring Station
Turbidity (NTU)
NH4-N (mg/L)
SRP (µg/L)
Pre Tx Post Tx Pre Tx Post Tx Pre Tx Post Tx
CL7 6.1 5.7 2.13 1.75 691 519
CL8 7.0 5.2 0.31 0.01 191 31.1
CL9 11.7 16.0 1.89 <0.01 487 14.7
CL10 17.0 23.7 0.04 <0.01 26.7 14.3
Notes: NH4-N – ammonia nitrogen SRP – soluble reactive phosphorus Turbidity values are averages of data from throughout the water column. Pre-alum treatment values are data from a single date: September 17, 2013. Post-alum treatment values are based on the average of integrated sample results from October 1st and 8th for NH4-N, and are data from October 1st for SRP. Method detection limit for NH4-N is 0.01 mg/L.
Observations Available data for the four sampling dates indicate:
Thermocline observed at station C7 (at 7 to 8 meters depth) and at station C8 (at 5 to 6 meters depth).
Anoxic conditions in the hypolimnion at C7 and C8. Dissolved oxygen in epilimnion ranged from 2.47 to 10.25 mg/L in the main body of the
lake (C7 and C8). Dissolved oxygen in the East Bay ranged from 0.25 to 16.80 (C9 and C10). Observed pH values ranged from 6.94 to 8.85 and generally decreased with depth at all
stations. Upcoming Sampling The next sampling event will be after fall turnover (anticipated to be in early November). A report summarizing data from the one pre-treatment and four post-treatment sampling events will be prepared upon receipt of final laboratory data. The report is anticipated to be available in mid-December 2013.

Revision to Mystic Lake Subwatershed Boundary Steven Wolosoff, CDM Smith Presentation to Canyon Lake / Lake Elsinore Nutrient TMDL Task Force October 23, 2013
Subwatershed boundary revision Revision to watershed lands downstream of Mystic Lake
Agenda
Revision to Mystic Lake Subwatershed Boundary CL / LE Nutrient TMDL Taskforce October 23, 2013

SUBWATERSHED BOUNDARY REVISION
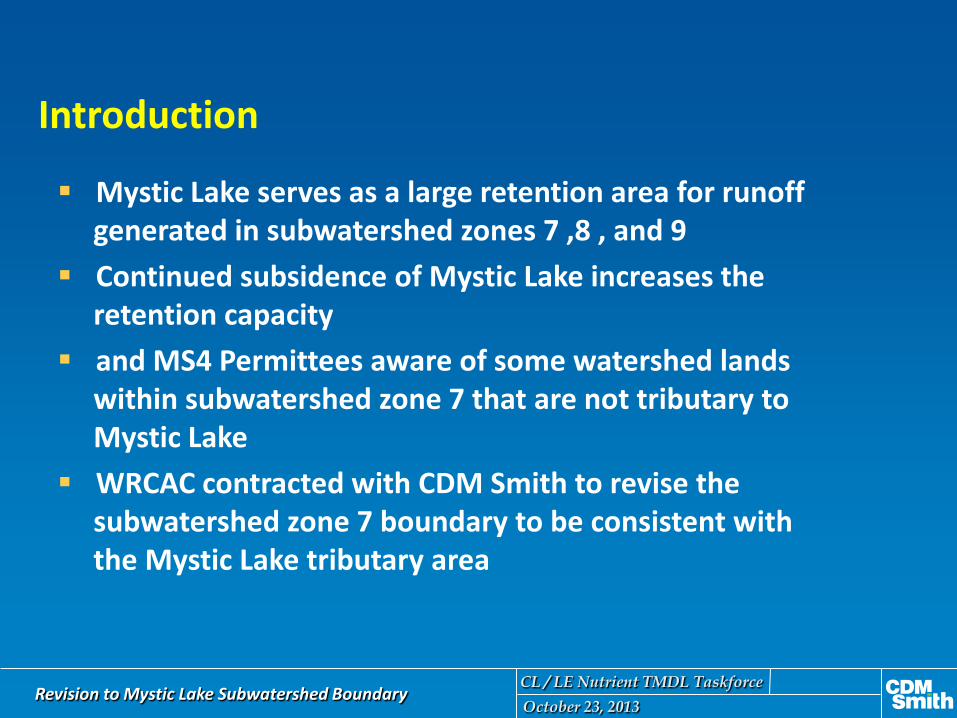
Mystic Lake serves as a large retention area for runoff generated in subwatershed zones 7 ,8 , and 9
Continued subsidence of Mystic Lake increases the retention capacity
and MS4 Permittees aware of some watershed lands within subwatershed zone 7 that are not tributary to Mystic Lake
WRCAC contracted with CDM Smith to revise the subwatershed zone 7 boundary to be consistent with the Mystic Lake tributary area
Introduction
Revision to Mystic Lake Subwatershed Boundary CL / LE Nutrient TMDL Taskforce October 23, 2013

Delineate drainage area to Mystic Lake using elevation map data from National Elevation Dataset
GIS Analysis
Revision to Mystic Lake Subwatershed Boundary CL / LE Nutrient TMDL Taskforce October 23, 2013
ArcHydro is an ESRI ArcGIS® tool that can delineate a drainage area from a DEM and user defined pour point

Revision to Mystic Lake Subwatershed Boundary CL / LE Nutrient TMDL Taskforce October 23, 2013
Current

Revision to Mystic Lake Subwatershed Boundary CL / LE Nutrient TMDL Taskforce October 23, 2013
Changes

Revision to Mystic Lake Subwatershed Boundary CL / LE Nutrient TMDL Taskforce October 23, 2013
Revised

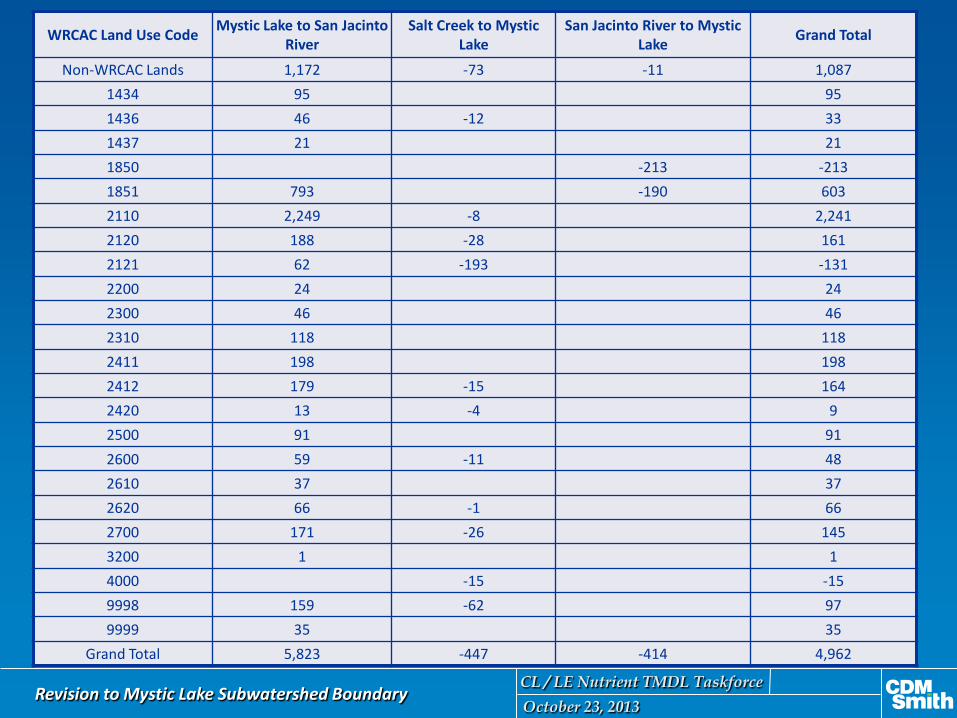
Acreage of different land uses no longer considered tributary to Mystic Lake and vice versa
Impact of Subwatershed Zone Revision
Revision to Mystic Lake Subwatershed Boundary CL / LE Nutrient TMDL Taskforce October 23, 2013
Revision to Mystic Lake Subwatershed Boundary CL / LE Nutrient TMDL Taskforce October 23, 2013
WRCAC Land Use Code Mystic Lake to San Jacinto River
Salt Creek to Mystic Lake
San Jacinto River to Mystic Lake Grand Total
Non-WRCAC Lands 1,172 -73 -11 1,087 1434 95 95 1436 46 -12 33 1437 21 21 1850 -213 -213 1851 793 -190 603 2110 2,249 -8 2,241 2120 188 -28 161 2121 62 -193 -131 2200 24 24 2300 46 46 2310 118 118 2411 198 198 2412 179 -15 164 2420 13 -4 9 2500 91 91 2600 59 -11 48 2610 37 37 2620 66 -1 66 2700 171 -26 145 3200 1 1 4000 -15 -15 9998 159 -62 97 9999 35 35
Grand Total 5,823 -447 -414 4,962

Impacted watershed lands include ~1,000 acres of non-WRCAC ownership
Land use data for these areas are outdated (circa 2005)
Impact of Subwatershed Zone Revision
Revision to Mystic Lake Subwatershed Boundary CL / LE Nutrient TMDL Taskforce October 23, 2013

WRCAC will use this data in next updated land use mapping and determine individual owners affected.
WRCAC will treat all of these and the complete 7,8,9 stakeholders as wet weather storm event scenario players
Next Steps
Revision to Mystic Lake Subwatershed Boundary CL / LE Nutrient TMDL Taskforce October 23, 2013