projected climate change impacts on the north pacific ... · pdf file• using climate...
TRANSCRIPT

Jeffrey Polovina1, John Dunne2, Phoebe Woodworth1, and Evan Howell1 Julia Blanchard3
1. NOAA, Pacific Islands Fisheries Science Center, Honolulu, HI2. NOAA, Geophysical Fluid Dynamics Laboratory, Princeton, NJ3. Imperial College, London, UK
Projected climate change impacts on the North Pacific marine ecosystems

NOAA GFDL Earth System Model 2.1 (ESM2.1 A2 NPZ)
1° x 1° north of 30°N, with latitudinal resolution increasing to 0.33° at equatorOcean has 50 levels, with 22 10m spacing levels in the upper 220mWe used monthly values from 1991 - 2100
CM 2.1 (Atmos., Land, Ice)
Coupled Climate Biogeochemical
Tracers of Phytoplankton with AllometricZooplankton (TOPAZ)*
Major nutrients + 4 phytoplankton groups
*Dunne et al. (2005, 2007)
A2 scenario
Good correlation SeaWifs – GFDL

Extending climate model results to higher trophiclevels – 3 approaches
• Using climate model output to define dynamic biomes and then examine spatial and temporal changes in model-derived biomes in response to climate change
• Using climate model output to drive a size-based ecosystem model at specific locations
• Using climate model output to drive Ecopath/Ecosimmodel for the Hawaii-based longline fishery to explore climate and fishing interactions.

Biomes• Longhurst (1995) based on physical forcing
defined 4 Biomes: (Polar, Westerlies, Trade-wind,Coastal boundary ) further refined to 10 per ocean basin.
• Hardman-Mountford et al. (2008) defined 6 based on SeaWiFS surface Chl levels- very high to very low.
• Dynamic biomes and climate model - Sarmientoet al. (2004) biomes based on physical forcing (marginal sea ice, subpolar, subtropical seasonal, subtropical permanent, low-latitude upwelling).

Total Phytoplankton
Model-derived Biome Boundaries Overlaid on SeaWiFS Climatology
Biome definitions
1. Subtropical: area with phytoplankton not exceeding 1.35 gC/m2
2. Temperate: Area north of 20o N lat with phytoplankton exceeding 1.35 gC/m2
3. Equatorial Upwelling: Area south of 20o N lat with phytoplankton exceeding 1.35 gC/m2

TemperateSubtropicalEquatorial Upwelling
Temperate: • Area decreases 34%/100 yr
Subtropical:• Area increases 29.5%/100yr
Equatorial UpwellingArea decreases 27.7%/100yr
Annual Mean Biome Area over the 21st Century

Biome Boundaries at beginning and end of the 21st Century

Summary table of percent change over 100 years of physical and biological variables for each biome and total North Pacific,
1998-2100
Temperate Subtropical EU North Pacific
Area -34 30 -28 -
Mean PP -6 -2 17 -4
Phytoplankton Biomass Density -8 -8 -5 -13
% Large -12 -7 -10 -27
SST 5 8 10 14
Polovina, J. J., J. P. Dunne, P. A. Woodworth, and E. A. Howell. 2011. Projected expansion of the subtropical biome and contraction of the temperate and equatorial upwelling biomes in the North Pacific under global warming. ICES J. Mar Sci. doi:10.1093/icesjms/fsq198

Size-based model
Jennings et al. 2008, Proc. R. Soc. B; Blanchard et al. 2009 J Anim Ecol; Blanchard et al. 2010 Theor. Ecol.
Input: monthly plankton size spectrum and SST
Output: monthly population size spectrum
Assumes size-based predation, and size-specific growth and mortality are functions of food availability and SST
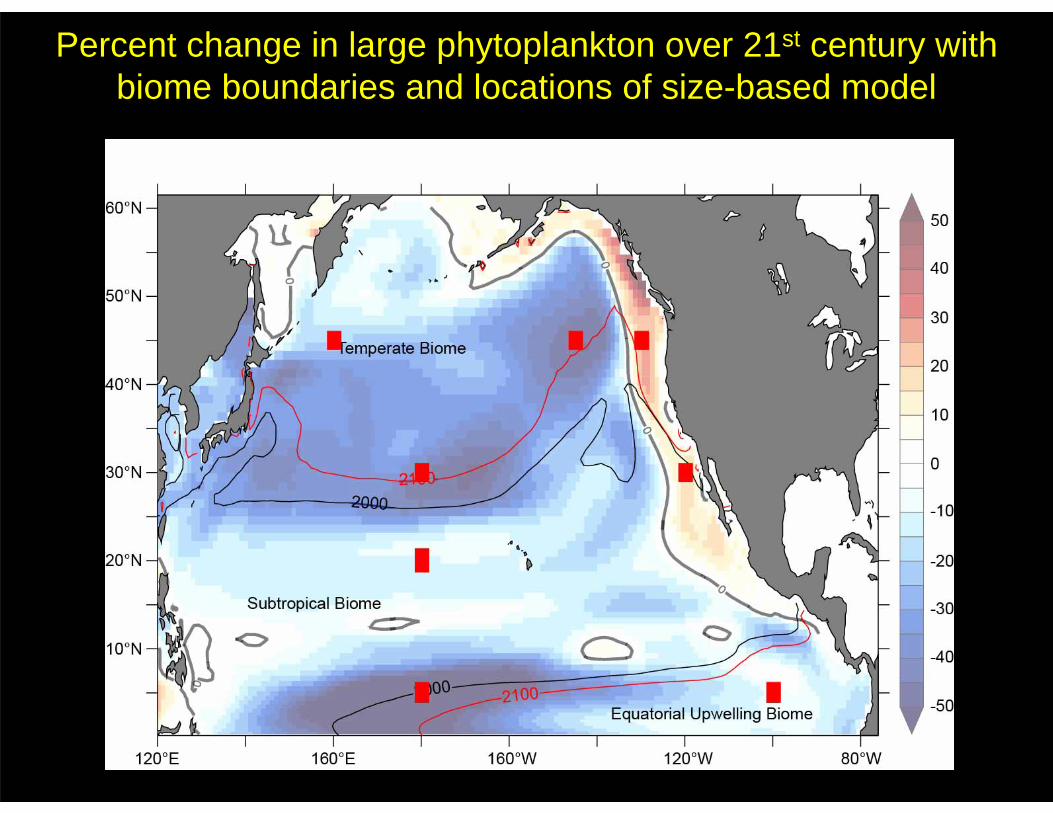
Percent change in large phytoplankton over 21st century with biome boundaries and locations of size-based model

30N, 120W149% increase by 2100
Annual biomass of fish > 2 kg
45N, 130W123% increase by 2100
change
Locations in California Current

20N, 18057% decrease by 2100
Annual biomass of fish > 2 kg
45N, 160E33.74% decrease by 2100
5N, 100W12.76% decrease by 2100
Locations in biome interior

Annual biomass of fish > 2 kg
45N, 14596.02% decrease by 2100
30N, 18068.20% decrease by 2100ge
5N, 18096.03% decrease by 2100
Locations near biome boundaries

Ecopath/Ecosim Model of the central North Pacific pelagic ecosystem
Build Ecopath Model from diet data, P/B, and energetics estimates for key species groups
Run Ecosim driven by historical fishing effort and tune model parameters to historical stock assessments
Drive Ecosim over 21st century with climate model phytoplankton data and future fishing effort trends

Ecosystem Model Trophic Web (Ecopath)

Results: F = 1X2008%TargetSpecies
%IncidentalSpecies
%TargetSpecies
%IncidentalSpecies
50% biomass

Management Strategy Evaluation TrialF = 1X2008
F = .5X2008
50% biomass
Want: effort scenario max effort
Target B > B50MSE
effort 25% 2008 values
Target close to 50% levelNeed to drop 2008 effort 75%
Incidental biomass 50%
50% 50%
F = MSE
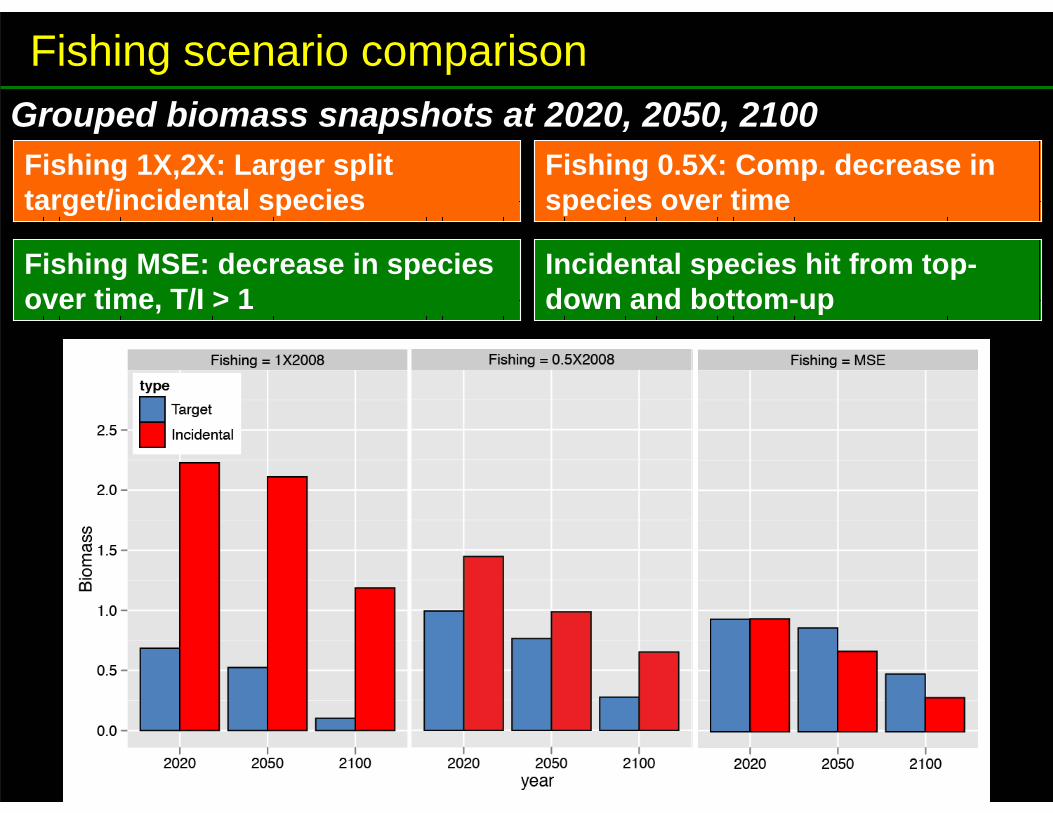
Fishing scenario comparisonGrouped biomass snapshots at 2020, 2050, 2100 Fishing 1X,2X: Larger split target/incidental species
Fishing 0.5X: Comp. decrease in species over timeFishing 0.5X: Comp. decrease in species over time
Fishing MSE: decrease in species over time, T/I > 1
Incidental species hit from top-down and bottom-up

Results from other model studies
• large scale weakening (Vecchi et al., 2006) and poleward shift (Yin, 2005) in northern hemisphere westerlies
• NP basin-scale decreases in the magnitude of vertical velocities in both temperate and subtropical biomes (Rykaczewski and Dunne, 2011).
• Reduced nutrient input to euphotic zone in low and mid-latitudes in response to increased stratification seen in multi-model study (Steinacher et al. 2010)

Summary
• Over 21st century a change in wind field and increased ocean warming will increase oceanic vertical stratification and redistribute nutrients.
• For much of oceanic North Pacific productivity and carrying capacity declines, with greatest declines near the boundary of the expanding subtropical gyre.
• In the California Current, nutrient upwelling increases resulting in an increase in productivity and carrying capacity.
• Changes in density and proportion of large phytoplankton is a dominant biological response to climate change which alters the length of food chains with impacts amplified at top trophic levels.
• Impacts from climate and fishing may vary with trophic level and fishing effort may be used to maintain ecosystem structure in the presence of climate impacts.