projects by program area - michigan.gov · with electronic signatures and with use of projectwise,...
TRANSCRIPT


0
200
400
600
800
1,000
1,200
FY 09 FY 10 FY 11 FY 12 FY 13RAILROAD 1 5 1 1 1AERO 34 41 35 35 33LOCAL 401 598 404 409 476STATE 449 411 325 307 335
NU
MB
ER O
F PR
OJE
CTS
PROJECTS BY PROGRAM AREA NUMBER OF PROJECTS FY 2009 - FY 2013
885 1,055 Totals 765 752 845
Increase of 11.0%

5.9
5.5
5.1
4.8
4.4
0.0 2.0 4.0 6.0
FY 09
FY 10
FY 11
FY 12
FY 13
AVERAGE NUMBER OF BIDS PER PROJECT FISCAL YEAR END
FY 2013 3,747 bids received, 4.43 bids per project 274 unique contractors submitted average of 13.67 bids
FY 2012
3,621 bids received, 4.82 bids per project 264 contractors submitted an average of 13.71 bids

$0
$200
$400
$600
$800
$1,000
$1,200
$1,400
$1,600
FY 09 FY 10 FY 11 FY 12 FY 13RAILROAD 2.6 11.7 2.8 1.8 0.4AERO 22.1 25.5 21.9 14.6 14.3LOCAL 296.6 448.4 289.5 327.5 372.1STATE 1073.6 813.3 708.3 643.8 747.9
DO
LLAR
S (In
Mill
ion)
PROJECT DOLLARS - 5 YEAR COMPARISON
BY PROGRAM AREA
$1,394.9 $1,298.9 $1,022.42 $987.71 Totals $1,134.66
0.00%
1.00%
2.00%
3.00%
4.00%
5.00%
6.00%
7.00%
8.00%
9.00%
10.00%
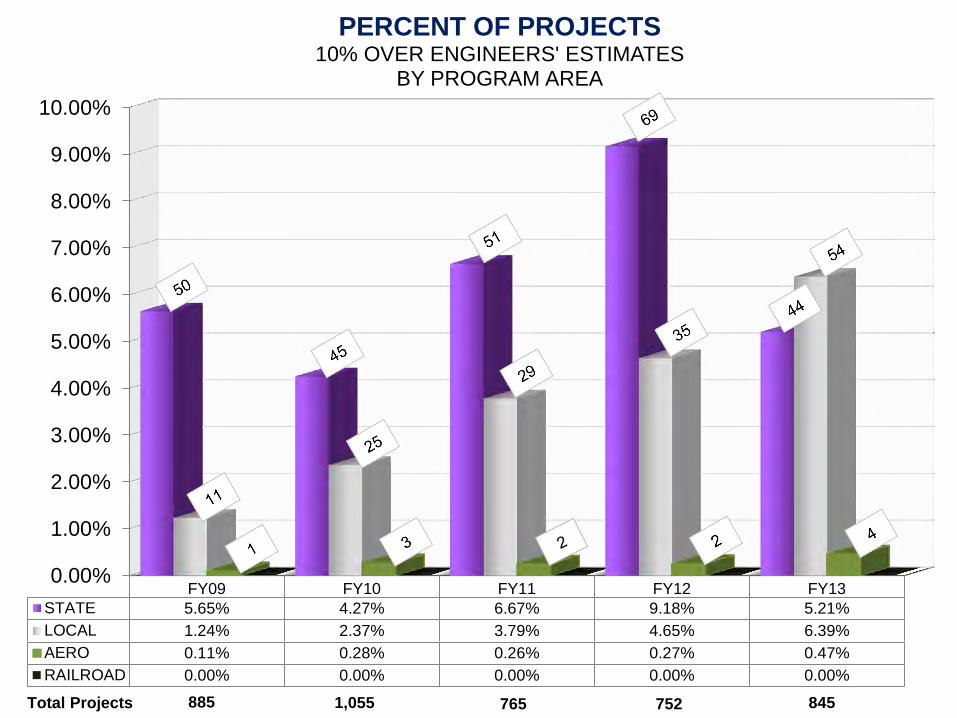
FY09 FY10 FY11 FY12 FY13STATE 5.65% 4.27% 6.67% 9.18% 5.21%LOCAL 1.24% 2.37% 3.79% 4.65% 6.39%AERO 0.11% 0.28% 0.26% 0.27% 0.47%RAILROAD 0.00% 0.00% 0.00% 0.00% 0.00%
PERCENT OF PROJECTS 10% OVER ENGINEERS' ESTIMATES
BY PROGRAM AREA
Total Projects 885 1,055 765 752 845
$0.00
$200.00
$400.00
$600.00
$800.00
$1,000.00
$1,200.00
FY 09 FY 10 FY 11 FY 12 FY 13
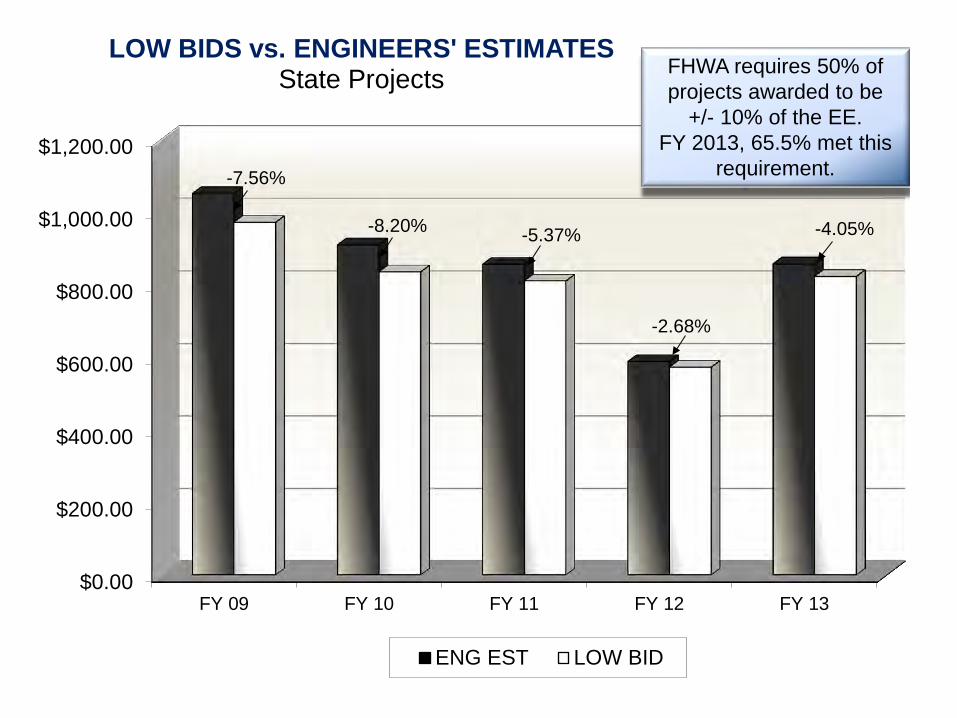
LOW BIDS vs. ENGINEERS' ESTIMATES State Projects
ENG EST LOW BID
-8.20%
-7.56%
-5.37% -4.05%
-2.68%
FHWA requires 50% of projects awarded to be
+/- 10% of the EE. FY 2013, 65.5% met this
requirement.

10 all bids rejected (ABR) projects, or 3.0%, of 335 State projects
27 ABR projects, or 3.2% of overall 845 projects let
Low bid total of ABR projects, $28.6 million, or 18.4%, above $24.2 million in engineer estimates
0
50
100
150
200
250
300
350
400
450
500
FY 09 FY 10 FY 11 FY 12 FY 13
NU
MB
ER O
F C
ON
TRA
CTS
STATE PROJECTS vs. ALL BIDS REJECTED Percent ABR Overall
STATE projects STATE All Bids Rejected
0.89% 1.46%
4.31% 2.28% 2.99%

200
300
400
FY 2011FY 2012
FY 2013
NU
MB
ER O
F C
ON
TRA
CTS
DESIGN OF STATE PROJECTS
NUMBER OF CONTRACTS*
MDOT CONSULTANT*The total number of contracts excludes Real Estate program area contracts.
91.2% 89.8%
7.6% 10.2%
8.8%
92.4%
352 342
376

0
200
400
600
800
FY 2011FY 2012
FY 2013
DO
LLAR
S IN
MIL
LIO
NS
DESIGN OF STATE PROJECTS CONTRACT DOLLARS*
MDOT CONSULTANT
35.5%
64.5%
$660.2
*The contract dollars exclude Real Estate program area contracts.
$589.5 $644.0
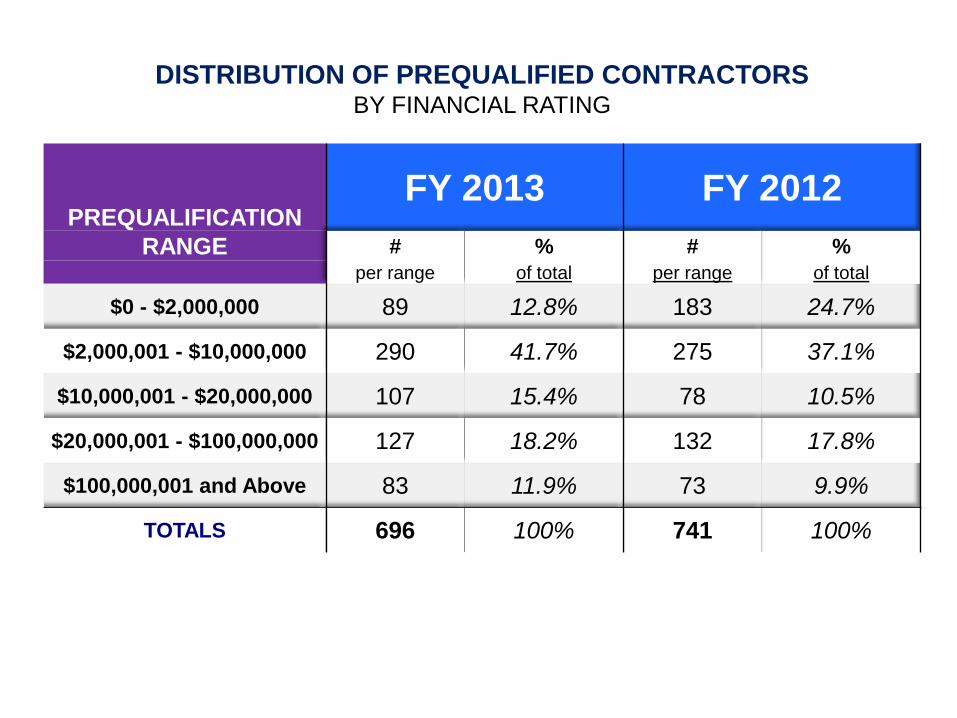
DISTRIBUTION OF PREQUALIFIED CONTRACTORS BY FINANCIAL RATING
PREQUALIFICATION FY 2013 FY 2012
RANGE # % # % per range of total per range of total
$0 - $2,000,000 89 12.8% 183 24.7%
$2,000,001 - $10,000,000 290 41.7% 275 37.1%
$10,000,001 - $20,000,000 107 15.4% 78 10.5%
$20,000,001 - $100,000,000 127 18.2% 132 17.8%
$100,000,001 and Above 83 11.9% 73 9.9%
TOTALS 696 100% 741 100%

TOP 10 PRIME CONTRACTORS AWARDED CONTRACTS
FY 2013 FY 2012 Prime Contractor Award Amount Prime Contractor Award Amount
Walter Toebe Construction Company $139,143,806.52 Dan's Excavating, Inc. $115,489,713.02 Dan's Excavating, Inc. $96,892,943.99 Ajax Paving Industries, Inc. $62,186,661.74 Ajax Paving Industries, Inc. $94,625,324.35 Michigan Paving and Materials Company $50,703,867.66 Rieth-Riley Construction Co., Inc. $81,449,136.18 Rieth-Riley Construction Co., Inc. $49,431,997.35 C.A. Hull Co., Inc. $65,453,440.97 C.A. Hull Co., Inc. $48,350,643.73 Michigan Paving and Materials Co. $57,085,022.10 Walter Toebe Construction Company $33,976,915.25 Kamminga & Roodvoets, Inc. $45,525,065.22 Cadillac Asphalt, L.L.C. $24,954,256.23 Cadillac Asphalt, L.L.C. $39,579,893.73 D.J. McQuestion & Sons, Inc. $24,765,136.30 PCL Civil Constructors, Inc. $31,690,145.49 Angelo Iafrate Construction Company $24,007,819.52 Anlaan Corporation $31,334,800.85 Kamminga & Roodvoets, Inc. $21,063,844.94 TOTAL - TOP TEN CONTRACTS $682,779,579.40 TOTAL - TOP TEN CONTRACTS $454,930,855.74
TOTAL AWARDED $1,201,383,100.96 TOTAL AWARDED $923,919,075.05
Percent of Total Program 56.83% Percent of Total Program 49.24%

CONTRACTS by REGION Number and Percent
819 contracts were awarded FY 2013. FY 2012, 751 were awarded. An 8.3% difference.
Metro Region had the greatest number of contracts with Superior Region having the least.
SUPERIOR 86
10.50% NORTH 106
12.94%
GRAND 130
15.87%
BAY 115
14.04%
SOUTHWEST 104
12.70%
UNIVERSITY 127
15.51%
METRO 151
18.44%

CONTRACT DOLLARS by REGION Dollars (In million) and Percent
SUPERIOR $91.4 7.61%
NORTH $70.9 5.90%
GRAND $177.6 14.78%
BAY $157.9 13.14%
SOUTHWEST $121.6 10.12%
UNIVERSITY $152.8 12.72%
METRO $429.3 35.73%
FY 2013, $1.2 billion in contract dollars were awarded. FY 2012, $923.9 million were awarded.
Metro Region awarded largest contract in dollars of $76.2 million.

PAYMENTS
CSD ensures 98% prompt payment to construction contractors:
FY 2013 – 99.98% FY 2012 – 99.96%
FISCAL YEAR END 2013 12,118 payment vouchers processed $1.06 billion paid to contractors
FISCAL YEAR END 2012 12,669 payment vouchers processed $1.09 billion paid to contractors

Unbalanced Bid Review Statistics
Participating programs: State Trunkline, Real Estate and Local Agency Program
Random selection is reviewed
Fiscal Year 2013
288, or 35.5%, participating program projects let were reviewed 57.6%, or $645.3 million, in participating program project dollars No projects were effected by UBRs
Fiscal Year 2012
259, or 36.1%, participating program projects let were reviewed 53.6%, or $529.0 million, in participating program project dollars Quantity errors in one proposal resulted in rejecting all bids

Contract Administration Activities
e-Contracting
December of FY 2012 through FY 2013 • Confirmed low bidder received contract documents
electronically through Bid Express.
FY 2014 • CSD to fully implement electronic contract document
process to include electronic signatures. Prior to this, contracts were mailed for signature.
• Electronic submittal of documents required for final payment
e-Contracting - continued
Benefits – Now Prompt delivery of contract documents (same day in most cases) Contract award turnaround time substantially reduced Significant cost reduction of paper, printing, and mailing fees
Benefits – Near Future With electronic signatures and with use of Projectwise,
e-Contracting will prove immediate savings in time and substantial cost reduction in labor, printing and mailing for ALL participants. Faster processing of final contract pay estimate and project
closure
Contract Administration Activities

FY 2013 MDOT CONSTRUCTION CONTRACT ACTIVITY BID LETTING FY 2013 FY 2012 Number of lettings: 26 23 Projects let: 845 752 Engineer Estimates: $1.2 billion $1.02 billion Low Bid Total: $1.1 billion $987.7 million Bid Received: 3,747 3,621 Individual Bidders: 274 263
STATE TRUNKLINE FY 2013 FY 2012 335 projects, 39.6% overall 307 projects, or 40.8% overall $747.9 million, or 65.9% overall $643.8 million, or 65.2% overall PROGRAM AREA – Other
• FY 2013, 476 Local, 33 Aeronautics, 1 Freight Services, or 60.4% overall of projects let • $386.8 million compared to $343.9 million in FY 2012, an increase of 11.1%
REJECTIONS, APPEALS and ALL BIDS REJECTED (1) low bid rejection/appeal (2) low bid withdrawals (1) project received no bids (1) project for which all bidders were non-responsive All bids were rejected for 27 projects, or 3.2% of all program area projects let. Ten of the 27 were State Trunkline.
PREQUALIFICATION FY 2013 FY 2012 Number of Prequalified Contractors 696 741 CONTRACTS Number – Contracts Awarded 819 751 Contract Total $1.2 billion $923.9 million Top 10 Contracts 56.8% of total contract dollars 49.2% of total contract dollars PAYMENTS Payment Estimates 12,118 12,669 Dollars Paid $1.06 billion $1.09 billion