projektbericht - european...
TRANSCRIPT
Projektbericht
Heft 59
Rheinisch-Westfälisches Institut für Wirtschaftsforschung
German Institute of Urban Aff airs – DIFU
NEA Transport research and training
Policy Research & Consultancy – PRAC
Second State of European Cities ReportExecutive SummaryContract No. 2008CE160AT024November 2010
Research Project for theEuropean Commission, DG Regional Policy
Heft 59
Boris AugurzkyRosemarie GülkerSebastian KrolopChristoph M. Schmidt Hartmut SchmidtHendrik SchmitzStefan Terkatz

Imprint
Vorstand des RWI
Prof. Dr. Christoph M. Schmidt (Präsident)
Prof. Dr. Thomas K. Bauer (Vizepräsident)
Prof. Dr. Wim Kösters
Verwaltungsrat
Dr. Eberhard Heinke (Vorsitzender);
Dr. Henning Osthues-Albrecht; Dr. Rolf Pohlig; Reinhold Schulte (stellv. Vorsitzende);
Manfred Breuer; Oliver Burkhard; Dr. Hans Georg Fabritius;Hans Jürgen Kerkhoff ; Dr. Thomas Köster; Dr. Wilhelm Koll; Prof. Dr. Walter Krämer; Dr. Thomas A. Lange; Reinhard Schulz; Hermann Rappen; Dr.-Ing. Sandra Scheermesser
Forschungsbeirat
Prof. Michael C. Burda, Ph.D.; Prof. David Card, Ph.D.; Prof. Dr. Clemens Fuest; Prof. Dr. Justus Haucap; Prof. Dr.Walter Krämer; Prof. Dr. Michael Lechner; Prof. Dr. Till Requate; Prof. Nina Smith, Ph.D.
Ehrenmitglieder des RWI
Heinrich Frommknecht; Prof. Dr. Paul Klemmer †; Dr. Dietmar Kuhnt
RWI Materialien Heft 59
Herausgeber:
Rheinisch-Westfälisches Institut für WirtschaftsforschungHohenzollernstraße 1/3, 45128 Essen, GermanyPhone +49 201–81 49-0, Fax +49 201–81 49-200, e-mail: [email protected]
Alle Rechte vorbehalten. Essen 2010
Schriftleitung: Prof. Dr. Christoph M. Schmidt
Second State of European Cities Report
Executive Summary
Contract No. 2008CE160AT024November 2010
Research Project for the European Commission, DG Regional Policy
Report
Rheinisch-Westfälisches Institut für Wirtschaftsforschung
German Institute of Urban Aff airs – DIFU
NEA Transport research and training
Policy Research & Consultancy – PRAC
Second State of European Cities Report
Executive Summary
Contract No. 2008CE160AT024 November 2010
Research Project for the European Commission, DG Regional Policy

Report
Project Team:
RWI: Rüdiger Budde, Christoph Ehlert, Dr. Uwe Neumann (Project Leader), Dr.Matthias Peistrup
Difu: Dr. Busso Grabow, Dr. Beate Hollbach-Grömig, Antje Seidel-Schulze
NEA: Dr. Laura Trofi n
PRAC: Dr. Rolf Bergs
The project team would like to thank Claudia Burgard, FranziskaDöring, Claudia Lohkamp, Robert Schweizog, Daniela Schwindt andBenedict Zinke for research assistance and support of the project work.
Linguistic editing by TITELBILD Subtitling and Translation GmbH, Berlin.

Second State of European Cities Report
Executive Summary
Preamble
This State of the European Cities report is based on the Urban Audit, which now allows a comparison between 322 cities in the European Union (EU) and 47 non-EU cities (5 Croatian, 6 Norwegian, 10 Swiss and 26 Turkish cities). The most recent update of the data collection for 2004 considered in this report is from February 2009. It comprises data for 320 cities from the European Union, 6 Norwegian, 4 Swiss and 26 Turkish cities. Altogether, there is information about 356 cities in the data base analysed in this report.
The Urban Audit is a Europe-wide collection of data about cities, which is coordinated by the European Commission (Directorate-General for Regional Policy and Eurostat, the statistical office of the European Union) and was started in 1999. It is conducted in cooperation with national statistical offices from the European Union Member States as well as from Croatia, Norway, Switzerland and Turkey, and with cities concerned. The Urban Audit provides city data on different spatial levels: core cities, larger urban zones (LUZ), sub-city districts and national averages. The year 2002 saw the launch of the first large-scale Urban Audit data collection, comprising 258 cities in the EU Member States and accession countries. The data compiled up to 2002 comprised data for the year 2001 and restricted sets for 1991 and 1996.
As noted above, the Urban Audit collects data for 369 cities. The resulting data set allows objective comparisons to be made between the cities included from across the European Union and beyond, in the fields of demography, social conditions, economic aspects, education, civic involvement, environment, transport and culture.
Following a call for tenders, launched by the European Commission, the consortium responsible for producing this report was appointed to undertake an analysis of the Urban Audit data base, focusing on the collection for the year 2004, carried out and validated from 2006 to 2008. This report is one of the main outputs of this work. The previous State of European Cities report, which was coordinated by Ecotec, was published in 20071 and based on the previous data collections.
During the analysis and report writing phases, the study team benefited greatly from exchanges with a Scientific Steering Committee composed of a panel of five renowned experts2 in the field of urban development in Europe, as well as comments from the European Environment Agency.
1"State of European Cities Report - Adding value to the European Urban Audit"
http://ec.europa.eu/regional_policy/themes/urban/audit/index_en.htm 2The panel of experts comprised Prof. Roberto Camagni, Politecnico di Milano; Prof.
Christian Lefèvre, Université Paris-Est; Prof. Anne Power, London School of Economics; Dr Ivan Tosics, Metropolitan Research Institute of Hungary, Budapest; Prof. Cecilia Wong, University of Manchester.
4
Issues and approach
It is the task of this report to provide up-to-date information on urban characteristics and urban dynamics in Europe, which can be used as background for strategic planning in a wide range of policy fields with a distinct urban dimension, e.g. economic, environmental and cohesion policy.
Analysis in this report follows a strategy of empirical “information compaction”, filtering out key aspects from a broad set of indicators using state-of-the-art statistical methods. Preparation of this second State of European Cities Report comprised discussion of intermediate results with colleagues from the European Commission (DG Regional Policy, Eurostat) and with the panel of experts. In addition, a panel of representatives from 32 cities in 24 countries was set up. It took part in a survey on matters of urban governance and met for a two-day workshop in Berlin to discuss intermediate results of the analysis, user-related questions and the future development of the Urban Audit data base.
This report groups cities into “types” with the aim of providing a solid foundation to compare cities with similar characteristics. Four basic city types were defined by statistical analysis based on a set of 21 indicators. These four types provide the general background for city comparison in the report. In an additional step, nine sub-types of the four basic city types were derived. Selected indicators were examined according to their variation across the sub-types. To improve usability, city types were provided with labels, which summarise the main characteristics. It must be kept in mind, however, that any labelling is combined with a considerable degree of simplification.
Basic type A comprises 52 very large and capital cities from all parts of Europe, with an average of over 1,000,000 inhabitants, described as “Principal Metropolises”. These cities are not only the largest agglomerations of people and firms, they also account for the most dynamic innovation and entrepreneurial activity and are centres of specialised services aiming at national and international markets. Furthermore, they are central locations of private and public administrative functions. Type B (Regional Centres) comprises 151 cities from all parts of Western Europe. With an average population of around 290,000 they are considerably smaller than the Principal Metropolises. Overall economic output, patent intensity and entrepreneurial activity are lower than in the highest-ranking urban centres, yet still high above national averages. Type C (Smaller Centres) comprises 44 cities, mainly from Western Europe and mostly outside its economic core zone. The urban economy in these cities is less vibrant than in types A and B. However, on average, the share of highly qualified working-age residents is relatively high. Type D (Towns and Cities of the Lagging Regions) consists of 82 smaller cities from economically lagging regions in Central and Southern Europe, which differ from other cities in that they have higher unemployment, lower GDP per head and a regional specialisation, in which manufacturing plays a far more important role. In contrast to other cities, their population is declining.
The results of the classification approach applied in this report by and large corroborate the key features of the typology from the first State of European Cities Report. The current typology, however, is characterised by a more distinct core-periphery progression between the core zone of the European economy, the more peripheral parts of Western Europe and the non-capital cities of Central Europe, even though the indicator set was not restricted to direct measures of economic prosperity. In Europe-wide comparison, cities obviously need to be classified firstly according to their basic (macro-)regional affiliation and secondly in terms of their more specific function. Comparison among similar city types, therefore, only comprises one aspect of the analysis in this report. We also compare cities within countries and parts of Europe (Central, North, South, West, cf. Map I).
Population
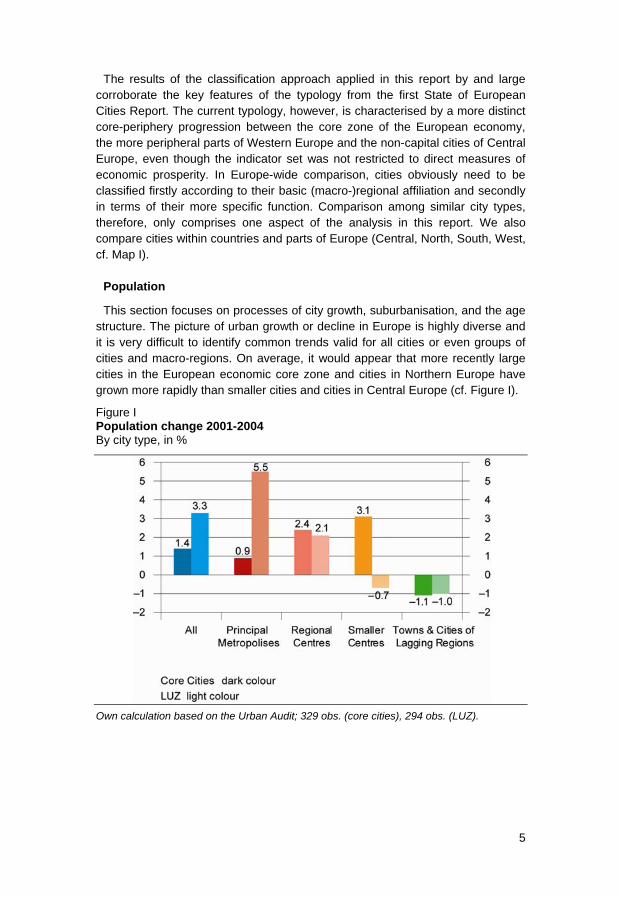
This section focuses on processes of city growth, suburbanisation, and the age structure. The picture of urban growth or decline in Europe is highly diverse and it is very difficult to identify common trends valid for all cities or even groups of cities and macro-regions. On average, it would appear that more recently large cities in the European economic core zone and cities in Northern Europe have grown more rapidly than smaller cities and cities in Central Europe (cf. Figure I).
Figure I Population change 2001-2004 By city type, in %
Own calculation based on the Urban Audit; 329 obs. (core cities), 294 obs. (LUZ).
5
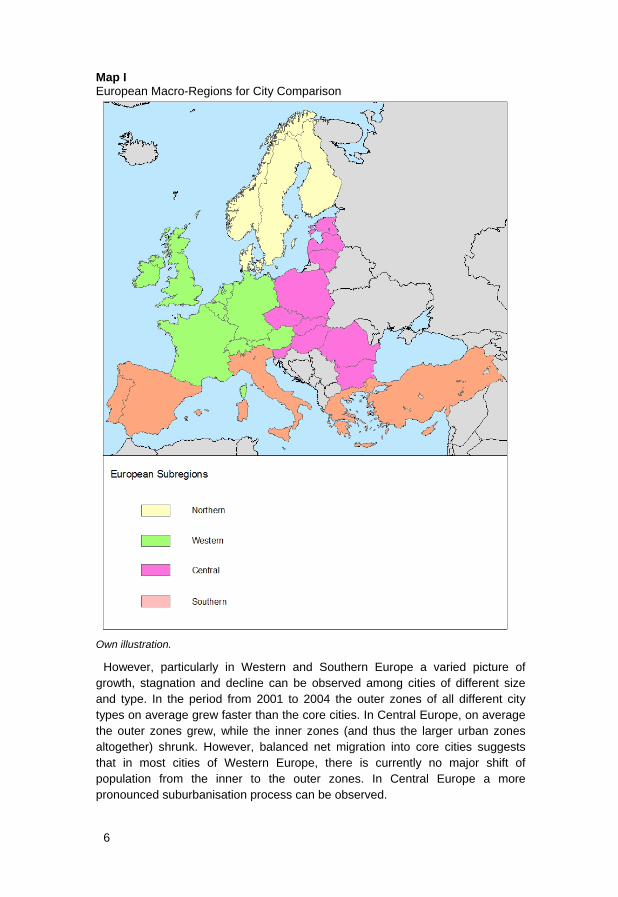
Map I European Macro-Regions for City Comparison
Own illustration.
However, particularly in Western and Southern Europe a varied picture of growth, stagnation and decline can be observed among cities of different size and type. In the period from 2001 to 2004 the outer zones of all different city types on average grew faster than the core cities. In Central Europe, on average the outer zones grew, while the inner zones (and thus the larger urban zones altogether) shrunk. However, balanced net migration into core cities suggests that in most cities of Western Europe, there is currently no major shift of population from the inner to the outer zones. In Central Europe a more pronounced suburbanisation process can be observed.
6
7
Many cities in the most accessible parts of Europe, e.g. in Germany, have reached a relatively advanced stage in the demographic ageing process. In most of these cities, there is a surplus of deaths over births, i.e. population growth depends on net immigration. In other parts of Europe, the population is, on average, still “younger”.
The analysis of population development in European cities reveals implications for different priorities of cohesion policy, as defined by recent documents on future EU policy:
- Even though there is a very diverse picture of population growth and decline, on average those urban regions representing the largest agglomeration of population and economic wealth in Europe continue to grow. In these city regions it will be a task of EU policy to prevent social exclusion. In those regions losing population it will be a task to prevent emigration by achieving a level of economic performance, which allows qualified people to find adequate jobs.
- EU policy can support integration of policy measures aimed at economic growth with those aimed at shaping an attractive urban environment for high-skilled migrants, but also for a variety of different age groups and family types. Demographic ageing will confront cities with manifold new challenges. EU policy may support exchange of experience between regions, which are already advanced in the ageing process today and those, where ageing will be a future challenge.
- Unequal growth of different parts of city regions implies a rationale for a multitude of place-based policy interventions tailored not only to the conditions of cities but to specific urban areas, for which EU support may be required.
Economy
This section focuses on indicators of economic prosperity, regional economic specialisation, innovation and entrepreneurship. Economic wealth and activity is highly concentrated in a European core zone of Western and Northern Europe, Northern Italy, parts of Spain, and the capital cities of Central European countries. In the past few decades, smaller cities in Central Europe and in more peripheral parts of Northern and Southern Europe have failed to keep pace with the economic dynamics of the big cities and capitals and the more vibrant smaller cities of Northern, Southern and Western Europe.
In most European countries there is an exceptional agglomeration of wealth in the capital city. This verifies the dominant and unique position of capitals in a (national) economic system (Figure II).
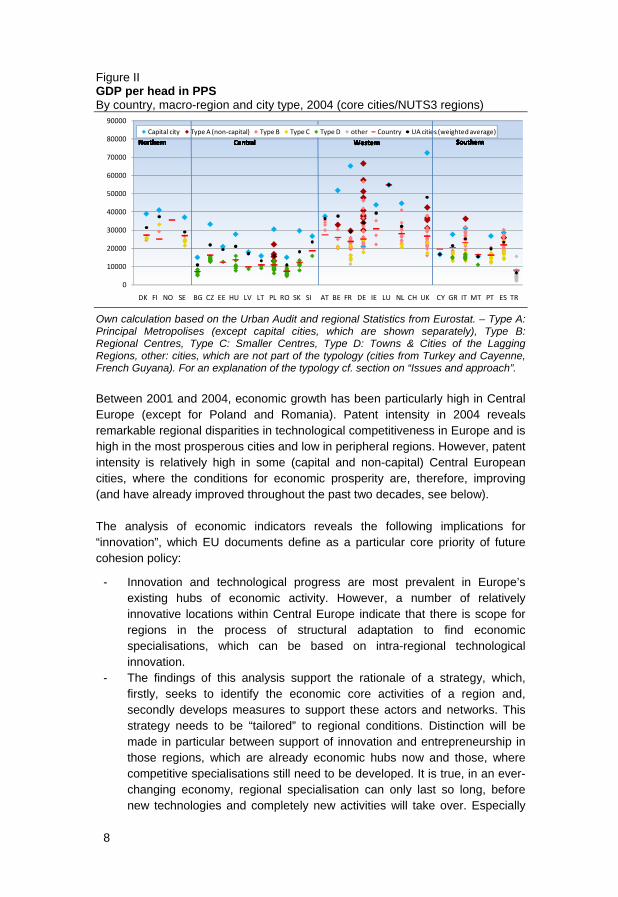
Figure II GDP per head in PPS By country, macro-region and city type, 2004 (core cities/NUTS3 regions)
0
10000
20000
30000
40000
50000
60000
70000
80000
90000
8
Own calculation based on the Urban Audit and regional Statistics from Eurostat. – Type A: Principal Metropolises (except capital cities, which are shown separately), Type B: Regional Centres, Type C: Smaller Centres, Type D: Towns & Cities of the Lagging Regions, other: cities, which are not part of the typology (cities from Turkey and Cayenne, French Guyana). For an explanation of the typology cf. section on “Issues and approach”.
Between 2001 and 2004, economic growth has been particularly high in Central Europe (except for Poland and Romania). Patent intensity in 2004 reveals remarkable regional disparities in technological competitiveness in Europe and is high in the most prosperous cities and low in peripheral regions. However, patent intensity is relatively high in some (capital and non-capital) Central European cities, where the conditions for economic prosperity are, therefore, improving (and have already improved throughout the past two decades, see below).
The analysis of economic indicators reveals the following implications for “innovation”, which EU documents define as a particular core priority of future cohesion policy:
- Innovation and technological progress are most prevalent in Europe’s existing hubs of economic activity. However, a number of relatively innovative locations within Central Europe indicate that there is scope for regions in the process of structural adaptation to find economic specialisations, which can be based on intra-regional technological innovation.
- The findings of this analysis support the rationale of a strategy, which, firstly, seeks to identify the economic core activities of a region and, secondly develops measures to support these actors and networks. This strategy needs to be “tailored” to regional conditions. Distinction will be made in particular between support of innovation and entrepreneurship in those regions, which are already economic hubs now and those, where competitive specialisations still need to be developed. It is true, in an ever-changing economy, regional specialisation can only last so long, before new technologies and completely new activities will take over. Especially
Capital city Type A (non‐capital) Type B Type C Type D other Country UA cities (weighted average)
Northern Central Western Southern
DK FI NO SE BG CZ EE HU LV LT PL RO SK SI AT BE FR DE IE LU NL CH UK CY GR IT MT PT ES TR
Northern Central Western SouthernNorthern Central Western SouthernNorthern Central Western SouthernNorthern Central Western SouthernNorthern Central Western SouthernNorthern Central Western SouthernNorthern Central Western Southern

9
for smaller cities, however, a very broad diversification will not be a possible alternative to a certain degree of specialisation. In any case, economic cores need to be understood as very flexible entities of industries and networks, which are themselves subject to constant change. There is scope for EU policy to support regions in this “smart specialisation” process.
- A specific characteristic of urban economic specialisation is tertiarisation, i.e. the concentration of services (including administrations of industrial enterprises and state administration). In many Western European countries, the most central public and private sector administrative functions concentrate in very large and capital cities, while regional economic control functions agglomerate in those classified as Regional Centres (Type B) in this report. In the highly centralised administrative systems of Central Europe, it will be very difficult to encourage a more balanced distribution of urban economic control functions over national space. As part of an economic development strategy focusing on utilisation of regional capacity, however, it can be a goal to enhance the role of smaller cities as focal points of regional productive networks.
Knowledge, Creativity, Diversity
While manifold interrelationships between regional competitiveness and human capital are apparent and engaging in higher education is an indispensible factor of economic prosperity, it cannot be expected that investing in education will provide short-term success in the process of structural adaptation. There is no doubt that many Central European cities, which stand out because of a particularly active engagement in higher education, will benefit from this effort in the long run. Since there is conclusive evidence demonstrating the role of knowledge workers in regional performance, cities must provide more attractive conditions in peripheral and lagging regions, to encourage students to stay in the region after graduation. In the case of all cities, there is a very strong positive correlation between the proportion of foreigners and urban economic wealth. While vibrant cities in the core zones of the European economy attract many migrants from within and beyond national borders, in peripheral locations, the in-flow of migrants from other regions and countries is low. For peripheral cities, it is naturally a key priority to provide favourable conditions for economically active inhabitants to stay in the region.
There is a highly urban dimension especially to the support of knowledge-based territorial cohesion. Innovation indicators, such as patent intensity, measure higher innovation activity in cities than in countries on average and among cities, innovation output is particularly high in the very large agglomerations. Cities, therefore, seem to provide favourable surroundings for the diffusion of knowledge and its application in economic activity, even though it is very difficult to apply statistical indicators for these processes on a regional level and the existing measures may be biased in favour of cities, e.g. because firms may attribute all company-wide research activity to headquarter locations.
10
Since generation of innovation requires constant effort and is, in itself, the driving force of economic change, there is a wide scope of policy support with an urban focus even in the most prosperous regions of Europe. In Central Europe, it will be a task of cohesion policy to support local actors in identifying suitable economic sectors and developing strategies for regional knowledge-based growth.
Social cohesion
Empowering people in inclusive societies is one of the key priorities of the envisaged EU policy for the forthcoming decade. A socially inclusive society can, in short, be defined as one in which all individuals (and groups) can enjoy essential standards and in which disparities are acceptable. It is, of course, very difficult to examine to what extent disparities between individuals and groups are acceptable. Yet, based on the Urban Audit indicator set and additional (subjective) information from the Perception Survey on quality of life in European cities3, an overview of the standard of living according to selected indicators is given in the report.
The main issues examined in this section comprise employment and unemployment and living conditions as represented by health care, housing, and safety. A direct measure of intra-city income disparity is only available for part of the Urban Audit cities. It suggests that in the period from 2001 to 2004, income disparity in cities as a whole did not increase and that income disparity is not a typical “big city” problem in Europe, but an apparent characteristic of cities of very different size and in very different macro-regions.
It can be argued that the overall agglomeration process in the European core zone is not, as might be suspected according to some hypotheses, accompanied by a simultaneously increasing degree of urban poverty or disparity, as far as the available indicators allow such generalisation. Unemployment rates differ between cities from most European macro-regions, except for Northern Europe, where unemployment rates are generally low. Unemployment is particularly high in smaller cities of Central Europe, but has declined there, considerably, since the beginning of the 1990s and continued to decline in the period from 2001 to 2004. Unemployment is lowest in the most prosperous cities and there is no above-average concentration of unemployment in very large cities. Unemployment is particularly low in the outer zones of the very large cities, where, on average, unemployment rates have decreased even further in the study period. Yet, employment rates of the resident population in Northern, Southern and Western Europe are relatively low in a number of cities.
The apparent lack of an interlinkage between wealth and job creation for urban residents in cities has been described as an urban paradox. In particular,
3Perception survey on quality of life in 75 European cities, European Commission, Re-gional Policy, March 2010, available in five languages (DE, EN, ES, FR, NL) at: http://ec.europa.eu/regional_policy/themes/urban/audit/index_en.htm

11
employment rates would be expected to be very high in the Principal Metropolises, but they are considerably higher in some of the second-tier Regional Centres. By and large, since the 1990s this paradoxical situation has persisted in European cities, yet as a whole the share of those not participating in the creation of value has not – as might have been suspected – increased.
In order to secure economic prosperity and social stability, it will be a task for many of the large cities of Europe, but also for the smaller cities in peripheral regions, to encourage higher participation in the urban labour market among the resident population.
Since it can be expected that labour-oriented migration will continue to focus on large cities, smaller cities may find it increasingly difficult to compete for mobile workers. However, combination of a good quality public (e.g. health care, education, culture) infrastructure, good accessibility, a certain degree of economic specialisation and affordable high-quality housing may prove to be a considerable advantage of smaller cities in competition with the large agglomerations and serve to prevent income disparity and poverty.
According to the Barca (2009) report on an “agenda for a reformed cohesion policy”4, an EU place-based approach can respond to the highly diverse way, in which migration flows affect regions. The results presented in this Second State of European Cities Report would strongly support this argument, since it was shown that attraction of foreigners is one of the factors securing urban prosperity already and is likely to improve in importance in the course of demographic ageing of European society on the one hand and increasing mobility on the other. EU cohesion policy could support local authorities in urban and rural areas in adjusting public service in the fields of education, healthcare, transport, childcare, extension of skills, business support, urban renewal, and in addressing special needs of migrants and people particularly affected by migration.
Since children in Europe have a higher poverty risk than the total population, ensuring their social inclusion, particularly in cities, can also be considered as a core policy priority. In many cities, low birth rates in comparison with national averages show that families with children are under-represented. High priority would also be recommended for social inclusion of the elderly as a policy objective in order to secure future prosperity of cities in particular.
So far, no general conclusion about the degree of disparities between sub-city districts or the extent, to which such disparities are deemed “acceptable” can be made. It is very likely that due to residential segregation social inclusion for poor people and minority groups will be more difficult to achieve. However, segregation patterns are highly diverse, even among cities of similar size and function and within regions. Policy aiming at a reduction of segregation needs to be tailored to specific regional conditions. Responsibility for such programmes would ideally be located at the relevant departments of municipal administrations, which may be supported by an “external intervention” from
4http://ec.europa.eu/regional_policy/policy/future/barca_en.htm

12
national governments and the EU. In neighbourhood-oriented policy, more attention needs to be paid to the effects of segregation according to age and fa-mily type.
Governance and civic involvement
The index of “city powers”5 as elaborated by the first State of European Cities report has been revised. The results shed some light on cities’ financial capacities in terms of financial weight and financial autonomy. Interpreting governance data and comparing data in different cities is a far more complex endeavour than analysis of other city characteristics (e.g. demographic and economic aspects), since institutional settings must be considered here.
Looking at the index of “powers”, it is apparent from the variety of national patterns that cities do not only differ as a result of their size, economic potential or location, but also on account of the country they represent in the analysis. Since Scandinavian countries traditionally entrust sub-national levels (e.g. cities) with stronger decision-making powers and greater financial capacity, Scandinavian cities, whether large or small, economically powerful or lagging behind, will, as a matter of course, score high in the index of powers.
While it may have been expected that the scope of city administrations depends more or less evenly on city size and political autonomy, e.g. in local taxation, a significantly larger proportion of those Urban Audit cities with relatively large administrative “powers” appear to draw their overall scope to govern their own concerns more from political autonomy than from sheer size.
Environment and transport
With respect to the indicators provided by the Urban Audit, the environmental characteristics of European cities differ to a great extent. The analysis in this report takes into account a selection of these indicators, namely land use, air pollution, car use and waste treatment.
Land use in Urban Audit cities shows rather little variation in respect to the size of land allocated to housing and recreation and sports. In contrast, there is high diversity in the size of total land area and green space area among the cities. In general, cities with a relatively large land area in relation to the resident population, are “greener” cities providing more urban biodiversity. NO2 concentrations are negatively correlated with the proportion of green space in the core city area. A similar relationship between air pollution and the way in which settlements are geographically organised is found for PM10, the concentration of which is positively correlated with the population density of the urban set-
5The members of the panel of experts expressed a lot of scepticism concerning the
terminology in this section of the report. In the literature, the term “powers” is associated with the scope of a city’s entrusted authority, conveyed by budgetary capacity, autonomy and size. Since this concept is suitable to the focus of this study, the term “powers” was adopted here.
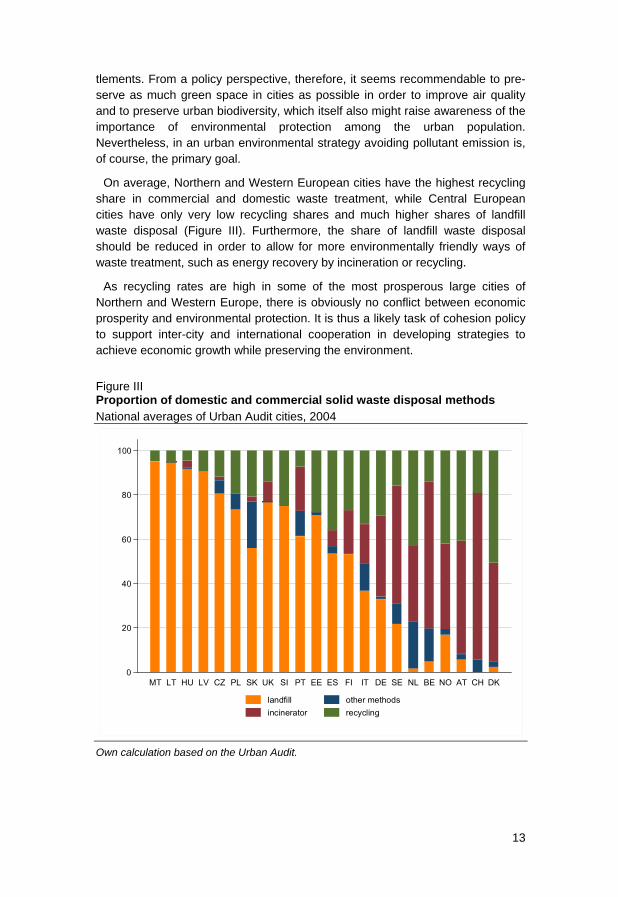
tlements. From a policy perspective, therefore, it seems recommendable to pre-serve as much green space in cities as possible in order to improve air quality and to preserve urban biodiversity, which itself also might raise awareness of the importance of environmental protection among the urban population. Nevertheless, in an urban environmental strategy avoiding pollutant emission is, of course, the primary goal.
On average, Northern and Western European cities have the highest recycling share in commercial and domestic waste treatment, while Central European cities have only very low recycling shares and much higher shares of landfill waste disposal (Figure III). Furthermore, the share of landfill waste disposal should be reduced in order to allow for more environmentally friendly ways of waste treatment, such as energy recovery by incineration or recycling.
As recycling rates are high in some of the most prosperous large cities of Northern and Western Europe, there is obviously no conflict between economic prosperity and environmental protection. It is thus a likely task of cohesion policy to support inter-city and international cooperation in developing strategies to achieve economic growth while preserving the environment.
Figure III Proportion of domestic and commercial solid waste disposal methods National averages of Urban Audit cities, 2004
100
80
60
40
20
0MT LT HU LV CZ PL SK UK SI PT EE ES FI IT DE SE NL BE NO AT CH DK
landfill other methodsincinerator recycling
Own calculation based on the Urban Audit.
13
14
City statistics as a tool for European policy
Since the achievement of key goals of European policy, e.g. support of knowledge-based economic growth, social inclusion and environmental sustainability, depends on the success of many measures with a particular urban focus, continuing efforts to improve the knowledge-base on urban conditions are required. To improve usability of the Urban Audit as a policy-oriented information tool further, the indicator set itself and the instruments for analysis and display are currently being advanced. Among the Urban Audit cities, an additional annual data collection with a reduced catalogue of variables will be added in order to provide complete time-series of key indicators. The total data collection will be continued every third year. A further Large City Audit includes all ‘non-Urban Audit cities’ with more than 100,000 inhabitants in the EU. To provide information about the perception of life in European cities, the Perception Survey on quality of life in European cities will be continued. As from 2010, a GIS-based information tool on the Internet, the Urban Atlas, will improve usability of the Urban Audit considerably. Allowing display of Urban Audit data in different kinds of maps, it will be a useful tool for planners and policy-makers in particular. Furthermore, Eurostat is preparing a web-based dissemination tool called “Cities’ and Regions’ Profile” (CARP) based on Urban Audit data.