promo review romania jan - sept 2012 vs 2011
TRANSCRIPT

Jan-Sept 2012 vs 2011
PROMO
Promo Review of food retailers in 20’top
ReviewJan-Sept 2012 vs
2011

Jan-Sept 2012 vs 2011
RETAILERS SUMMARY
QUANTITATIV KPI Slides
1- LEAFLETS & PROMO OPERATIONS 4-14
60-72
4- PROMO MECHANISMS 50-56
3- PROMO PRESSURE & SHARE OF VOICE
34-49
2- TRADE STRATEGY 15-33
QUALITY KPI 57-59
CONTENT :
Promo Review of food retailers in 20’top

Jan-Sept 2012 vs 2011
VOCABULARY• Promo Pressure: index of promo visibility for a retailer, a category a brand or a format. This
index can be counted by quantity of leaflets or quantity of promotions inside the leaflets.
• Share of Voice: index of promo visibility for a retailer, a category a brand or a format in relative value versus competitors. The Share of Voice index of Hipercom shows the promo activity of the Retailers in the most exhaustive way, taking into consideration the quantity of promotional operations, SKU’s or SNU in Promo, the commercial space (in m2) when the promotion was valid and the number of days of the validity days of that specific promotion.
• Shopper Need Unit ( SNU): One or more SKU from the same family, being on the same promotion (many flavors for juice, many colors for shampoo, many sizes for textile)
• Consumer advantages: All additional trade mechanisms supporting the promo price and mentioned on the promo leaflet.
•Promo price: Price on the leaflet (should be different from the shelf price) •Virtual Price: Promo price – (minus) all consumers advantages •Perimeter of analysis: Romania: CC, Hyper, Super, HDD (Analysis for the Top 20 Retailers of this category)

Jan-Sept 2012 vs 2011
PROMOReview
Promo Review of food retailers in 20’top
1- LEAFLETS & PROMO OPERATIONS
Jan-Sept 2012 vs 2011

Jan-Sept 2012 vs 2011
LEAFLETS & PROMO PRESSURE (traffic leaflets)
NATIONALS OP
REGIONAL OP
Jan-Sept 2012
Jan-Sept 2011
Evolution Pressure
We see that the retailers prefer to investIn regional PO in 2012
*A Promo Operation is a set of leaflets issued by a store network. This set could consist of one leaflet till 25 or more regional variations
367 387 -5% -10%
76 34 124% 112%
* Quantity of leaflets 2012 vs 2011. All traffic leaflets = 100%.

Jan-Sept 2012 vs 2011
LEAFLETS & PROMO PRESSURE (traffic leaflets)
NATIONALS OP
REGIONAL OP
45
24
39
32
( Nationals PO) Jan-
Sept2012(evol) HM SM( Nationals PO) Jan-Sept2012(evol)
+15 (PO)
-2 (PO)41
26
20
18
+1 (PO)
*A Promo Operation is a set of leaflets issued by a store network. This set could consist of one leaflet till 25 or more regional variations
+5 (PO)
367 387 -5% -10%
76 34 124% 112%
Jan-Sept 2012
Jan-Sept 2011
Evolution Pressure
+5 (PO)
* Quantity of leaflets 2012 vs 2011. All traffic leaflets = 100%.
+18(PO)
+5 (PO)

Jan-Sept 2012 vs 2011
LEAFLETS & PROMO PRESSURE (traffic leaflets)
NATIONALS PO
REGIONAL PO
C&C HD34
29
36
39
( Nationals PO) Jan-
Sept2012(evol) ( Nationals PO) Jan-
Sept2012(evol) +23(PO)
*A Promo Operation is a set of leaflets issued by a store network. This set could consist of one leaflet till 25 or more regional variations
367 387 -5% -10%
76 34 124% 112%
Jan-Sept 2012
Jan-Sept 2011
Evolution Pressure
-6 (PO)
+2 (PO)
* Quantity of leaflets 2012 vs 2011. All traffic leaflets = 100%.
-3 (PO)

Jan-Sept 2012 vs 2011
5 TOP TRAFFIC LEAFLET (by PO Share of Voice)
Number of SNU 935 484 404426 416Stores 19 8 824 24Days 31 11 1413 13Benchmark vs
Leader 100% 52% 43%46% 44%

Jan-Sept 2012 vs 2011
NUMBER OF PROMO OPERATIONS (traffic leaflets)
Almost all the retailers increased their quantity of leaflet edition.
45
41
39
39
36
34
32
29
26
24
20
18
+15 po
+5 po
+1 po
+23 po
-6 po
+2 po
+5 po
-3 po
+18 po
-2 po
+5 po
Jan-Sept 2012 vs 2011
81
72
21
20
10
10
4
4
3
3
2
1
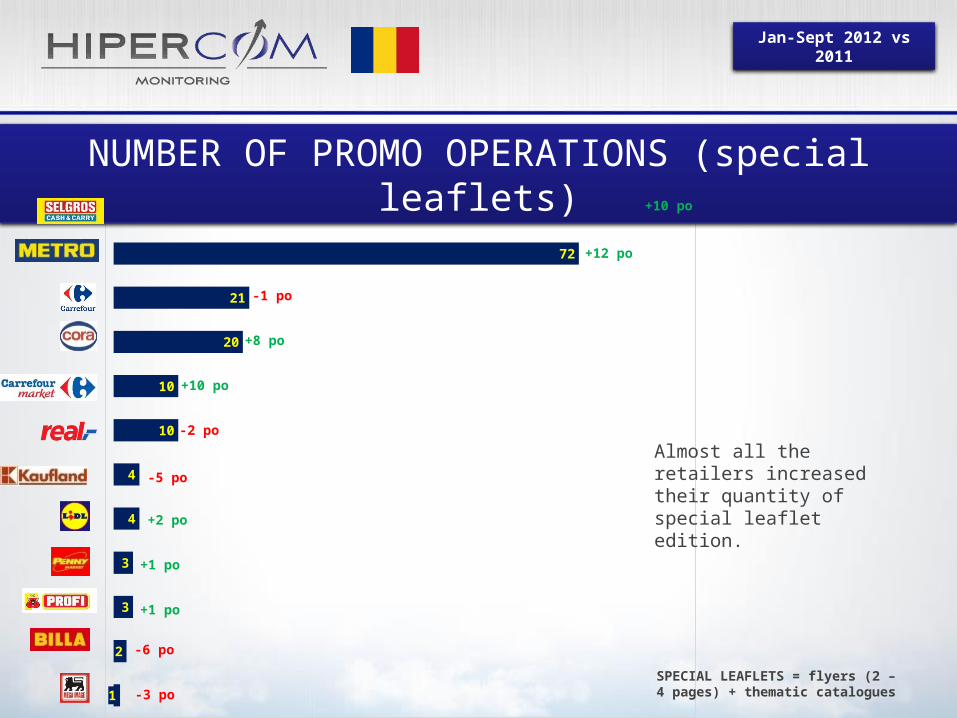
NUMBER OF PROMO OPERATIONS (special leaflets)
Almost all the retailers increased their quantity of special leaflet edition.
+10 po
+12 po
-1 po
+8 po
+10 po
-2 po
-5 po
+2 po
+1 po
+1 po
-6 po
-3 poSPECIAL LEAFLETS = flyers (2 – 4 pages) + thematic catalogues

Jan-Sept 2012 vs 2011
45 pag
31 pag
27 pag
25 pag
18 pag
16 pag
16 pag
13 pag
12 pag
12 pag
10 pag
4 pag
AVERAGE NUMBER OF PAGES/PROMO OP (traffic leaflets)
The number of pages per PO is decreasing or increasing. Only Penny, Cora and Carrefour Market are constant. We can see the most Significant cost cutting in REAL.
2 pag
-6 pag
2 pag
-1 pag
6 pag
2 pag
1 pag
3 pag
1 pag

Jan-Sept 2012 vs 2011
26 pag
22 pag
21 pag
20 pag
18 pag
9 pag
9 pag
7 pag
5 pag
4 pag
4 pag
3 pag
AVERAGE NUMBER OF PAGES/PROMO OP (special leaflets)
The number of pages per PO is decreasing or increasing. Only Cora and Carrefour Market are constant. We can see the mostSignificant cost cutting in PENNY, METRO & REAL.
-3 pag
-6 pag
-7 pag
-2 pag
6 pag
-8 pag
-3 pag
-5 pag
-2 pag
-2 pag
SPECIAL LEAFLETS = flyers (2 – 4 pages) + thematic catalogues

Jan-Sept 2012 vs 2011
Average SNU/page (traffic leaflets)
Number of SNU/page
The most readable is
Selgros
5.9
6.1
6.2
8.1
8.5
9.3
9.4
9.8
9.9
10.6
20.0
20.5
SNU/ page
SNU/ page
SNU/ page
SNU/ page
SNU/ page
SNU/ page
SNU/ page
SNU/ page
SNU/ page
SNU/ page
SNU/ page
SNU/ page

Jan-Sept 2012 vs 2011
Average SNU/page (special leaflets)
Number of SNU/page
The most readable is LIDL
3.8
4.4
5.0
5.5
6.0
6.4
6.8
8.3
10.8
11.4
11.5
14.9
SNU/ page
SNU/ page
SNU/ page
SNU/ page
SNU/ page
SNU/ page
SNU/ page
SNU/ page
SNU/ page
SNU/ page
SNU/ page
SNU/ page

Jan-Sept 2012 vs 2011
2012 vs 2011
PROMOReview
Promo Review of food retailers in 20’top
2 - TRADE STRATEGY
Jan-Sept 2012 vs 2011
Brands
Private Label
Unbranded
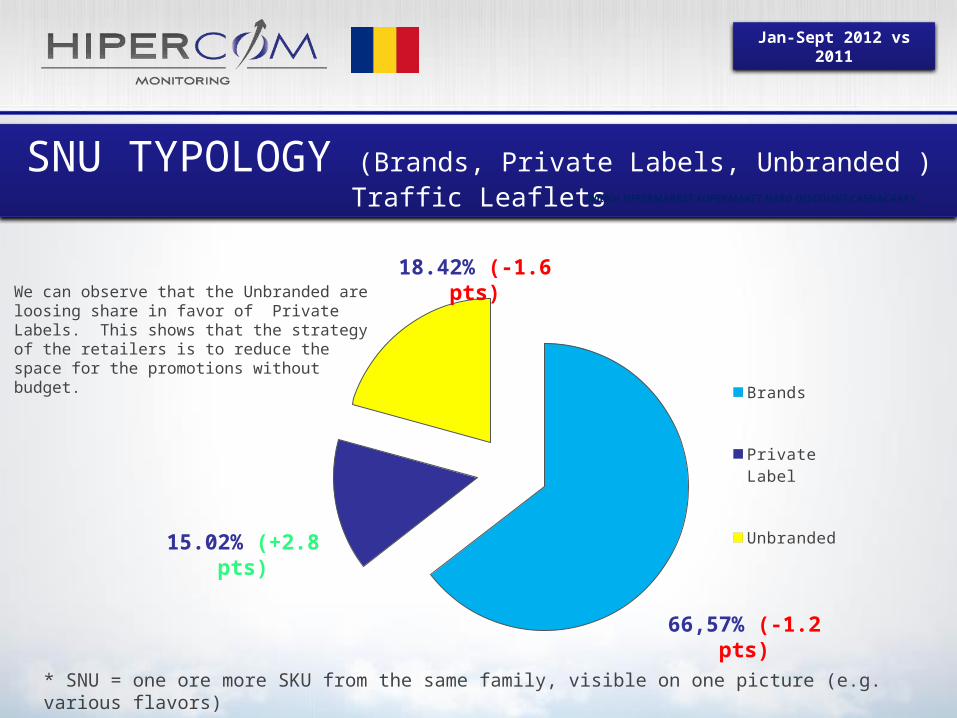
SNU TYPOLOGY (Brands, Private Labels, Unbranded ) Traffic Leaflets
66,57% (-1.2 pts)
15.02% (+2.8 pts)
18.42% (-1.6 pts)
Within HIPERMARKET,SUPERMAKET,HARD DISCOUNT,CASH&CARRY
We can observe that the Unbranded are loosing share in favor of Private Labels. This shows that the strategy of the retailers is to reduce the space for the promotions without budget.
* SNU = one ore more SKU from the same family, visible on one picture (e.g. various flavors)

Jan-Sept 2012 vs 2011
SNU TYPOLOGY (National Brands) Traffic LeafletsNumberSNU/OP
National Brands Private Label UnbrandedEvolution Jan-Sept 2012
vs 2011
* SNU = one ore more SKU from the same family, visible on one picture (e.g. various flavors)
187 ref
355 ref
225 ref
264 ref
148 ref
197 ref
33 ref
57 ref
98 ref
144 ref
235 ref
245 ref
63,85%
(-1,7 pts)
60,60%
(0,9 pts)
54,40%
(1,8 pts)
60,96%
(-0,4 pts)
74,56%
(1,1 pts)
84,66%
(1,3 pts)
67,87%
(19,7 pts)
75,61%
(-0,8 pts)
6,52%(1,6 pts)
67,63%
(4,2 pts)
77,01%
(7,4 pts)
90,95%
(0,5 pts)
-26
38
16
-43
7
82
9
14
34
2
50
16

Jan-Sept 2012 vs 2011
SNU TYPOLOGY (Private Label) Traffic LeafletsNumberSNU/OP
National Brands Private Label UnbrandedEvolution Jan-Sept 2012
vs 2011
* SNU = one ore more SKU from the same family, visible on one picture (e.g. various flavors)
12,30% (0,2 pts)
12,39% (-0,6 pts)
15,08% (-1 pts)
10,94% (0,6 pts)
8,03% (0,8 pts)
14,07% (0,2 pts)
17,29%(-15,5 pts)
6,87% (2,3 pts)
82,69% (-0,2 pts)
14,44% (-0,4 pts)
16,80% (-1,9 pts)
4,34% (-1 pts)
187 ref
355 ref
225 ref
264 ref
148 ref
197 ref
33 ref
57 ref
98 ref
144 ref
235 ref
245 ref
63,85%
(-1,7 pts)
60,60%
(0,9 pts)
54,40%
(1,8 pts)
60,96%
(-0,4 pts)
74,56%
(1,1 pts)
84,66%
(1,3 pts)
67,87%
(19,7 pts)
75,61%
(-0,8 pts)
6,52%(1,6 pts)
67,63%
(4,2 pts)
77,01%
(7,4 pts)
90,95%
(0,5 pts)
-26
38
16
-43
7
82
9
14
34
2
50
16

Jan-Sept 2012 vs 2011
SNU TYPOLOGY (Unbranded) Traffic LeafletsNumberSNU/OP
National Brands Private Label UnbrandedEvolution Jan-Sept 2012
vs 2011
* SNU = one ore more SKU from the same family, visible on one picture (e.g. various flavors)
12,30% (0,2 pts)
12,39% (-0,6 pts)
15,08% (-1 pts)
10,94% (0,6 pts)
8,03% (0,8 pts)
14,07% (0,2 pts)
17,29%(-15,5 pts)
6,87% (2,3 pts)
82,69% (-0,2 pts)
14,44% (-0,4 pts)
16,80% (-1,9 pts)
4,34% (-1 pts)
23,85%(1,5 pts)
27,01%(-0,3 pts)
30,52%(-0,8 pts)
28,10%(-0,2 pts)
17,40%(-1,9 pts)
1,27%(-1,5 pts)
14,84%(-4,1 pts)
17,52%(-1,5 pts)
10,79%(-1,4 pts)
17,93%(-3,8 pts)
6,19%(-5,4 pts)
4,71%(0,4 pts)
187 ref
355 ref
225 ref
264 ref
148 ref
197 ref
33 ref
57 ref
98 ref
144 ref
235 ref
245 ref
63,85%
(-1,7 pts)
60,60%
(0,9 pts)
54,40%
(1,8 pts)
60,96%
(-0,4 pts)
74,56%
(1,1 pts)
84,66%
(1,3 pts)
67,87%
(19,7 pts)
75,61%
(-0,8 pts)
6,52%(1,6 pts)
67,63%
(4,2 pts)
77,01%
(7,4 pts)
90,95%
(0,5 pts)
-26
38
16
-43
7
82
9
14
34
2
50
16
Jan-Sept 2012 vs 2011
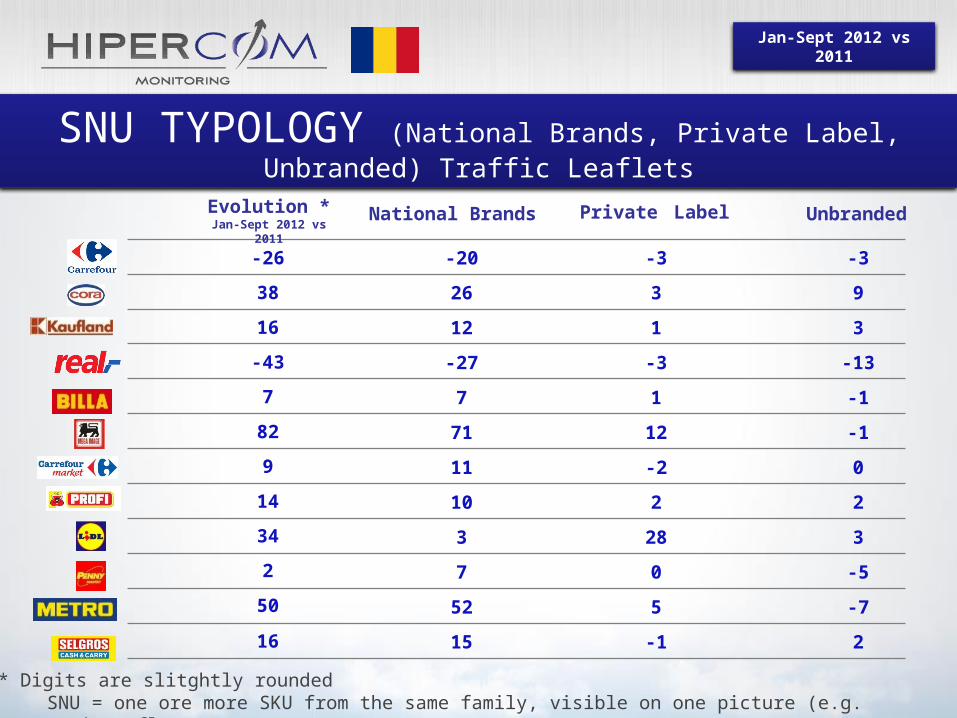
SNU TYPOLOGY (National Brands, Private Label, Unbranded) Traffic Leaflets
National Brands
SNU = one ore more SKU from the same family, visible on one picture (e.g. various flavors)
Private Label UnbrandedEvolution *Jan-Sept 2012 vs
2011
-26
38
16
-43
7
82
9
14
34
2
50
16
* Digits are slitghtly rounded
-20
26
12
-27
7
71
11
10
3
7
52
15
-3
3
1
-3
1
12
-2
2
28
0
5
-1
-3
9
3
-13
-1
-1
0
2
3
-5
-7
2

Jan-Sept 2012 vs 2011
83.2 81.5
71.6
23.0 20.8 17.5 15.6 14.2 13.5 11.3 9.4 7.3
AVERAGE VIRTUAL PRICE & AVERAGE PROMO PRICE (traffic leaflets)
Metro had a severe reduction of the virtual price by 82%, meanwhile Carrefour Market increased the virtual prince by 133%.
AVERAGE PROMO PRICEMetro had a severe reduction of the promo price by 82%, meanwhile Carrefour Market increased the promo prince by 133%.
83.4 81.7
71.8
23.0 21.417.7 15.6 14.3 13.5 11.5 9.7 7.3
AVERAGE VIRTUAL PRICE
-0,5-14,0
3,6
0,4 -95,2 1,1 8,9 0,5 -0,5 -0,3 0,0 -0,2
3,2 -13,5
3,6
0,4 -95,2 1,1 8,9 0,4 -0,5 -0,3 -0,1 -0,2

Jan-Sept 2012 vs 2011
AVERAGE VIRTUAL PRICE & AVERAGE PROMO PRICE (traffic leaflets) (FOOD CATEGORY)
AVERAGE PROMO PRICE
AVERAGE VIRTUAL PRICE
15.6
12.3 11.7 11.5 10.9 10.8 10.68.3 8.1 8.0 8.0 7.2
15.6
12.5 11.9 11.6 11.5 11.1 10.78.7 8.3 8.1 8.0 7.2
8,91,5 1,1 -0,2 -1,1 0,9 0,0
-0,4 0,5 0,5 1,9 0,0
9,0
1,5 1,1 -0,2 -0,9 0,6 -0,5-0,3 0,5 0,5 1,9 0,0

Jan-Sept 2012 vs 2011
METR
O
CARREFO
UR M
ARKET
MEGA
IMAG
E
CARREFO
UR
SELG
ROS
CORA
REAL-H
YPERM
ARKET
PENNY
MAR
KET
PROFI
LIDL
BILLA
KAUFL
AND
11.4 11.1 10.6 9.8 9.7 9.68.6 8.3 8.0 8.0 7.7 7.2
-0,42,0 -0,3 0,8 -0,9 -0,8
0,7 0,5 0,4 -0,4 1,2 -0,1
AVERAGE VIRTUAL PRICE & AVERAGE PROMO PRICE (traffic leaflets) (PRODUSE AMBALATE CU AUTOSERVIRE)
AVERAGE PROMO PRICE
AVERAGE VIRTUAL PRICE
METR
O
CARREFO
UR M
ARKET
MEGA
IMAG
E
CARREFO
UR
SELG
ROS
CORA
REAL-H
YPERM
ARKET
PENNY
MAR
KET
PROFI
BILLA
LIDL
KAUFL
AND
11.7 11.1 10.7 10.0 9.9 9.7 9.0 8.4 8.0 8.0 8.0 7.2
-0,51,9 -0,3 1,2 -0,9 -0,3
0,5 0,5 0,4 1,2 -0,4 -0,1

Jan-Sept 2012 vs 2011
AVERAGE VIRTUAL PRICE & AVERAGE PROMO PRICE (traffic leaflets) (FRUCTE SI LEGUME)
AVERAGE PROMO PRICE
AVERAGE VIRTUAL PRICE
CORA
SELGRO
S
MEG
A IMAG
ELI
DL
CARREFOUR M
A...
METR
O
REAL-H
YPERM
A...
PEN
NY
MARKET
KAUFLA
ND
CARREFOUR
BILLA
PROFI
10.49.2 9.2
8.2 8.06.8
5.0 4.6 4.4 4.4 4.1 3.8
CORA
SELGRO
S
MEG
A IMAG
ELI
DL
CARREFOUR M
A...
METR
O
REAL-H
YPERM
A...
PEN
NY
MARKET
KAUFLA
ND
CARREFOUR
BILLA
PROFI
10.49.2 9.2
8.2 8.06.8
5.0 4.6 4.4 4.4 4.1 3.8
5,9 -1,63,9 -24,3 5,0
-2,30,2 0,5 0,4 -0,3 -0,2 -0,1
5,9-1,6 3,9 -24,3 5,0
-2,3
0,2 0,5 0,4 -0,6 -0,2 -0,1

Jan-Sept 2012 vs 2011
16.814.2 13.3 12.9
11.0 10.4 9.5 9.0 8.97.8 7.2 6.2
9,3 1,0 -2,5 0,7
0,1 7,1 0,7 2,2 0,1 -0,1
-0,1 0,0
AVERAGE VIRTUAL PRICE & AVERAGE PROMO PRICE (traffic leaflets) (CONGELATE)
AVERAGE PROMO PRICE
AVERAGE VIRTUAL PRICE
16.814.4 13.3 13.2
11.1 11.0 9.8 9.5 9.0 7.8 7.3 6.2
9,3 0,9
-2,5 0,6
7,1 -0,1 0,5 2,3 0,5
-0,1 -0,2 0,0

Jan-Sept 2012 vs 2011
AVERAGE VIRTUAL PRICE & AVERAGE PROMO PRICE (traffic leaflets) (FOOD)
AVERAGE PROMO PRICE
AVERAGE VIRTUAL PRICE
16.9
11.59.9 9.7 9.0 7.9 7.4 7.2 6.9 6.7 5.9 5.6
16.9
11.710.0 9.7 9.1
7.9 7.7 7.6 6.9 6.8 6.0 5.6
12,0
1,52,0 -0,1 1,2 0,2
-1,9 -0,8 2,7 0,6 0,6 -0,2
12,1
1,62,0 -0,1 0,9
-0,1 -1,8 -0,8 2,7 0,6 0,6 -0,2

Jan-Sept 2012 vs 2011
AVERAGE VIRTUAL PRICE & AVERAGE PROMO PRICE (traffic leaflets) (DETERGENTI - IGIENA)
AVERAGE PROMO PRICE
AVERAGE VIRTUAL PRICE
REAL-HY-PERMARKET
CARREFOUR CARREFOUR MARKET
PENNY MARKET
SELGROS KAUFLAND METRO CORA BILLA PROFI MEGA IMAGE LIDL
25.622.6 22.0
20.0 18.8 17.9 17.7 16.9 16.0 15.4 13.711.2
REAL-HY-PERMARKET
CARREFOUR CARREFOUR MARKET
PENNY MARKET
SELGROS METRO KAUFLAND CORA BILLA PROFI MEGA IMAGE LIDL
25.823.8 22.0 20.4 19.5 19.3 18.2 17.1 17.0 15.4 13.9
11.3
0,2 3,0 11,61,8 2,8 -1,1 -0,2
1,7 -1,6 -2,3-0,6 1,5
0,0 2,911,6 2,1 3,0 0,0
-0,9 0,7 -1,1 -2,3-0,5 1,6

Jan-Sept 2012 vs 2011
AVERAGE VIRTUAL PRICE & AVERAGE PROMO PRICE (traffic leaflets) (COSMETICE)
AVERAGE PROMO PRICE
AVERAGE VIRTUAL PRICE
24.8
19.014.8 14.5 14.3 14.0 13.0 12.7 12.5 12.2 11.7
9.7
24.8
19.414.9 14.8 14.8 14.5 14.4 13.5 13.3 12.4 12.3
9.7
16,5
3,52,1
-0,71,1 1,8
0,7 0,0 1,5 -0,1 -0,7-0,8
16,5
3,6
2,1 1,4 -0,7 0,5 0,5 1,1 1,4 -0,6 -0,1-0,8

Jan-Sept 2012 vs 2011
AVERAGE VIRTUAL PRICE & AVERAGE PROMO PRICE (traffic leaflets) (PRODUSE VRAC/SERVIRE ASISTATA)
AVERAGE PROMO PRICE
AVERAGE VIRTUAL PRICE
METR
O
CARREFO
UR M
ARKET
MEGA
IMAG
E
SELG
ROS
CARREFO
UR
PENNY
MAR
KET
CORALI
DL
REAL-H
YPERM
ARKET
KAUFL
AND
BILLA
PROFI
24.122.1 22.0
17.714.1 14.0 12.7
9.9 8.6 7.1 6.7 5.6
METR
O
CARREFO
UR M
ARKET
MEGA
IMAG
E
SELG
ROS
CARREFO
UR
PENNY
MAR
KET
CORALI
DL
REAL-H
YPERM
ARKET
KAUFL
AND
BILLA
PROFI
24.122.1 22.0
17.714.1 14.0 12.7
9.9 8.7 7.1 6.7 5.6
-2,514,1 8,6
1,0-0,8 3,1 -3,4
-1,2
-0,1 2,0 0,5 0,3
-2,514,1 8,6
1,0
-
1,0 3,0-4,2 -1,2
-0,1 2,0 0,5 0,3

Jan-Sept 2012 vs 2011
AVERAGE VIRTUAL PRICE & AVERAGE PROMO PRICE (traffic leaflets) (NON FOOD CATEGORY)
AVERAGE PROMO PRICE
AVERAGE VIRTUAL PRICE
METR
O
CARREFO
UR
CORA
REAL-H
YPERM
ARKET
SELG
ROS
PENNY
MAR
KETLI
DL
KAUFL
AND
BILLA
CARREFO
UR M
ARKET
MEGA
IMAG
E
PROFI
266.8232.3
186.8149.8
70.647.2 34.2 29.9 25.3 9.4 8.5 8.1
-248,015,6
5,4-0,4
-7,4 7,1-0,4 -2,2 7,1 1,0 1,0 -2,5
METR
O
CARREFO
UR
CORA
REAL-H
YPERM
ARKET
SELG
ROS
PENNY
MAR
KETLI
DL
KAUFL
AND
BILLA
CARREFO
UR M
ARKET
MEGA
IMAG
E
PROFI
266.8232.4
187.0150.0
70.647.4 34.2 29.9 25.4 9.4 8.5 8.1
-249,2-16,5
-2,9-0,4
-7,5 7,2-0,4 -2,2 7,1 1,0 -1,1 -2,5

Jan-Sept 2012 vs 2011
AVERAGE VIRTUAL PRICE & AVERAGE PROMO PRICE (traffic leaflets) (ELECTRO-FOTO-CINEMA-SUNET)
AVERAGE PROMO PRICE
AVERAGE VIRTUAL PRICE
METR
O
CORA
CARREFO
UR
REAL-H
YPERM
ARKET
SELG
ROS
PENNY
MAR
KETLI
DL
KAUFL
AND
BILLA
CARREFO
UR M
ARKET
MEGA
IMAG
E
PROFI
778.3
610.2 607.3480.3
178.4 137.773.3 68.1 51.3 11.0 4.0
METR
O
CORA
CARREFO
UR
REAL-H
YPERM
ARKET
SELG
ROS
PENNY
MAR
KETLI
DL
KAUFL
AND
BILLA
CARREFO
UR M
ARKET
MEGA
IMAG
E
PROFI
778.3
611.0 607.4480.4
178.4 137.873.3 68.1 51.3 11.0 4.0
-301,853,6 62,8
-41,3
-90,3 0,4 -25,2 5,34,7 0,0 4,0 -55,0
-304,6
27,6 61,4-41,3
-90,3 0,2
-
25,25,3 4,7 0,0 4,0 -55,0

Jan-Sept 2012 vs 2011
AVERAGE VIRTUAL PRICE & AVERAGE PROMO PRICE (traffic leaflets) (BAZAR)
AVERAGE PROMO PRICE
AVERAGE VIRTUAL PRICE
CARREFOUR CORA REAL-HYPERMARKET METRO LIDL SELGROS PENNY MARKET KAUFLAND BILLA MEGA IMAGE PROFI CARREFOUR MARKET
93.8
76.2 72.0
37.5 35.8 30.5 28.9 27.9 23.38.4 8.1 7.9
CARREFOUR CORA REAL-HYPERMARKET METRO LIDL SELGROS PENNY MARKET KAUFLAND BILLA MEGA IMAGE PROFI CARREFOUR MARKET
93.9
76.2 72.1
37.6 35.8 30.5 29.1 27.9 23.48.4 8.1 7.9
1,5
6,7 21,3
-62,2 3,2 2,3 4,7 -2,4 8,5
0,0 -1,6 0,3
0,53,9
21,2
-62,33,2 2,3 4,8 -2,4 8,5
0,0 -1,6 0,3

Jan-Sept 2012 vs 2011
AVERAGE VIRTUAL PRICE & AVERAGE PROMO PRICE (traffic leaflets) (TEXTILE)
AVERAGE PROMO PRICE
AVERAGE VIRTUAL PRICE
METR
O
CORA
CARREFO
UR
REAL-H
YPERM
ARKET
PENNY
MAR
KETLI
DL
SELG
ROS
KAUFL
AND
BILLA
MEGA
IMAG
E
PROFI
45.2 42.437.9
32.2 31.526.6
21.9 21.015.2
11.9
METR
O
CORA
CARREFO
UR
REAL-H
YPERM
ARKET
PENNY
MAR
KETLI
DL
SELG
ROS
KAUFL
AND
BILLA
MEGA
IMAG
E
PROFI
45.2 42.438.0
32.6 31.826.6
21.9 21.015.2 11.9
7,85,7
-9,6-3,4 3,4
-3,40,5 -0,8
1,9-6,0
-10,8
7,84,2 -9,8
-3,4 3,6-3,4
0,0 -0,81,6 -6,0
-10,8

Jan-Sept 2012 vs 2011
PROMOReview
Promo Review of food retailers in 20’top
3 – PROMO PRESSURE & SHARE OF VOICE
Jan-Sept 2012 vs 2011

Jan-Sept 2012 vs 2011
PROMO PRESSURE GROWTH* (SNU)Traffic Leaflets
PROMO PRESSURE
FOOD
NON - FOOD
+1.2 %
-4.0 %
HIPERMARKET
SUPERMARKET
CASH&CARRY
HARD DISCOUNT
+1.41%
-5.94%
The Promo Pressure has a positive trend in the Jan-Sept v/s Y-1. We have seen previously that the number of Promo Operation was growing. Taking a look at how retailers behaved in 2012, we see that Hypermarkets and Hard Discounters have a positive trend respect the other formats.
*The Promo Pressure growth is calculated in SNU . A growth < 0 means a mix of less SNU promoted
Growth v/s Y-1
+9.2 %
-6.23%
+10.17%

Jan-Sept 2012 vs 2011
PROMO PRESSURE GROWTH* (SNU) vs AVERAGE NUMBER OF PAGES/PROMO OP
The detailed promo pressure growth by player shows the correlation between number of pages downsize and promo pressure reduction.
*The Promo Pressure growth is calculated in SNU . A growth < 0 means a mix of less SNU promoted
Average number of pages/OP
BILLA
CARREFOUR
CARREFOUR MARKET
CORA
KAUFLAND
LIDL
MEGA IMAGE
METRO
PENNY MARKET
PROFI
REAL-HYPERMARKET
SELGROS
9.24%
20.45%
-5.35%
1.39%
-1.25%
-2.21%
21.31%
-6.55%
-11.28%SELGROS
REAL-HYPERMARKET
METRO
CARREFOUR
LIDL
PENNY MARKET
BILLA
KAUFLAND
PROFI
MEGA IMAGE
CORA
CARREFOUR MARKET
45 pag
31 pag
27 pag
25 pag
18 pag
16 pag
16 pag
13 pag
12 pag
12 pag
10 pag
4 pag
2 pag
-6 pag
2 pag
-1 pag
6 pag
0 pag
2 pag
1 pag
3 pag
1 pag
0 pag
0 pag

Jan-Sept 2012 vs 2011
PROMO PRESSURE GROWTH* (SNU)
*The Promo Pressure growth is calculated in SNU . A growth < 0 means a mix of less SNU promoted
FOOD CATEGORY
PRODUSE AMBALATE CU AUTOSERVIRE
FRUCTE SI LEGUME
CONGELATE
FOOD
DETERGENTI - IGIENA
COSMETICE
PRODUSE VRAC/SERVIRE ASISTATA
NON FOOD CATEGORY
ELECTRO-FOTO-CINEMA-SUNET
BAZAR
TEXTILE
6.50%
-17.53%
35.13%
-29.90%
31.61%
4.55%
-15.64%
14.57%
-11.43%
-27.12%
-9.76%
10.68%

Jan-Sept 2012 vs 2011
PROMO PRESSURE GROWTH* (SNU)
*The Promo Pressure growth is calculated in SNU . A growth < 0 means a mix of less SNU promoted
FOOD CATEGORY
PRODUSE AMBALATE CU AUTOSERVIRE
FRUCTE SI LEGUME
CONGELATE
FOOD
DETERGENTI - IGIENA
COSMETICE
PRODUSE VRAC/SERVIRE ASISTATA
NON FOOD CATEGORY
ELECTRO-FOTO-CINEMA-SUNET
BAZAR
TEXTILE
-0.86%
15.22%
-54.47%
-10.16%
-8.47%
-2.09%
-5.34%
12.10%
1.25%
-7.53%
-2.69%
14.87%

Jan-Sept 2012 vs 2011
PROMO PRESSURE GROWTH* (SNU)
*The Promo Pressure growth is calculated in SNU . A growth < 0 means a mix of less SNU promoted
FOOD CATEGORY
PRODUSE AMBALATE CU AUTOSERVIRE
FRUCTE SI LEGUME
CONGELATE
FOOD
DETERGENTI - IGIENA
COSMETICE
PRODUSE VRAC/SERVIRE ASISTATA
NON FOOD CATEGORY
ELECTRO-FOTO-CINEMA-SUNET
BAZAR
TEXTILE
1.62%
-9.76%
2.48%
-2.23%
11.65%
11.63%
3.41%
-10.40%
-4.71%
-30.17%
5.48%
-16.03%

Jan-Sept 2012 vs 2011
PROMO PRESSURE GROWTH* (SNU)
*The Promo Pressure growth is calculated in SNU . A growth < 0 means a mix of less SNU promoted
FOOD CATEGORY
PRODUSE AMBALATE CU AUTOSERVIRE
FRUCTE SI LEGUME
CONGELATE
FOOD
DETERGENTI - IGIENA
COSMETICE
PRODUSE VRAC/SERVIRE ASISTATA
NON FOOD CATEGORY
ELECTRO-FOTO-CINEMA-SUNET
BAZAR
TEXTILE
-3.55%
-9.77%
1.02%
-7.05%
-7.50%
8.09%
11.98%
-1.46%
5.02%
5.61%
1.42%
9.56%

Jan-Sept 2012 vs 2011
PROMO PRESSURE GROWTH* (SNU)
*The Promo Pressure growth is calculated in SNU . A growth < 0 means a mix of less SNU promoted
FOOD CATEGORY
PRODUSE AMBALATE CU AUTOSERVIRE
FRUCTE SI LEGUME
CONGELATE
FOOD
DETERGENTI - IGIENA
COSMETICE
PRODUSE VRAC/SERVIRE ASISTATA
NON FOOD CATEGORY
ELECTRO-FOTO-CINEMA-SUNET
BAZAR
TEXTILE
1.45%
-7.39%
10.63%
22.71%
-3.28%
37.92%
2.14%
7.98%
-18.25%
-26.43%
-19.00%
1.12%

Jan-Sept 2012 vs 2011
PROMO PRESSURE GROWTH* (SNU)
*The Promo Pressure growth is calculated in SNU . A growth < 0 means a mix of less SNU promoted
FOOD CATEGORY
PRODUSE AMBALATE CU AUTOSERVIRE
FRUCTE SI LEGUME
CONGELATE
FOOD
DETERGENTI - IGIENA
COSMETICE
PRODUSE VRAC/SERVIRE ASISTATA
NON FOOD CATEGORY
ELECTRO-FOTO-CINEMA-SUNET
BAZAR
TEXTILE
4.05%
13.51%
20.29%
144.61%
-5.57%
-29.41%
11.32%
25.88%
-17.54%
0.72%
-21.16%
-16.66%

Jan-Sept 2012 vs 2011
PROMO PRESSURE GROWTH* (SNU)
*The Promo Pressure growth is calculated in SNU . A growth < 0 means a mix of less SNU promoted
FOOD CATEGORY
PRODUSE AMBALATE CU AUTOSERVIRE
FRUCTE SI LEGUME
CONGELATE
FOOD
DETERGENTI - IGIENA
COSMETICE
PRODUSE VRAC/SERVIRE ASISTATA
NON FOOD CATEGORY
ELECTRO-FOTO-CINEMA-SUNET
BAZAR
TEXTILE
0.02%
25.23%
-31.54%
-10.02%
7.28%
-14.71%
-26.46%
-3.65%
-0.53%
0.00%
7.64%
-68.66%

Jan-Sept 2012 vs 2011
PROMO PRESSURE GROWTH* (SNU)
*The Promo Pressure growth is calculated in SNU . A growth < 0 means a mix of less SNU promoted
FOOD CATEGORY
PRODUSE AMBALATE CU AUTOSERVIRE
FRUCTE SI LEGUME
CONGELATE
FOOD
DETERGENTI - IGIENA
COSMETICE
PRODUSE VRAC/SERVIRE ASISTATA
NON FOOD CATEGORY
ELECTRO-FOTO-CINEMA-SUNET
BAZAR
TEXTILE
1.86%
-10.57%
17.32%
-20.27%
-1.87%
-51.59%
-16.47%
71.45%
-88.61%
-77.22%
-92.41%
0.00%

Jan-Sept 2012 vs 2011
PROMO PRESSURE GROWTH* (SNU)
*The Promo Pressure growth is calculated in SNU . A growth < 0 means a mix of less SNU promoted
FOOD CATEGORY
PRODUSE AMBALATE CU AUTOSERVIRE
FRUCTE SI LEGUME
CONGELATE
FOOD
DETERGENTI - IGIENA
COSMETICE
PRODUSE VRAC/SERVIRE ASISTATA
NON FOOD CATEGORY
ELECTRO-FOTO-CINEMA-SUNET
BAZAR
TEXTILE
1.95%
-11.46%
346.30%
21.92%
6.88%
-34.64%
2.29%
111.40%
-1.38%
21.72%
-5.27%
1.54%

Jan-Sept 2012 vs 2011
PROMO PRESSURE GROWTH* (SNU)
*The Promo Pressure growth is calculated in SNU . A growth < 0 means a mix of less SNU promoted
FOOD CATEGORY
PRODUSE AMBALATE CU AUTOSERVIRE
FRUCTE SI LEGUME
CONGELATE
FOOD
DETERGENTI - IGIENA
COSMETICE
PRODUSE VRAC/SERVIRE ASISTATA
NON FOOD CATEGORY
ELECTRO-FOTO-CINEMA-SUNET
BAZAR
TEXTILE
0.98%
-18.94%
9.59%
75.79%
1.24%
23.63%
-10.08%
15.64%
-12.55%
6.46%

Jan-Sept 2012 vs 2011
PROMO PRESSURE GROWTH* (SNU)
*The Promo Pressure growth is calculated in SNU . A growth < 0 means a mix of less SNU promoted
FOOD CATEGORY
PRODUSE AMBALATE CU AUTOSERVIRE
FRUCTE SI LEGUME
CONGELATE
FOOD
DETERGENTI - IGIENA
COSMETICE
PRODUSE VRAC/SERVIRE ASISTATA
NON FOOD CATEGORY
ELECTRO-FOTO-CINEMA-SUNET
BAZAR
TEXTILE
21.52%
-4.24%
46.73%
-1.09%
25.28%
38.60%
43.13%
8.98%
-81.67%
-86.67%
-78.14%
-72.52%

Jan-Sept 2012 vs 2011
PROMO PRESSURE GROWTH* (SNU)
*The Promo Pressure growth is calculated in SNU . A growth < 0 means a mix of less SNU promoted
FOOD CATEGORY
PRODUSE AMBALATE CU AUTOSERVIRE
FRUCTE SI LEGUME
CONGELATE
FOOD
DETERGENTI - IGIENA
COSMETICE
PRODUSE VRAC/SERVIRE ASISTATA
NON FOOD CATEGORY
ELECTRO-FOTO-CINEMA-SUNET
BAZAR
TEXTILE
-1.29%
12.48%
19.85%
-6.93%
0.59%
0.71%
-10.35%
-32.52%
13.74%
49.60%
8.68%
-5.86%

Jan-Sept 2012 vs 2011
SHARE OF VOICE (SNU) Traffic Leaflets
*where Others represents the retailers outside selection with the same chain format as selected.
Others* 10.5%
100% = Total Retailers Jan-Sept 2012
The most important player is Kaufland.
-6.8 pts
11.2%
10.8%
10.7%
10.7%
10.2%
9.0%
7.7%
7.2%
5.0%
4.5%
1.3%
1.1%
0,2 pts
-0,6 pts
-0,8 pts
1,8 pts
-0,1 pts
-1,1 pts
0,7 pts
-0,2 pts
2,6 pts
3,3 pts
0,2 pts
0,8 pts

Jan-Sept 2012 vs 2011
PROMOReview
Promo Review of food retailers in 20’top
4 – PROMO MECHANISMS
Jan-Sept 2012 vs 2011

Jan-Sept 2012 vs 2011
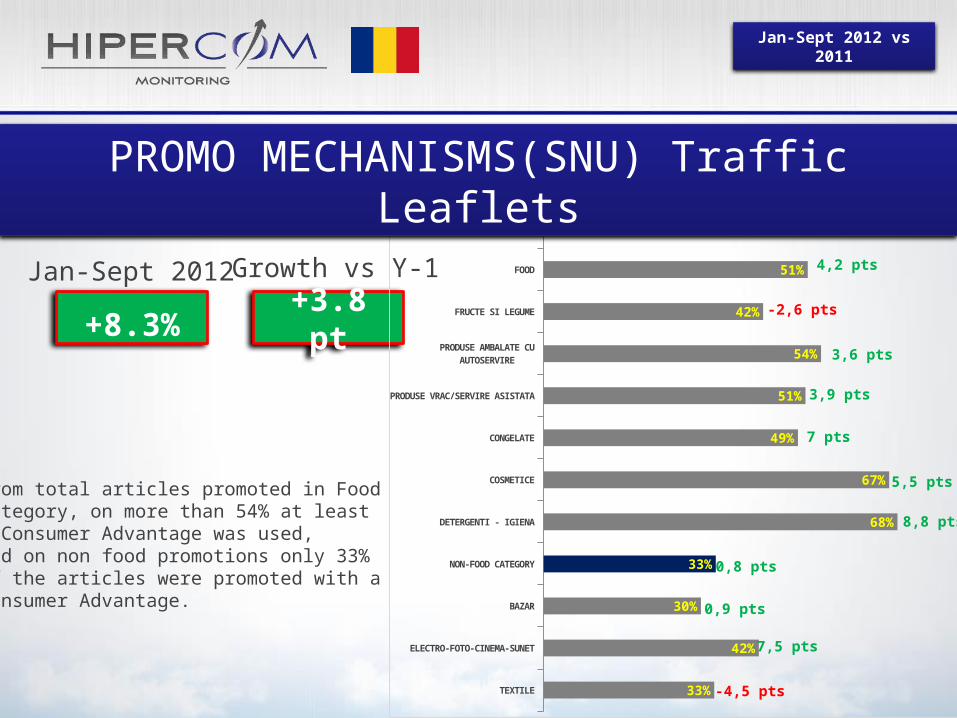
PROMO MECHANISMS(SNU) Traffic LeafletsProducts with consumer benefits by retailer format
Regarding the consumer benefits an important increasing was in CASH AND CARYY with 7 pts in 2012 vs 2011.
CASH AND CARRY HARD DISCOUNT HIPERMARKET SUPERMARKET
34.9%
39.5%
52.4%
48.7%
42.0%44.8%
53.2% 54.2%
2011
2012

Jan-Sept 2012 vs 2011
PROMO MECHANISMS(SNU) Traffic LeafletsProducts with consumer benefits per retailer
HIPERMARKET SUPERMARKET
Analyzing the consumer benefits by retailer, we have a clear picture of the evolution of these. In Hypermarkets Real increased with 6.2 pts, while in Supermarkets Billa is leading, although it has registered a decreased of 9.1pts.
14.66%
34.63%33.19%
17.52%15.79%
28.26%
32.23%
23.72%
2011
2012
88.48%
0.19%3.16%
8.17%
79.33%
0.53%
10.80%9.33%
2011
2012

Jan-Sept 2012 vs 2011
PROMO MECHANISMS(SNU) Traffic LeafletsProducts with consumer benefits per retailer
HARD DISCOUNTCASH&CARRY
In Cash&Carry METRO registered a positive evolution of +8.3 pts vs. previous year.
51.97%
48.03%
60.29%
39.71%
2011
2012
6.53%
93.47%
18.48%
81.52%
2011
2012
Jan-Sept 2012 vs 2011
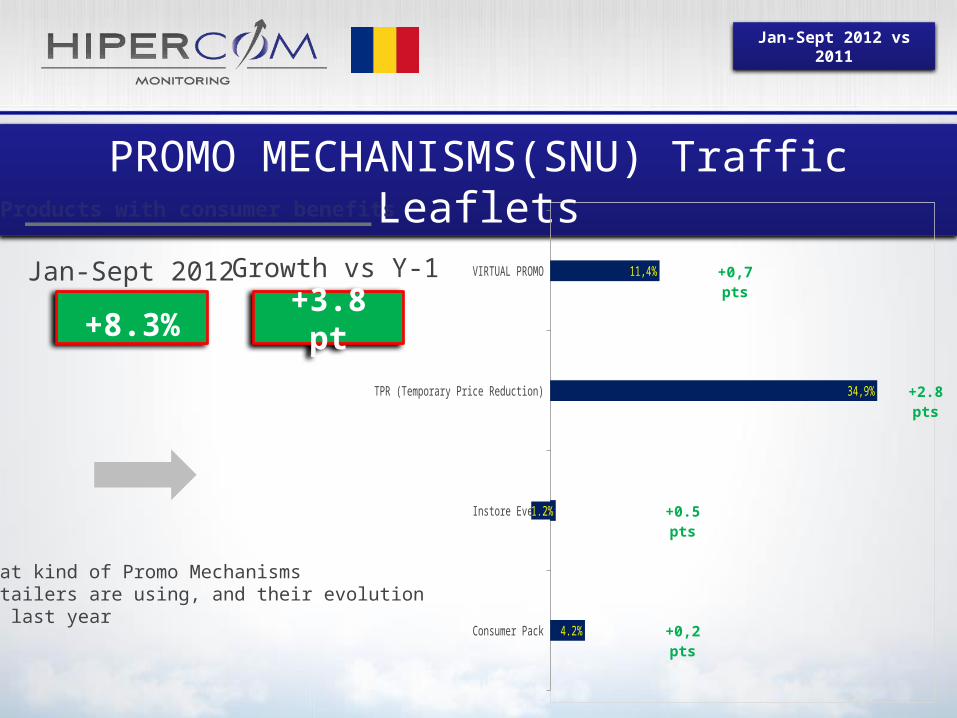
PROMO MECHANISMS(SNU) Traffic Leaflets
+8.3%+3.8
pt
Products with consumer benefits
Jan-Sept 2012 Growth vs Y-1
What kind of Promo MechanismsRetailers are using, and their evolutionVs last year
Consumer Pack
Instore Event
TPR (Temporary Price Reduction)
VIRTUAL PROMO
4.2%
1.2%
34,9%
11,4% +0,7 pts
+2.8 pts
+0.5 pts
+0,2 pts

Jan-Sept 2012 vs 2011
Products with consumer benefits
+8.3%+3.8
pt
Jan-Sept 2012 Growth vs Y-11 + 1 gratis 0,4%
(-0,3 pts)
2 + 1 gratis 1,2%(-0,4 pts)
Other VL 8,4%(1.7 pts)
X% From the 2nd product (Identical or not) 1,5%
(-0,3 pts)
BUYBACK 0,0% (0 pts)
LOTTERY/GAMES 1.2%(0,5 pts)
GIFTS ON PACK 4.2%(0,2 pts)
GRATUITES 3.1%(-2.0 pts)
CROSSED PRICE 2,6%(-0,2 pts)
CUPON 0,0%(-0,1 pts)
LOYALTY POINTS 3.2%(-1,2 pts)
MONEYTICKET 3.0%(0,5 pts)
PRICE DISCOUNT 25.5%(3.6 pts)
SPECIAL PRICE 0,6%(0,3 pts)
Consumer Pack
Instore Event
TPR (Temporary Price Reduction)
VIRTUAL PROMO
4.2%
1.2%
34.9%
11,4% +0,7 pts
+2.8 pts
+0.5 pts
+0,2 pts
PROMO MECHANISMS(SNU) Traffic Leaflets
Jan-Sept 2012 vs 2011
From total articles promoted in Food category, on more than 54% at least 1 Consumer Advantage was used, And on non food promotions only 33% of the articles were promoted with a Consumer Advantage.
+8.3%+3.8
pt
Products with consumer benefits
Jan-Sept 2012 Growth vs Y-1
FOOD CATEGORY
FOOD
FRUCTE SI LEGUME
PRODUSE AMBALATE CU AUTOSERVIRE
PRODUSE VRAC/SERVIRE ASISTATA
CONGELATE
COSMETICE
DETERGENTI - IGIENA
NON-FOOD CATEGORY
BAZAR
ELECTRO-FOTO-CINEMA-SUNET
TEXTILE
54%
51%
42%
54%
51%
49%
67%
68%
33%
30%
42%
33%
4,4 pts
4,2 pts
-2,6 pts
3,6 pts
3,9 pts
7 pts
5,5 pts
8,8 pts
0,8 pts
0,9 pts
7,5 pts
-4,5 pts
PROMO MECHANISMS(SNU) Traffic Leaflets

Jan-Sept 2012 vs 2011
PROMOReview
Promo Review of food retailers in 20’top
3 – QUALITY KPI
Jan-Sept 2012 vs 2011

Jan-Sept 2012 vs 2011
COMPLEXITY INDICATOR
We can easily see that BILLA is using at least 1 Consumer Advantage on 81% of the promoted articles, while Carrefour Market is using Consumer Advantages only on 3.86 % of the promoted articles.
BILLA
KAUFLAND
CORA
PROFI
REAL-HYPERMARKET
METRO
PENNY MARKET
SELGROS
CARREFOUR
MEGA IMAGE
LIDL
CARREFOUR MARKET
81.22%
66.63%
60.34%
55.95%
51.10%
47.83%
47.23%
35.52%
34.11%
17.02%
17.00%
3.86%
-3,15%
-0,88%
-7,58%
5,31%
16,87%
11,77%
6,21%
1,77%
-2,90%
8,14%
-1,08%
-0,76%

Jan-Sept 2012 vs 2011
0 mechanisms 1 mechanisms 2 mechanisms 3 mechanisms
50.40%47.49%
2.06%0.04%
COMPLEXITY INDICATOR
Number of Promo mechanisms / item
(HM,HDD, SM & CC, on Food &Non Food)
The most complex or less complex(classified by the number of products with 2 or more mechanisms)
The indicator of complexity is to indicate the level of complexity of the offers of the retailers. As a retailer will have several mechanisms on a promoted item, it will be poorly ranked.
0.0%
0.2%
0.2%
0.3%
0.7%
1.6%
2.4%
2.8%
3.2%
3.3%
3.9%
7.1%
Jan-Sept 2012 vs 2011
Jan-Sept 2012 vs 2011
PROMOReview
Promo Review of food retailers in 20’top
RETAILERS SUMMARY
Jan-Sept 2012 vs 2011
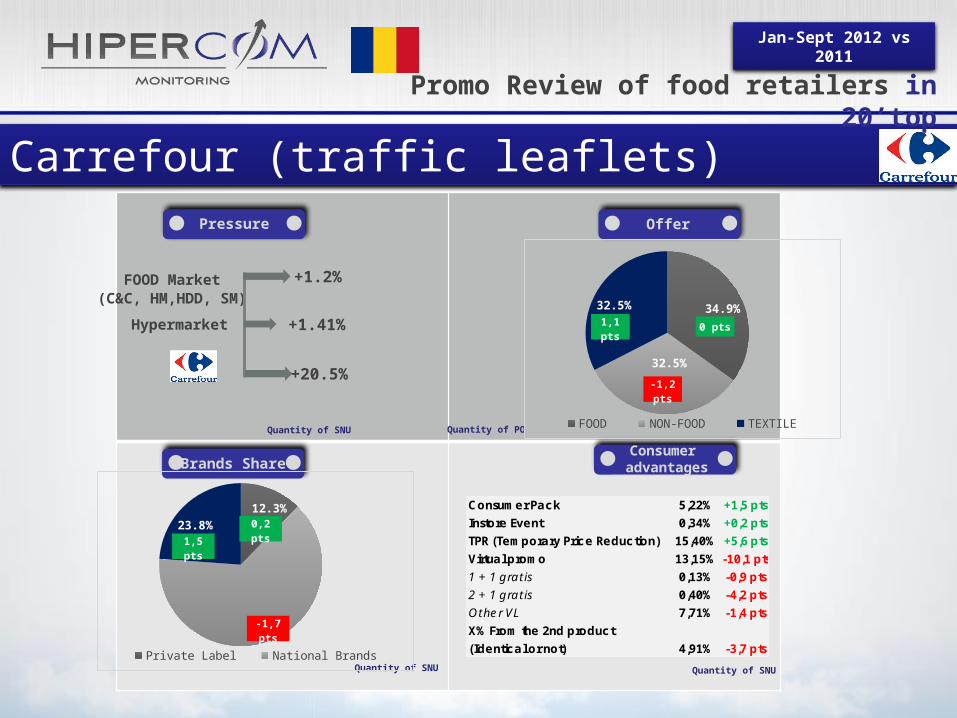
Carrefour (traffic leaflets)Pressure Offer
Consumer advantagesBrands Share
FOOD Market(C&C, HM,HDD, SM)
Hypermarket
Quantity of SNU
Quantity of PO
+1.41%
Quantity of SNU
+20.5%
+1.2%
Quantity of SNU
Promo Review of food retailers in 20’top
12.3%
63.9%
23.8%
Private Label National Brands Unbranded
0,2 pts
-1,7 pts
1,5 pts
34.9%
32.5%
32.5%
FOOD NON-FOOD TEXTILE
Consumer Pack 5,22% +1,5 pts
Instore Event 0,34% +0,2 pts
TPR (Temporary Price Reduction) 15,40% +5,6 pts
Virtual promo 13,15% -10,1 pts
1 + 1 gratis 0,13% -0,9 pts
2 + 1 gratis 0,40% -4,2 pts
Other VL 7,71% -1,4 pts
X% From the 2nd product
(Identical or not) 4,91% -3,7 pts
0 pts
-1,2 pts
1,1 pts

Jan-Sept 2012 vs 2011
Cora (traffic leaflets)Pressure Offer
Brands Share
FOOD Market(C&C, HM,HDD, SM)
Hypermarket
Quantity of SNU
Quantity of PO
+1.41%
Quantity of SNU
-5.4%
+1.2%
Quantity of SNU
Consumer advantages
Promo Review of food retailers in 20’top
12.4%
60.6%
27.0%
Private Label National Brands Unbranded
-0,6 pts
0,9 pts
-0,3 pts
33.3%
33.3%
33.3%
FOOD NON-FOOD TEXTILE
Consumer Pack 1,47% -1,1 pts
Instore Event 0,05% -0,9 pts
TPR (Temporary Price Reduction) 56,60% -5,3 pts
Virtual promo 2,22% -0,3 pts
1 + 1 gratis 0,04% -0,1 pts
2 + 1 gratis 0,08% -0,4 pts
Other VL 0,73% +0,2 pts
X% From the 2nd product
(Identical or not) 1,37% 0 pts
0 pts 0 pts
0 pts

Jan-Sept 2012 vs 2011
Real (traffic leaflets)Pressure Offer
Brands Share
FOOD Market(C&C, HM,HDD, SM)
Hypermarket
Quantity of SNU
Quantity of PO
+1.41%
Quantity of SNU
-6.6%
+1.2%
Quantity of SNU
Consumer advantages
Promo Review of food retailers in 20’top
10.9%
61.0%
28.1%
Private Label National Brands Unbranded
0,6 pts
-0,4 pts
-0,2 pts
33.7%
33.7%
32.6%
FOOD NON-FOOD TEXTILE
Consumer Pack 5,71% +0,4 pts
Instore Event 1,07% +0,2 pts
TPR (Temporary Price Reduction) 38,47% +17,2 pts
Virtual promo 5,85% -0,8 pts
1 + 1 gratis 2,55% 0 pts
2 + 1 gratis 2,36% -0,8 pts
Other VL 0,73% -0,1 pts
X% From the 2nd product
(Identical or not) 0,21% +0 pts
-0,9 pts
-0,9 pts
1,9 pts

Jan-Sept 2012 vs 2011
Kaufland (traffic leaflets)Pressure Offer
Offer/Brands
FOOD Market(C&C, HM,HDD, SM)
Hypermarket
Quantity of SNU
Quantity of PO
+1.41%
Quantity of SNU
+1.4%
+1.2%
Quantity of SNU
Consumer advantages
Promo Review of food retailers in 20’top
15.1%
54.4%
30.5%
Private Label National Brands Unbranded
-1 pts
1,8 pts
-0,8 pts
34.5%
34.5%
31.0%
FOOD NON-FOOD TEXTILE
Consumer Pack 2,07% +1 pts
Instore Event 0,15% 0 pts
TPR (Temporary Price Reduction) 62,83% -3 pts
Virtual promo 1,58% +1,2 pts
1 + 1 gratis 0,19% 0 pts
2 + 1 gratis 0,09% +0 pts
Other VL 1,16% +1,1 pts
X% From the 2nd product
(Identical or not) 0,14% +0,1 pts
0,6 pts
0,6 pts
-1,2 pts

Jan-Sept 2012 vs 2011
Billa (traffic leaflets)Pressure Offer
Brands Share
FOOD Market(C&C, HM,HDD, SM)
Supermarket
Quantity of SNU
Quantity of POQuantity of SNU
-5.94%
+9.2%
+1.2%
Quantity of SNU
Consumer advantages
Promo Review of food retailers in 20’top
8.0%
74.6%
17.4%
Private Label National Brands Unbranded
0,8 pts
1,1 pts
-1,9 pts
40.6%
40.6%
18.8%
FOOD NON-FOOD TEXTILE
0.1 pts
Consumer Pack 2,91% +0,8 pts
Instore Event 0,33% -0,1 pts
TPR (Temporary Price Reduction) 61,37% -5,9 pts
Virtual promo 16,61% +2 pts
1 + 1 gratis 0,17% -1,1 pts
2 + 1 gratis 4,56% +1,7 pts
Other VL 11,29% +2 pts
X% From the 2nd product
(Identical or not) 0,60% -0,6 pts
0.1 pts
-0,3 pts
Jan-Sept 2012 vs 2011
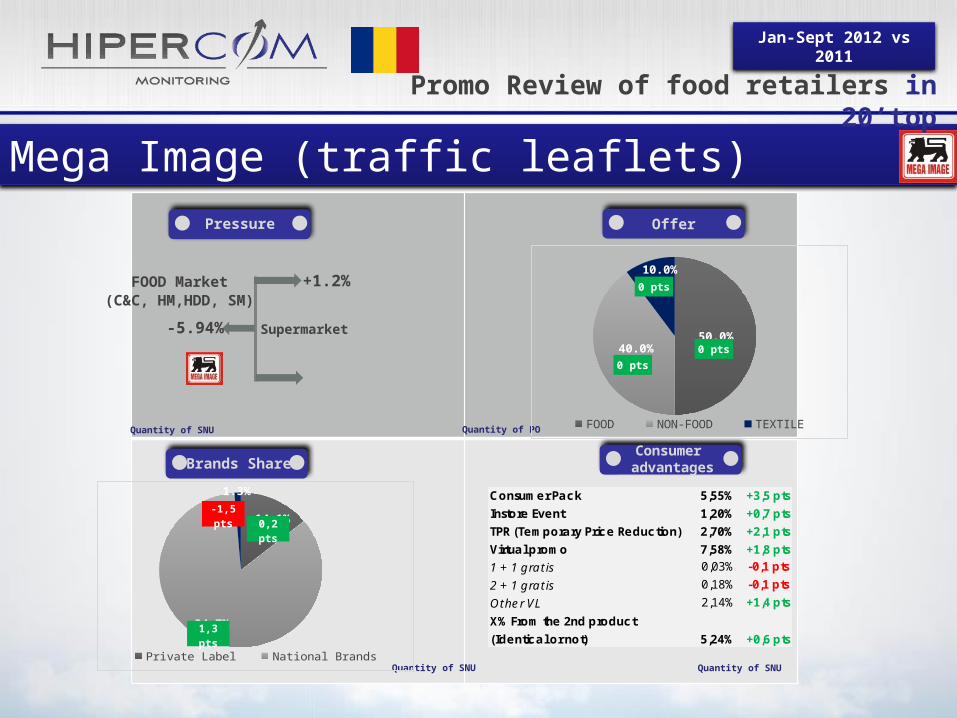
Mega Image (traffic leaflets)Pressure Offer
Brands Share
+3,5pts
Quantity of SNU
Quantity of POQuantity of SNU
Supermarket-5.94%
+1.2%FOOD Market(C&C, HM,HDD, SM)
Quantity of SNU
Consumer advantages
Promo Review of food retailers in 20’top
14.1%
84.7%
1.3%
Private Label National Brands Unbranded
0,2 pts
1,3 pts
-1,5 pts
50.0%40.0%
10.0%
FOOD NON-FOOD TEXTILE
Consumer Pack 5,55% +3,5 pts
Instore Event 1,20% +0,7 pts
TPR (Temporary Price Reduction) 2,70% +2,1 pts
Virtual promo 7,58% +1,8 pts
1 + 1 gratis 0,03% -0,1 pts
2 + 1 gratis 0,18% -0,1 pts
Other VL 2,14% +1,4 pts
X% From the 2nd product
(Identical or not) 5,24% +0,6 pts
0 pts
0 pts
0 pts

Jan-Sept 2012 vs 2011
Carrefour Market(traffic leaflets)Pressure Offer
Brands Share
Quantity of SNU
Quantity of POQuantity of SNU
Supermarket-5.94%
+1.2%FOOD Market(C&C, HM,HDD, SM)
Quantity of SNU
Consumer advantages
Promo Review of food retailers in 20’top
17.3%
67.9%
14.8%
Private Label National Brands Unbranded
-15,5 pts
19,7 pts
-4,1 pts
92.9%
7.1%
FOOD NON-FOOD TEXTILE
Consumer Pack 1,17% -1,4 pts
Instore Event 0,00% +0 pts
TPR (Temporary Price Reduction) 0,47% -1,6 pts
Virtual promo 2,22% +2,2 pts
1 + 1 gratis 0,12% +0,1 pts
2 + 1 gratis 0,00% +0 pts
Other VL 1,29% +1,3 pts
X% From the 2nd product
(Identical or not) 0,82% +0,8 pts
12,9 pts
-12,9 pts
0 pts
Jan-Sept 2012 vs 2011
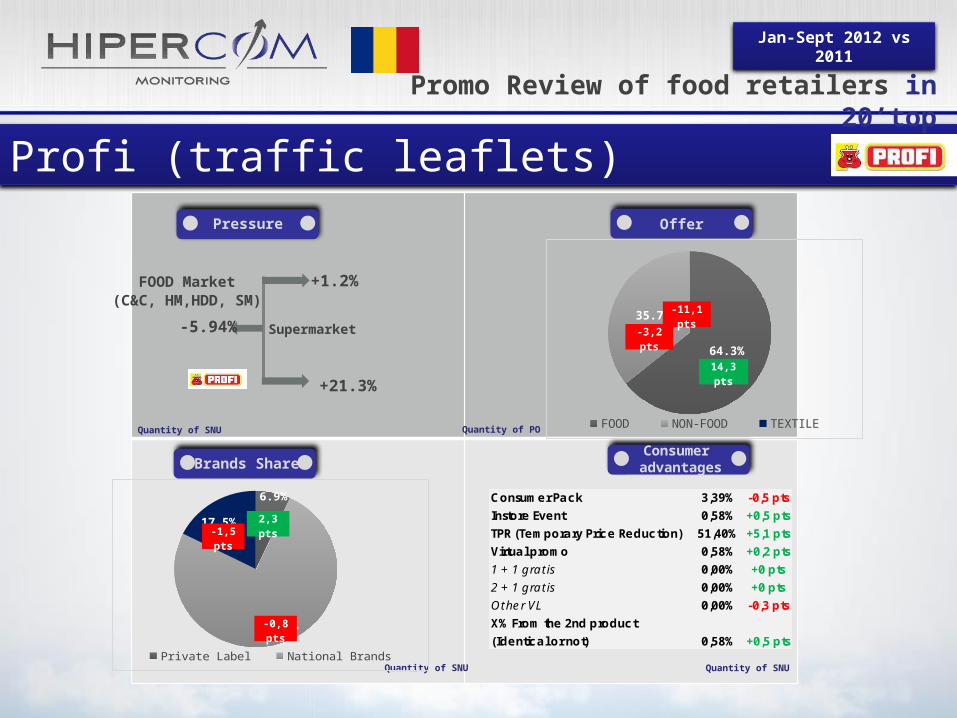
Profi (traffic leaflets)Pressure Offer
Brands Share
-2,8pt
Quantity of SNU
Quantity of POQuantity of SNU
Supermarket-5.94%
+21.3%
+1.2%FOOD Market(C&C, HM,HDD, SM)
Quantity of SNU
Consumer advantages
Promo Review of food retailers in 20’top
6.9%
75.6%
17.5%
Private Label National Brands Unbranded
2,3 pts
-0,8 pts
-1,5 pts
64.3%
35.7%
FOOD NON-FOOD TEXTILE
Consumer Pack 3,39% -0,5 pts
Instore Event 0,58% +0,5 pts
TPR (Temporary Price Reduction) 51,40% +5,1 pts
Virtual promo 0,58% +0,2 pts
1 + 1 gratis 0,00% +0 pts
2 + 1 gratis 0,00% +0 pts
Other VL 0,00% -0,3 pts
X% From the 2nd product
(Identical or not) 0,58% +0,5 pts
14,3 pts
-3,2 pts
-11,1 pts

Jan-Sept 2012 vs 2011
Penny (traffic leaflets)Pressure Offer
Brands Share
Hard Discount
Quantity of SNU
Quantity of POQuantity of SNU
-2.2%
-+10.17%
+1.2%FOOD Market(C&C, HM,HDD, SM)
Quantity of SNU
Consumer advantages
Promo Review of food retailers in 20’top
14.4%
67.6%
17.9%
Private Label National Brands Unbranded
-0,4 pts
4,2 pts
-3,8 pts
37.8%
31.7%
30.5%
FOOD NON-FOOD TEXTILE
Consumer Pack 3,59% +0,7 pts
Instore Event 0,55% +0,5 pts
TPR (Temporary Price Reduction) 39,20% +4,1 pts
Virtual promo 3,89% +0,9 pts
1 + 1 gratis 0,16% 0 pts
2 + 1 gratis 0,23% -0,3 pts
Other VL 1,69% +0,5 pts
X% From the 2nd product
(Identical or not) 1,81% +0,6 pts
0,7 pts
-6,9 pts
6,2 pts

Jan-Sept 2012 vs 2011
Lidl (traffic leaflets)Pressure Offer
Offer/Brands
FOOD Market(C&C, HM,HDD, SM)
Hard Discount
Quantity of SNU
Quantity of POQuantity of SNU
+10.17%
+1.2%
Quantity of SNU
Consumer advantages
Promo Review of food retailers in 20’top
82.7%
6.5%
10.8%
Private Label National Brands Unbranded
-0,2 pts
1,6 pts
-1,4 pts
33.3%
33.3%
33.3%
FOOD NON-FOOD TEXTILE
Consumer Pack 0,14% -0,1 pts
Instore Event 0,00% +0 pts
TPR (Temporary Price Reduction) 16,61% -1,2 pts
Virtual promo 0,25% +0,3 pts
1 + 1 gratis 0,06% +0,1 pts
2 + 1 gratis 0,03% +0 pts
Other VL 0,06% +0,1 pts
X% From the 2nd product
(Identical or not) 0,11% +0,1 pts
0 pts 0 pts
0 pts

Jan-Sept 2012 vs 2011
Metro (traffic leaflets)Pressure Offer
Offer/Brands
FOOD Market(C&C, HM,HDD, SM)
Cash&Carry
Quantity of SNU
Quantity of POQuantity of SNU
-6.23%
-1.2%
+1.2%
Quantity of SNU
Consumer advantages
Promo Review of food retailers in 20’top
16.8%
77.0%
6.2%
Private Label National Brands Unbranded
-1,9 pts
7,4 pts
-5,4 pts
48.6%47.1%
4.3%
FOOD NON-FOOD TEXTILE
Consumer Pack 3,91% +0,6 pts
Instore Event 0,99% +0,8 pts
TPR (Temporary Price Reduction) 2,11% -2,9 pts
Virtual promo 40,81% +13,3 pts
1 + 1 gratis 0,41% -0,1 pts
2 + 1 gratis 2,84% +0,4 pts
Other VL 36,72% +15,2 pts
X% From the 2nd product
(Identical or not) 0,84% -2,1 pts
-2,1 pts2,8
pts
-0,8 pts

Jan-Sept 2012 vs 2011
Selgros (traffic leaflets)Pressure Offer
Share ofBrands
FOOD Market(C&C, HM,HDD, SM)
Cash&Carry
Quantity of SNU
Quantity of POQuantity of SNU
-11.3%
+1.2%
Quantity of SNU
Consumer advantages
Promo Review of food retailers in 20’top
-6.23%
4.3%
90.9%
4.7%
Private Label National Brands Unbranded
-1 pts
0,5 pts
0,4 pts
54.7%30.2%
15.1%
FOOD NON-FOOD TEXTILE
Consumer Pack 5,51% 0 pts
Instore Event 0,86% +0,1 pts
TPR (Temporary Price Reduction) 2,27% +0,8 pts
Virtual promo 26,88% +0,9 pts
1 + 1 gratis 0,24% -0,2 pts
2 + 1 gratis 1,90% +0,2 pts
Other VL 24,57% +0,8 pts
X% From the 2nd product
(Identical or not) 0,17% +0 pts
1,4 pts
-4,8 pts
3,4 pts
Jan-Sept 2012 vs 2011
Thank you for your attention
Florentina VasileProject Manager [email protected]+40 (0) 743 216 282
I remain at your disposal for further information or a life demo
Follow us on social networks for more Markets Intelligence