promoter analysis of co-regulated genes in the yeast …rulai.cshl.edu/reprints/compchem98.pdf ·...
TRANSCRIPT

1
Promoter Analysis of Co-regulated Genes in the Yeast Genome
Michael Q. Zhang
Cold Spring Harbor Laboratory
P.O.Box 100
1 Bungtown Road
Cold Spring Harbor, NY 11724
Tel: (516)367-8393
Fax: (516)367-8461
Email: [email protected]

2
Abstract
The use of high density DNA arrays to monitor gene expression at a genome-wide scale constitutes a
fundamental advance in biology. In particular, the expression pattern of all genes in Saccharomyces
cerevisiae can be interrogated using microarray analysis where cDNAs are hybridized to an array of more
than 6,000 genes in the yeast genome. In an effort to build a comprehensive Yeast Promoter Database and to
develop new computational methods for mapping upstream regulatory elements, we started recently in an on
going collaboration with experimental biologists on analysis of large-scale expression data. It is well-known
that complex gene expression patterns result from dynamic interacting networks of genes in the genetic
regulatory circuitry. Hierarchical and modular organization of regulatory DNA sequence elements are
important information for our understanding of combinatorial control of gene expression. As a
bioinformatics attempt in this new direction, we have done some computational exploration of various initial
experimental data. We will use cell-cycle regulated gene expression as a specific example to demonstrate
how one may extract promoter information computationally from such genome-wide screening. Full report
of the experiments and of the complete analysis will be published elsewhere when all the experiments are to
be finished later in this year (Spellman et al.).
3
INTRODUCTION
Advance of science has always been driven by new experimental technologies. Molecular genetics is no
exception. Cloning, automatic DNA sequencing and PCR (just to mention a few) have revolutionized the molecular
biology field and have also had great impacts on the whole life science and medicine. cDNA microarrays and oligo-
nucleotide chips are the new technologies for complex gene expression monitoring (reviewed, for example, by Stein,
1998). Together with genome sequencing, a new era of functional genomics has just commenced. As computational
biologists working in genome bioinformatics, we are facing a new challenge: “how would we be able to develop
computational tools which would allow us or bench scientists to make efficient use of the new information and to turn
them into new knowledge”? In an effort to build a comprehensive Yeast Promoter Database (SCPD, Zhu and Zhang,
1998) and to develop new computational methods for mapping upstream regulatory elements, we started recently in an
on going collaboration with experimental biologists on analysis of various large-scale expression data. For this special
genome bioinformatics issue, we would like to summarize our initial exploration of such genome expression data
(reported in April, 1998 at a Kyoto theoretical biology conference) and to illustrate what information may be readily
extracted from such experiments. We will use promoter analysis of yeast cell cycle regulated gene expression as an
example. Since this is a collaborative work with many bench scientists and more experiments are still running, full
account of experimental work and complete final data analysis will be published elsewhere later in this year (see
ACKNOWLEGEMENT and Spellman et al.).
Transcriptional controls play a key part in the determination of cell fate during development. It has been
estimated that up to 250 transcripts may be regulated by the cell cycle in budding yeast, Saccharomyces cerevisiae
(Price et al. 1991). It has long been known that protein synthesis in late G1 is needed for S phase entry. There are nine
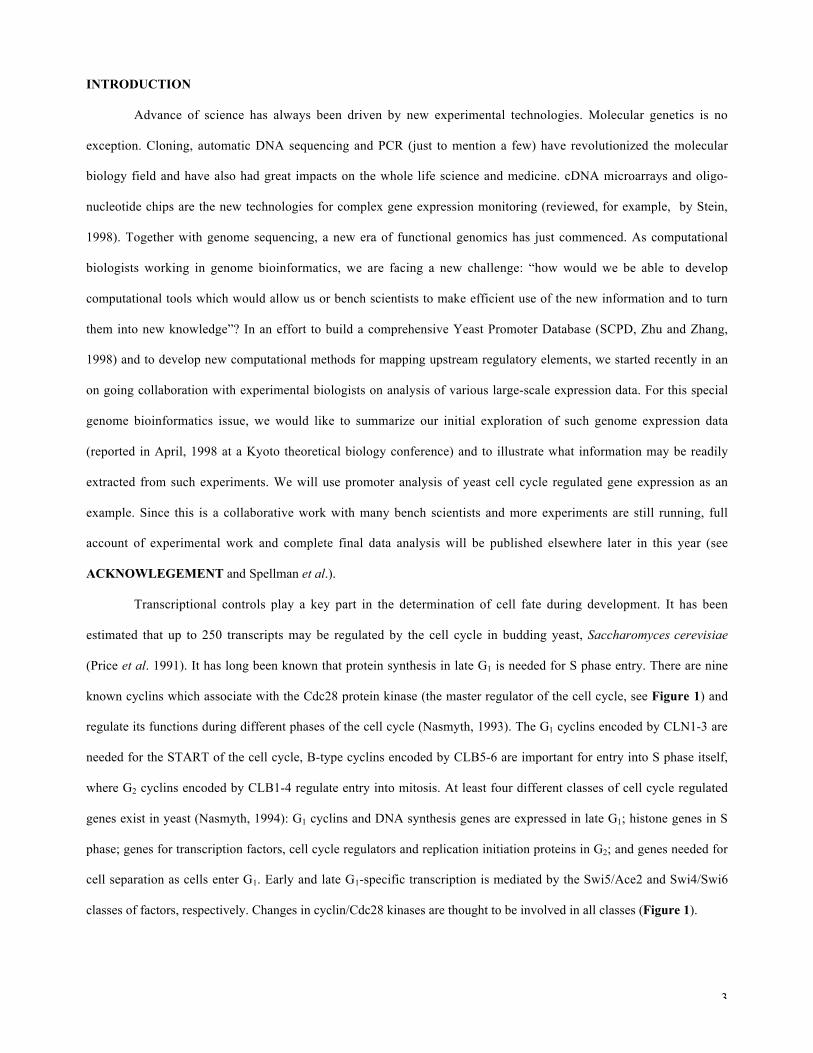
known cyclins which associate with the Cdc28 protein kinase (the master regulator of the cell cycle, see Figure 1) and
regulate its functions during different phases of the cell cycle (Nasmyth, 1993). The G1 cyclins encoded by CLN1-3 are
needed for the START of the cell cycle, B-type cyclins encoded by CLB5-6 are important for entry into S phase itself,
where G2 cyclins encoded by CLB1-4 regulate entry into mitosis. At least four different classes of cell cycle regulated
genes exist in yeast (Nasmyth, 1994): G1 cyclins and DNA synthesis genes are expressed in late G1; histone genes in S
phase; genes for transcription factors, cell cycle regulators and replication initiation proteins in G2; and genes needed for
cell separation as cells enter G1. Early and late G1-specific transcription is mediated by the Swi5/Ace2 and Swi4/Swi6
classes of factors, respectively. Changes in cyclin/Cdc28 kinases are thought to be involved in all classes (Figure 1).

4
Using the cDNA microarray technology (method described, for example, in DeRisi, et al., 1997), mRNA levels
were measured for 95% of all yeast genes during time courses following synchronization by both a factor arrest and
centrifugal elutriation (see METHODS). Figure 2 shows a photo of a cDNA arrayer and Figure 3 shows a typical
fluorescent image of the entire yeast genome expression microarray. In the cell cycle experiments, synchronized cell
transcripts “tagged by red color” and the asynchronous cell transcripts “tagged by green” were mixed with equal amount
and hybridized to the cDNA array. Relative ratio (or actually the log-odd ratio) of red to green intensity were measured
as the relative level of mRNA transcripts after calibration with various controls. The whole time course images of the
spots for each gene (ORF) were digitized as a row of red-green expression pattern (see examples in Figure 4). The
whole set of gene expression patterns, treated as time series, may be clustered according to their similarities. Figure 4
G2Late G1
Cln/Cdc28
Cln3/Cdc28kinase
Cellsize
Clb1-4/Cdc28kinase
MBF SBF
CLN1,2
HO
CLB5,6&
S phaseproteins
Budding
S phase
CLB1,2
SWI5ACE2FAR1?CDC47
CTS1EGT1,2
SIC1PCL9
FAR1?
CLN3SWI4CDC6CDC46
Mitosis
Early G1M/G1
Mcm1/SFF?
ECB?
and
Swi5
Ace2
Nucleus
?
Clb proteolysisIn M phase
Figure 1. A model illustrating regulatory interactions determining cell cycle regulated transcription in yeast (Koch &Nasmyth, 1994; McInerny et al., 1997). Cln3-associated kinase activates late G1 specific transcription factors [SBF(SCB binding factor) and MBF (MCB binding factor)] in a cell size dependent fashion. SBF and MBF mediate theexpression of CLN1,2 and CLB5,6 as well as S phase proteins, leading to budding and S phase entry. By an unknownmechanism, CLN1,2 activity allows accumulation of Clbs. Clb1 and Clb2 activate transcription of G2 specific genesand thereby autoactivate their own synthesis, possibly via the transcription factors Mcm1 and SFF. At the same time,Clb1,2/Cdc28 represses SBF-mediated transcription. While Clb1,2/Cdc28 actives expression of SWI5 and possibly ofACE2 RNAs via Mcm1/SFF, it keeps the gene products in an inactive state by phosphorylation of the nuclear locationsignals. Clb proteolysis at the end of mitosis dramatically changes the situation: Clb-mediated activation of G2 specificgenes is stopped, and Swi5 loses its inhibitory phosphorylations, leading to its uptake into the nucleus where it canactive the early G1 specific transcripts. At late M phase, a Mcm1-related factor binds to ECB (early cell cycle controlbox) and activates M/G1 specific activation of CLN3, SWI4 and some DNA replication genes, these genes productsplay critical roles in promoting the initiation of S-phase.
5
contains two small portions of the cell cycle expression clustering images. The starting point of the bioinformatic
investigation is to collect genes from each such clusters.
DATA AND METHODS
ExperimentsThe full details of experimental protocols will be published in the complete analysis (Spellman et al.). For this
bioinformatic exploration, it may suffice to mention the two synchronization methods: (1)a-factor release: Mat-a cellsarrested in G1 right before the START by a-factors can start cycling after releasing the a-factors. Transcript sampleswere taken at the successive time points as indicated in Figure 4. (2) Elutriation: Small G1 unbudded cells were selectedby differential centrifugation.
DNA sequence data sets
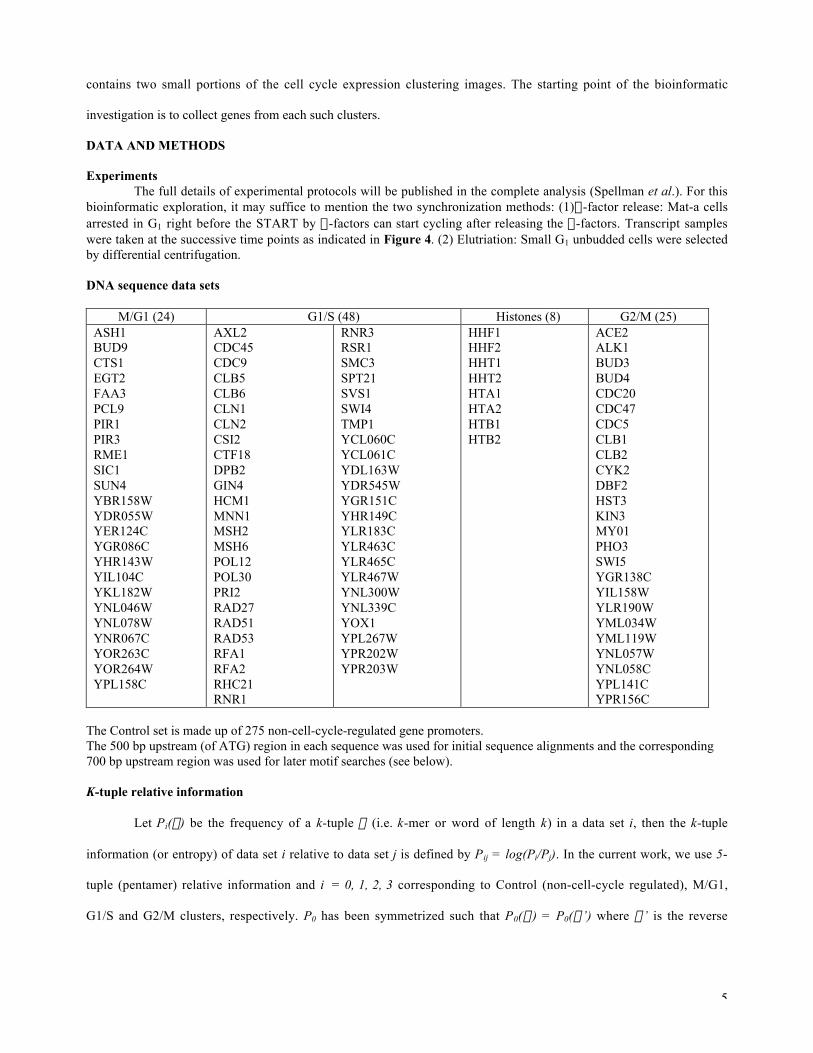
M/G1 (24) G1/S (48) Histones (8) G2/M (25)ASH1BUD9CTS1EGT2FAA3PCL9PIR1PIR3RME1SIC1SUN4YBR158WYDR055WYER124CYGR086CYHR143WYIL104CYKL182WYNL046WYNL078WYNR067CYOR263CYOR264WYPL158C
AXL2CDC45CDC9CLB5CLB6CLN1CLN2CSI2CTF18DPB2GIN4HCM1MNN1MSH2MSH6POL12POL30PRI2RAD27RAD51RAD53RFA1RFA2RHC21RNR1
RNR3RSR1SMC3SPT21SVS1SWI4TMP1YCL060CYCL061CYDL163WYDR545WYGR151CYHR149CYLR183CYLR463CYLR465CYLR467WYNL300WYNL339CYOX1YPL267WYPR202WYPR203W
HHF1HHF2HHT1HHT2HTA1HTA2HTB1HTB2
ACE2ALK1BUD3BUD4CDC20CDC47CDC5CLB1CLB2CYK2DBF2HST3KIN3MY01PHO3SWI5YGR138CYIL158WYLR190WYML034WYML119WYNL057WYNL058CYPL141CYPR156C
The Control set is made up of 275 non-cell-cycle-regulated gene promoters.The 500 bp upstream (of ATG) region in each sequence was used for initial sequence alignments and the corresponding700 bp upstream region was used for later motif searches (see below).
K-tuple relative information
Let Pi(a) be the frequency of a k-tuple a (i.e. k-mer or word of length k) in a data set i, then the k-tuple
information (or entropy) of data set i relative to data set j is defined by Pij = log(Pi/Pj). In the current work, we use 5-
tuple (pentamer) relative information and i = 0, 1, 2, 3 corresponding to Control (non-cell-cycle regulated), M/G1,
G1/S and G2/M clusters, respectively. P0 has been symmetrized such that P0(a) = P0(a’) where a’ is the reverse

6
complement of a. The advantage of using symmetrized control is to be able to see if there is a reverse complement
symmetry for Pi0.
Motif extraction
Two major motif sequence alignment programs: CONSENSUS (Hertz et al. 1990) and GIBBS SAMPLER
(Lawrence et al. 1993; Neuwald et al. 1995) were used originally. Because CONSENSUS produced only very similar
results, GIBBS was not specially designed for DNA, and more importantly the results from both of these programs were
often overwhelmed by poly(A/T) stretches that are known to be ubiquitous promoter elements (see later in text), final
analysis was exclusively done with GibbsDNA (a modified version of GIBBS Motif SAMPLER) which can take into
account DNA structure (such as double strands and palindromes) and constraints (such as including/excluding
subsequences, distances and discrimination of different classes. GibbsDNA is still under development and will be
published with full testing statistics in the future). Different alignment results were manually combined in order to
maximize relative information (see the fore-mentioned references for details). Once alignment is obtained (either by
references or by software), standard consensus or weight matrix may be built and used to search for more potentially
similar motifs (Stormo, 1990). When using weight matrix search, we set cutoff at the maximum level such that all
published motifs should be retained.
RESULTS
A global survey of upstream sequences by pentamer relative information
Given clusters of a large amount of upstream sequences, a quick and effective global-comparison using k-tuple
frequency method is often very informative. One may refer this kind of methods as STS-finger printing in silico. As 5
bp is the half-turn of a DNA helix and is often comparable to the core-size of many promoter elements, in Table 1, we
have compiled two types of pentamer relative information (PRI) Pij (see METHODS) data.
In Table 1a, the pentamer information Pi0 > 0.5 for each phase-cluster (relative to the Control) is shown. The
pentamers are color-coded by the cluster to which the largest information value belongs and a bold-face indicates the
pentamer belonging only to one cluster under the current cut-off (0.5). This shows that: (1) G1/S-promoters contain
most biased pentamers relative to the Control, it has 2 elements with PRI > 2.0 which are most likely related to the
classical MCB (MluI cell cycle box) motif ACGCGT. Other high-scoring pentamers (such as CGAAA:0.733,
CACGA:0.636 and TTTCG:0.515), which may be related to the SCB (Swi4-Swi6 cell cycle box) motif CACGAAA
(MCB and SCB are reviewed, for example, in Andrews & Mason, 1993), are also clearly visible. (2) M/G1-promoters

7
contain second most biased pentamers, among which SWI5 motif GCTGG/CCAGC (1.262/1.071) seem to play a
predominant role (Kovacech et al., 1996; Dohrmann et al., 1996; McBride et al., 1997). GGCCG may be related to
HAP1/CYP1 (Nait-Kaoudjt et al., 1997) and some C-strings may be related to CG-box binding zinc-finger transcription
factors (such as MIG1, see Bohm et al., 1997 for example). (3) G2/M-promoters have the least biased pentamers (none
has PRI > 0.5). Database search of TRANSFAC (Heinemeyer et al., 1998) and SCPD (Zhu & Zhang, 1998) indicated
that many of these pentamers may be related to ubiquitous transcription factors: ABF1, REB1, RAP1 and MCM1. In
vitro DNA binding studies with both cell extracts and recombinant MCM1 proteins suggested that the primary sequence
recognition determinant for MCM1 is the halfsite sequence TCCTAAT (see below, and Bender & Sprangue 1987;
Passmore et al. 1989), which is related to TAGGT:0.716, TTAGG:0.562, TCCTA:0.55 and CTAAT:0.532. On the other
hand, the SFF (see Figure 1) motif GT(C/A)AACAA (Althoefer et al. 1995) is also related to GTAAA:0.593 and
TAAAC:0.571.
It is also very interesting to see relative information changes between every pair of consecutive phase-clusters.
This is shown in Table 1b. It becomes obvious that (1) G1/S-specific transcription burst must be very strong and the
transition must be very sharp, because the PRI of the MCB and SCB like signals is not only high relative to the Control
but also high relative to the earlier or later phases. (2) Many pentamers with high PRI relative to the earlier or later
phases do not score high in PRI relative to the Control. Most remarkably, none of high-scoring (> 1.0) G2/M-pentamers,
relative to G1/S, has a PRI > 0.5 relative to the Control. The fact that CCGGG is on top of both P12 and P32 lists implies
it is very rare in G1/S-promoters. (3) The strong Swi5 effect can also be readily seen from P12 (i.e. M/G1 vs. G1/S)
where most of yellow pentamers are related to Swi5/Ace2 consensus (A/G)CCAGC (see below), indicating a potential
sharp drop of Swi5/Ace2 activated genes in G1. It is known that most Swi5 protein is rapidly degraded upon entry into
the nucleus at M/G1 (Tebb et al. 1991) and the stability of Swi5 in transcription complexes at different M/G1 promoters
might determine the duration of gene expression. EGT2 expression, for example, drops soon after cells enter G1.
Swi5/Ace2 motif is abundant in M/G1-promoters
M/G1 transition is one of the major switches in the yeast cell cycle, it is linked to the destruction of Clbs as
cells exit from mitosis. A number of genes involved in cytokinesis and cell separation are expressed during this period.
Among the 24 genes in the M/G1 cluster, CTS1 encodes chitinase, and the known “early G1 specific” EGT2 may also
have a role in cell separation. The RNA levels of SIC1, encoding an inhibitor of the Cdc28 kinase, are also known to be
maximal in early G1. High levels of Sic1 may be important to prevent premature entry into S phase.

8
It is known early G1 specific transcription of a number of genes is mediated by a pair of related transcription
factors, Swi5 (Nasmyth et al. 1987) and Ace2 (Dohrmann et al. 1992). Some genes, like HO, depend on Swi5, while
others (including CTS1) require Ace2. Others still can be activated by either. EGT2 expression, for example, is mostly
due to Swi5, but can also be mediated by Ace2 (Kovacech et al. 1996). Consistent with such overlapping functions,
Swi5 and Ace2 are 83% identical in their zinc-finger DNA-binding domains (Dohrmann et al. 1992). Differences in
target specificity of Swi5 and Ace2 may be due partly to combinatorial interactions with other factors, such as NCE3 in
CTS1 (Dohrmann et al. 1996) or PHO2 in HO (McBride et al. 1997).
Actually, Swi5-dependent transcription is the only case in which we know how the Cdc28 kinase determines
cell cycle regulated gene expression, but Swi5 binding site (only known in 1 or 2 genes) has not been characterized
experimentally. Phosphorylation of Swi5’s nuclear localization signal by the Cdc28 kinase during G2/M (when Swi5 is
synthesized) prevents entry into the nucleus (Figure 1. and Moll et al. 1991). Ace2 is also only synthesized during
G2/M phases and transported to nuclei as cells enter G1, suggesting that the mechanisms governing Swi5- and Ace2-
dependent transcription may be similar. In the M/G1 promoter analysis, we do not distinguish their binding site
difference and simply call the consensus (A/G)CCAGC Swi5 motif, which really stands for Swi5/Ace2 motif. The
Swi5 motif can be easily found by multiple sequence alignment of upstream 500 bp (of ATG) M/G1 promoter DNA
sequences. As shown in Table 2., 18 out of 24 sequences have this element and many have multiple copies. Genes in
the M/G1 cluster (see METHODS) are shaded in yellow. Genes with published elements are in bold. CTS1 (underlined)
elements were shown to be ACE2 binding sites. Elements found by GibbsDNA are indicated by “*”. The rest was either
found by consensus or matrix search or from publication. “+/-“ refer to forward/backward strand and the coordinates are
relative to the ATG start site. Conserved core is shaded by red and less conserved region by gray. The result is also
consistent with the in silico pentamer STS finger print analysis mentioned above.
It is more instructive to compare Swi5 motif distribution in different clusters (Figure 5a). Here the consensus
(RCCAGC and its reverse complement) was used for the motif search. The upstream sequence region is divided in bins
of 50 bp (“-450” means from “-500” to “-449”, and etc.) and motif count per sequence in each bin is shown as a bar
plot. It may be clearly seen that Swi5 motif is highly enriched in M/G1 and is centered on –300 to –250 region. It is also
highly suppressed even comparing to the Control of non-cell cycle regulated promoters. As another comparison, A- and
T- homo-hexamer distribution is also plotted (in open bars). It is well know that homopolymeric dA:dT sequences are
extremely abundant in most of the yeast promoters. They affect nucleosome formation in vitro and are required for
wild-type levels of transcription in vivo. This ubiquitous promoter element stimulates transcription via its intrinsic DNA
9
structure (Iyer and Struhl, 1995). But they can create a lot of problems in silico during an alignment. In Figure 5a, in
addition to the normal peak around –150 to –100 (‘TATA-box” related region), there also seems to be a second peak
which correlated to the Swi5 peak in the M/G1 cluster. Close examination confirmed (data not shown) that some of the
Swi5 sites were associated with an upstream A-string within one turn of DNA helix pitch distance (or a downstream T-
string of the reverse complement core motif GCTGG).
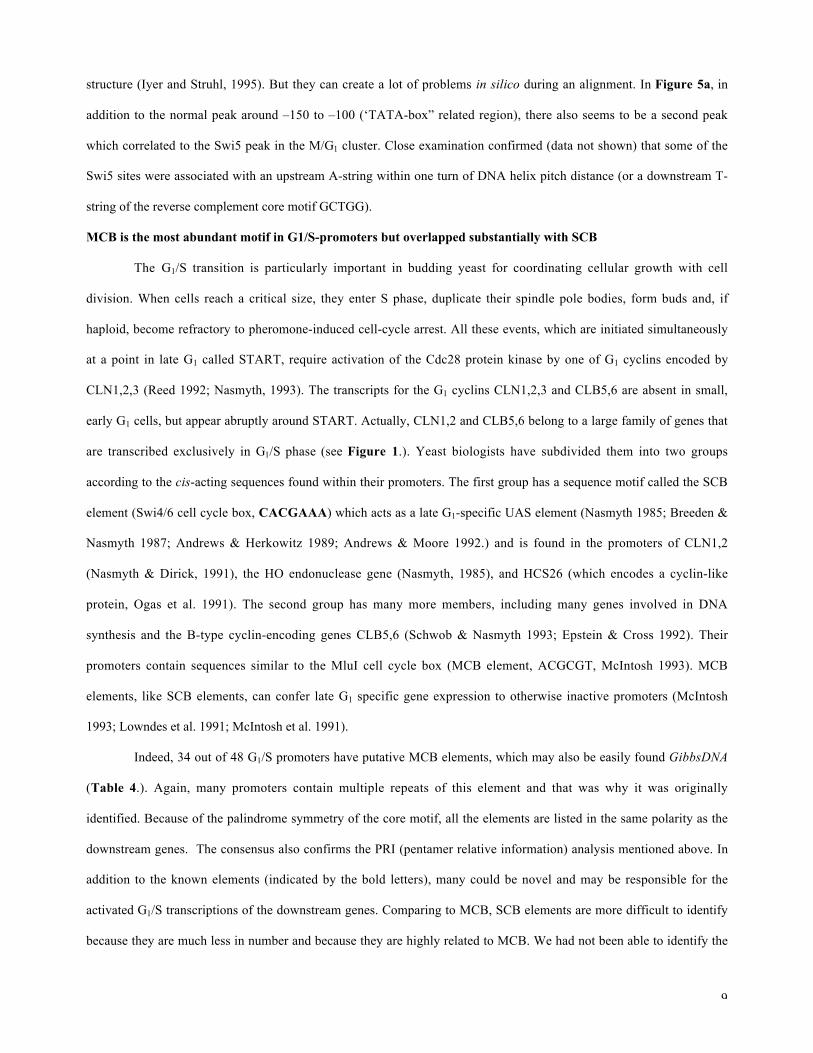
MCB is the most abundant motif in G1/S-promoters but overlapped substantially with SCB
The G1/S transition is particularly important in budding yeast for coordinating cellular growth with cell
division. When cells reach a critical size, they enter S phase, duplicate their spindle pole bodies, form buds and, if
haploid, become refractory to pheromone-induced cell-cycle arrest. All these events, which are initiated simultaneously
at a point in late G1 called START, require activation of the Cdc28 protein kinase by one of G1 cyclins encoded by
CLN1,2,3 (Reed 1992; Nasmyth, 1993). The transcripts for the G1 cyclins CLN1,2,3 and CLB5,6 are absent in small,
early G1 cells, but appear abruptly around START. Actually, CLN1,2 and CLB5,6 belong to a large family of genes that
are transcribed exclusively in G1/S phase (see Figure 1.). Yeast biologists have subdivided them into two groups
according to the cis-acting sequences found within their promoters. The first group has a sequence motif called the SCB
element (Swi4/6 cell cycle box, CACGAAA) which acts as a late G1-specific UAS element (Nasmyth 1985; Breeden &
Nasmyth 1987; Andrews & Herkowitz 1989; Andrews & Moore 1992.) and is found in the promoters of CLN1,2
(Nasmyth & Dirick, 1991), the HO endonuclease gene (Nasmyth, 1985), and HCS26 (which encodes a cyclin-like
protein, Ogas et al. 1991). The second group has many more members, including many genes involved in DNA
synthesis and the B-type cyclin-encoding genes CLB5,6 (Schwob & Nasmyth 1993; Epstein & Cross 1992). Their
promoters contain sequences similar to the MluI cell cycle box (MCB element, ACGCGT, McIntosh 1993). MCB
elements, like SCB elements, can confer late G1 specific gene expression to otherwise inactive promoters (McIntosh
1993; Lowndes et al. 1991; McIntosh et al. 1991).
Indeed, 34 out of 48 G1/S promoters have putative MCB elements, which may also be easily found GibbsDNA
(Table 4.). Again, many promoters contain multiple repeats of this element and that was why it was originally
identified. Because of the palindrome symmetry of the core motif, all the elements are listed in the same polarity as the
downstream genes. The consensus also confirms the PRI (pentamer relative information) analysis mentioned above. In
addition to the known elements (indicated by the bold letters), many could be novel and may be responsible for the
activated G1/S transcriptions of the downstream genes. Comparing to MCB, SCB elements are more difficult to identify
because they are much less in number and because they are highly related to MCB. We had not been able to identify the

10
alignment with ordinary alignment programs (such as CONSENSUS and GIBBS SAMPLER) even if multiple motifs
were requested. It was detected by GibbsDNA after MCB and poly(dA:dT) of length 4 were masked. Up to some
ambiguous elements between MCB and SCB, the alignment results are equivalent to simple consensus string searchs,
which are much more efficient. MCB and SCB distributions in different promoter clusters further confirm their role in
G1/S (Figure 5b). More importantly, excess repeats of MCBs are localized near the upstream of the “TATA-box”
region (-200,-100).
Like Swi5 and Ace2, the sub-units: Mbp1 in MBF and Swi4 in SBF also share similarities both at their amino
termini (Koch et al. 1993), which is the DNA binding domain related to HNF3g/fork head (a member of the family of
“winged” helix-turn-helix proteins, Taylor et al., 1997; Xu et al., 1997), and at their carboxy-terminal regions, which
are necessary for binding to the common factor Swi6 (Sidorova and Breeden, 1993). In contrast to DSC1 in S. pombe,
the only homologue which is structurally similar to SCB but binds to MCB like element, neither SBF nor MBF is
essential for budding yeast. But swi4 mbp1 double mutants arrest in G1 and fail to express CLN1 and CLN2 (Kock et al.
1993). MCB and SCB could be the same genetic element bound by many related transcription factors as it is reported
that yet other factors can active MCB-mediated gene expression in the absence of MBF or SBF (Kock et al. 1993). It is
conceivable that further sub-classification of such motifs may be possible with finer sub-clustering of gene expressions.
More histone UASs are possible
The eight histone genes seem to compose yet another late G1 cluster which has a distinct expression pattern
(see the lower panel in Figure 4 and Table 3). Genetically, it is known that a functional CDC4 gene product is required
to turn on histone transcription (White et al. 1987) and the CDC7 gene product is required to turn off transcription
(Hereford, et al. 1982). Their unique cell cycle regulation indicates their promoter structure may be different from other
G1 specific genes. Detailed genetic analysis has revealed that the histone genes contain consensus TATA-box motifs
and the distal promoter sequences may contain both positive (UAS) and negative (NEG) elements that selectively
regulate transcription (Osley 1991). Two or three copies of a conserved 16 bp sequence (consensus
GCGAAAAANTNNGAAC) are found within four histone loci. Deletion and promoter substitution analyses performed
in vivo with histone-lac-Z reporter genes derived from either the HTA1-HTB1 (encoding H2A-1 and H2B-1) or HHT2-
HHF2 (encoding H3-2 and H4-2) locus have identified this sequence as an upstream activation (UAS) element (Osley et
al. 1986). This element has a S phase-specific function as well because three copies of the repeats can active the
transcription of the normally constitutive CYC1 gene at the G1/S phage boundary (Osley et al., 1986). The negative site
(NEG) has been localized to a 67 bp region in the HTA1-HTB1 promoter that is characterized by several sequence

11
motifs, including direct and inverted repeats, and it contains a 15 bp sequence (consensus TNNACGCTNAANGNC)
also found in HHT1-HHF1 and HHT2-HHF2 promoters, but not in the HTA2-HTB2 promoters (Breeden 1988).
As each pair of divergently transcribed histone genes shares a common promoter, the intergenic region
between each pair of the ATG start sites is shown (and was used for alignment). Mapped TATA-boxes are shown in
red. Mapped negative (NEG) elements and UAS1/UAS2 elements are shown in blue and dark green, respectively
(Osley, 1991). Additional putative UAS elements were found by GibbsDNA. Potential SCBs are also underlined. A
novel repeat element AACAA(not T)A is indicated by a box. Although histone UAS is clearly different from SCB, they
are still somewhat related through CGAAA sequence. It would be interesting to find out if their binding factors could
also be related and if those additional UASs found by computational method are real.
Mcm1 motif only become G2/M specific when associated with a SFF
Finally, G2/M is another important transition during the cell cycle. Several genes are known to be transcribed when cells
enter G2. These include the mitotic cyclins CLB1,2 and the transcription factors SWI5/ACE2 mentioned above (Figure
1). Are G2 specific genes also regulated by a common set of transcription factors? CLB1,2 and SWI5 have been
compared with regard to their dependence on different cell cycle events. These three genes have identical expression
patterns, do not accumulate in cdc34 mutants, and require CLBs 1-4 and CDC28 (Amon et al. 1993) for their
expression, suggesting that they are similarly regulated and activated by Clbs 1-4. SWI5 transcription is known to be
regulated by a UAS sequence that forms a ternary complex with the transcription factor SFF (Lydall et al. 1991) and
Mcm1 (Figure 1 and Treisman and Ammerer 1992). Several potential Mcm1-binding sites are also present in the 5’
flanking regions of CLB2 (Kuo and Grayhack, 1994). MCM1 is not only required for SWI5 transcription but also for
expression of CLB1,2. It is therefore possible that SWI5, CLN1,2 and many other G2-specific transcripts are
coordinately regulated by SFF and Mcm1.
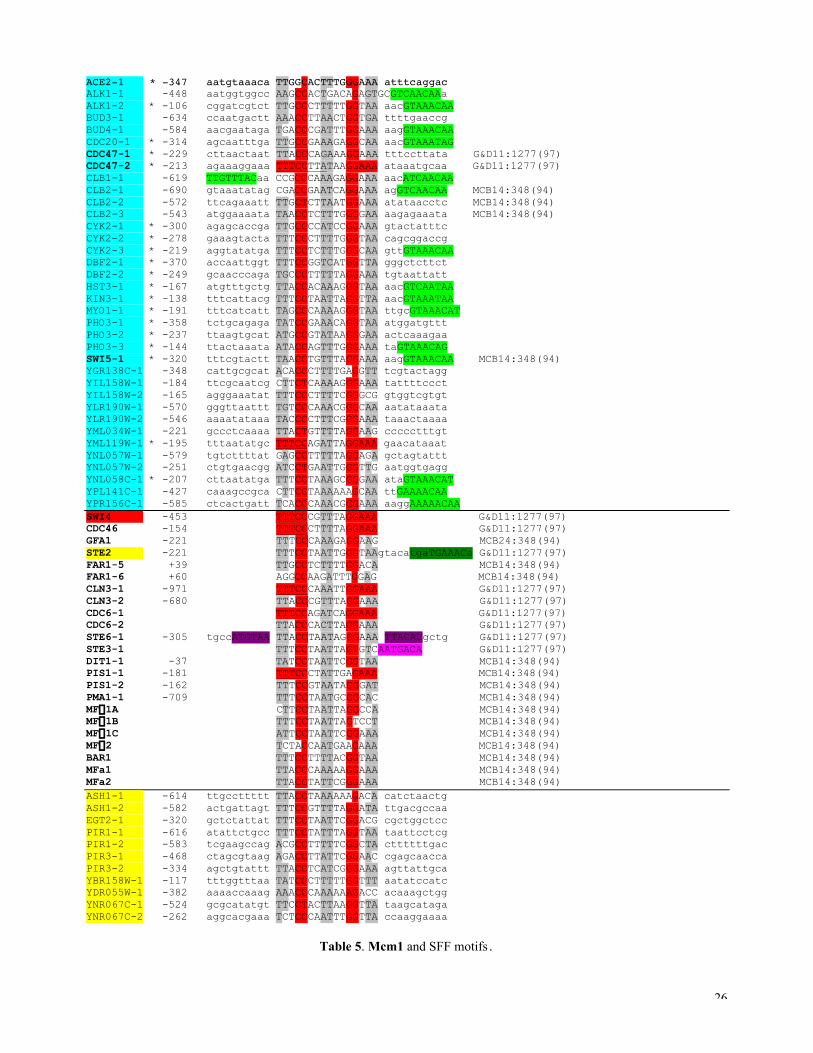
In Table 5, the alignment result for the Mcm1 motif in the G2/M promoters is shown. A larger flanking region
is retained so that other potential factor binding sites may be seen. In vitro selected MCM1 binding site is characterized
by a consensus DCCYWWNNRG (Wynne and Treisman 1992). Because Mcm1 sites are also found in other
promoters, we also did the SFF motif alignment and the potential SFF sites are indicated in green, which has a
consensus GTMAACAW. After examining the distributions of the two motifs in different cluster promoters (Figure
5c), it becomes clear that those Mcm1 sites localized in (-250, -100) are more G2/M specific and that most are also
correlated with the peak of SFF site distribution in this phase. We also found that if one uses a regular expression

12
“CC.{6}GG.{5,10}GTMAACAW” to search all clusters, one could only find the hits in the G2/M cluster (data not
shown).
While Mcm1 also interacts with cell type specific regulators (indicated by purple, pink and dark-green in
Tabel 5, and Treisman & Ammerer 1992), SFF may be specifically involved in the G2-dependent expression. The gene
encoding SFF has not been identified. SFF binding activity is present throughout the cell cycle, and therefore G2-
specific gene expression may be regulated by post-translational changes in Mcm1/SFF activity. Transcription could be
activated by phosphorylation of SFF by Clbs and repressed by their destruction upon exit from mitosis (Koch and
Nasmyth, 1994).
Recently, another Mcm1 related motif called ECB (early cell cycle box, consensus
TTWCCCNNNNAGGAAA) was reported (McInerny et al, 1997) to be important for M/G1-specific transcription of
SWI4, CLN3, CDC6, CDC46 and CDC47. But SWI4 was in our G1/S cluster, CDC47 was in our G2/M cluster, and
CLN3, CDC6 and CDC46 were not in any of our conservatively picked clusters. These genes could have more complex
expression pattern or our initial crude cluster method was not sensitive enough. We did indicate, in Table 5, some of the
potential ECBs by requiring more stringent flanking palindrome (TTTCCNNNNNNGGAAA, in “red”). In our limited
M/G1 genes (indicated in “yellow”), we did not find any ECBs. With better clustering (which we are currently working
on, Spellman et al.), we would be able to address this better1.
COMMENTS
Since this is our first exploratory analysis of gemone-scale gene expression data, we did not seek for an
automatic UAS motif finding algorithm. All the results were obtained by combination of information from various
sources. Although we did start out by using GibbsDNA (sometimes constrained by the k-tuple information) extensively
(normally more than 100 times for each cluster in order to assess the stochastic fluctuation and to try out different
parameters), we then always compare the potential motifs with known experimental results and try to summarize
alignment by simple consensus. We do not believe, at this early stage, one should emphasize on automation. Actually,
one of the important lesson we learned from this initial study is that, motif extraction is often sensitive to clustering, one
needs to improve clustering in order to get more sensible motif and vice versa (Spellman et al.). The real challenge is
how to integrate the two processes. It is possible to use k-tuple based method for automatic motif extraction, this would
only be practical for short and strong motifs and combining top-ranking tuples is still problematic (van Helden et al.
1Indeed, under a rigorous clustering scheme, we were able to identify ECB (with a consensus: TTTCCcaATngGGAAA) in one of three M/G1 sub-clusters (Spellman, et al.) .

13
1998). Even if one automates Gibbs sampling, one may still find many false positives (F. Roth, private communication).
We did also find potential novel motifs (such as AGCSGCT in G1/S and GCSCRGC in M/G1, data not shown, in
addition to Swi5 site which has not been characterized experimentally), we should be cautious as they could also be
false positives as more experiences or information are gained. Very recently, two other similar experimental analyses
were also reported: (1) a cell cycle study, using oligo-nucleotide chips, was carried out (Cho et al, 1998), where about
400 cell cycle regulated genes were identified but the Swi5 site was missed by the promoter analysis; (2) an iterative
Gibbs sampling algorithm, called AlignACE, was applied to find putative motifs in Galactose-response, heat-shock and
mating-switch genome expression data (Roth et al.), where only one time-point was measured for each experiment in
stead of a time-profile which would limit the clustering accuracy. We were actually able to identify 800 cell cycle
regulated genes and more than 20 motifs from 9 sub-clusters (Spellman et al.), a comparison of promoter analyses
among these three experiments will be presented elsewhere (Zhang, submitted).
Traditionally, computational analysis of promoters has been limited by the scarcity of the available
experimental data and by the tedious manual procedure of getting such data from the literature (Fondrat and
Kalogeropoulos, 1996; Zhang, 1998). Large scale genome expressions have opened up a completely new avenue to
unlimited possibilities. Bioinformatics for analysis of such expression data is still in its infancy. There is a vast amount
of such expression data available or soon-to-become-available on the public internet (see, for example,
http://cmgm.stanford.edu/pbrown/). All bioinfromatic specialists are welcome to mine these data. Be aware that the
results may critically depend on the clustering quality. And any result would more likely be of statistical nature, which
cannot be a substitute for conventional single-gene dissections or follow-up experiments. Many fruitful experiments can
and should be designed which are based on the putative predictions made after a genome wide screening. It is very
encouraging that, recently, a novel wave of cyclin synthesis in late mitosis was identified after a putative match of a
Swi5-site in the promoter region (Aerne et al., 1998). This gene is called PCL9 (a homologue of PCL2 and was in our
M/G1 cluster), it is associated with Pho85, is indeed regulated by Swi5 at the predicted sites and is the only cyclin
known to be expressed at M/G1. We hope, by interacting more closely with our experimental colleagues, we shall be
able to develop better and more efficient computational tools. Together, we can advance our knowledge of gene
expression and regulation to unprecedented speed and levels.
ACKNOWLEDGEMENT
This report is a summary of an invited talk given at a Kyoto conference on “Holistic Views of Biology” (sponsored by
Otsuka America Inc.) in April, 1998. It is a bioinformatic illustration on what type of information may be obtained from

14
massive genome expression data. The detailed cell cycle co-regulated gene analysis with additional experiments
(including Cln3/Clb2 inductions) are still currently in progress and the result will be published elsewhere (Spellman et
al.). This initial bioinformatic assessment would not have been possible without the help from our colleagues: G.
Sherlock and B. Futcher at CSHL did most of the yeast biology experiments, P. Spellman, V. Iyer, K. Anders and M.
Eisen at D. Bostein and P. Brown labs in Stanford did arraying, imaging and data clustering. J. Zhu provided our yeast
promoter database (SCPD) support and Z. Ioschikhes helped with GibbsDNA modification. The author would also like
to thank Dr. F. Roth for providing the preprint before publication. The author’s lab is supported by grants from
NIH/NIHGR, Merck genome Research Institute and Cold Spring Harbor Association.
REFERENCE
Aerne, B. L., Johnson, A. J., Toyn, J. H. and Johnston, L. H. (1998) “Swi5 control a novel wave of cyclin synthesis in
late mitosis.” Mol. Biol. Cell 9: 945-956.
Althoefer, H., Schleiffer, A., Wassmann, K., Nordheim, A. and Ammerer, G. (1995) “Mcm1 is required to coordinate
G2-specific transcription in Saccharomyces cerevisiae.” Mol. Cell. Biol. 15: 5917-5928.
Amon, A., Tyers, M., Futcher, B. and Nasmyth, K. (1993) “Mechanisms that help the yeast cell cycle clock tick: G2
cyclins transcriptionally activate G2 cyclins and repress G1 cyclins.” Cell 74: 993-1007.
Andrews, B.J. and Mason, S.W. (1993) “Gene Expression and the Cell Cycle: A Family Affair.” Science 261: 1543-
1544.
Andrews, B. J. and Herskowitz, I. (1989) “ The yeast Swi4 protein contains a motif present in developmental regulators
and is part of a complex involved in cell-cycle-dependent transcription.” Nature 342: 830-833.
Andrews, B. J. and Moore, L. (1992) “Mutational analysis of a DNA sequence involved in linking gene expression to
the cell cycle.” Biochem. Cell Biol. 70: 1073-1080.
Bender, A. and Sprague, G. J. (1987) Cell 50: 681-691.
DeRisi, J. L., Iyer, V. R. and Brown, P. O. (1997) “Exploring the metabolic and genetic control of gene expression on a
genomic scale.” Science 278: 680-686.
Breeden, L. (1988) "Cell cycle-regulated promoters in budding yeast." Trends Genet. 4: 249-253.
Breeden, L. and Nasmyth, K. (1987) “Cell cycle control of the yeast HO gene: cis- and trans-acting regulators.” Cell
48: 389-397.
Bohm, S., Frishman, D., and Mewes, H. W. (1997) “Variations of the C2H2 zinc finger motif in the yeast genome and
classification of yeast zinc finger proteins.” Nucl. Acid. Res. 25: 2464-2469.
15
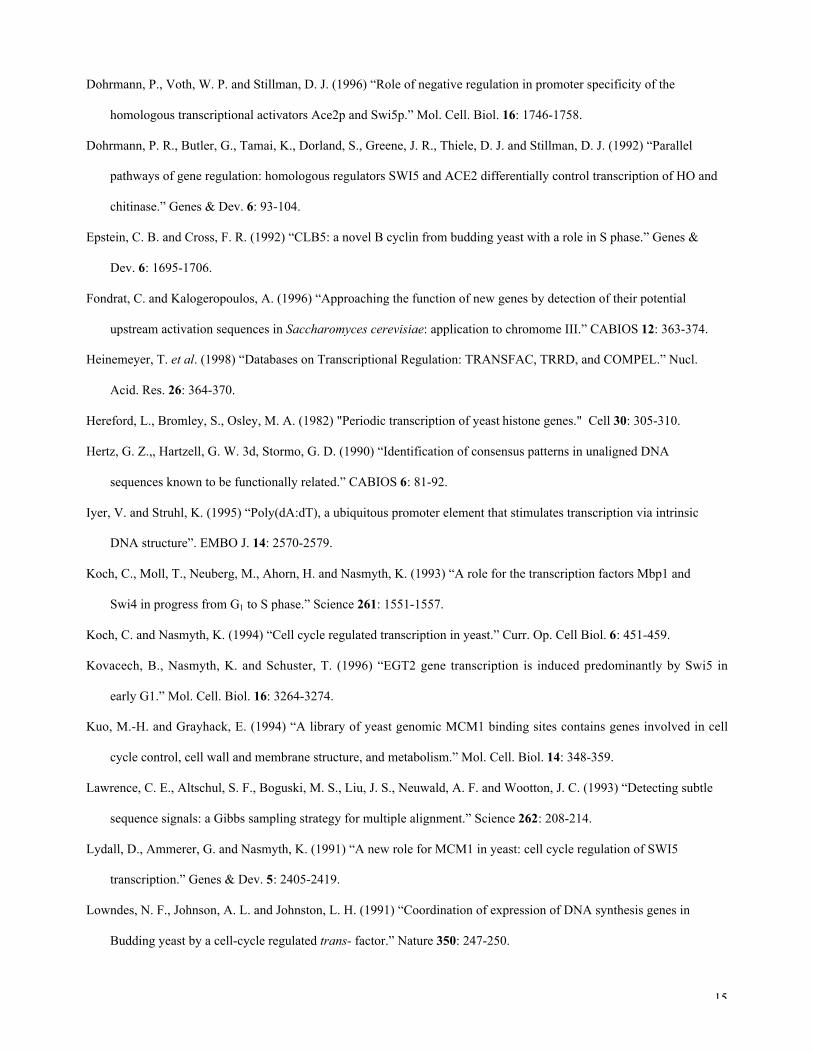
Dohrmann, P., Voth, W. P. and Stillman, D. J. (1996) “Role of negative regulation in promoter specificity of the
homologous transcriptional activators Ace2p and Swi5p.” Mol. Cell. Biol. 16: 1746-1758.
Dohrmann, P. R., Butler, G., Tamai, K., Dorland, S., Greene, J. R., Thiele, D. J. and Stillman, D. J. (1992) “Parallel
pathways of gene regulation: homologous regulators SWI5 and ACE2 differentially control transcription of HO and
chitinase.” Genes & Dev. 6: 93-104.
Epstein, C. B. and Cross, F. R. (1992) “CLB5: a novel B cyclin from budding yeast with a role in S phase.” Genes &
Dev. 6: 1695-1706.
Fondrat, C. and Kalogeropoulos, A. (1996) “Approaching the function of new genes by detection of their potential
upstream activation sequences in Saccharomyces cerevisiae: application to chromome III.” CABIOS 12: 363-374.
Heinemeyer, T. et al. (1998) “Databases on Transcriptional Regulation: TRANSFAC, TRRD, and COMPEL.” Nucl.
Acid. Res. 26: 364-370.
Hereford, L., Bromley, S., Osley, M. A. (1982) "Periodic transcription of yeast histone genes." Cell 30: 305-310.
Hertz, G. Z.,, Hartzell, G. W. 3d, Stormo, G. D. (1990) “Identification of consensus patterns in unaligned DNA
sequences known to be functionally related.” CABIOS 6: 81-92.
Iyer, V. and Struhl, K. (1995) “Poly(dA:dT), a ubiquitous promoter element that stimulates transcription via intrinsic
DNA structure”. EMBO J. 14: 2570-2579.
Koch, C., Moll, T., Neuberg, M., Ahorn, H. and Nasmyth, K. (1993) “A role for the transcription factors Mbp1 and
Swi4 in progress from G1 to S phase.” Science 261: 1551-1557.
Koch, C. and Nasmyth, K. (1994) “Cell cycle regulated transcription in yeast.” Curr. Op. Cell Biol. 6: 451-459.
Kovacech, B., Nasmyth, K. and Schuster, T. (1996) “EGT2 gene transcription is induced predominantly by Swi5 in
early G1.” Mol. Cell. Biol. 16: 3264-3274.
Kuo, M.-H. and Grayhack, E. (1994) “A library of yeast genomic MCM1 binding sites contains genes involved in cell
cycle control, cell wall and membrane structure, and metabolism.” Mol. Cell. Biol. 14: 348-359.
Lawrence, C. E., Altschul, S. F., Boguski, M. S., Liu, J. S., Neuwald, A. F. and Wootton, J. C. (1993) “Detecting subtle
sequence signals: a Gibbs sampling strategy for multiple alignment.” Science 262: 208-214.
Lydall, D., Ammerer, G. and Nasmyth, K. (1991) “A new role for MCM1 in yeast: cell cycle regulation of SWI5
transcription.” Genes & Dev. 5: 2405-2419.
Lowndes, N. F., Johnson, A. L. and Johnston, L. H. (1991) “Coordination of expression of DNA synthesis genes in
Budding yeast by a cell-cycle regulated trans- factor.” Nature 350: 247-250.
16
McBride, H. J., Brazas, R. M., Yu, Y., Nasmyth, K. and Stillman, D. J. (1997) “Long-range interactions at the HO
promoter.” Mol. Cell. Biol. 17: 2669-2678.
McInerny, C. J., Partridge, J. F., Mikesell, G. E., Creemer, D. P. and Breeden, L. (1997) “A novel Mcm1-dependent
element in the SWI4, CLN3, CDC6, and CDC47 promoters activates M/G1-specific transcription.” Genes & Dev.
11: 1277-1288.
McIntosh, E. M. (1993) “MCB elements and the regulation of DNA replication in yeast.” Curr. Genet. 24: 185-192.
McIntosh, E. M., Atkinson, T., Storms, R. K. and Smith, M. (1991) “Characterization of a short, cis-acting DNA
sequence which conveys vell cycle stage-dependent transcription in Saccharomyces cerevisiae."”Mol. Cell. Biol.
11: 329-337.
Moll, T., Tebb, G., Surana, U., Robitsch, H. and Nasmyth, K. (1991) “The role of phosphorylation and the CDC28
protein kinase in cell cycle-regulated nuclear import of the S. cerevisiae transcription factor SWI5.” Cell 66: 743-
758.
Nait-Kaoudjt, R., Williams, R., Guiard, B., and Gervais, M. (1997) “Some DNA targets of the yeast CYP1
transcriptional activator are functionally asymmetric--evidence of two half-sites with different affinities.” Eur. J.
Biochem. 244: 301-309.
Nasmyth, K. (1993) “Control of the yeast cell cycle by the Cdc28 protein kinase.” Curr. Opin. Cell. Biol. 5: 166-179.
Nasmyth, K. (1985) “ A repetitive DNA sequence that confer cell-cycle START (CDC28)-dependent transcription of
the HO gene in yeast.” Cell 1985 42: 225-235.
Nasmyth, K. and Dirick, L. (1991) “ The role of SWI4 and SWI6 in the activity of G1cyclins in yeast.” Cell 66: 995-
1013.
Nasmyth, K., Seddon, A. and Ammerer, G. (1987) “Cell cycle regulation of SWI5 is required for mother-cell-specific
HO transcription in yeast.” Cell 49: 549-558.
Neuwald, A. F., Liu, J. S., and Lawrence, C. E. (1995) “Gibbs motif sampling: detection of bacterial outer membrane
protein repeats.” Protein Sci. 4: 1618-1632.
Ogas, J. Andrews, B. J. and Herkowitz, I. (1991) “Transcriptional activation of CLN1, CLN2, and a putative new G1
cyclin (HCS26) by SWI4, a positive regulator of G1-specific transcription.” Cell 66: 1015-1026.
Osley, M. A. (1991) “The regulation of histone synthesis in the cell cycle.” Annu. Rev. Biochem. 60: 827-861.
Osley, M. A., Gould, J., Kim, S. Y., Kane, M. and Hereford, L. (1986) Cell 45: 537-544.
Passmore, S., Elble, R. and Tye, B. K. (1989) Genes & Dev. 3: 921-935.

17
Price, C. Nasmyth, K. and Schuster, T. (1991) “A general approach to the isolation of cell cycle-regulated genes in the
budding yeast, Saccharomyces cerevisiae.” J. Mol. Biol. 218: 543-556.
Reed, S. I. (1992) “The role of p34 kinases in the G1 to S-phase transition.” Annu. Rev. Cell. Biol. 8: 529-561.
Roth, F.P., Hughes, J.D., Estep, P.W. and Church, G.M. "Finding DNA regulatory motifs within unaligned non-coding
sequences clustered by whole-genome mRNA quantitation", preprint.
Schwob, E. and Nasmyth, K. (1993) “CLB5 and CLB6, a new pair of B cyclins involved in DNA replication in
Saccharomyces cerevisiae.” Genes & Dev. 7: 1160-1175.
Sidorova, J. and Breeden, L. (1993) “Analysis of the SWI4/SWI6 protein complex, which directs G1/S-specific
transcription in Saccharomyces cerevisiae.” Mol. Cell. Biol. 13: 1069-1077.
Spellman, P.T., Sherlock, G., Zhang, M.Q., Iyer, V.R., Anders, K., Eisen, M.B., Brown, P.O., Botstein, D., and Futcher,
B., “Comprehensive identification of cell cycle regulated genes of the yeast Saccharomyces cerevisiae by
microarray hybridization”, in progress.
Stein, L. (1998) “Genetic analysis on DNA microarrays.” Curr. Protocols in Hum. Genet., in press.
Stormo, G. D. (1990) “Consensus patterns in DNA.” Methods Enzymol 183: 211-221.
Taylor, I. A., Treiber, M. K. Olivi, L. and Smerdon, S. J. (1997) “The X-ray structure of the DNA-binding domain from
the Saccharomyces cerevisiae cell-cycle transcription factor Mbp1 at 2.1 Å resolution.” J. Mol. Biol. 272: 1-8.
Tebb, G., Moll, T., Dowzer, C. and Nasmyyth, K. (1993) “SWI5 instability may be necessary but is not sufficient for
asymmetric HO expression in yeast.” Genes & Dev. 7: 517-528.
Treisman, R. and Ammerer, G. (1992) “The SRF and MCM1 transcription factors.” Curr. Opin. Genet. Dev. 2: 221-
226.
Van Helden, J., Andre, B. and Collado-Vides, J. (1998) "Extracting regulatory sites from the upstream region of yeast
genes by computational analysis of oligonucleotide frequencies". J. Mol. Biol. 281:827-842
White, J. H. M., Green, S. R., baker, D. G., Dumas, L. B. and Johnston, L. H. (1987) Exp. Cell. Res. 171: 223-231.
Wynne, J. and treisman, R. (1992) “ SRF and MCM1 have related but distinct DNA binding specificities.” Nucl. Acid.
Res. 20: 3297-3303.
Xu, R.-M., Koch, C., Liu, Y., Horton, J. R., Knapp, D., Nasmyth, K. and Cheng, X. (1997) “Crystal structure of the
DNA-binding domain of Mbp1, a transcription factor important in cell-cycle control of DNA synthesis.” Protein
Structure 5: 349-358.
Zhang, M. Q. (1998) “ Identification of human gene core promoters in silico.” Genome Research 8: 319-326.

18
Zhang, M. Q. "Large scale gene expression data analysis: a new challenge to computational biologists", submitted.
Zhu, J. and Zhang, M. Q. (1998) “A promoter database of yeast Saccharomyces cerevisiae (SCPD)”, presented at The
First International Conference on Bioinformatics of Genome Regulation and Structure, (BGRS'98) Novosibirsk -
Altai mountains, Russia August 24 – 31. To appear in Bioinformatics, (accepted).

19
TABLE CAPTION
Table 1a. Pentamer relative information Pi0 = log( Pi / P0 ) > 0.5, where Pi is the pentamer frequency in ith cluster,with i = 1, 2, 3 corresponding to cluster M/G1 (yellow), G1/S (red), G2/M (blue), respectively and with i = 0corresponding to the control of non-cell-cycle regulated genes. The color is determined by the cluster to which thelargest value belongs and a bold-face indicates the pentamer belonging only to one cluster under the current cut-off(0.5).
Table 1b. Pentamer relative information Pij between consecutive clusters along the cell-cycle. Color and bold-facehave the same meaning as in Table 1a.
Tabel 2. Swi5/Ace2 motif. Genes in the M/G1 cluster (see METHODS) are shaded in yellow. Genes with publishedelements are in bold. CTS1 (underlined) elements were shown to be ACE2 binding sites. Elements found by multi-sequence alignment programs are indicated by “*”. The rest is either found by consensus or matrix search or frompublication. “+/-“ refer to forward/backward strand and the coordinates are relative to the ATG start site. Conservedcore is shaded by red and less conserved region by gray. Reference code in the last column: MBC=Mol. Biol. Cell andMCB=Mol. Cell. Biol.
Tabel 3. Histone motifs. As each pair of divergently transcribed histone genes shares a common promoter, theintergenic region between each pair of the ATG start sites is shown. Mapped TATA-boxes are shown in red. Mappednegative (NEG) elements and UAS1/UAS2 elements are shown in blue and dark green, respectively (Osley, 1991).Additional putative UAS1/UAS2 elements are found by alignment programs. Potential SCBs are underlined. A novelrepeat element AACAA(not T)A is indicated by a box.
Table 4. MCB and SCB motifs. Similar notations (see Table 2.) are used here. The red genes are from the G1/S cluster(see METHODS). Additional reference codes: C=Cell, CG=Curr. Genet., G&D=Genes&Dev., JBC=J. Biol. Chem.,N=Nature and PNAS=Proc. Nat’l. Acad. Sci. USA..
Table 5. Mcm1 and SFF motifs. Similar notations (see Table 2 and 4) and the blue genes are from the G2/M cluster (seeMETHODS). Mcm1 motif is characterized by CCNNWWNNRG. The light-green elements are potential SFF bindingsites. The newly proposed ECB (early cell cycle box: McInerny et al., 1997) TTTCCNNWWNNGGAAA (or anextended Mcm1 box) is also indicated in red. The dark-green is the Ste12 binding site, the purple is the MATa2 bindingsite and the pink is the MATa1 binding site.

20
FIGURE CATION
Figure 1. A model illustrating regulatory interactions determining cell cycle regulated transcription in yeast (Koch &Nasmyth, 1994; McInerny et al., 1997). Cln3-associated kinase activates late G1 specific transcription factors [SBF(SCB binding factor) and MBF (MCB binding factor)] in a cell size dependent fashion. SBF and MBF mediate theexpression of CLN1,2 and CLB5,6 as well as S phase proteins, leading to budding and S phase entry. By an unknownmechanism, CLN1,2 activity allows accumulation of Clbs. Clb1 and Clb2 activate transcription of G2 specific genes andthereby autoactivate their own synthesis, possibly via the transcription factors Mcm1 and SFF. At the same time,Clb1,2/Cdc28 represses SBF-mediated transcription. While Clb1,2/Cdc28 actives expression of SWI5 and possibly ofACE2 RNAs via Mcm1/SFF, it keeps the gene products in an inactive state by phosphorylation of the nuclear locationsignals. Clb proteolysis at the end of mitosis dramatically changes the situation: Clb-mediated activation of G2 specificgenes is stopped, and Swi5 loses its inhibitory phosphorylations, leading to its uptake into the nucleus where it canactive the early G1 specific transcripts. At late M phase, a Mcm1-related factor binds to ECB (early cell cycle controlbox) and activates M/G1 specific activation of CLN3, SWI4 and some DNA replication genes, these genes products playcritical roles in promoting the initiation of S-phase.
Figure 2. Arrayer: The basic system consists of three servo-motor powered linear rail tables (Daedal Series 500000)mounted on an anti-vibration table (Newport) The system is controlled by a Galil DMC-1730 controller card (GalilMotion Control, Sunnyvale CA). The DMC-1730 controller card communicates with the Compumotor amplifiers thatdrive the motors (from Brown’s lab).
Figure 3. Yeast genome microarray which contains 6116 Yeast Genes 96 Intergenic regions + lots of control samples(from Brown’s lab). Hybridization of the Cy3-dUTP-labeled cDNA (that is, mRNA expression in the control sample:the initial time point sample for induction experiment or asynchronous cells for cell cycle experiment) is presented as agreen signal in the fluorescent image, and hybridization of Cy5-dUTP-labeled cDNA (that is, mRNA expression in thetarget samples: the final time point sample for induction experiment or consecutive time point sample of synchronizedcells for cell cycle experiment) is represented as a red signal. Thus, genes activated or repressed after cell cycle releaseappear as red and green spots, respectively. Genes expressed at roughly equal levels in this comparison appear as yellowspots.
Figure 4. M/G1 and Histone clusters (from Brown’s lab). Relative gene expression variation may be monitored bytaking various mRNA samples at consecutive time points of cell cycle after G1 release by either a-factor blocking orelutriation experiments. Whole genome expression patterns, as represented by the digitized spot image variations, areclustered according to the degree of similarity (using, for instance, a peak correlation distance measure). In these twoexamples, a M/G1 cluster (24 genes) and a S-phase cluster (8 histone genes) can be clearly identified.
Figure 5. Comparison of motif distributions in different clusters. The consensus for each indicated motif is used. Theposition relative to ATG start site is marked along x-axis and the motif count per sequence in each cluster is calculatedalong y-axis. (a) Swi5:(A/G)CCAGC and its reverse complement, A6/T6: (A)6 and (T)6; (b) SCB: C(A/G)CGAAA,MCB: ACGCGT; (c) Mcm1: CC(C/T)(A/T)3N2(G/A)G, Sff: GT(C/A)AACA(A/T).

21
P10 > 0.5 (M/G1 vs. Control)
gctgg ggccg ccagc cactc cgcgc catac tggct ccccc cattc ctggc agcgt gtgtc cgtcg 1.262 1.097 1.071 0.880 0.862 0.838 0.830 0.799 0.797 0.771 0.766 0.760 0.754 ggctt tggcc ttcgg tcccc ccgac acact actcc gcgcc cggcg cccct gtgct cagca ggacg 0.750 0.743 0.729 0.720 0.711 0.711 0.710 0.689 0.670 0.654 0.629 0.625 0.619 gcata ttggc ggctg ctccc agggc actac accat ttttt cttgc cgccg ccgcg ggctc ccatt 0.611 0.593 0.573 0.546 0.546 0.546 0.520 0.516 0.516 0.516 0.510 0.506 0.505 tagca 0.501
P20 > 0.5 (G1/S vs. Control)
acgcg cgcgt gacgc gcgtc cgcga tcgcg aacgc ctcga gcgta gtagg gcgtt gcgtg agacg 2.355 2.306 1.389 1.230 1.224 1.185 1.155 0.956 0.930 0.868 0.831 0.775 0.738 cgtgg cgaaa cgacg caacg agcgt tagac acgac cgtag cgtca cctcg taggc aagcg cacga 0.736 0.733 0.730 0.729 0.726 0.714 0.714 0.706 0.701 0.695 0.655 0.647 0.636 gacac ccaac gcgaa cgcgc aaacg gccct gcgac cgaca cagac gtgac acgaa aggtc atcgc 0.633 0.632 0.619 0.615 0.608 0.587 0.579 0.576 0.562 0.537 0.537 0.534 0.521 aggcg tttcg gtcgc 0.520 0.515 0.510
P30 > 0.5 (G2/M vs. Control)
ctagg aggtc cgtgt taggt cctac tgcta gaacg gctac cagag gtggc gtaaa ctact cctag 0.9 0.861 0.796 0.716 0.703 0.655 0.642 0.612 0.603 0.596 0.593 0.587 0.582 tcgtc ggtct taaac ttagg tccta ctaga tagac agtgc catac gctag ctaat ccctc acggg 0.573 0.573 0.571 0.562 0.55 0.55 0.549 0.545 0.542 0.541 0.532 0.515 0.509 gcgag ccaga 0.509 0.501
Table 1a. Pentamer relative information Pi0 = log( Pi / P0 ) > 0.5, where Pi is the pentamer frequency in ith cluster,with i = 1, 2, 3 corresponding to cluster M/G1 (yellow), G1/S (red), G2/M (blue), respectively and with i = 0corresponding to the control of non-cell-cycle regulated genes. The color is determined by the cluster to which thelargest value belongs and a bold-face indicates the pentamer only belonging to one cluster under the current cut-off(0.5).

22
P13 > 1.0 (M/G1 vs. G2/M) gctgg ggccg gctcc cgtcg cgcgc acccg ggctt cccgc atggc gtggg ggacg gcgcg cgcgg 2.48 2.235 2.117 2.117 1.829 1.829 1.696 1.647 1.542 1.424 1.424 1.424 1.424 cgacc ccccg ggctg ccagc aacca gcgtc ctggc ccgac tggct tgggc tgcgc ggccc gcgct 1.424 1.424 1.424 1.373 1.311 1.29 1.29 1.29 1.183 1.136 1.136 1.136 1.136 gacgg gaccc ctatc ccgtg cccgg cagca agctc actgt tggcc ttggc tcccc ccaac gtcac 1.136 1.136 1.136 1.136 1.136 1.136 1.136 1.136 1.067 1.049 1.049 1.049 1.018 gcgcc cagcg gtcgg gggcg gcctg gccgg ctcca ccgtc ccgga ccgcg ccgag cccgt accaa 1.018 1.018
P12 >1.0 (M/G1 vs. G1/S) ccggg ccagc ccccg ctggg gccag ccgag tggct gctgg tcggt gtgct gggat ggctt gcccc 2.039 1.4 1.346 1.241 1.164 1.164 1.105 1.08 1.058 1.058 1.058 1.058 1.058 cactc gcttg 1.058 1.027
P21 > 1.0 (G1/S vs. M/G1) cgcgt acgcg aggcg gacgc gtgta aacgc caccc acgcc cgcga gaacg tcgcg gtggt gaggt 2.748 2.392 2.238 1.775 1.599 1.588 1.544 1.544 1.507 1.487 1.468 1.468 1.427 gcgac gcacc ctgag cctgg aggtg gcgaa gcgtt ggaag gtgcc gatga gatac cgtct agacg 1.362 1.362 1.362 1.362 1.362 1.293 1.264 1.234 1.219 1.219 1.219 1.193 1.18 acaca tcctc ggtga ctgga accac tggaa cctcg agaca aacag ccacc gtgaa ggtct gcgtg 1.18 1.172 1.139 1.139 1.139 1.096 1.082 1.082 1.082 1.052 1.034 1.021 1.021 gatcc ctcag atggg 1.021 1.021 1.021
P23 > 1.0 (G1/S vs. G2/M) acgcg cgcgt gcgtc cgcga tcgcg agacg gtggg gacgc gctcc ggccg cgcgc ccatg ccaac 2.835 2.786 2.059 1.95 1.911 1.911 1.87 1.813 1.687 1.582 1.582 1.582 1.525 gtatc gtagg gcgcg cgtcg cccgg aacgc gctgg gcgct atggc caacg cagac gacgg accgc 1.464 1.464 1.464 1.464 1.464 1.443 1.4 1.331 1.331 1.302 1.282 1.257 1.257 cgcag gcgta cgacc acccg gtcac gcgaa tatgg ggacg gacac accaa cacga 1.231 1.209 1.177 1.177 1.12 1.108 1.09 1.09 1.09 1.059 1.043
P32 > 1.0 (G2/M vs. G1/S) ccggg cgggt gccag accct cgggc gcccc ctcgg 2.225 1.462 1.221 1.154 1.126 1.021 1.021
P31 > 1.0 (G2/M vs. M/G1) gaacg aggcg gtgta gtggt caccc ctgag taggt tgcga gtgcc cctag aggtg agccg acccc 1.977 1.754 1.667 1.572 1.572 1.466 1.409 1.349 1.349 1.349 1.349 1.349 1.349 gtgaa acaca gtagc cgtgt ctaga ggtga ggtct agggt gatcc cgtac aacag ggatg gcgac 1.297 1.284 1.262 1.262 1.186 1.166 1.166 1.141 1.061 1.061 1.061 1.061 1.061 gatga gaggt ccacc acgcc 1.061 1.061 1.061 1.061
Table 1b. Pentamer relative information Pij between consecutive clusters along the cell-cycle. Color and bold-facehave the same meaning as in Table 1a.

23
ASH1-1 * + -466 GAGCCAGCABUD9-1 * + -496 TACCCAGCCBUD9-2 + -171 TCTCCAGCTCTS1-1 - -567 TCACCAGCG MCB17:2669(97)CTS1-2 - -547 GGACCAGCA MCB17:2669(97)CTS1-3 + -528 TAACCAGCC MCB17:2669(97)EGT2-1 * - -386 GAACCAGCA MCB16:3264(96)EGT2-2 * - -335 GAGCCAGCA MCB16:3264(96)EGT2-3 * - -304 GAGCCAGCG MCB16:3264(96)EGT2-4 - -273 TTGTCAGCC MCB16:3264(96)EGT2-5 - -241 GTGTCAGCC MCB16:3264(96)EGT2-6 * - -198 AAACCAGCA MCB16:3264(96)FAA3-1 * + -478 ATACCAGCAPCL9-1 * + -327 AAACCAGCG MBC9:945(98)PCL9-2 + -283 AAACCAGCT MBC9:945(98)PIR1-1 * + -432 CGGCCAGCTPIR1-2 * - -210 ATACCAGCGRME1-1 * + -337 TTACCAGCARME1-2 * - -286 AAGCCAGCASIC1-1 * + -169 TAGCCAGCASIC1-2 * - -144 AAGCCAGCCYBR158W-1 * - -468 ACACCAGCAYDR055W-1 - -362 ATCCCAGCTYDR055W-2 * - -225 AACCCAGCCYER124C-1 * - -447 AGACCAGCCYER124C-2 * + -438 GCGCCAGCAYER124C-3 * + -400 AAACCAGCA
YER124C-4 * - -254 AAACCAGCAYER124C-5 - -199 CACCCAGCTYHR143W-1 * + -423 GAACCAGCAYHR143W-2 * + -264 AAACCAGCAYNL046W-1 * - -410 TACCCAGCCYNL046W-2 * - -151 ACTCCAGCAYNL046W-3 * - -100 GAGCCAGCAYNL078W-1 * - -355 AAACCAGCCYNR067C-1 * - -400 ATGCCAGCAYNR067C-2 * + -285 AAGCCAGCAYNR067C-3 - -194 TACCCAGCTYOR264W-1 * - -415 CGGCCAGCAYOR264W-2 * + -343 AAGCCAGCGYOR264W-3 * + -317 TGACCAGCCYOR264W-4 * + -265 TAACCAGCAYPL158C-1 * - -300 TCGCCAGCCYPL158C-2 * + -275 GCTCCAGCCYPL158C-3 * - -175 AGCCCAGCA------------------------------------------HO-1 - -1818 CTGCCACGC MCB16:3264(96)HO-2 + -1310 AAACCAGCA MCB16:3264(96)SIC1-1 + -169 AAGCCAGCA MBC9:945(98)SIC1-2 - -144 AAGCCAGCC MBC9:945(98)PCL2-1 + -489 ATTCCAGCT MBC9:945(98)PCL2-2 + -449 TGGCCAGCT MBC9:945(98)
Tabel 2. Swi5/Ace2 motif.
>Z48612 between HTB1|spt12/YDR224C c(16802..17197) and HTA1|spt11/YDR225W (18015..18413)(reversed)tttatattttatatgtatgaaatttgtttgttttgaagttgtttattcactgagaaataaccaaatccgtatgatgatgtagtatcaagaagagaagtacagattggaagtaaatagatgatggttcaacaagaccagaaaatctacaagctgattaggagtcttatttatatattttttaggtcaagacttattgctagtatttacgatccactggctggcttcgtgaacggggaagggggtgagaaaagattttgaaatcaacaaagtgggcaataacaaataacagcatgagaaaccacatatctctacgggcgtttcttcaacaacgacgagttaactattgtgctctttttttgagccaccaaatacactccattccaatagcttcgcacagtgaggcgaaaattttggaacagcgctaatgaattatttgtgagctcggcgagttcaaatttgaagaaaacgcggttgggtcgttaactatggttagacgctcaatgtcgcccgaaagggaaggctgttctcactttttcgcgcgttgcaccctttcttccgcgaaaaaatgagaacgatggatttaaaatcaagagaattggccttagtagtggcaaatactaccttggttggttatcttgtaacgattggtaagaaaggggcatctctgttttcttgatgtatataaacaacatgatttgatcatctcagatggtcagatttattaaagacgtttctctttccgcattttcgattattgttatattaaatttatcctatatagacaagtcaaaccacaaataaaccatacacacataca>Z26494 between HTA2/YBL003C c(4120..4518) and HTB2/YBL002W (5218..5613)tatatattaaatttgctcttgttctgtactttcctaattcttatgtaaaaagacaagaatttatgatactatttaataacaaaaaactacctaagaaaagcatcatgcagtcgaaattgaaatcgaaaagtaaaactttaacggaacatgtttgaaattctaagaaagcatacatcttcatcccttatatatagagttatgtttgatattagtagtcatgttgtaatctctggcctaagtatacgtaacgaaaatggtagcacgtcgcgtttatggcccccaggttaatgtgttctctgaaattcgcatcactttgagaaataatgggaacaccttacgcgtgagctgtgcccaccgcttcgcctaataaagcggtgttctcaaaatttctccccgttttcaggatcacgagcgccatctagttctggtaaaatcgcgcttacaagaacaaagaaaagaaacatcgcgtaatgcaacagtgagacacttgccgtcatatataaggttttggatcagtaaccgttatttgagcataacacaggtttttaaatatattattatatatcatggtatatgtgtaaaatttttttgctgactggttttgtttatttatttagctttttaaaaattttactttcttcttgttaattttttctgattgctctatactcaaaccaacaacaacttactctacaacta>chromosomeII between HHF1/YBR009C c(255638..255327) and HHT1|BUR5|SIN2/YBR010W(256285..256695) (reversed)tgtttgcgtttatatatttatgttagatgtttttcttattaactagaaagaaagaatataaaaggttgaggaaagagatgtatcccgaagaatacacagtcttttatatatgtatttcaacaaggagccgtggagggtaccaaaaagaaaaatcgcccgggcatttcgttatcttccacgctaaaagtcaaggagagatattacggccaggatcgcaaaggtgcagagcaaggaaatgtgagaaattgtgagaacgataatgtatgggacaatgcgaaaatgtgagaacgagagcaaaaatcttttttgtatctccccgccgaatttggaaaccgcgttctgaaaacttcgcatcttcacatagtaaaactgttccgagcgcttctccccataatggttagtggtaaaaaccgaagttgtttactttagcaaatgcccgcgaatacggtggtaaattgccacccccccttccccattcattgggtaaagaccaatttgatggataaattggttgtggaaaaggtctaattctttttcctataaataccgagatattttttctatatgatggtttccgtcgcattattgtactctatagtactaaagcaacaaacaaaaacaagcaacaaatataatatagtaaaat>chromosomeXIV between HHT2/YNL031C c(576048..575638) and HHF2/YNL030W (576725..577036)tgtggagtgtttgcttggatcctttagtaaaaggggaagaacagttggaagggccaaagtggaagtcacaaaacagtggtcctatataaaagaacaagaaaaagattatttatatacaactgcggtcacaagaagcaacgcgagagagcacaacacgctgttatcacgcaaactatgttttgacaccgagccatagccgtgattgtgcgtcacattgggcgataatgaacgctaaatgaccaactcccatccgtaggagccccttagggcgtgccaatagtttcacgcgcttaatgcgaagtgctcggaacggacaactgtggtcgtttggcaccgggaaagtggtactagaccgagagtttcgcatttgtatggcaggacgttctgggagcttcgcgtctcaagctttttcgggcgcgaaatgcagaccagaccagaacaaaacaactgacaagaaggcgtttaatttaatatgttgttcactcgcgcctgggctgttgttattcggctagatacatacgtgtttgtgcgtatgtagttatatcatatataagtatattaggatgaggcggtgaaagagattttttttttttcgcttaatttattcttttctctatcttttttcctacatcttgttcaaaagagtagcaaaaacaacaatcaatacaataaaata

24
Tabel 3. Histone motifs.
MCB (Mbp1-Swi6)AXL2-1 * -384 aagACGCGAaaaAXL2-2 * -365 acaACGCGTcatAXL2-3 * -341 aatTCGCGTcacCDC45-1 * -180 acgACGCGTattCDC45-2 * -150 ctaACGCGTtttCDC9-1 * -133 ttaACGCGAaaa N350:247(91)CDC9-2 * -125 aaaACGCGTgaa N350:247(91)CDC9-3 -92 gccATGCGTttg CG21:183(92)CLB5-1 * -389 aagACGCGCcct G&D7:1160(93)CLB6-1 * -403 tttACGCGTacc G&D7:1160(93)CLB6-2 * -377 ccaACGCGTatt G&D7:1160(93)CLN1-1 -606 gagACGCGTtca JBC272:9071CLN1-2 -588 aatTCGCGAttt JBC272:9071CLN1-3 -556 cgaCCGCGTtag JBC272:9071CSI2-1 * -393 tttTCGCGTtttCTF18-1 * -105 cagTCGCGTtgtDPB2-1 * -407 caaACGCGTgttDPB2-2 * -125 gtgACGCGTtatGIN4-1 * -310 gaaACGCGTcaaHCM1-1 * -399 ggaACGCGAaaaHCM1-2 * -380 cagACGCGAgaaHCM1-3 * -367 gcgACGCGAaaaHCM1-4 * -317 ataACGCGTtaaHCM1-5 * -269 aaaACGCGTcctMSH6-1 * -196 taaACGCGTgagMSH6-2 * -176 gatACGCGTctcPOL12-1 * -223 tagACGCGTaatPOL12-2 * -199 gtgACGCGTctcPOL30-1 * -195 gaaACGCGTaac CG21:183(92)PRI2-1 * -165 attACGCGTcgc CG21:183(92)PRI2-2 * -150 gaaTCGCGTaaa CG21:183(92)RAD27-1 * -180 ctaACGCGTttaRAD27-2 * -128 gcgACGCGTaacRAD51-1 * -201 gctACGCGTcatRAD51-2 * -160 agtACGCGTggtRAD53-1 * -285 tggACGCGTtga MCB13:5829(93)RAD53-2 * -260 gtgACGCGTaaaRFA1-1 * -165 gtcACGCGTaaaRFA1-2 * -135 aagACGCGTgaaRFA2-1 * -120 gaaACGCGTtagRFA2-2 * -108 gaaACGCGTtct
RHC21-1 * -372 caaACGCGTttaRHC21-2 * -334 tttTCGCGTttgRHC21-3 * -292 gggACGCGTcgaRHC21-4 * -278 aaaTCGCGTcttRNR1-1 * -492 tttACGCGTtttRNR1-2 * -442 aaaACGCGTaaaRNR1-3 * -371 taaACGCGTcatRNR1-4 * -306 aggACGCGTaaaRNR3-1 -547 cgcACGCGTaaaRNR3-2 * -190 ctgACGCGTttcRSR1-1 * -293 aatTCGCGTcaaRSR1-2 * -258 caaACGCGAaatSMC3-1 * -117 gcgACGCGTtagSPT21-1 * -271 cggTCGCGTtttSPT21-2 * -229 gcgTCGCGTtagSPT21-3 * -234 aaaACGCGTcgcSWI4-1 -508 gtgACGCGTcac MCB13:3792(93)SWI4-2 * -491 atgACGCGAaag MCB13:3792(93)TMP1-1 * -158 gtgACGCGTtaa PNAS88:7155(91)TMP1-2 * -121 ttgACGCGTttc PNAS88:7155(91)YGR151C-1 * -182 cgaTCGCGTtccYLR183C-1 * -228 aaaACGCGAaaaYNL300W-1 * -401 gtgACGCGAaaaYNL339C-1 * -252 ctgACGCGCcatYOX1-1 * -497 aaaACGCGTaaaYOX1-2 * -436 gagACGCGAcgcYOX1-3 * -231 caaACGCGAacaYPL267W-1 * -126 ttgACGCGTctt----------------------------------------------CDC6-1 -216 ACGCGAggc CG21:183(92)CDC6-2 -204 ACGCGTcgg CG21:183(92)CDC8-1 -109 ACGCGTtag CG21:183(92)CDC8-2 -53 ACGCTTcta CG21:183(92)POL1-1 -208 ACGCGTtaa CG21:183(92)POL2-1 -115 ACGCGTaag CG21:183(92)POL3-1 -165 ACGCGTaac CG21:183(92)PRI1-1 -207 ACGTGTgaa CG21:183(92)PRI1-2 -196 ATGCGTgag CG21:183(92)PRI1-3 -63 AAGCGTgcc CG21:183(92)
SCB (Swi4-Swi6)CLN1-1 + -452 aaCTCGAAA JBC272:9071CLN1-2 + -435 gaCTCGAAA JBC272:9071CLN2-1 + -609 atCGCGAAA C66:995(91)CLN2-2 + -584 taCACGAAA C66:995(91)CLN2-3 + -541 gtCACGAAA C66:995(91)DPB2-1 * - -323 ctCGCGAAADPB2-2 * - -115 caCGCGAAAGIN4-1 * + -251 atCGCGAAAHCM1-1 * + -400 aaCGCGAAAHCM1-2 * + -368 gaCGCGAAAMNN1-1 * + -499 atCGCGAAAMSH2-1 * + -151 aaCGCGAAAPOL30-1 * + -203 aaCGCGAAAPRI2-2 * + -364 ttCGCGAAAPRI2-2 * - -377 gcCGCGAAARAD27-1 * + -439 ttCACGAAARHC21-1 * - -336 aaCGCGAAARNR1-1 * - -242 aaCACGAAARNR3-1 * - -327 acCACGAAARNR3-2 * - -175 gaCACGAAA
RNR3-3 * - -150 aaCACGAAARSR1-1 * + -259 aaCGCGAAASPT21-1 * - -261 atCACGAAASVS1-1 * - -229 aaCACGAAASVS1-2 * - -211 aaCACGAAASWI4-1 * + -492 gaCGCGAAAYHR149C-1 * - -289 ttCGCGAAAYLR183C-1 * + -229 aaCGCGAAAYLR183C-2 * - -173 aaCACGAAAYNL300W-1 * + -432 gtCACGAAAYNL300W-2 * + -346 gaCACGAAAYNL300W-3 * + -346 gaCACGAAAYPL267W-1 * - -143 taCGCGAAAYPR203W-1 * + -41 gtCACGAAA----------------------------------------------HO-1 + -600 gtCACGAAA MCB13:1069(93)HO-2 + -466 ttCACGAAA N342:830(89)HO-3 + -439 tcCACGAAA N342:830(89)HCS26-1 - -327 aaCACGAAA C66:1015(91)

25
Table 4. MCB and SCB motifs.
26
ACE2-1 * -347 aatgtaaaca TTGGCACTTTGGGAAA atttcaggacALK1-1 -448 aatggtggcc AAGCCACTGACAGAGTGCGTCAACAAaALK1-2 * -106 cggatcgtct TTGCCCTTTTTGGTAA aacGTAAACAABUD3-1 -634 ccaatgactt AAACCTTAACTGGTGA ttttgaaccgBUD4-1 -584 aacgaataga TGACCCGATTTGGAAA aagGTAAACAACDC20-1 * -314 agcaatttga TTGCCGAAAGAGGCAA aacGTAAATAGCDC47-1 * -229 cttaactaat TTACCCAGAAAGGAAA tttccttata G&D11:1277(97)CDC47-2 * -213 agaaaggaaa TTTCCTTATAAGGAAA ataaatgcaa G&D11:1277(97)CLB1-1 -619 TTGTTTACaa CCGCCCAAAGAGGAAA aacATCAACAACLB2-1 -690 gtaaatatag CGACCGAATCAGGAAA agGTCAACAA MCB14:348(94)CLB2-2 -572 ttcagaaatt TTGCTCTTAATGGAAA atataacctc MCB14:348(94)CLB2-3 -543 atggaaaata TAACCTCTTTGGGGAA aagagaaata MCB14:348(94)CYK2-1 * -300 agagcaccga TTGCCCCATCCGGAAA gtactatttcCYK2-2 * -278 gaaagtacta TTTCCCTTTTGGGTAA cagcggaccgCYK2-3 * -219 aggtatatga TTTCCTCTTTGGGCAA gttGTAAACAADBF2-1 * -370 accaattggt TTTCCGGTCATGGTTA gggctcttctDBF2-2 * -249 gcaacccaga TGCCCTTTTTAGGAAA tgtaattattHST3-1 * -167 atgtttgctg TTACCACAAAGGGTAA aacGTCAATAAKIN3-1 * -138 tttcattacg TTTCCTAATTAGGTTA aacGTAAATAAMYO1-1 * -191 tttcatcatt TAGCCCAAAAGGGTAA ttgcGTAAACATPHO3-1 * -358 tctgcagaga TATCCGAAACAGGTAA atggatgtttPHO3-2 * -237 ttaagtgcat ATGCCGTATAAGGGAA actcaaagaaPHO3-3 * -144 ttactaaata ATACCAGTTTGGGAAA taGTAAACAGSWI5-1 * -320 tttcgtactt TAACCTGTTTAGGAAA aagGTAAACAA MCB14:348(94)YGR138C-1 -348 cattgcgcat ACACCCTTTTGAGGTT tcgtactaggYIL158W-1 -184 ttcgcaatcg CTTCTCAAAAGGGAAA tattttccctYIL158W-2 -165 agggaaatat TTTCCCTTTTCGGGCG gtggtcgtgtYLR190W-1 -570 gggttaattt TGTCCCAAACGGGCAA aatataaataYLR190W-2 -546 aaaatataaa TACCCCTTTCGGGAAA taaactaaaaYML034W-1 -221 gccctcaaaa TTACTGTTTTAGGAAG ccccctttgtYML119W-1 * -195 tttaatatgc TTTCCAGATTAGGAAA gaacataaatYNL057W-1 -579 tgtcttttat GAGCCTTTTTAGGAGA gctagtatttYNL057W-2 -251 ctgtgaacgg ATCCTGAATTGGGTTG aatggtgaggYNL058C-1 * -207 cttaatatga TTTCCTAAAGCGGGAA ataGTAAACATYPL141C-1 -427 caaagccgca CTTCCTAAAAAAGCAA ttGAAAACAAYPR156C-1 -585 ctcactgatt TCACCCAAACGGGAAA aaggAAAAACAASWI4 -453 TTTCCCGTTTAGGAAA G&D11:1277(97)CDC46 -154 TTTCCCTTTTAGGAAA G&D11:1277(97)GFA1 -221 TTTCCCAAAGAGGAAG MCB24:348(94)STE2 -221 TTTCCTAATTGGGTAAgtacatgaTGAAACa G&D11:1277(97)FAR1-5 +39 TTGCCTCTTTTGGACA MCB14:348(94)FAR1-6 +60 AGGCCAAGATTTGGAG MCB14:348(94)CLN3-1 -971 TTTCCCAAATTGGAAA G&D11:1277(97)CLN3-2 -680 TTACCCGTTTAGGAAA G&D11:1277(97)CDC6-1 TTTCCAGATCAGGAAA G&D11:1277(97)CDC6-2 TTACCCACTTAGGAAA G&D11:1277(97)STE6-1 -305 tgccATGTAA TTACCTAATAGGGAAA TTACACgctg G&D11:1277(97)STE3-1 TTTCCTAATTAGTGTCAATGACA G&D11:1277(97)DIT1-1 -37 TATCCTAATTCGGTAA MCB14:348(94)PIS1-1 -181 TTTCCCTATTGAGAAA MCB14:348(94)PIS1-2 -162 TTTCCGTAATAGGGAT MCB14:348(94)PMA1-1 -709 TTTCCTAATGCGGCAC MCB14:348(94)MFa1A CTTCCTAATTAGGCCA MCB14:348(94)MFa1B TTTCCTAATTAGTCCT MCB14:348(94)MFa1C ATTCCTAATTCGGAAA MCB14:348(94)MFa2 TCTACCAATGAAGAAA MCB14:348(94)BAR1 TTTCCTTTTACGGTAA MCB14:348(94)MFa1 TTACCCAAAAAGGAAA MCB14:348(94)MFa2 TTACCTATTCGGGAAA MCB14:348(94)ASH1-1 -614 ttgccttttt TTACCTAAAAAAGACA catctaactgASH1-2 -582 actgattagt TTTCCGTTTTAGGATA ttgacgccaaEGT2-1 -320 gctctattat TTTCCTAATTCGGACG cgctggctccPIR1-1 -616 atattctgcc TTTCCTATTTAGGTAA taattcctcgPIR1-2 -583 tcgaagccag ACGCCTTTTTCGGCTA cttttttgacPIR3-1 -468 ctagcgtaag AGACCTTATTCGGAAC cgagcaaccaPIR3-2 -334 agctgtattt TTACCTCATCGGGAAA agttattgcaYBR158W-1 -117 tttggtttaa TATCCCTTTTTGGTTT aatatccatcYDR055W-1 -382 aaaaccaaag AAACCCAAAAAAGACC acaaagctggYNR067C-1 -524 gcgcatatgt TTCCTACTTAAGGTTA taagcatagaYNR067C-2 -262 aggcacgaaa TCTCCCAATTTGGTTA ccaaggaaaa
Table 5. Mcm1 and SFF motifs.

27
Figure 2. Arrayer: The basic system consists of three servo-motor powered linear rail tables (Daedal Series 500000)mounted on an anti-vibration table. (Newport) The system is controlled by a Galil DMC-1730 controller card (GalilMotion Control, Sunnyvale CA). The DMC-1730 controller card communicates with the Compumotor amplifiers thatdrive the motors (from Brown’s lab).
Figure 3. Yeast genome chip which contains 6116 Yeast Genes 96 Intergenic regions + lots of control samples (fromBrown’s lab).

28
G1 S G2 M G1 S G2 G1 S G2 M G1
His
tone
s
M/G
1
Figure 4. M/G1 and Histone clusters (from Brown’s lab). Relative gene expression variation may be monitoredby taking various mRNA samples at consecutive time points of cell cycle after G1 release by either a-factorblocking or elutriation experiments. Whole genome expression patterns, as represented by the digitized spotimage variations, are clustered according to the degree of similarity (using, for instance, an Euclidean distancemeasure). In these two examples, a M/G1 cluster (24 genes) and a S-phase cluster (8 histone genes) can beclearly identified.

29
(a) (b)
(c)
Figure 5. Comparison of motif distributions in different clusters. The consensus for each indicated motif isused. The position relative to ATG start site is marked along x-axis and the motif count per sequence in eachcluster is calculated along y-axis. (a) Swi5:(A/G)CCAGC and its reverse complement, A6/T6: (A)6 and (T)6;(b) SCB: C(A/G)CGAAA, MCB: ACGCGT; (c) Mcm1: CC(C/T)(A/T)3N2(G/A)G, Sff: GT(C/A)AACA(A/T).