promoter scanning/analysis tool. goal creating a tool to analyse a set of putative promoter...
Post on 19-Dec-2015
215 views
TRANSCRIPT

PROMoter SCanning/ANalysis tool
Goal
Creating a tool to analyse a set of putative promoter sequences and recognize known and unknown promoters, with built-in scoring system

Sequences to be PromScAnned
• Sequences from Sergei Denissov, Molecular Biology (NCMLS)
• Obtained from the cloning of chromatin (U2-OS human cells) highly enriched through double immunoprecipitation with anti-TBP antibodies

Main database: BLAT
• BLAT: BLAST-Like Alignment Tool• Aligns the input sequence to the Human
Genome• Connected to several databases, like:
– mRNAs - GenScan– ESTs - TwinScan– RepeatMasker - UniGene– RefSeq - CpG Islands
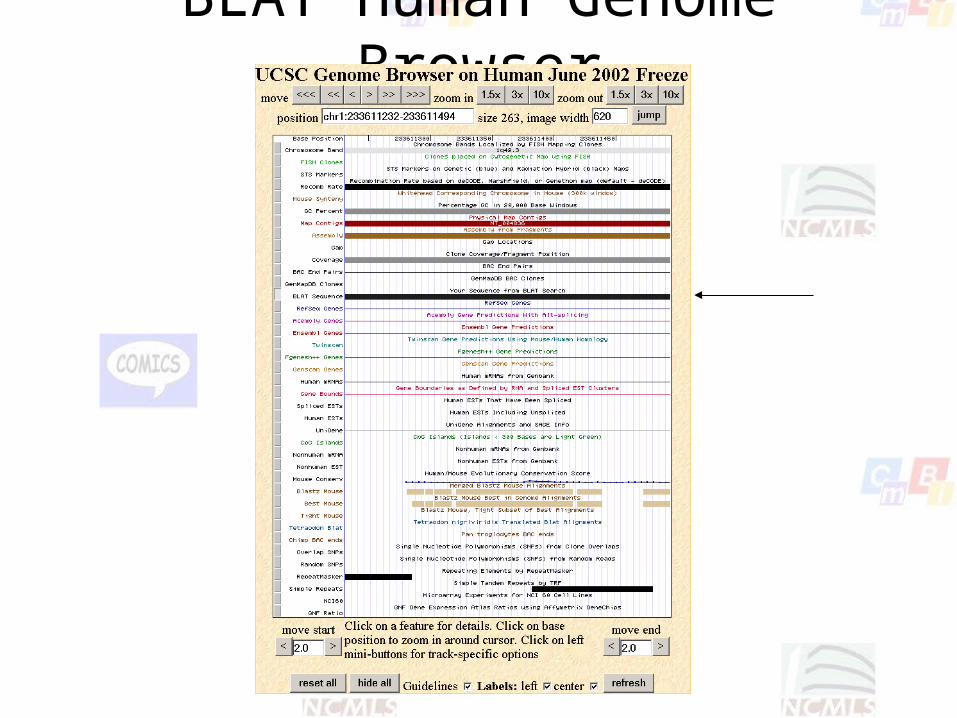
BLAT Human Genome Browser
BLAT method (1)
• Align sequence with BLAT, get alignment info• Per BLAT hit, pick up additional info from
connected databases:– mRNAs
– ESTs
– RepeatMasker
– CpG Islands
– RefSeq Genes
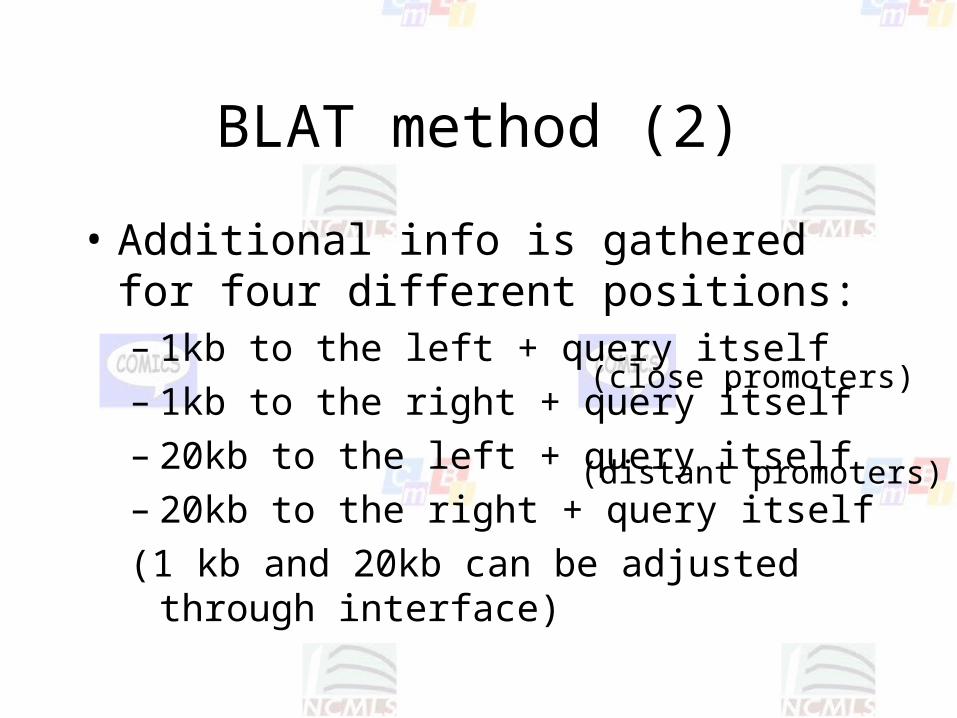
BLAT method (2)
• Additional info is gathered for four different positions:– 1kb to the left + query itself– 1kb to the right + query itself– 20kb to the left + query itself– 20kb to the right + query itself
(1 kb and 20kb can be adjusted through interface)
(close promoters)
(distant promoters)
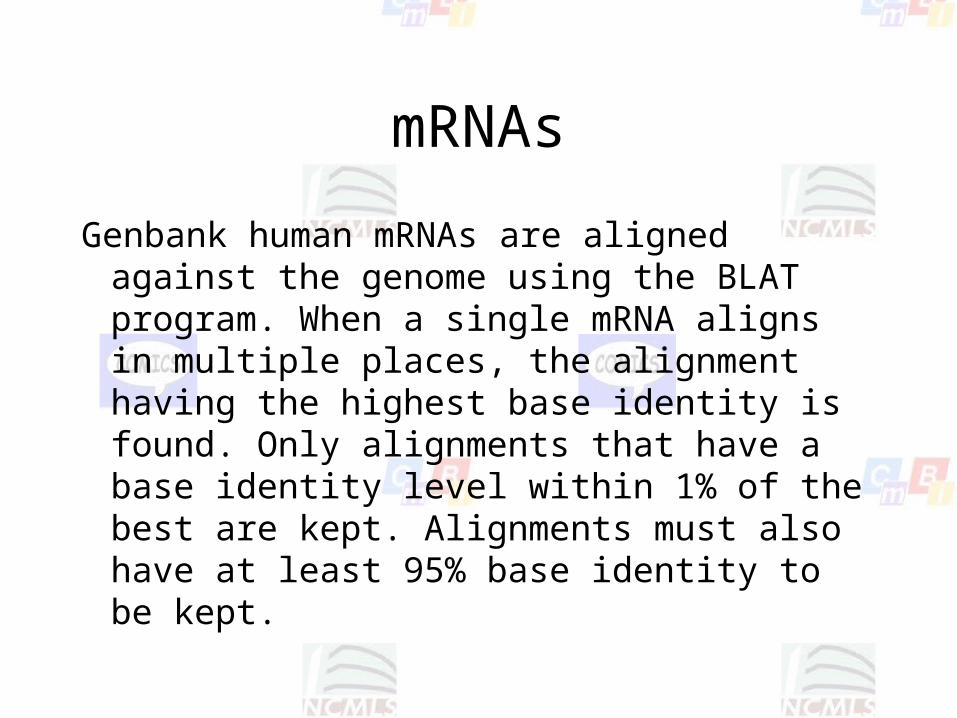
mRNAs
Genbank human mRNAs are aligned against the genome using the BLAT program. When a single mRNA aligns in multiple places, the alignment having the highest base identity is found. Only alignments that have a base identity level within 1% of the best are kept. Alignments must also have at least 95% base identity to be kept.
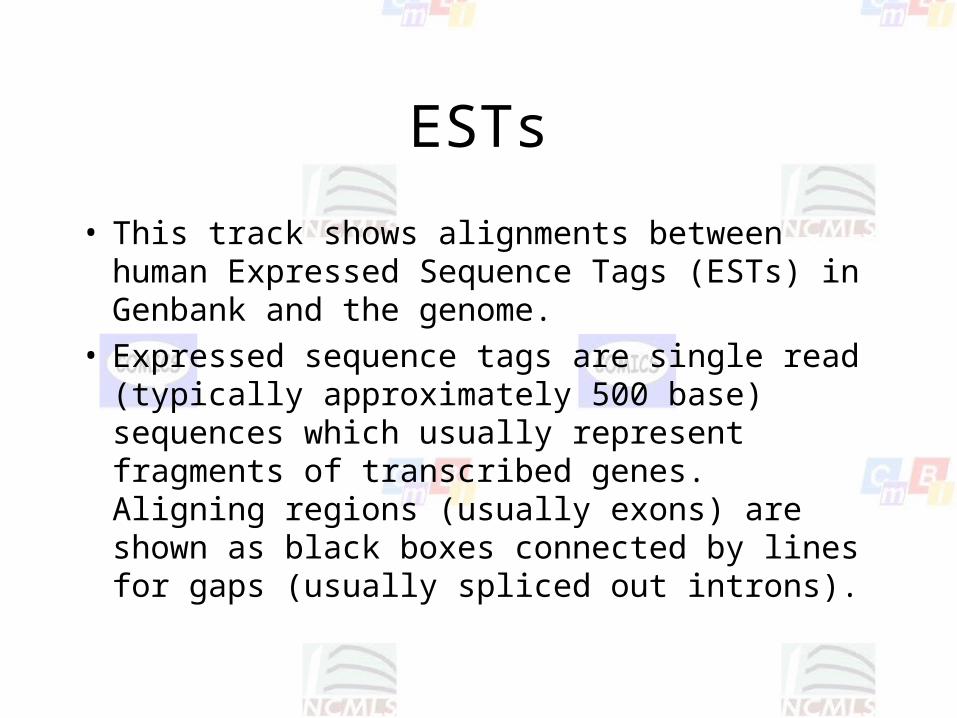
ESTs
• This track shows alignments between human Expressed Sequence Tags (ESTs) in Genbank and the genome.
• Expressed sequence tags are single read (typically approximately 500 base) sequences which usually represent fragments of transcribed genes. Aligning regions (usually exons) are shown as black boxes connected by lines for gaps (usually spliced out introns).
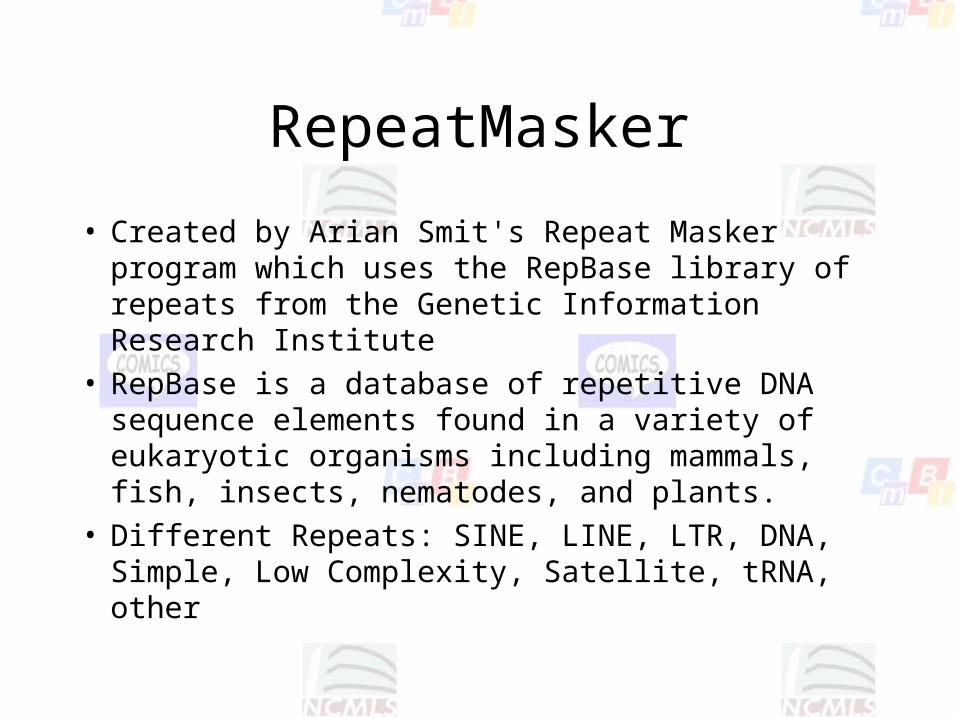
RepeatMasker
• Created by Arian Smit's Repeat Masker program which uses the RepBase library of repeats from the Genetic Information Research Institute
• RepBase is a database of repetitive DNA sequence elements found in a variety of eukaryotic organisms including mammals, fish, insects, nematodes, and plants.
• Different Repeats: SINE, LINE, LTR, DNA, Simple, Low Complexity, Satellite, tRNA, other

CpG Islands
• CpG = C+G; C immediately followed by G
• Particularly common near transcription start sites, and may be associated with promoter regions
• Normally, in vertebrates: CG -> C is methylated -> methylated C is deaminated -> TG
• CpG’s are relatively rare, unless there is a selective pressure to keep them, or:
• a region is not methylated for some reason, perhaps having to do with the regulation of gene expression.
• CpG islands are regions where CpG's are present at significantly higher levels than is typical for the genome as a whole.

RefSeq Genes
• The RefSeq Genes track shows known protein coding genes taken from mRNA reference sequences compiled at LocusLink.
• Refseq mRNAs are aligned against the genome using the BLAT program. When a single mRNA aligns in multiple places only the best alignments are kept. The alignments must also have at least 98% sequence identity to be kept.

Scoring Method (1)
For each BLAT hit the Score is:
Σ (length(mRNA)/distance(mRNA))*sw
+ Σ (length(EST)/distance(EST))*sw
+ Σ (length(RMSK tRNA)/distance(RMSK tRNA))*sw
+ Σ (length(RMSK LTR)/distance(RMSK LTR))*sw
+ Σ (length(RMSK rest)/distance(RMSK rest))*sw
+ Σ (length(CpG)/distance(CpG))*sw
+ Σ (length(RefSeq Genes)/distance(RefSeq Genes))*sw
(sw = scoring weight)

Scoring Method (2)
• Scoring weight: reflects reliability of the analyzed data; how much proof for being promoter?
• Adjustable through interface; defaults:– mRNAs: 4– ESTs: 3– RepeatMasker tRNA: 3– RepeatMasker LTR: 2– RepeatMasker rest: 1– CpG Islands: 2– RefSeq Genes: 0
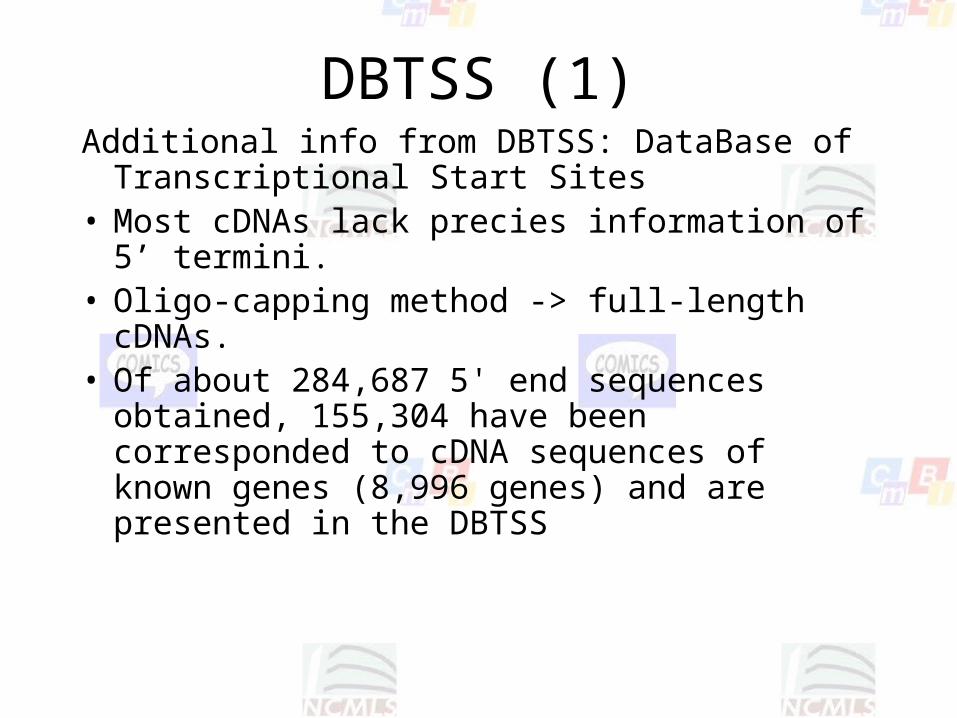
DBTSS (1)Additional info from DBTSS: DataBase of
Transcriptional Start Sites• Most cDNAs lack precies information of 5’
termini.• Oligo-capping method -> full-length cDNAs.• Of about 284,687 5' end sequences obtained,
155,304 have been corresponded to cDNA sequences of known genes (8,996 genes) and are presented in the DBTSS

DBTSS (2)
• Mapped each sequence on the human draft genome sequence to identify its transcriptional start site
• Overall Score: BLAT Score * DBTSS Score
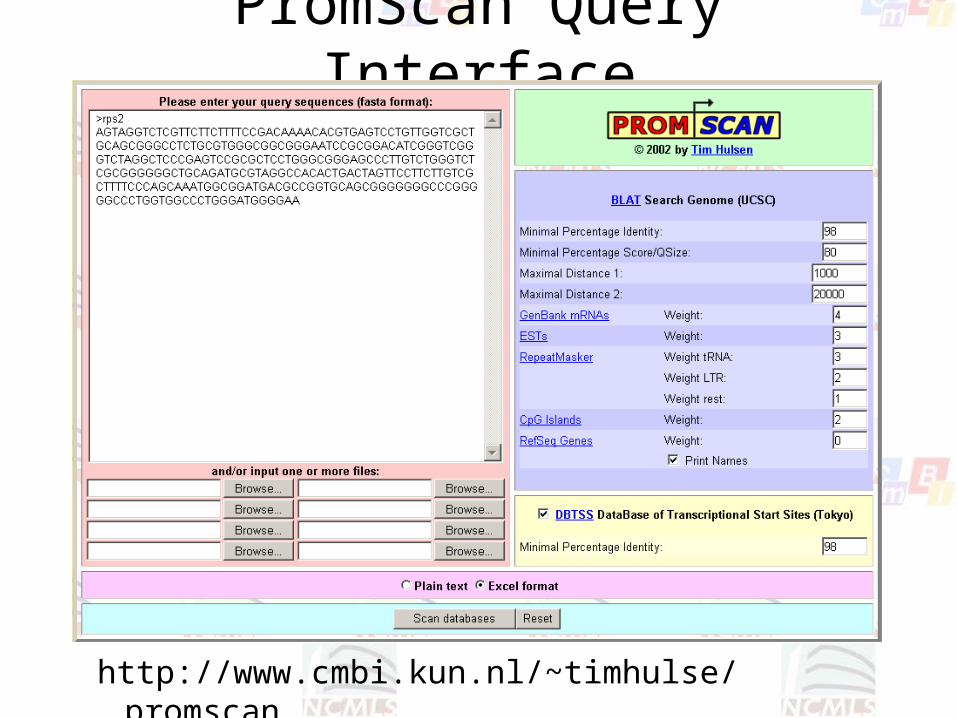
PromScan Query Interface
http://www.cmbi.kun.nl/~timhulse/promscan

Output (1): Header
PromScan - (C) 2002 Tim Hulsen - Analysis:
------------------------------
Parameters used:BLAT Minimal Percentage Identity: 98BLAT Minimal Percentage Score/QSize: 80BLAT Maximal Distance 1: 1000BLAT Maximal Distance 2: 20000BLAT Genbank Weight: 4BLAT ESTs Weight: 3BLAT RepeatMasker Weight tRNA: 3BLAT RepeatMasker Weight LTR: 2BLAT RepeatMasker Weight Rest: 1BLAT CpG Weight: 2BLAT RefSeq Genes Weight: 0BLAT RefSeq Genes Print Names: OnDBTSS: OnDBTSS Minimal Percentage Identity: 98
------------------------------
Excel; also plain text format (tab separated) possible

Output (2): Sequence Report
RepeatMasker Rest Mean LengthRepeatMasker Rest Mean DistanceRepeatMasker Rest Score CpG # CpG Mean LengthCpG Mean DistanceCpG Score RefSeq Genes #RefSeq Genes Mean LengthRefSeq Genes Mean DistanceRefSeq Genes Score PromScan Score RefSeq Gene Names263 966 0.272 1 1286 1 1286 1 270 200 180.452 3246685 RPS2119 748 0.159 1 1286 1 1286 1 180 1 180 3215028 RPS2179 11070 0.996 2 854 2323 1286.091 3 1048 58704 181.126 3254315 RPL3L NDUFB10 RPS2203 8560 1.098 7 856 9526 1286.438 4 1164 101986 180.354 3215089 RPS2 TBL3 MGC20258 GFER
Distance Side Genbank #Genbank Mean LengthGenbank Mean DistanceGenbank Score ESTs # ESTs Mean LengthESTs Mean DistanceESTs Score RepeatMasker tRNA #RepeatMasker tRNA Mean LengthRepeatMasker tRNA Mean DistanceRepeatMasker tRNA Score RepeatMasker LTR #RepeatMasker LTR Mean LengthRepeatMasker LTR Mean DistanceRepeatMasker LTR Score RepeatMasker Rest #1000 left 14 285 223 2658.028 7293 251 296 1077827 0 - - 0 0 - - 0 11000 right 15 208 14 2651.428 6567 163 5 1067284 0 - - 0 0 - - 0 1
20000 left 24 797 15344 2664.962 10946 577 15356 1080360 0 - - 0 2 1015 12827 0.272 4120000 right 27 635 55667 2652.749 6945 181 4781 1067301 0 - - 0 0 - - 0 24
Report for Query #1:
Name: rps2Sequence: AGTAGGTCTCGTTCTTCTTTTCCGACAAAACACGTGAGTCCTGTTGGTCGCTGCAGCGGGCCTCTGCGTGGGCGGCGGGAATCCGCGGACATCGGGTCGGGTCTAGGCTCCCGAGTCCGCGCTCCTGGGCGGGAGCCCTTGTCTGGGTCTCGCGGGGGGCTGCAGATGCGTAGGCCACACTGACTAGTTCCTTCTTGTCGCTTTTCCCAGCAAATGGCGGATGACGCCGGTGCAGCGGGGGGGCCCGGGGGCCCTSequence Length: 275
BLAT Hit 1:Score Start End QSize Identity Chro Strand Start End
274 0 275 275 100.00% 16 - 2031972 2032248
DBTSS Hit # ID Name Length Score Identities Strand1 NM_002952.1 Homo sapiens ribosomal protein S2 (RPS2), mRNA.934 99.6 bits (50)9e-21 62/65 (95%), Gaps = 2/65 (3%)Plus / Plus2 NM_032701.1 Homo sapiens hypothetical protein MGC2705 (MGC2705),mRNA.2076 36.2 bits (18)0.11 18/18 (100%) Plus / Plus3 NM_000020.1 Homo sapiens activin A receptor type II-like 11970 36.2 bits (18)0.11 18/18 (100%) Plus / Plus4 NM_032639.1 Homo sapiens hypothetical protein MGC3358 (MGC3358),2013 32.2 bits (16)1.7 16/16 (100%) Plus / Plus5 NM_031366.1 Homo sapiens collagen, type IV, alpha 3 (Goodpastureantigen) (COL4A3), transcript variant 6, mRNA.7374 32.2 bits (16)1.7 16/16 (100%) Plus / Minus6 NM_031365.1 Homo sapiens collagen, type IV, alpha 3 (Goodpastureantigen) (COL4A3), transcript variant 5, mRNA.7584 32.2 bits (16)1.7 16/16 (100%) Plus / Minus7 NM_031364.1 Homo sapiens collagen, type IV, alpha 3 (Goodpastureantigen) (COL4A3), transcript variant 4, mRNA.7699 32.2 bits (16)1.7 16/16 (100%) Plus / Minus8 NM_031363.1 Homo sapiens collagen, type IV, alpha 3 (Goodpastureantigen) (COL4A3), transcript variant 3, mRNA.7872 32.2 bits (16)1.7 16/16 (100%) Plus / Minus9 NM_031362.1 Homo sapiens collagen, type IV, alpha 3 (Goodpastureantigen) (COL4A3), transcript variant 2, mRNA.7877 32.2 bits (16)1.7 16/16 (100%) Plus / Minus
10 NM_000091.2 Homo sapiens collagen, type IV, alpha 3 (Goodpastureantigen) (COL4A3), transcript variant 1, mRNA.8050 32.2 bits (16)1.7 16/16 (100%) Plus / Minus

Output (3): Overall Report
------------------------------
Overall Report:
Query # Name BLAT Hit # BLAT (1000,left)BLAT (1000,right)BLAT (1000,total)BLAT (20000,left)BLAT (20000,right)BLAT (20000,total)BLAT Score DBTSS Score Overall Score1 rps2 1 3246684.604 3215028.43 6461713.034 3254314.767 3215088.957 6469403.724 12931116.76 42 543106903.9
Multiple hits are sorted from high score to low score;the higher the score, the higher the possibilitythe input sequence is a promoter.

Suggestions please!