proooooooooooooof 4-aminoantipyrine schiff base ... · distilled water. the 4-aminoantipyrine...
TRANSCRIPT

J. Mater. Environ. Sci. 6 (10) (2015) 3066-3085 Diab et al ISSN: 2028-2508 CODEN: JMESCN
3066
PROOOOOOOOOOOOOOF
4-Aminoantipyrine Schiff base derivatives as novel corrosion inhibitors for
Q235 steel in hydrochloric acid medium
A.M. Eldesoky
1, M.M. Ghoneim
2, M.A. Diab
3,+, A.A. El-Bindary
3,
A.Z. El-Sonbati 3
, M.K. Abd El-Kader 3,*
1 Engineering Chemistry Department, High Institute of Engineering & Technology (New Damietta), Egypt and Al-
Qunfudah Center for Scientific Research (QCSR), Al-Qunfudah University College, Umm Al-Qura University, KSA 2Chemistry Department, Faculty of Science, Tanta University, Tanta, Egypt
3Chemistry Department, Faculty of Science, Damietta University, Damietta 34517, Egypt
______________________
Received 25 May 2015, Revised 30 Sep 2015, Accepted 010ct 2015 *
Corresponding author: E-mail: [email protected]
Abstract The inhibitive effect of newly synthesized 4-aminoantipyrine Schiff base derivatives (1-3) against Q235 steel
and its adsorption behavior were investigated in 2 M HCl solution using weight-loss method, potentiodynamic
polarization, electrochemical impedance spectroscopy (EIS) and electrochemical frequency modulation (EFM)
techniques. The results showed that the inhibition efficiency increased with the increase of the inhibitor
concentration. The 4-aminoantipyrine Schiff base derivatives are a mixed-type inhibitor whose adsorption
behavior onto Q235 steel can be well fitted by Temkin isotherm equation. The quantum chemistry was used to
gain some insight, about structural and electronic effects in relation to the inhibiting efficiencies. EIS spectra
exhibit one capacitive loop and confirm the inhibitive ability. X-ray diffraction patterns (XRD) for both
compounds (1 and 2) show polycrystalline nature and compound (3) shows a mixture of amorphous and
polycrystalline nature. Molecular docking was used to predict the binding between 4-aminoantipyrine Schiff
base derivatives with the receptor of 3hb5- oxidoreductase receptor of breast cancer.
Keywords: Q235 steel, 4-Aminoantipyrine, Adsorption, Quantum chemical parameters, Molecular docking.
1. Introduction Acid solutions are widely used in industry, such as acid pickling of iron and steel, chemical cleaning and
processing, ore production and oil well acidification [1–3]. The problems arising from acid corrosion required
the development of various corrosion control techniques among which the application of chemical inhibitors has
been acknowledged as most economical method for preventing acid corrosion [4–9]. Many organics, such as
quaternary ammonium salts, acetylenic alcohol, and heterocyclic compounds are widely used as inhibitors in
various industries. The organic molecules adsorb on the metal surface through heteroatom, such as nitrogen,
oxygen and sulfur, blocking the active sites and generating a physical barrier to reduce the transport of corrosive
species to the metal surface [10–16]. Other researches revealed that the adsorption is influenced not only by the
nature and surface charge of the metal, but also by the chemical structure of inhibitors. Among these organic
compounds, heterocyclic substances containing nitrogen atoms, such as 4-aminoantipyrine compounds are
considered to be excellent corrosion inhibitors in combating acidic corrosion due to high inhibition efficiency,
good thermal stability and lack of irritating odor for many metals and alloys in various aggressive media [17–
22]. Therefore, the develop of novel modified inhibitors containing 4-aminoantipyrine heterocyclic ring and the
study of the relations between the chemical structure of inhibitors and their inhibition performances are of great
importance, both from the industrial and theoretical points of view.
This paper aims to investigate the inhibition effect and electrochemical behavior of newly synthesized 4-
aminoantipyrine Schiff base derivatives (1-3) for Q235 steel in 2 M HCl solution by the weight-loss method,
potentiodynamic polarization, electrochemical impedance spectroscopy (EIS) and electrochemical frequency
modulation (EFM) techniques. Several quantum-chemistry calculations have been performed in order to relate
the inhibition efficiency to the molecular properties of the different types of compounds [23–25].

J. Mater. Environ. Sci. 6 (10) (2015) 3066-3085 Diab et al ISSN: 2028-2508 CODEN: JMESCN
3067
2. Experimental 2.1. Measurements
Structural analysis of the inhibitors are performed at room temperature by Philips X-ray diffractometer equipped with
utilized monochromatic Cu Kα radiation (λ=1.5418Å).
The molecular structures of the investigated compounds are optimized by HF method with 3-21G basis set. The molecules
are built with Perkin Elmer Chem Biodraw and optimized using Perkin Elmer Chem Bio 3D software. Accelrys (Material
Studio Version 4.4) software for quantum chemical calculations has been used.
In the study simulates the actual docking process in which the ligand–protein pair-wise interaction energies are calculated
using Docking Server [26]. The MMFF94 Force field was for used energy minimization of ligand molecule using Docking
Server. Gasteiger partial charges were added to the ligand atoms. Non-polar hydrogen atoms were merged, and rotatable
bonds were defined. Docking calculations were carried out on 3hb5–OXIDORDUCTASE–Hormone protein model.
Essential hydrogen atoms, Kollman united atom type charges, and solvation parameters were added with the aid of Auto
Dock tools [27]. Affinity (grid) maps of 20X20X20 A grid points and. 375 A spacing were generated using the Autogrid
program [28]. Auto Dock parameter set- and distance-dependent dielectric functions were used in the calculation of the van
der Waals and the electrostatic terms, respectively.
2.2. Material and medium
Q235 steel was used for the corrosion measurement. Its composition (wt %) is 0.16 C, 0.30 Si, 0.53 Mn, <0.055 S, <0.045
P, Fe balance. The aggressive solution (2 M HCl) was prepared by dilution of HCl (analytical grade, 37 %) with double
distilled water. The 4-aminoantipyrine Schiff base derivatives used for this study, whose structures were shown in Table
(1), were prepared in the lab as following [29]: ethanolic solutions of 4-aminoantipyrine (0.1 mol) and P-derivatives
benzaldehyde (0.1 mol) were refluxed together for 4 h over a steam bath. The excess solvent was removed by evaporation
and the concentrated solution was cooled in an ice bath with stirring. The Schiff base (Ln) which separated out as a colored
powder and then recrystallized from ethanol. Our synthetic route of Schiff base ligands is shown in Scheme 1.
NN O
NH2
+ OHC XN
N O
NHC X
X= -OCH3 (1) , -H (2), -NO2 (3)
Ln
Scheme 1: Synthetic route of 4-aminoantipyrine derivatives.
2.3. Methods
2.3.1. Weight loss measurements
Rectangular specimens of Q235 steel with dimensions 2.0 x 2.0 x 0.2 cm were abraded with different grades of emery
paper, degreased with acetone, rinsed with bidistilled water and dried between filter papers. After weighting accurately, the
specimens were immersed in 100 ml of 2 M HCl with and without different concentrations of inhibitors at (30 ± 1oC).
After different immersion periods, the Q235 steel samples were taken out, washed with bidistilled water, dried and
weighted again. The weight loss values are used to calculate the corrosion rate (R) in mmy-1
by Eq. (1):
R = (weight loss in gram x 8.75 x 10⁴) / DAT (1)
where D is Fe density in g cm-3
, A is exposed area in cm2, T is exposure time in hr. The inhibition efficiency (%IE) and the
degree of surface coverage (θ) were calculated from Eq. (2):
% IE = θ x 100 = [(R* - R) / R
*] x 100 (2)
where R* and R are the corrosion rates of Q235 steel in the absence and in the presence of inhibitor, respectively.
2.3.2. Electrochemical measurements
Electrochemical measurements were conducted in a conventional three electrodes thermostated cell assembly using a
Gamry potentiostat/galvanostat/ZRA (model PCI300/4). A platinum foil and saturated calomel electrode (SCE) were used
as counter and reference electrodes, respectively. The Q235 steel electrodes were 1x1 cm and were welded from one side to
a copper wire used for electrical connection. The electrodes were abraded, degreased and rinsed as described in weight loss
measurements. All experiments were carried out at temperature (30 ± 1OC). The potentiodynamic curves were recorded

J. Mater. Environ. Sci. 6 (10) (2015) 3066-3085 Diab et al ISSN: 2028-2508 CODEN: JMESCN
3068
from -500 to 500 mV at a scan rate 1 mV S-1
after the steady state is reached (30 min) and the open circuit potential (OCP)
was noted. The % IE and degree of surface coverage were calculated from Eq. (3):
IE % = x 100 = [1 – (i°corr/ icorr )] x 100 (3)
where 0
corri and corri are the corrosion current densities of uninhibited and inhibited solution, respectively.
Table 1: Molecular structures, names, molecular weights and molecular formulas of investigated compounds.
Compound No Structure Name Mol. Wt. / Mol.
Formula
(1) NN O
NHC OCH3
4-[(4-Methoxy-benzylidene)-
amino]-1,5-dimethyl-2-phenyl-
1,2-dihydro-pyrazol-3-one
321.0 / C19H19N3O2
(2)
NN O
NHC
4-(Benzylidene-amino)-1,5-
dimethyl-2-phenyl-1,2-dihydro-
pyrazol-3-one
291.0 / C18H17N3O
(3)
NN O
NHC NO2
1,5-Dimethyl-4-[(4-nitro-
benzylidene)-amino]-2-phenyl-
1,2-dihydro-pyrazol-3-one
336.0 /C18H16N4O3
Electrochemical impedance spectroscopy (EIS) and electrochemical frequency modulation (EFM) experiments were
carried out using the same instrument as before with a Gamry framework system based on ESA400. Gamry applications
include software EIS300 for EIS measurements and EFM140 for EFM measurements; computer was used for collecting
data. Echem Analyst 5.5 Software was used for plotting, graphing and fitting data. EIS measurements were carried out in a
frequency range of 100 kHz to 10 mHz with amplitude of 5 mV peak-to-peak using ac signals at respective corrosion
potential. EFM carried out using two frequencies 2 and 5 Hz. The base frequency was 1 Hz. In this study, we use a
perturbation signal with amplitude of 10 mV for both perturbation frequencies of 2 and 5 Hz.
3. Results and discussion 3.1. Weight loss measurements
Figure (1) shows the weight loss–time curves for the corrosion of Q235 steel in 2 M HCl in the absence and
presence of different concentrations of compound (1) at 30 ± 1C .Similar curves for other compounds were
obtained and are not shown. The data of Table (2) show that, the inhibition efficiency increases with increase in
inhibitor concentration from 1 x 10⁻⁶
to 11 x 10-6
M. The maximum inhibition efficiency was achieved at 11 x
10-6
M. The lowest inhibition efficiency (%IE) is obtained in the presence of compound (3), therefore %IE
tends to decrease in the following order: compound (1) > compound (2) > compound (3).

J. Mater. Environ. Sci. 6 (10) (2015) 3066-3085 Diab et al ISSN: 2028-2508 CODEN: JMESCN
3069
0 30 60 90 120 150 180
0.05
0.10
0.15
0.20
0.25
0.30
Weig
ht lo
ss, m
g cm2
Time,min.
Blank
1x10⁻⁶ M
3x10⁻⁶ M
5x10⁻⁶ M
7x10⁻⁶ M
9x10⁻⁶ M
11x10-6 M
Figure 1: Weight loss-time curves for Q235 steel dissolution in 2 M HCl in the absence and presence of
different concentrations of inhibitor (1) at 30 ± 1 oC.
Table 2: Variation of inhibition efficiency (% IE) of different compounds with their molar concentrations from
weight loss measurements at 120 min immersion in 2 M HCl at 30 ± 1oC.
Conc.
(M)
Inhibition efficiency (% IE)
Compound (1) Compound (2) Compound (3)
1x10⁻⁶
35.5 31.8 28.4
3x10⁻⁶
37.9 34.6 28.9
5x10⁻⁶
40.3 36.0 30.8
7x10⁻⁶
45.0 39.3 34.6
9x10⁻⁶
46.9 44.1 40.3
11x10-6
47.9 45.5 41.7
3.1.1. Adsorption isotherm
It is widely acknowledge that adsorption isotherm provide useful insight onto the mechanism of corrosion
inhibition as well as the interaction among the adsorbed molecules themselves and their interaction with the
electrode surface [30]. In this study, Temkin adsorption isotherm was found to be suitable for the experimental
results. The isotherm is described by the following equation:
θ = 2.303/a log Kads + 2.303/a log C (4)
where C is the inhibitor concentration, Kads is the adsorption equilibrium constant. The plot of θ versus log C
was linear relation (shown in Figure 2). And the adsorption equilibrium constant Kads can be calculated from the
intercept. Also ΔGºads can be calculated from the following equation:
log Kads = -log 55.5 - ΔGºads / 2.303RT (5)
where value of 55.5 is the concentration of water in solution in mole/liter [31], R is the universal gas constant
and T is the absolute temperature. It was appear that the value of ΔGºads has a negative sign ensure the
spontaneity of the adsorption and stability of the adsorbed layer on the alloy surface [32]. Also the values of
ΔGºads around 40 kJ mol-1
which was attributed to electrostatic interaction between inhibitors species and the
charged metal surface ensure physisorption reaction. From Table (3), the values of Kads were found to run
parallel to the % IE [K (1) > K (2) > K (3)].This result reflects the increasing capability, due to structural
formation, on the alloy surface [33].

J. Mater. Environ. Sci. 6 (10) (2015) 3066-3085 Diab et al ISSN: 2028-2508 CODEN: JMESCN
3070
Table 3: Inhibitor binding constant (Kads), free energy of binding (ΔGads.) and later interaction parameter (a) for
inhibitors at 30 ± 0.1 °C.
Inhibitors Temkin isotherm
A Kads, M
-1 -ΔGads, kJmol
-1
Compound (1) 88.57 1.32 10.82
Compound (2) 82.25 1.25 10.68
Compound (3) 79.41 1.19 10.57
-6.0 -5.8 -5.6 -5.4 -5.2 -5.0 -4.8
0.20
0.25
0.30
0.35
0.40
0.45
0.50
R2=0.97473
R2=0.97577
R2=0.98198
log C, M.
compound (1)
compound (2)
compound (3)
Figure 2: Curve fitting of corrosion data for Q235 steel in 2 M HCl in presence of different concentrations of
inhibitors to the Temkin isotherm at 30 ± 0.1 °C.
3.1.2. Effect of temperature
The activation energies (E*a) for the corrosion of Q235 steel in the absence and presence of different
concentrations of 4-aminoantipyrine Schiff base derivatives (1-3) were calculated using Arrhenius-type equation
[34]:
log k = log A -E* a/ 2.303RT (6)
where A is the pre-exponential factor, k is the rate constant, Ea* is the apparent activation energy of the
corrosion process, R is the universal gas constant and T is the absolute temperature. Arrhenius plots of log k vs.
1/T for Q235 steel in 2 M HCl in the absence and presence of different concentration of inhibitors (1) are shown
graphically in Figure (3). The variation of log k vs. 1/T is a linear line. The values of E*a were calculated from
the slope of these lines and given in Table (4). The increase in E*a by the addition of concentration of inhibitors
(1-3) indicating that the energy barrier for the corrosion reaction increases. It is also indicated that the whole
process is controlled by surface reaction, since the activation energy of the corrosion process is larger than 20 kJ
mol-1
[35].Enthalpy and entropy of activation (H*, S
*) for the corrosion of Q235 steel in 2 M HCl were
obtained by applying the transition state equation (7) :
k = (RT/ Nh) exp (ΔS*/R) exp (-ΔH
*/RT) (7)
where h is Planck’s constant, N is Avogadro’s number. A plot of log k/T vs 1/T also gave straight lines as
shown in Figure (4) for Q235 steel dissolution in 2 M HCl in the absence and presence of different
concentration of inhibitor (1). The slopes of these lines equal -H*/2.303R and the intercept equal log RT/Nh +
(S*/2.303R) from which the value of H
* and S
* were calculated and tabulated in Table (4).

J. Mater. Environ. Sci. 6 (10) (2015) 3066-3085 Diab et al ISSN: 2028-2508 CODEN: JMESCN
3071
0.003000.003050.003100.003150.003200.003250.00330
-3.1
-3.0
-2.9
-2.8
-2.7
-2.6
-2.5
-2.4
-2.3
-2.2
R2=0.99783
R2=0.99894
R2=0.99948
R2=0.9982
R2=0.9968
R2=0.997
R2=0.99884
log
k, m
g cm
-2 m
in-1
(1/T(K))
Blank
1x10⁻⁶ M
3x10⁻⁶ M
5x10⁻⁶ M
7x10⁻⁶ M
9x10⁻⁶ M
11x10-6 M
0.003000.003050.003100.003150.003200.003250.00330
-5.6
-5.5
-5.4
-5.3
-5.2
-5.1
-5.0
-4.9
-4.8
log
k/T,
mg
cm-2
min
-1 K
-1
R2=0.99759
R2=0.99886
R2=0.99942
R2=0.99794
R2=0.99627
R2=0.99655
R2=0.99861
(1/T(K))
Blank
1x10⁻⁶ M
3x10⁻⁶ M
5x10⁻⁶ M
7x10⁻⁶ M
9x10⁻⁶ M
11x10-6 M
Figure 3: Arrehenius plots (log k vs 1/T) for Q235 steel in 2
M HCl in absence and presence of different concentration of
inhibitor (1).
Figure 4: Transition state plots (log k/T vs 1/T) for
Q235 steel in 2 M HCl in absence and presence of
different concentration of inhibitor (1).
Table 4: Thermodynamic activation parameters for the dissolution of Q235 steel in 2 M HCl in the absence and
presence of different concentrations of investigated compounds.
-S*, (J mol
-1 K
-1) H
*, (kJ mol
-1) Ea
*, (kJ mol
-1) Conc., M. Inhibitor
206.17 27.78 30.42 Blank Blank
198.60 31.21 33.05 1x10⁻⁶
Compound (1)
198.42 31.25 33.14 3x10⁻⁶
197.76 31.29 33.89 5 x10⁻⁶
197.43 31.54 34.18 7x10⁻⁶
197. 05 31.70 34.24 9x10⁻⁶
196.97 31.93 34.27 11x10-6
204.92 30.07 32.17 1x10⁻⁶
Compound (2)
203.36 30.09 32.63 3x10⁻⁶
202.92 30.30 32.90 5 x10⁻⁶
202.095 30.48 32.92 7x10⁻⁶
199.41 31.17 34.11 9x10⁻⁶
198.13 31.75 34.14 11x10-6
205.81 29.24 32.05 1x10⁻⁶
Compound (3)
204.16 29.28 32.52 3x10⁻⁶
203.09 30.10 32.74 5 x10⁻⁶
203.04 30.33 32.83 7x10⁻⁶
199.88 31.16 33.99 9x10⁻⁶
199.37 31.63 34.04 11x10-6
From these results, it is clear that the presence of the tested compounds increased the activation energy values
and consequently decreased the corrosion rate of the Q235 steel. These results indicate that these tested
compounds acted as inhibitors through increasing activation energy of Q235 steel dissolution by making a
barrier to mass and charge transfer by their adsorption on Q235 steel surface. Positive sign of the enthalpies
reflects the endothermic nature of the Q235 steel dissolution process.
J. Mater. Environ. Sci. 6 (10) (2015) 3066-3085 Diab et al ISSN: 2028-2508 CODEN: JMESCN
3072
All values of E*a E are larger than the analogous values of H
* indicating that the corrosion process must
involved a gaseous reaction, simply the hydrogen evolution reaction, associated with a decrease in the total
reaction volume [36]. The values of S* in absence and presence of the tested compounds are large and
negative; this indicates that the activated complex in the rate-determining step represents an association rather
than dissociation step, meaning that a decrease in disordering takes place on going from reactants to the
activated complex [37, 38].
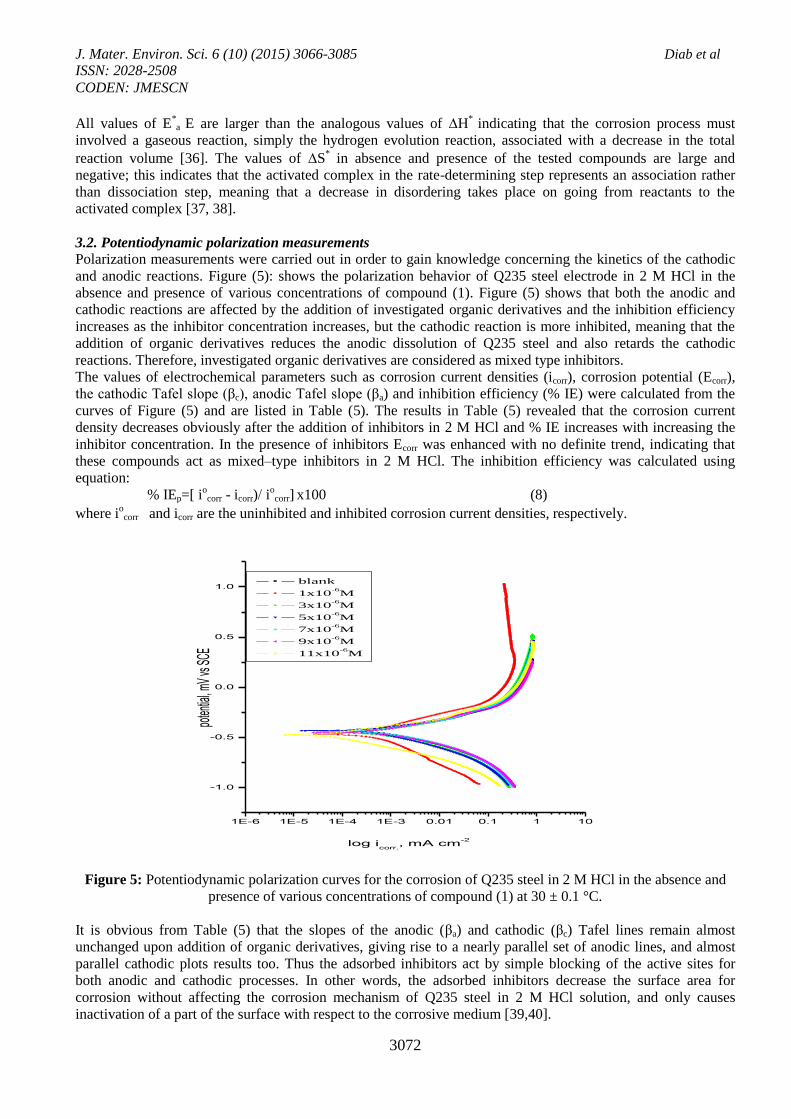
3.2. Potentiodynamic polarization measurements
Polarization measurements were carried out in order to gain knowledge concerning the kinetics of the cathodic
and anodic reactions. Figure (5): shows the polarization behavior of Q235 steel electrode in 2 M HCl in the
absence and presence of various concentrations of compound (1). Figure (5) shows that both the anodic and
cathodic reactions are affected by the addition of investigated organic derivatives and the inhibition efficiency
increases as the inhibitor concentration increases, but the cathodic reaction is more inhibited, meaning that the
addition of organic derivatives reduces the anodic dissolution of Q235 steel and also retards the cathodic
reactions. Therefore, investigated organic derivatives are considered as mixed type inhibitors.
The values of electrochemical parameters such as corrosion current densities (icorr), corrosion potential (Ecorr),
the cathodic Tafel slope (βc), anodic Tafel slope (βa) and inhibition efficiency (% IE) were calculated from the
curves of Figure (5) and are listed in Table (5). The results in Table (5) revealed that the corrosion current
density decreases obviously after the addition of inhibitors in 2 M HCl and % IE increases with increasing the
inhibitor concentration. In the presence of inhibitors Ecorr was enhanced with no definite trend, indicating that
these compounds act as mixed–type inhibitors in 2 M HCl. The inhibition efficiency was calculated using
equation:
% IEp=[ io
corr - icorr)/ iocorr] x100 (8)
where iocorr and icorr are the uninhibited and inhibited corrosion current densities, respectively.
1E-6 1E-5 1E-4 1E-3 0.01 0.1 1 10
-1.0
-0.5
0.0
0.5
1.0
log icorr.
, mA cm-2
poten
tial, m
V vs S
CE
blank
1x10⁻⁶
M
3x10⁻⁶
M
5x10⁻⁶
M
7x10⁻⁶
M
9x10⁻⁶
M
11x10-6
M
Figure 5: Potentiodynamic polarization curves for the corrosion of Q235 steel in 2 M HCl in the absence and
presence of various concentrations of compound (1) at 30 ± 0.1 °C.
It is obvious from Table (5) that the slopes of the anodic (βa) and cathodic (βc) Tafel lines remain almost
unchanged upon addition of organic derivatives, giving rise to a nearly parallel set of anodic lines, and almost
parallel cathodic plots results too. Thus the adsorbed inhibitors act by simple blocking of the active sites for
both anodic and cathodic processes. In other words, the adsorbed inhibitors decrease the surface area for
corrosion without affecting the corrosion mechanism of Q235 steel in 2 M HCl solution, and only causes
inactivation of a part of the surface with respect to the corrosive medium [39,40].

J. Mater. Environ. Sci. 6 (10) (2015) 3066-3085 Diab et al ISSN: 2028-2508 CODEN: JMESCN
3073
Table 5: Effect of concentrations of the investigated compounds (1-3) on the free corrosion potential (Ecorr.), corrosion
current density (icorr.), Tafel slopes (βa& βc), ,degree of surface coverage (θ) and inhibition efficiency (% IE) for Q235 steel
in 2 M HCl at 30 ± 0.1 °C.
Conc.,
M
icor X 10-4
,
mA cm -2
-Ecorr mV
vs(SCE)
βa X 10-3
,
mV dec-1
βc X 10-3
,
mV dec-1
Θ % IE
2 M HCl 7.90 434 107.7 146.9 - -
Compound (1)
1 x 10⁻⁶
4.57 464 196.1 187.8 0.4215 42.15
3 x 10⁻⁶
4.43 446 81.1 105.5 0.4392 43.92
5 x 10⁻⁶
3.89 431 77.6 121.9 0.5075 50.75
7 x 10⁻⁶
1.60 438 42.2 41.6 0.7974 79.74
9 x 10⁻⁶
1.44 449 43.6 35.9 0.8177 81.77
11x 10-6
1.04 473 125.9 239.7 0.8683 86.83
Compound (2)
1 x 10⁻⁶
6.04 448 11.5 86.2 0.2354 23.54
3 x 10⁻⁶
5.57 440 81.0 92.9 0.2949 29.49
5 x 10⁻⁶
5.40 452 32.8 22.3 0.3164 31.64
7 x 10⁻⁶
5.20 452 95.4 69.9 0.3417 34.17
9 x 10⁻⁶
4.86 441 103.8 85.0 0.3848 38.48
11x 10-6
4.87 465 33.7 27.2 0.3987 39.87
Compound (3)
1 x 10⁻⁶
7.77 487 118.3 120.1 0.164 1.64
3 x 10⁻⁶
7.70 467 112.8 132.3 0.253 2.53
5 x 10⁻⁶
7.62 450 125.4 84.2 0.356 3.56
7 x 10⁻⁶
7.37 483 85.9 122.0 0.670 6.70
9 x 10⁻⁶
6.62 457 114.8 95.7 0.1620 16.20
11x 10-6
6.39 447 35.0 31.6 0.1911 19.11
The inhibition efficiency of these compounds follows the sequence: compound (1) > compound (2) >
compound (3). This sequence may attribute to free electron pair in nitrogen atom, π electrons on aromatic nuclei
and the substituent in the molecular structure of the inhibitor, and again reflects, as confirmed from weight loss
measurements, the increased ability of compound (1) to inhibit 2 M HCl acid corrosion of Q235 steel as
compared to compound (3). This is clearly seen from the highest efficiency recorded for compound (3).
3.3. Electrochemical impedance spectroscopy (EIS)
EIS is well-established and powerful technique in the study of corrosion. Surface properties, electrode kinetics
and mechanistic information can be obtained from impedance diagrams [41-45]. Figure (6) shows Nyquist (a)
and Bode (b) plots obtained at open-circuit potential both in the absence and presence of increasing
concentrations of investigated compounds at 30 ± 0.1 °C. The increase in the size of the capacitive loop with the
addition of organic derivatives shows that a barrier gradually forms on the copper surface. The increase in the
capacitive loop size Figure 6(a) enhances, at a fixed inhibitor concentration, following the order: compound (1)
> compound (2) > compound (3), confirming the highest inhibitive influence of compound (1).
The Nyquist plots do not yield perfect semicircles as expected from the theory of EIS. The deviation from ideal
semicircle was generally attributed to the frequency dispersion [46] as well as to the inhomogenities of the
surface. EIS spectra of the organic additives were analyzed using the equivalent circuit, Figure (7), which
represents a single charge transfer reaction and fits well with our experimental results. The constant phase
element, CPE, is introduced in the circuit instead of a pure double layer capacitor to give a more accurate
fit [47]. The double layer capacitance, Cdl, is calculated from Eq. (9):
Cdl = Y0 ωn-1
/ sin [n (π/2)] (9)
where Y0 is the magnitude of the CPE, ω = 2πfmax, fmax is the frequency at which the imaginary component of
the impedance is maximal and the factor n is an adjustable parameter that usually lies between 0.50 and 1.0.
After analyzing the shape of the Nyquist plots, it is concluded that the curves approximated by a single
capacitive semicircles, showing that the corrosion process was mainly charged-transfer controlled [48-50]. The
general shape of the curves is very similar for all samples (in presence or absence of inhibitors at different
immersion times) indicating that no change in the corrosion mechanism [51]. From the impedance data (Table
6), we conclude that the value of Rct increases with increasing the concentration of the inhibitors and this

J. Mater. Environ. Sci. 6 (10) (2015) 3066-3085 Diab et al ISSN: 2028-2508 CODEN: JMESCN
3074
indicates an increase in % IE, which in concord with the weight loss results obtained. In fact the presence of
inhibitors enhances the value of Rct in acidic solution. Values of double layer capacitance are also brought down
to the maximum extent in the presence of inhibitor and the decrease in the values of CPE follows the order
similar to that obtained for icorr in this study. The decrease in CPE/Cdl results from a decrease in local dielectric
constant and/or an increase in the thickness of the double layer, suggesting that organic derivatives inhibit the
Q235 steel corrosion by adsorption at metal/acid [52, 53]. The inhibition efficiency was calculated from the
charge transfer resistance data from equation(10) [54]:
% IEEIS = [1 – (R°ct / Rct)] x 100 (10)
where Roct and Rct are the charge-transfer resistance values without and with
inhibitor, respectively.
0 2 4 6 8 10 12 14 16 18 20 22 24 26 28 30 32
-1
0
1
2
3
4
5
6
7
8
9
10
11
12
Zim
g , oh
m cm
-2
Zreal
, ohm cm-2
blank
1x10⁻⁶
M
3x10⁻⁶
M
5x10⁻⁶
M
7x10⁻⁶
M
9x10⁻⁶
M
11x10-6
M
(a)
-1 0 1 2 3 4 5
-0.4
-0.2
0.0
0.2
0.4
0.6
0.8
1.0
1.2
1.4
1.6
1.8
2.0
2.2
2.4
Zp
h,
deg
log F, Hz
log
Zm
od,
oh
m c
m-2
blank
1x10⁻⁶M
3x10⁻⁶M
5x10⁻⁶M
7x10⁻⁶M
9x10⁻⁶M
11x10-6M
(b)
-80
-70
-60
-50
-40
-30
-20
-10
0
10
20
30
40
50
Figure 6: EIS Nyquist plots (a) and Bode plots (b) for Q235 steel surface in 2 M HCl in the
absence and presence of different concentrations of compound (1) at 30 ± 0.1 °C.
Table 6: Electrochemical kinetic parameters obtained by EIS technique for Q235 steel in 2 M
HCl without and with various concentrations of compounds (1-3) at 30 ± 0.1 °C.
%IE θ Cdl X 10-4,
µFcm−2
Rct,
Ω cm2
n X 10-1
Yο, x 10
-4
µΩ−1
sn
RS X 10-1
,
Ωcm2
Conc., M .
Inhibitors
----- ------ 9.67 10.81 8.79 6.38 6.13 Blank
Compound (1)
66.45 0.6645 2.16 32.23 8.93 4.02 6.45 1 x 10⁻⁶
73.93 0.7393 2.04 41.47 8.80 3.19 7.92 3 x 10⁻⁶
77.93 0.7793 2.01 48.99 8.75 3.27 7.39 5 x 10⁻⁶
88.73 0.8873 1.94 95.94 8.56 2.87 7.32 7 x 10⁻⁶
89.29 0.8929 1.49 101.00 8.63 2.44 8.25 9 x 10⁻⁶
92.09 0.9209 1.30 136.70 8.97 1.28 6.87 11x 10-6
30.52 0.3052 5.91 15.56 8.63 3.14 8.17 1 x 10⁻⁶
Compound (2)
33.84 0.3384 4.99 16.34 7.62 1.78 7.97 3 x 10⁻⁶
37.80 0.3780 4.78 17.38 7.80 1.66 6.53 5 x 10⁻⁶
42.77 0.4277 2.82 18.89 8.30 9.73 8.24 7 x 10⁻⁶
48.10 0.4810 2.78 20.83 8.76 7.30 7.44 9 x 10⁻⁶
63.04 0.6304 2.29 29.25 7.60 2.03 6.10 11x 10-6
10.06 0.1006 9.15 12.02 8.69 2.69 9.19 1 x 10⁻⁶
Compound (3)
12.18 0.1218 9.02 12.31 8.10 1.33 7.45 3 x 10⁻⁶
19.44 0.1944 8.86 13.42 8.87 3.78 6.78 5 x 10⁻⁶
21.55 0.2155 8.72 13.78 8.73 3.19 7.35 7 x 10⁻⁶
23.38 0.2338 8.23 14.11 8.12 1.44 6.23 9 x 10⁻⁶
25.24 0.2524 7.74 14.46 8.27 1.54 6.10 11x 10-6
J. Mater. Environ. Sci. 6 (10) (2015) 3066-3085 Diab et al ISSN: 2028-2508 CODEN: JMESCN
3075
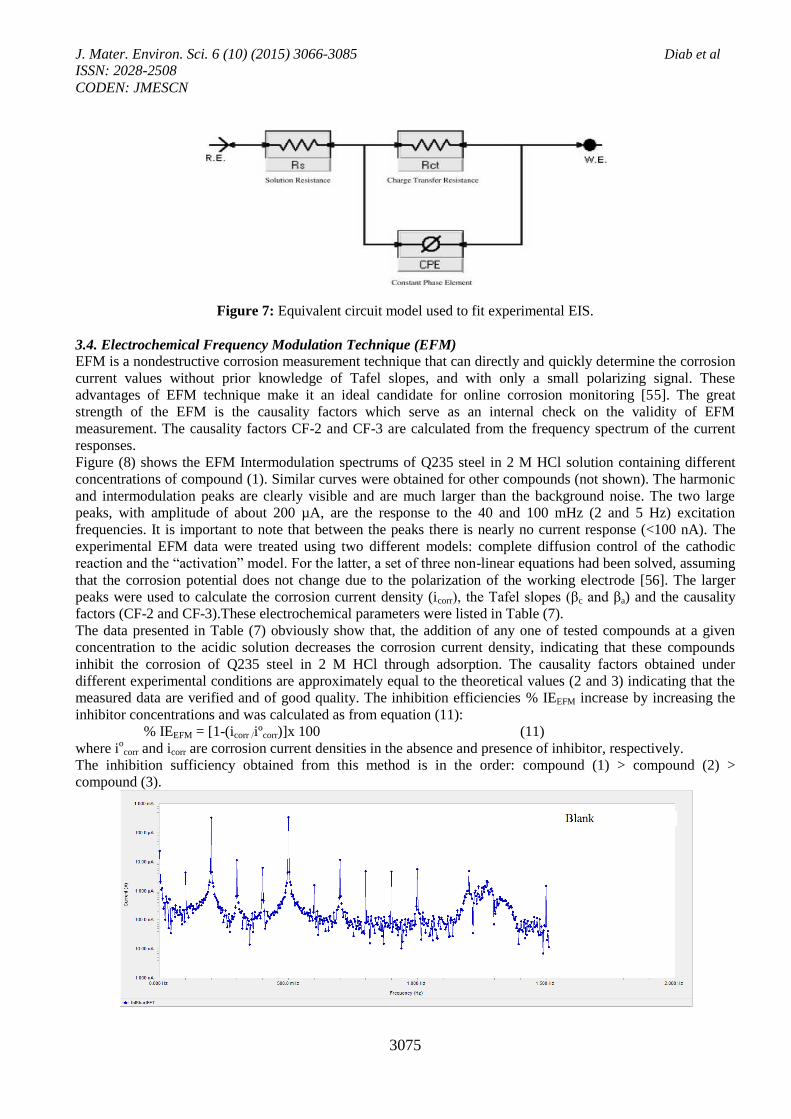
Figure 7: Equivalent circuit model used to fit experimental EIS.
3.4. Electrochemical Frequency Modulation Technique (EFM)
EFM is a nondestructive corrosion measurement technique that can directly and quickly determine the corrosion
current values without prior knowledge of Tafel slopes, and with only a small polarizing signal. These
advantages of EFM technique make it an ideal candidate for online corrosion monitoring [55]. The great
strength of the EFM is the causality factors which serve as an internal check on the validity of EFM
measurement. The causality factors CF-2 and CF-3 are calculated from the frequency spectrum of the current
responses.
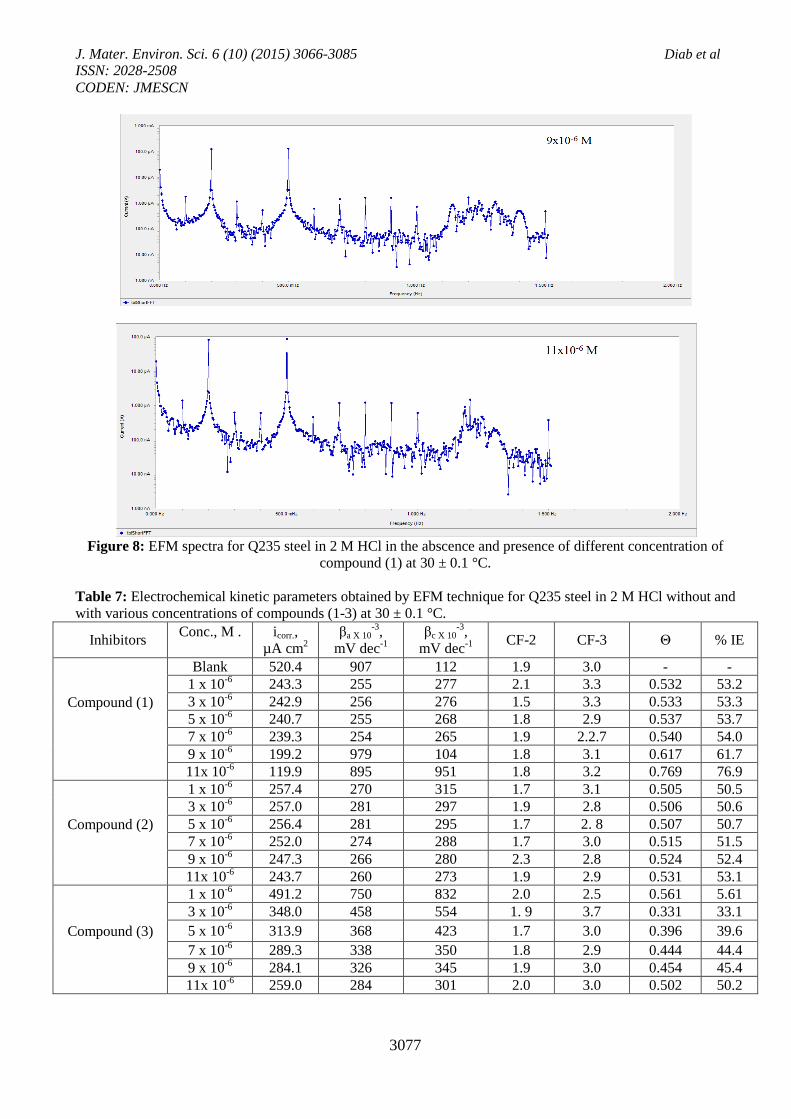
Figure (8) shows the EFM Intermodulation spectrums of Q235 steel in 2 M HCl solution containing different
concentrations of compound (1). Similar curves were obtained for other compounds (not shown). The harmonic
and intermodulation peaks are clearly visible and are much larger than the background noise. The two large
peaks, with amplitude of about 200 µA, are the response to the 40 and 100 mHz (2 and 5 Hz) excitation
frequencies. It is important to note that between the peaks there is nearly no current response (<100 nA). The
experimental EFM data were treated using two different models: complete diffusion control of the cathodic
reaction and the “activation” model. For the latter, a set of three non-linear equations had been solved, assuming
that the corrosion potential does not change due to the polarization of the working electrode [56]. The larger
peaks were used to calculate the corrosion current density (icorr), the Tafel slopes (βc and βa) and the causality
factors (CF-2 and CF-3).These electrochemical parameters were listed in Table (7).
The data presented in Table (7) obviously show that, the addition of any one of tested compounds at a given
concentration to the acidic solution decreases the corrosion current density, indicating that these compounds
inhibit the corrosion of Q235 steel in 2 M HCl through adsorption. The causality factors obtained under
different experimental conditions are approximately equal to the theoretical values (2 and 3) indicating that the
measured data are verified and of good quality. The inhibition efficiencies % IEEFM increase by increasing the
inhibitor concentrations and was calculated as from equation (11):
% IEEFM = [1-(icorr /iºcorr)]x 100 (11)
where iocorr and icorr are corrosion current densities in the absence and presence of inhibitor, respectively.
The inhibition sufficiency obtained from this method is in the order: compound (1) > compound (2) >
compound (3).

J. Mater. Environ. Sci. 6 (10) (2015) 3066-3085 Diab et al ISSN: 2028-2508 CODEN: JMESCN
3076
J. Mater. Environ. Sci. 6 (10) (2015) 3066-3085 Diab et al ISSN: 2028-2508 CODEN: JMESCN
3077
Figure 8: EFM spectra for Q235 steel in 2 M HCl in the abscence and presence of different concentration of
compound (1) at 30 ± 0.1 °C.
Table 7: Electrochemical kinetic parameters obtained by EFM technique for Q235 steel in 2 M HCl without and
with various concentrations of compounds (1-3) at 30 ± 0.1 °C.
% IE Θ CF-3 CF-2 βc X 10
-3,
mV dec-1
βa X 10-3
,
mV dec-1
icorr.,
µA cm2
Conc., M .
Inhibitors
- - 3.0 1.9 112 907 520.4 Blank
Compound (1)
53.2 0.532 3.3 2.1 277 255 243.3 1 x 10⁻⁶
53.3 0.533 3.3 1.5 276 256 242.9 3 x 10⁻⁶
53.7 0.537 2.9 1.8 268 255 240.7 5 x 10⁻⁶
54.0 0.540 2.2.7 1.9 265 254 239.3 7 x 10⁻⁶
61.7 0.617 3.1 1.8 104 979 199.2 9 x 10⁻⁶
76.9 0.769 3.2 1.8 951 895 119.9 11x 10-6
50.5 0.505 3.1 1.7 315 270 257.4 1 x 10⁻⁶
Compound (2)
50.6 0.506 2.8 1.9 297 281 257.0 3 x 10⁻⁶
50.7 0.507 2. 8 1.7 295 281 256.4 5 x 10⁻⁶
51.5 0.515 3.0 1.7 288 274 252.0 7 x 10⁻⁶
52.4 0.524 2.8 2.3 280 266 247.3 9 x 10⁻⁶
53.1 0.531 2.9 1.9 273 260 243.7 11x 10-6
5.61 0.561 2.5 2.0 832 750 491.2 1 x 10⁻⁶
Compound (3)
33.1 0.331 3.7 1. 9 554 458 348.0 3 x 10⁻⁶
39.6 0.396 3.0 1.7 423 368 313.9 5 x 10⁻⁶
44.4 0.444 2.9 1.8 350 338 289.3 7 x 10⁻⁶
45.4 0.454 3.0 1.9 345 326 284.1 9 x 10⁻⁶
50.2 0.502 3.0 2.0 301 284 259.0 11x 10-6

J. Mater. Environ. Sci. 6 (10) (2015) 3066-3085 Diab et al ISSN: 2028-2508 CODEN: JMESCN
3078
3.5. Chemical structure of the inhibitors and corrosion inhibition Inhibition of the corrosion of Q235 steel in 2 M HCl solution by some 4-aminoantipyrine compounds is
determined by weight loss, potentiodynamic anodic polarization measurements, Electrochemical Impedance
Spectroscopy (EIS) and electrochemical frequency modulation method (EFM) Studies, it was found that the
inhibition efficiency depends on concentration, nature of metal, the mode of adsorption of the inhibitors and
surface conditions.
The observed corrosion data in presence of these inhibitors, namely:
i) The decrease of corrosion rate and corrosion current with increase in concentration of the inhibitor.
ii) The linear variation of weight loss with time.
iii) The shift in Tafel lines to higher potential regions.
iv) The decrease in corrosion inhibition efficiency with increasing temperature indicates that desorption of
the adsorbed inhibitor molecules takes place.
v) The inhibition efficiency depends on the number of adsorption active centers in the molecule and their
charge density.
It was concluded that the mode of adsorption depends on the affinity of the metal towards the π-electron clouds
of the ring system. Metals such as Fe, which have a greater affinity towards aromatic moieties, were found to
adsorb benzene rings in a flat orientation. The order of decreasing the percentage inhibition efficiency of the
investigated inhibitors in the corrosive solution was as follow:
compound (1) > compound (2) > compound (3).
Compound (1) exhibits excellent inhibition power due to: (i) the presence of p-OCH3 group which is an electron
donating group with negative Hammett constant (σ = -0.27), Also this group will increase the electron charge
density on the molecule, and (ii) its larger molecular size that may facilitate better surface coverage.
Compound (2) comes after compound (1) in inhibition efficiency. This is due to it has lesser molecular size and
has no substituent in p-position (H-atom with σ =0.0) which contributes no charge density to the molecule.
Compound (3) comes after compound (2) in inhibition efficiency due to the presence of p- NO2 which has
positive Hammett constant (σ = +0.78).i.e. group which lower the electron density on the molecule and hence,
lower inhibition efficiency.
3.6. X-ray diffraction analysis
The X-ray diffraction (XRD) patterns of the inhibitors Schiff base powder are shown in Figure (9). The XRD
patterns show that compound (1and 2) Schiff bases are a polycrystalline. The XRD pattern of the powder
compound (3) show many peaks in addition to a broad hump at 2Ө = 8o. This behavior indicates that the
powder is a mixture of amorphous and polycrystals.
10 20 30 40 50 60
Inte
nsit
y
(A.U
)
(1) (2) (3)
2
Figure 9: X-ray diffraction patterns for compound (1-3) in powder forms.
3.7. Quantum chemical calculations
Figure (10) represents the molecular orbital plots and Mulliken charges of investigated compounds. Theoretical
calculations were performed for only the neutral forms, in order to give further insight into the experimental

J. Mater. Environ. Sci. 6 (10) (2015) 3066-3085 Diab et al ISSN: 2028-2508 CODEN: JMESCN
3079
results. Values of quantum chemical indices such as energies of lowest unoccupied molecular orbitals (LUMO)
and energy of highest occupied molecular orbitals (HOMO) (EHOMO and ELUMO), the formation heat (∆Hf) and
energy gap (∆E) are calculated and given in Table (8). It has been reported that the higher or less negative EHOMO
is associated of inhibitor, the greater the trend of offering electrons to unoccupied d orbital of the metal, and the
higher the corrosion inhibition efficiency, in addition, the lower ELUMO, the easier the acceptance of electrons
from metal surface [57]. From Table (8), it is clear that ∆E obtained by the four methods in case of compound
(3) is lower than compound (1), which enhance the assumption that compound (1) molecule will absorb more
strongly on Q235 steel surface than compound (3), due to facilitating of electron transfer between molecular
orbital HOMO and LUMO which takes place during its adsorption on the Q235 steel surface and thereafter
presents the maximum of inhibition efficiency.
Inhibitors HOMO LUMO Molecular Structure
Compound
(1)
Compound
(2)
Compound
(3)
Figure 10: Molecular orbital plots of investigated compounds.
Table 8: The calculated quantum chemical properties for investigated compounds.
Compound (1) Compound (2) Compound (3)
-EHOMO (a.u) 0.2648 0.2655 0.2684
-ELUMO (a.u) 0.1881 0.0701 0.0521
ΔE (a.u) 0.0770 0.1950 0.2160
η (a.u) 0.1063 0.0976 0.0401
σ (a.u)-1
9.4073 10.2459 24.9376
-Pi (a.u) 0.1584 0.1678 0.2282
(a.u) 0.1584 0.1678 0.2282
S (a.u)-1
4.7036 5.1229 12.4688
ω (a.u) 0.1180 0.1442 0.6493
∆Nmax 1.4901 1.7192 5.6907

J. Mater. Environ. Sci. 6 (10) (2015) 3066-3085 Diab et al ISSN: 2028-2508 CODEN: JMESCN
3080
Also it can be seen that EHOMO increases from compound (1) to compound (3) facilitates the adsorption and the
inhibition by supporting the transport process through the adsorbed layer. Reportedly, excellent corrosion
inhibitors are usually those organic compounds who are not only offer electrons to unoccupied orbital of the
metal, but also accept free electrons from the metal [58, 59]. It can be seen that all calculated quantum chemical
parameters validate these experimental results.
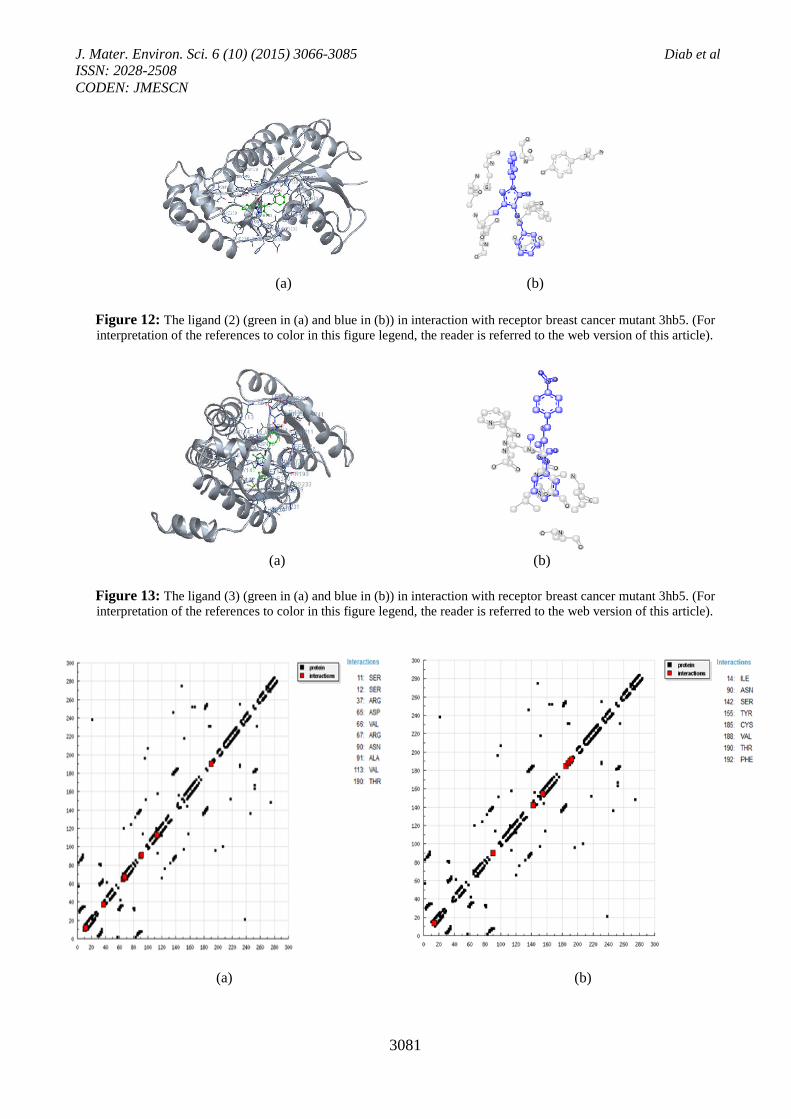
3.8. Molecular docking
Cancer can be described as the uncontrolled growth of abnormal cells. Breast cancer is one of the most recurring
worldwide diagnosed and deadliest cancers next to lung cancer with a high number of mortality rates among
females [60]. At global level, it accounted for more than 1.6 million new cases in 2010. The incidence or
prevalence rate of the breast cancer in India is expected to be more than 90,000 in the coming years and over
50,000 women die each year.
Molecular docking is a key tool in computer drug design [61]. The focus of molecular docking is to simulate the
molecular recognition process. Molecular docking aims to achieve an optimized conformation for both the
protein and drug with relative orientation between them such that the free energy of the overall system is
minimized. In this context, we used molecular docking between compounds (1-3) and breast cancer (3hb5). The
results showed a possible arrangement between compounds (1-3) and receptor 3hb5. The docking study showed
a favorable interaction between compounds (1-3) and the receptor 3hb5 Figure (11,12 and 13) and the calculated
energy is listed in Table 9. According to the results obtained in this study, HB plot curve indicate that the
compounds (1-3) bind to the protein with hydrogen bond interactions and decomposed interaction energies in
Kcal/mole were exist between compounds (1-3) with 3hb5 receptor as shown in Figure 14 and Table 10. The
calculated efficiency is favorable where Ki values estimated by AutoDock were compared with experimental Ki
values, when available, and the Gibbs free energy is negative. Also, based on this data, we can propose that
interaction between the 3hp5 receptor and the compounds (1-3) is possible. 2D plot curves of docking with
compounds (1-3) are shown in Figure 15 (a, b and c). This interaction could activate apoptosis in cancer cells
energy of interactions with compounds (1-3). Binding energies are most widely used as mode of measuring
binding affinity of compounds. Thus, decrease in binding energy due to mutation will increase the binding
affinity of the compounds towards the receptor. The characteristic features of compounds were represented in
presence of active sites available for hydrogen bonding. This feature gives them the ability to be good binding
inhibitors to the protein and will help to produce augmented inhibitory compounds. As shown in Table 9, the
values of Ki is related to the nature of the p-substituent as they increase according to the following order p-(NO2
> H > OCH3). This can be attributed to the fact that the effective charge increased due to the electron
withdrawing p-substituent compound (3) while it decreased by the electrons donating character of compound
(1). This is in accordance with that expected from Hammett’s constant (σR) as shown in Figure 16, correlate the
Ki values with σR it is clear that all these values increase with increasing σ
R. The results confirmed also that, the
compounds derived from 4-aminoantipyrine Schiff base derivatives (1-3) are efficient inhibitors of 3hb5 –
OXID ORDUCTASE breast cancer.
(a) (b)
Figure 11: The ligand (1) (green in (a) and blue in (b)) in interaction with receptor breast cancer mutant 3hb5. (For
interpretation of the references to color in this figure legend, the reader is referred to the web version of this article).
J. Mater. Environ. Sci. 6 (10) (2015) 3066-3085 Diab et al ISSN: 2028-2508 CODEN: JMESCN
3081
(a) (b)
Figure 12: The ligand (2) (green in (a) and blue in (b)) in interaction with receptor breast cancer mutant 3hb5. (For
interpretation of the references to color in this figure legend, the reader is referred to the web version of this article).
(a) (b)
Figure 13: The ligand (3) (green in (a) and blue in (b)) in interaction with receptor breast cancer mutant 3hb5. (For
interpretation of the references to color in this figure legend, the reader is referred to the web version of this article).
(a) (b)

J. Mater. Environ. Sci. 6 (10) (2015) 3066-3085 Diab et al ISSN: 2028-2508 CODEN: JMESCN
3082
(c)
Figure 14: HB plot of interaction between ligands (a) compound (1), (b) compound (2) and (c) compound (3)
with receptor breast cancer mutant 3hb5.
(a) (b)
(c)
Figure 15: 2D plot of interaction between ligands (a) compound (1), (b) compound (2) and (c) compound (3)
with receptor breast cancer mutant 3hb5.

J. Mater. Environ. Sci. 6 (10) (2015) 3066-3085 Diab et al ISSN: 2028-2508 CODEN: JMESCN
3083
-0.5 0.0 0.5 1.0
5
10
15
20
25
30
Ki
R
(1)
(2)
(3)
Figure 16: The relation between Hammett’s substitution coefficient (σ
R) vs. Ki of compounds (1-3).
Table 9: Energy values obtained in docking calculations of ligands with receptor breast cancer mutant 3hb5.
Receptor compound Est. free
energy of
binding
(kCal/mol)
Est.
inhibition
constant
(Ki) (uM)
vdW+ bond+
desolv
energy
(kCal/mol)
Electrostatic
Energy
(kCal/mol)
Total
intercooled
Energy
(kCal/mol)
Interact
surface
3hb5 (1) -7.06 6.65 -8.29 -0.05 -8.34 842.984
(2) -6.74 11.43 -7.73 0.01 -7.74 801.358
(3) -6.23 27.34 -7.44 0.04 -7.40 913.01
Table 10: Decomposed interaction energies of ligands with receptor breast cancer mutant 3hb5.
Receptor Hydrogen bonds Polar Hydrophobic Other
3hb5
(1)
ARG37 (-2.6094) VAL113 (-1.1999) ASN90 (-0.6217)
THR190 (-0.3299) ALA91 (-0.885) SER12 (-0.6109)
VAL66 (-0.6347) SER11 (-0.575)
ARG67 (0.6914
ASP65 (0.811)
(2)
TYR155 (-0.5182) PHE192 (-1.4785) ASN90 (-0.391)
VAL188 (-0.8822) THR190 (-0.3092)
ILE14 (-0.7667) SER142 (-0.0944
CYS185 (-0.1326)
(3)
GLY92 (-0.6666) ASN90 (-0.7463) PHE192 (-1.767) SER12 (-0.5629)
ARG37 (-0.5923) ILE14 (-0.7278) SER11 (-0.3727)
ALA91 (-0.6234) VAL188 (-0.3664)
CYS185 (-0.2054)
Conclusion 1- All the investigated compounds are good corrosion inhibitors for Q235 steel in 2 M HCl solution. The
effectiveness of these inhibitors depends on their structures. The variation in inhibitive efficiency depends
on the type and the nature of the substituent present in the inhibitor molecule.
3- The adsorption of the inhibitors are adsorbed on Q235 steel surface obeys the Temkin adsorption isotherm
model
4- Double layer capacitances decrease with respect to blank solution when the inhibitor added. This fact may
explained by adsorption of the inhibitor molecule on the Q235 steel surface.

J. Mater. Environ. Sci. 6 (10) (2015) 3066-3085 Diab et al ISSN: 2028-2508 CODEN: JMESCN
3084
5- EFM can be used as a rapid and nondestructive technique for corrosion measurements without prior
knowledge of Tafel slopes
6- The results obtained from chemical and electrochemical measurements were in good agreement. The order
of % IE of these investigated compounds is in the following order: compound (1) > compound (2) >
compound (3).
7- Quantum chemistry calculation results showed that the heteroatoms of N and O are the active sites of the 4-
aminoantipyrine compounds. It can adsorb on Fe surface firmly by donating electrons to Fe atoms and
accepting electrons from 3d orbital of Fe atoms.
8- 4-Aminoantipyrine Schiff base derivatives (1-3) are efficient inhibitors of 3hb5–OXID ORDUCTASE
breast cancer have been discussed.
References
1. Wahdan M.H., Hermas A.A., Morad M.S., Mater. Chem. Phys. 76 (2002) 111-118.
2. Bentiss F., Lebrini M., Vezin H., Lagrenee M., Mater. Chem. Phys. 87 (2004) 18-23.
3. Liu X., Okafor P.C., Zheng Y.G., Corros. Sci. 51 (2009) 744-751.
4. Al Maofari A., Ezznaydy G., Idouli Y., Guedira F., Zaydoun S., Labjar N. and El Hajjaji S., J. Mater.
Environ. Sci. 5 (2014) 2081- 2085.
5. Barouni K., Kassale A., Albourine A., Jbara O., Hammouti B., Bazzi L., J. Mater. Environ. Sci. 5 (2014)
456-463.
6. Fouda A.S., Shalabi K., Elmogazy H., J. Mater. Environ. Sci. 5 (2014) 1691-1702.
7. Ostovari A., Hoseinieh S.M., Peikari M., Shadizadeh S.R., Hashemi S.J., Corros. Sci. 51 (2009) 1935-
1949.
8. Bahrami M.J., Hosseinia S.M.A., Pilvar P., Corros. Sci. 52 (2010) 2793-2803.
9. Solomon M.M., Umoren S.A., Udosoro I.I., Udoh A.P., Corros. Sci. 52 (2010) 1317-1325.
10. Wang H.L., Liu R.B., Xin J., Corros. Sci. 46(2004) 2455-2466.
11. Solmaz R., Kardas G., Yazici B., Erbil M., Prot. Met. 41 (2005) 581-585.
12. Emregul K.C., Kurtaran R., Atakol O., Corros. Sci. 45 (2003) 2803-2817.
13. Chebabe D., Chikh Z.A., Hajjaji N., Srhiri A., Zucchi F., Corros. Sci. 45 (2003) 309-320.
14. Liu F.G., Du M., Zhang J., Qiu M., Corros. Sci. 51 (2009) 102-109.
15. Musa A.Y., Kadhum A.A.H., Mohamad A.B., Takriff M.S., Corros. Sci. 52 (2010) 3331-3340.
16. Khaled K.F., Amin M.A., Corros. Sci. 51 (2009) 1964-1975.
17. Quraishi M.A., Rafiquee M.Z.A., Khan S., Saxena N., J. Appl. Electrochem. 37 (2007) 1153-1162.
18. Zhang X.Y., Wang F.P., He Y.F., Du Y., Corros. Sci. 43 (2001)1417-1431.
19. Knag M., Bilkova K., Gulbrandsen E., Carlsen P., Sjoblöm J., Corros. Sci. 48 (2006) 2592-2613.
20. Wang L., Yin G.J., Yin J.G., Corros. Sci. 43 (2001) 1197-1202.
21. Okafor P.C., Liu X., Zheng Y.G., Corros. Sci. 51 (2009) 761-768.
22. Zhang J., Liu J.X., Yu W.Z., Yan Y.G., You L., Liu L.F., Corros. Sci. 52 (2010) 2059-2065.
23. Fouda A.S., Shalabi K., Ezzat R., J. Mater. Environ. Sci. 6 (2015) 1022-1039.
24. Kassou O., Galai M., Ballakhmima R. A., Dkhireche N., Rochdi A., Ebn Touhami M., Touir R., Zarrouk
A., J. Mater. Environ. Sci. 6 (2015) 1147-1155.
25. Khalil N., Electrochim.Acta 48 (2003) 2635-2640.
26. Bikadi Z., Hazai E., J. Chem. Inf. 11 (2009) 1-15.
27. Halgren T. A., J. Computat. Chem. 17 (1998) 490-519.
28. Morris G.M., Goodsell D.S., J. Comput. Chem. 19 (1998) 1639-1662.
29. El-Sonbati A.Z., Diab M.A., El-Bindary A.A., Abou-Dobara M.I., Seyam H.A., Spectrochim. Acta A 104
(2013) 213-221.
30. Wiercinska A.N., Dalmata G., Electrochim. Acta 51 (2006) 6179-6185.
31. Yurt A., Balaban A., Kandemir S.U., Bereket G., Erk B., Mater. Chem. Phys. 85 (2004) 420- 426.
32. Etre A.Y., Appl. Surf. Sci. 252 (2006) 8521-8525.
33. Lorenz W.J., Mansfeld F., Corros. Sci. 21 (1981) 647-672.
34. Putilova I.N., Balezin S.A., Barannik V.P., "Metallic Corrosion Inhibitors Pergamon" Press NewYork,
1960.
35. Al-Neami K.K., Mohamed A.K., Kenawy I.M., Fouda A.S., Monatsh. Chem. 126 (1995) 369- 376.
J. Mater. Environ. Sci. 6 (10) (2015) 3066-3085 Diab et al ISSN: 2028-2508 CODEN: JMESCN
3085
36. Noor E.A., Int. J. Electrochem. Sci. 2(2007)996-1017.
37. Marsh J., Advanced Organic Chemistry 3rd ed Wiley Eastern New Delhi (1988).
38. Martinez S., Stern I., Appl.Surf.Sci. 199 (2002) 83-89.
39. Al-Khaldi M. A., Al-qahtani K. Y. J. Mater. Environ. Sci. 4 (5) (2013) 593-600.
40. Schltze J.W., Wippermann K., Electrochim. Acta 32 (1987) 823-831.
41. Silverman D.C., Carrico J.E., Corrosion 44 (1988) 280- 287.
42. Macdonald D.D., Mckubre M.C.H., "Impedance measurements in electrochemical systems" Modern
Aspects of Electrochemistry, Bockris J.O’M., Conway B.E., White R.E., Eds., Plenum Press, New York 14
1982 pp. 61–150.
43. Mansfeld F., Corrosion 36 (1981) 301-307.
44. Gabrielli C., “Identification of Electrochemical processes by Frequency Response Analysis” Solarton
Instrumentation Group, 1980.
45. El Achouri M., Kertit S., Gouttaya H.M., Nciri B., Bensouda Y., Perez L., Infante M.R., Elkacemi K.,
Prog. Org. Coat. 43 (2001) 267-273.
46. Anejjar A., Zarrouk A., Salghi R., Zarrok H., Ben Hmamou D., Hammouti B., Elmahi B., Al-Deyab S.S., J.
Mater. Environ. Sci. 4 (2013) 583-592.
47. Mertens S.F., Xhoffer C., Decooman B.C., Temmerman E., Corrosion 53 (1997) 381-388.
48. Trabanelli G., Montecelli C., Grassi V., Frignani A., J. Cem. Concr. Res. 35 (2005) 1804-1813.
49. Trowsdate A.J., Noble B., Haris S.J., Gibbins I.S.R., Thomson G.E., Wood G.C., Corros. Sci. 38 (1996)
177-191.
50. Reis F.m., de Melo H.G., Costa I., J. Electrochem. Acta 51 (2006) 1780-1788.
51. Lagrenée M., Mernari B., Bouanis M., Traisnel M., Bentiss F., Corros. Sci. 44 (2002) 573-588.
52. McCafferty E., Hackerman N., J. Electrochem. Soc.119 (1972) 999-1009.
53. Ma H., Chen S., Niu L., Zhao S., Li S., Li D., J. Appl. Electrochem. 32 (2002) 65-72.
54. Kuş E., Mansfeld F., Corros. Sci. 48 (2006) 965-979.
55. Caigman G. A., Metcalf S. K., Holt E. M., J. Chem. Cryst. 30 (2000) 415-422.
56. Samie F., Tidblad J., Kucera V., Leygraf C., Atmospheric Environ. 39 (2005) 7362-7373.
57. Samie F., Tidblad J., Kucera V., Leygraf C., Atmospheric Environ. 40 (2006) 3631-3639.
58. Lukovits I., Palfi K., Bako I., Kalman E., Corrosion 53 (1997) 915-919.
59. Zhao P., Liang Q., Li Y., Appl. Surf. Sci. 252 (2005) 1596-1607.
60. Benson J.R., Jatoi I., Future Oncol. 8 (2012) 697- 702.
61. Beteringhe A., Racuciu C., Balan C., Stoican E., Patron L., Adv. Mater. Res. 787 (2013) 236-240.
(2015) ; http://www.jmaterenvironsci.com