propagation and adsorption of nanoparticles in porous
TRANSCRIPT

PHYSICAL REVIEW RESEARCH 2, 033074 (2020)
Propagation and adsorption of nanoparticles in porous medium as traveling waves
G. Gerber,1,2 D. A. Weitz,2 and P. Coussot 1,*
1Lab. Navier, Ecole des Ponts, Univ Gustave Eiffel, CNRS, 77420 Marne la Vallée, France2Experimental Soft Condensed Matter Group, School of Engineering and Applied Sciences, Harvard University,
Cambridge, Massachusetts 02138, USA
(Received 20 April 2020; accepted 23 June 2020; published 15 July 2020)
Generally, one attempts to globally predict or interpret, from numerical simulations, the history of the effluentsexiting porous media (i.e., the breakthrough curve), without a clear view of the detailed evolutions of depositioninside the medium. We developed a simple physical frame of description of the colloidal particle transport andadsorption, which allows to predict the main characteristics of transport and deposition in porous media froma set of directly measurable (macroscopic) physical parameters. More precisely, we show that the depositiondistribution is basically a traveling wave propagating in the medium with a shape (frontal or extended) andvelocity depending on the flow rate and the availability of particles with regards to the adsorption capacity. Thisin particular makes it possible to predict or interpret the breakthrough curve shape from a physical approach. Wealso show that additional effects may be included, such as a multiporosity leading to confinement effects (delayeddeposition in less accessible regions). The validity of the model is checked from original direct visualizationsby confocal microscopy of particle adsorption in time and space for nanoparticle suspensions flowing through abead packing. This makes it possible to measure the evolution of the deposition profiles in time distinguishingthe deposition in confined regions. The model appears to successfully predict the different trends: traveling wave,global deposition profile shape, profiles of deposition in confined regions.
DOI: 10.1103/PhysRevResearch.2.033074
I. INTRODUCTION
Colloidal particles from industrial or natural sources prop-agate and may deposit and alter the environment they flowthrough. Common problems include the accumulation of par-ticles impacting industrial [1–4], medical and biological [5–8]processes (injection, filtration, storage, cleaning, sorting, etc.),or the leaking of contaminants from industrial or hydrologicprocesses transported in ground water and accumulating insoils [9–12]. Predicting particle transport and deposition inthese porous media is the key to solve these problems.
All these applications involve suspensions of submicronicparticles (chemicals, heavy metals, microorganisms, engi-neered remediation agents) flowing through saturated porousmatrices with a diversity of geometries and porosities, withsome possibility of adsorption thanks to van der Waals orelectrostatic attraction. Obviously, the physical problem iscomplex since particle transport and retention on the walls ofthe porous media are a function of the specific interactionsand of the way the particles access the surfaces. Many studiesdescribed in details the possible interactions relying on theclassical DLVO theory and/or taking into account specifichydrodynamic processes around the solid walls of porous
*Corresponding author: [email protected]
Published by the American Physical Society under the terms of theCreative Commons Attribution 4.0 International license. Furtherdistribution of this work must maintain attribution to the author(s)and the published article’s title, journal citation, and DOI.
systems [13–21]. Geometrical aspects were also sometimesconsidered as important (theoretical impact of pore size poly-dispersity [22,23], shadow effect [24], local confinement mod-els [25]) but the evaluation of their impact on macroscopictransport modeling is somewhat indirect.
Deposition models generally propose empirical correc-tions of the common advection/diffusion system of equa-tions [9,26–29] to take into account the different types ofinteractions between the particles and the solid walls of theporous structure, generally through a modification of theadsorption kinetic constant. However, the validity of theseapproaches is often only indirectly tested through the analysisof the breakthrough curve [20,21,30–33], corresponding to theexited concentration as a function of time. The impact of amultiporosity, which is a crucial point for transport in soils,has been considered within the same frame [20,29,30]. Weare thus faced with the paradoxical situation that the validityof a detailed description of the adsorption processes inside themedium, for a macroscopic model of transport and deposition,is tested through the observation of the transported particlesoutside the porous medium.
On the other side, there has been several direct observationsof some processes, in particular clogging effects, in simplifiedsystems (2D and/or at pore scale) [23,34–39], and qualita-tive static imaging or indirect imaging in realistic systems[40–42]. Besides, detailed visualizations at the pore scaleinside 3D porous media provided a full set of informationon the local mechanisms of bacterial motion and trapping[43,44]. At last, it was possible from MRI (magnetic res-onance imaging) to get a view of the adsorbed and sus-pended particles during the flow through a bead packing, in a
2643-1564/2020/2(3)/033074(14) 033074-1 Published by the American Physical Society
G. GERBER, D. A. WEITZ, AND P. COUSSOT PHYSICAL REVIEW RESEARCH 2, 033074 (2020)
limited range of flow rates and for fast adsorption: a regularprogression of the front of adsorption was observed [45].These different works helped clarifying our understandingof the local phenomena but were in general not directlyused for transport and deposition modeling at a macroscopicscale. Nevertheless, recent quantitative internal visualizations,with NMR (nuclear magnetic resonance) [46] and confocalmicroscopy [47], appeared useful to develop probabilisticmodels of deposits and/or clogging at a macroscopic scale andcheck their agreement with internal measurements.
Here, our objective is to establish a straightforward relationbetween the events at a local scale and the macroscopicbehavior of the system. We focus on deposition processesleaving the porous medium unchanged, i.e., clogging or eventhick deposit as compared to the pore scale, which have beenconsidered in Refs. [46–48], are negligible. We show that aminimal number of ingredients may be used to describe theprinciples of the propagation and deposition of colloids inporous medium, and that such an approach leads a straightfor-ward quantification of the process in simple physical terms.This relies on a description of the local processes whichovercomes the complexity of the porous structure and thehydrodynamics, by using a probability of adsorption for eachparticle. This probability can be considered as constant onaverage precisely thanks to the complexity of the flow whichrapidly induces a homogeneous dispersion of the particles.
We show that, within the frame of a simple model ofcolloidal particle transport and adsorption through porousmedium, the deposition distribution is a traveling wave prop-agating in the medium with a shape and velocity dependingon the flow rate and the availability of particles with regardsto the adsorption capacity. The breakthrough curve is thenpredicted as a straightforward consequence of this shape.This model is validated from direct visualizations throughconfocal microscopy of particle adsorption in time and spacefor nanoparticle suspension flowing through a bead packing.This model can serve as a reference to which various morecomplex effects may be added. As an example, we show thatit can be extended to media with multiporosities, leading to“confinement effects.”
II. MODELING
A. Homogeneous porous medium
We consider the transport and deposition of colloidal par-ticles initially suspended in a liquid with negligible sedimen-tation, the suspension (liquid + particles) being injected atconstant flow rate in porous medium. This process is usuallydescribed by an advection-dispersion equation containing ablocking function which can express in more or less detailsthe physical effects leading to deposits [48–51]. Here we builtthe description from more global and straightforward physicalassumptions. We assume that the particles are essentiallytransported by the fluid but each particle entering a pore hassome given probability to be adsorbed to the walls of the pore.We consider the case for which only one layer of particles canbe adsorbed to the walls. Another fundamental assumption (inagreement with our experimental observations under variousconditions: see below) is that a particle which has been
adsorbed will never start again to move. It seems in factrather reasonable to consider that a deposited particle will noteasily be moved again if the flow conditions, which allowedthe particle to fix onto the solid surface, do not change, asexpected under steady injection. Remark that, on the contrary,some particle removal can result from a significant evolutionof the pore structure due to deposits, which has led to asignificant increase of the local velocity [47].
We then define the deposited amount s(x, t ) as the num-ber of adsorbed particles per unit volume at time t in thepores situated at the distance x from the entrance. Thisvariable must be understood as a mean value over a thincross-sectional layer at the distance x. We also define n(x, t )as the number of particles in suspension per unit fluidvolume.
Finally we assume that over a short distance, typically afew pores, the suspension is sufficiently mixed so that theparticle distribution can be considered as homogeneous andthe suspension characteristics are fully described through thevalue of n. Thus we consider that the complex fluid flowtends to rapidly disperse again the particles still flowing atall possible distances from the pore surfaces. It follows that,for a given velocity of the fluid, we can describe the processin terms of a constant probability of adsorption for the parti-cles moving through some elementary volume of the porousmedium (possibly of several pore lengths). Actually, we havealso to take into account that this probability of adsorptionis decreased if the solid surface is already partly covered byparticles. Note that here we neglect the impact of adsorptionon the porous structure, which amounts to consider that theparticle size is much smaller than the pore size.
During some elementary flow step, i.e., over an elementarytime period dt , during which the suspension flows through theelementary volume of porous medium (see above), the gain indeposition ds is proportional to
(1) The number of particles entering the pores, i.e., nV dt ,in which V is the mean flow velocity through the pores; V isthe effective mean velocity of the fluid and particles, whichmust not be confused with the mean velocity through theporous medium, equal to εV , where ε is the porosity of themedium.
(2) The probability of adsorption of a particle enteringa pore, i.e., k, which depends on the characteristics of thesystem (particle size and interaction with wall, structure ofthe porous medium, flow characteristics).
(3) The fraction of surface sites available at that time: 1 −s/s0, in which s0 is the number of surface adsorption sites perunit volume (i.e., the maximum number of particles adsorbedat saturation). Thus we assume that only one layer of adsorbedparticles can form on the bead.
We thus get ds = kn(1 − s/s0)V dt . Note that this expres-sion is close to the classical “Langmuirian” blocking function[51] except that here we give a precise definition of theadsorption probability which will lead to take into account theflux of particles entering the pore.
Besides, the relationship between the evolution of n and sis described through the standard advection equation, whichexpresses that the variation of concentration of suspendedparticles in the moving fluid (with the velocity V ) resultsfrom the loss of particles due to adsorption. Here we assume
033074-2

PROPAGATION AND ADSORPTION OF NANOPARTICLES … PHYSICAL REVIEW RESEARCH 2, 033074 (2020)
negligible dispersion, as this effect essentially tends tosmoothen or expand the profiles. Moreover, it was recentlyshown [41] that dispersion of colloidal suspension flowingthrough porous medium is much weaker than generally as-sumed. The full set of equations then writes
∂n
∂t+ V
∂n
∂x= −∂s
∂t, (1a)
∂s
∂t= kn(1 − s/s0)V. (1b)
This set of equations is similar to that proposed by Leijet al. [52] under the same assumptions. The only differ-ence concerns the definition of k, but this does not affectthe solution. Usually, such a system, including a dispersionterm, is solved numerically. Leij et al. [52] provided thefull analytical solution of (1) for an injected pulse of sus-pension (see Appendix A). They were then able to predictthe breakthrough curve and the setback distance (where aparticular concentration is reached) as a function of time, andcompared these results to experimental data. However, fromthis solution, general trends can hardly be inferred as thepredictions mainly concern specific parameter variations. Inthe following, we will use a different approach leading to morestraightforward descriptions of the various characteristics ofthe deposits, as a function of a reduced number of parameters.This approximate dimensionless approach can then be usedfor a physical analysis of the processes. We will neverthelessrefer to the general solution (see Appendix A) to confirm therange of validity of our solutions. Finally, our approach willalso allow to find an approximate solution for the case of abiporous medium.
We consider the case of a continuous injection of the sus-pension, i.e., “a train” of suspension. Under these conditions,our fundamental assumption is that after some distance fromthe entrance we get a stationary distribution of depositedparticles progressing through the medium. As a consequence,we look at a simple solution to these equations in the formof traveling waves of constant velocity (V1) for s and n. Insuch a case, some time after the entrance of the suspensionin the medium, the profiles of adsorbed particles [i.e., s(x, t )]collapse onto a single master curve thanks to a shift propor-tional to the time. We thus introduce X = x − V1t , and nowlook at s(x, t ) and n(x, t ) as respectively s(X ) and n(X ). Forthis theoretical description, it is useful to define these variablesover the whole domain of X , i.e., ] − ∞; ∞[, with the bound-ary conditions s(−∞) = s0 (“adsorption capacity,” i.e., forsaturated medium) and n(−∞) = n0 (initial concentration ofparticles in suspension at entrance), and s(+∞) = n(+∞) =0 (medium not yet reached by any particle).
The mass conservation imposes that the number of parti-cles entering the domain per unit time and unit open sectionarea (i.e., sample cross-section times porosity) be equal to therate of variation of the total number of particles inside thedomain. We thus have
n0V = ∂
∂t
[∫ +∞
−∞(s + n)dX
]
=∫ +∞
−∞−V1
(∂s
∂X+ ∂n
∂X
)dX = V1[s0 + n0]. (2)
Using this relation between V and V1 and the rescaled concen-trations S = s/s0 and N = n/n0, the set of equations (1) thenbecomes
dN
dX= dS
dX, (3a)
dS
dX= −a(1 − S)kN (3b)
with a = (1 + n0/s0). This parameter expresses the avail-ability of particles with regards to the adsorption capacity.The solution of Eq. (3a) taking into account the boundarycondition at −∞ is
N (X ) = S(X ). (4)
This result, which is intimately related to our description ofthe process as traveling waves, in particular expresses the factthat the adsorption increases with the number of suspendedparticles, and cannot exist otherwise, i.e., when there is noparticle in suspension.
Since S continuously varies between 1 and 0 along the Xaxis it reaches 0.5 in some point, that we use as the positionof reference (X = 0). Then the solution of Eq. (2b) is
S(X ) = 1
1 + exp(X/λ)(5)
with λ = 1/ak. This deposition distribution corresponds to asigmoidal shape with a characteristic length λ. Note that thisdescription is obviously an approximation of reality since,to be strictly exact under the above boundary conditions,the expression (5) would require the train of suspension tohave covered an infinite distance along the porous medium.The conditions of validity of this approximation are analyzedin the next section. However, we can already remark oneparticular aspect of this approximation: the real distributionis in fact limited by the distance (say, x1) reached by thesuspension at the time considered, so that S(x > x1) = 0. Ifwe note x0 = V1t0, the center of the wave reached at time t0,then x1 = V t0, and S abruptly drops to zero beyond a distancex1 − x0 = x0s0/n0 from the wave center. We can neglect thiseffect if this value if much larger than λ, which implies thatV t0 � 1/k, i.e., if the probability of adsorption is such thatmost of the particles have been adsorbed over the distance V t0.
Finally, the deposited distribution during the train motiontakes the form of a wave front propagating at the velocity V1
along the medium axis, and with a more vertical shape forsmaller λ (see Fig. 1), i.e., for larger probability of adsorptionand larger availability of suspended particles at entrance.
B. Validity of the traveling wave assumption
For the traveling wave assumption to be valid, a sufficientvolume of suspension must have penetrated the medium.A criterion of validity is that the deposited amount at theporous medium entrance, as predicted by the model (1), beclosed to that predicted by the traveling wave model. Atthe entrance (i.e., x = 0), the exact model [i.e., Eq. (1b)]with the boundary condition n(0, t ) = n0 tells us that thedeposited amount evolves as S(x = 0) = 1 − exp(−kV (a −1)t ). On the other side the approximate solution [Eq. (5)]gives S(x = 0) = [1 + exp(−kV (a − 1)t )]−1. We deduce that
033074-3

G. GERBER, D. A. WEITZ, AND P. COUSSOT PHYSICAL REVIEW RESEARCH 2, 033074 (2020)
FIG. 1. Predictions of the model [Eq. (5)] for a homogeneousporous medium (S) for different values of the parameter λ, andpredictions of the model [Eq. (9)] for a double porosity medium witha dominant medium (1) for different values of u. Note that the valuesfor λ used here correspond to those identified by fitting the model tothe experiments at different velocities (see inset of Fig. 6). Here weused same units for X and λ, say, e.g., centimeters.
the two expressions differ by less than 10% when kn0V t > s0.This means that, for the adsorption to approach saturationaround the entrance, the length of train already injected (V t)must be larger than a characteristic length depending on theadsorption capacity and suspension concentration (s0/kn0). Asimilar conclusion is reached by approaching the travelingwave solution from the general solution of Eq. (1) (see Ap-pendix A).
C. Distribution of adsorbed particles after a pulse passing
The above description, through a traveling wave propa-gation, fundamentally relies on the assumption that the sus-pension is continuously injected upstream in the mediumfrom some initial time, in the form of a train without end.However, in practice, we generally inject a pulse, i.e., a trainof suspension of finite length, or a series of pulses. This mayin particular allow to measure the distribution of adsorbedparticles after a pulse.
Since in our description there is no diffusion effect and nopossibility for a deposited particle to start again moving, asuccession of pulses will be equivalent, in terms of depositioncharacteristics, to a train of total length equal to the sum ofpulse lengths. However, the deposited distribution after thepassage of the last pulse differs from that associated withthe traveling wave, as the end of particle injection at theback of the pulse induces a transient deposit which alters thestationary distribution (during flow).
Actually, we can deduce the distribution after the passageof the pulse, from the stationary distribution (thus assumingthat the traveling wave is established). It may indeed beremarked that the deposited concentration reached at the pointof the back of the pulse will not change any more duringthe further advance of the pulse. Let us consider a pulse oftime duration �t (i.e., injection of suspension during a time
�t). After the complete passing of the pulse, the depositedfraction at the point x is that reached in the train (full wave)at the time t for which the back of the pulse is situated inthat point. This implies that the deposit is S∗ = S(X ∗), asgiven by (5), with X ∗ = x − V1t and x = V (t − t0), so thatX ∗ = x/a − V1�t and
S∗ = 1
1 + exp[k(x − n0V �t/s0)]. (6)
Thus we find that deposited distributions following a pulse ofsuspension are similar to the distributions associated with amoving train [i.e., Eq. (5)], with a characteristic length 1/kinstead of λ = 1/ak. Since the factor a is larger than 1, thedeposited distribution S∗ is a sigmoid of larger characteristiclength than S.
This solution is effectively the general solution of the setof equations (1) under the condition that the duration of thepulse be sufficient large, i.e., kn0V �t > s0 (see Appendix A).
Since the medium remains intact after the passage of apulse, it starts evolving again as inside a train as soon asthe next pulse arrives. Thus, if we consider a series of pulses(successively numbered as p = 1, 2, …) of identical duration�t we will get similar successive deposited distributions givenby Eq. (6) with now a shift factor along the x-axis equalto the length p(n0V �t/s0). Finally, the deposits resultingfrom this series of pulses will appear as traveling waves ata velocity V2= n0V /s0. Note that this value is larger than thetraveling waves of the deposited distribution during flow (i.e.,V1) because in the latter case there is still a fraction of particlesin suspension.
D. Breakthrough curve
We can also predict the breakthrough curve under thecondition of a sufficiently long pulse for the traveling waveto be established. We consider a pulse of length l injectedfrom the initial time t = 0 in the medium at the velocity Vand a medium exit located at the distance L. In that case thebreakthrough curve is given by the suspension concentrationat the exit of the medium:
n(t ) = n0S(L, t ) = n0
1 + exp ak(L − V1t )
for t ∈ [L/V ; (L + l )/V ], and n(t ) = 0 otherwise.This may be expressed with dimensionless variables as
N (T ) = 1
1 + exp K[a(1 − T ) − T ](7)
in which K = kL is a factor of probability of adsorption in thesystem, and T = V t/L is a dimensionless time, i.e., the timerescaled by the time needed for the pulse to reach the mediumend. An illustration of different shapes of breakthrough curvesobtained for different values of a is provided in Fig. 2. Theinterest of this model clearly appears here. Within the frameof this approach, it is possible to describe or predict thetrends with the help of a limited number of parameters witha physical meaning, namely the availability of particles foradsorption and the probability of adsorption. This might alsoconstitute a first approach of any deposition problem, fromwhich further aspects could be considered as alterations of thepredictions from this simple model.
033074-4

PROPAGATION AND ADSORPTION OF NANOPARTICLES … PHYSICAL REVIEW RESEARCH 2, 033074 (2020)
FIG. 2. Different breakthrough curves predicted by the model,for l/L = 0.5, K = 4, and different values of a (indicated in thegraph). Note that we represent here N as a function of Tf − T , inwhich Tf = 1.5 is the time at which the pulse has fully exited themedium.
E. Multiporous medium
Let us now consider a more complex porous medium (thanthe above homogeneous one) made of q different regions atthe pore scale, with different probabilities ki, with 1 � i � q,for the particles to be adsorbed. As a consequence, we nowfollow the deposited fractions si in each region. We can extendthe above approach for a homogeneous medium by assumingthat the complex flow allows to fully mix the suspension overa short distance, so that at any time, in each region, the sus-pended particle concentration is n in the different region types.The characteristic velocity of the flow through each region(i.e., Vi) may differ from V and we write it as βiV . Note thatfor a laminar (Stokes) flow the coefficients βi are independentof V . The set of equations describing the process is now:
∂n
∂t+ V
∂n
∂x= −∂s
∂t, (8a)
∂si
∂t= βikin(1 − si/s0,i )V, (8b)
where s = ∑p1 si and s0,i is the maximum number of deposited
particles in the region i.This approach appears particularly useful in the case of a
medium with a double porosity, i.e., with locally (at the porescale) two types of regions with respective probabilities ofadsorption k1 and k2. We consider the solution in the formof traveling waves of same constant velocity (V1) for s, n, andevery si. Due to mass conservation the relation (2) between V1
and V is still valid. This leads to the following dimensionlessset of equations:
N = S, (9a)
dS1
dX= −a(1 − S1)β1ξ1k1N, (9b)
dS2
dX= −a(1 − S2)β2ξ2k2N, (9c)
where the same definitions for S and N hold, with now s0 =s0,1 + s0,2, and with Si = si/s0,i and ξi = s0/s0,i for i = 1, 2. Itis important to keep the different factors in the right-hand sideof Eqs. (9b) and (9c) as they express different major physicaleffects: ξi represents the inverse of the fraction of adsorbedparticles in region of type i, βi the relative velocity in thisregion, and ki the specific probability of adsorption in thisregion.
Coupling equations (9b) and (9c) in particular provides thefollowing relationship between S1 and S2:
S2 = 1 − (1 − S1)u, (10)
where u = β2ξ2k2/β1ξ1k1. The solution for S1 as a function ofX may be obtained by inserting the expression (10) for S2 asa function of S1 in Eq. (9b) then solving for S1.
It is also possible to get an approximate solution in the caseof a small number of particles in regions of type 2 compared tothe number of particles in regions of type 1 (i.e., s0,2 � s0,1)and a lower probability of adsorption in regions 2 leading to adelay for the adsorption in these regions, i.e., S2 < S1. In thatcase, we have s2/s1 = (S2/S1)(s0,2/s0,1) � 1, so that S1 ≈ S,and the solution of the system (9a) and (9b) is similar to (5).We finally get
S1 ≈ (1 + exp aβ1ξ1k1X )−1, (11a)
S2 ≈ 1 − (1 + exp −aβ1ξ1k1X )−u. (11b)
The distribution of particle deposits in regions of type 2 isa transformation of the sigmoid (11a) into a curve of shapeclose to that of a sigmoid and positioned either behind thatdescribed by (11a), i.e., S2(X ) < S1(X ), for u < 1, or aheadof that described by (11a), i.e., S2(X ) < S1(X ), for u > 1. Inthe case u � 1, S2 approaches 1 only for −X values muchlarger than the characteristic length of the sigmoid S1, i.e.,1/β1ξ1k1, which means that the adsorption in regions of type2 is considerably delayed with regards to the adsorption inregions of type 1. The shape of the profile for region of type2 is shown in Fig. 1 for some values of λ and u. It is worthnoting that the profiles for both regions are very sensitiveto the values of these two parameters, which means that acomparison between theory and experiment might allow agood evaluation of the physical processes.
The deposited distributions after a pulse may be deduced,in the same way as for a homogeneous medium [see Eq. (6)],from the expressions (11a) and (11b). The deposited distribu-tions for a series of pulses then appear as traveling waves ofvelocity V2= n0V /s0 and of shapes given by (11a) and (11b)after dropping the factor a.
III. MATERIALS AND METHODS
A. Porous media and working fluid
The porous medium is made of monodisperse, spherical,borosilicate beads, with a diameter dg = 63 μm (see Fig. 12 inAppendix B), and a strongly negative (SiO− groups) surfacecharge. The beads are packed in disorder in a 1 × 1 × 20 mm3
square capillary at a volume concentration of 62%. Hence, wehave typically 15 bead diameters per sample width. Althoughthe solid phase at a local scale (bead) has a simple structure,the porous structure at a larger scale, i.e., including several
033074-5

G. GERBER, D. A. WEITZ, AND P. COUSSOT PHYSICAL REVIEW RESEARCH 2, 033074 (2020)
FIG. 3. View of adsorbed nanoparticles (white dots) onto thesurface of two beads in contact (radius: 60 µm). The inset showsa full view of a bead covered with nanoparticles. Images obtainedwith a Zeiss SEM Inlens on two beads extracted after a few injectioncycles, cleaning and drying (which may have induced some particlesdisplacement on the surface).
particles, is complex. One may nevertheless estimate an orderof magnitude of the mean pore size (dp) from the diameterof the largest sphere that can be inserted in the hole at thecenter of four neighboring spheres whose centers form atetrahedron: dp ≈ dg/6 ≈ 10 μm. We checked that the beadpacking structure did not change over the duration of our tests,so that we can rely on direct imaging of the local evolution ofthe porous media to measure particle deposition.
This porous medium is saturated with a fluid made of90% of DMSO (Dimethyl sulfoxide) in distilled water, lead-ing to a fluid of viscosity μ ≈ 3.3 mPa s and density ρ =1090 kg m−3. This fluid matches the refractive index of thebeads and allows for internal imaging of the 3D pack withthe help of confocal microscopy, a technique which proved tobe relevant for the study of fluorescent particles in 3D porousmedia [47,53].
B. Charged nanoparticles
The colloidal particles dispersed in the fluid are nanopar-ticles (Molday ION EverGreen CL-50Q02-6A-51 fromBioPAL Inc.) made of a magnetite core and a thick Dextranshell. These particles have a density ρS = 1250 kg m−3 anda high positive surface charge (C6 amine surface functional-ization) so that we expect strong electrostatic attractive forcesbetween them and the surface of the beads (see Fig. 3 for aview of the adsorbed particles). On the contrary, since theircharges are of the same sign, two particles strongly repel eachother when they approach one another. As a consequence,we only expect the formation of a monolayer of particlesadsorbed onto the bead surface, but with particles somewhatdispersed on the surface due to electrostatic repulsion betweenthem. The fluorescence of these particles is achieved thanksto additional surface groups (excitation/emission wavelengths505/515 nm). To estimate the mean particle size, the nanopar-ticles are imaged under SEM (scanning electron microscopy)after dispersion then drying on a clean surface (see Ap-
FIG. 4. Principle of the experiments: (top) successive pulses ofsuspensions and pure fluid, and imaging in a longitudinal cross-section of the porous medium; (bottom) elementary imaging stitchedtiles and local views inside the medium at the different stages of theexperiments.
pendix B). The particle diameter appears to range from 35to 120 nm with a mean size d = 60 nm (higher than given bythe supplier, i.e., 35 nm). Such a particle size is more than twoorders of magnitude smaller than the typical pore size, whichensures negligible clogging due to geometrical confinement(see Ref. [46]).
We prepared the suspension at a particle volume fractionn0 = 7.4 × 10⁻⁴, which is sufficiently large for a significantdeposition to occur over the typical duration of our tests,i.e., a few hours, and sufficiently small for hydrodynamicinteractions between them to be negligible [54].
C. Confocal imaging
A single argon-ion laser source is used to excite the flu-orophores of the nanoparticles, in a single plane 400 µmabove the capillary bottom. We image a large portion of thesample (1 mm × 10 mm) by stitching together successive1 × 1 mm2 square acquisitions (see Fig. 4). The time requiredto perform a complete scan over the medium being a fewminutes, significant evolution of the porous structure due toparticle adsorption may occur during this time. In order to fixthe structure during imaging we injected pulses of suspension,i.e., injection over a limited time, followed by pure fluid torinse the sample and subsequent imaging (see Fig. 4). Wechecked independently that the rinsing period does not modifythe deposition: the fluorescence signal during the injection ofpure fluid following a pulse does not evolve, meaning thatthe flushing step with pure fluid does not detach particlesalready deposited. Note that this approach allows to directlyand strictly image the deposited particles, instead of having todistinguish between suspended and deposited particles in theimages. This also proves the fundamental point that when theyare adsorbed somewhere the particles do not move anymore ordo not detach at any time during the flow.
The particles being smaller than our imaging resolution,we do not follow the number of adsorbed particles but the
033074-6

PROPAGATION AND ADSORPTION OF NANOPARTICLES … PHYSICAL REVIEW RESEARCH 2, 033074 (2020)
fluorescence (summing the intensity over all pixels) in cross-sectional layers which can be considered as proportional to theparticle concentration. We thus obtain a distribution (profile)of deposited particle concentration along the porous mediumaxis.
D. Flow characteristics
The volume of the pulses is adjusted to have a significantchange of the signal between two successive pulses, and isconstant for all our tests, i.e., 20 µL. The volume used forrinsing is chosen so as to apparently remove all suspendedparticles, i.e., 80 µL. The flow rate (Q) was varied in the range1.3−208 μl min−1, giving a mean flow velocity through thepores V = Q/S (with S the sample cross-section area) in therange 0.055−8.8 mm s−1. With the successive injection cyclesthe total duration of an experiment ranged from about one tonine hours.
The Reynolds number of the flow, i.e., ρV dp/μ, is in therange 0.00017–0.027, which means that the flow is laminar.The particles have a density larger than that of the fluid buttheir characteristic velocity of sedimentation through the fluidat rest [i.e., 2(ρS − ρ)g(d2/4)/9μ] is equal to 10−10m s−1.This means that it would take about 105s for a particle to fallover a distance equal to the pore size under gravity. Such avalue is much larger than the average duration of its motionthrough the porous medium (L/V , in which L is the samplelength), i.e., between 2 and 360 s. Thus, even over the largestpossible distance inside the medium sedimentation is negligi-ble. Moreover, the ratio of the particle inertia to the typicalwork of viscous forces over a distance equal to the particlesize, is equal to about 1/10 of the Reynolds number. Thismeans that this ratio is far much smaller than 1 and thus par-ticle inertia plays a negligible role on the particle motion. Atlast, the diffusion coefficient of the particles, estimated fromthe Stokes-Einstein expression, i.e., D = kBT /3πμd , wherekB = 1.38 × 10⁻²³J K−1 is the Boltzmann constant and T ≈293 K is the room temperature, is equal to 2.2 × 10⁻¹²m2 s−1.The characteristic time for a particle to move through a porethanks to fluid motion is dp/V , while the characteristic timefor a particle to move over a distance of the order of the poresize thanks to thermal agitation is d2
p/D. The ratio of thesetwo times is the Peclet number, i.e., V dp/D, which is herein the range 250–40 000. This means that particle diffusiondue to thermal agitation is fully negligible in comparison toadvection processes.
Turbulence, inertia, sedimentation, and diffusion due tothermal agitation being negligible, the particles are essentiallycarried by the liquid and follow the paths imposed by the fluidflow. There is nevertheless one additional effect which canmake them deviate from these paths, namely the electrostaticinteractions between the particles and the bead surfaces.
E. Adsorption
Let us consider the interaction between a particle anda charged bead surface. The electrostatic field induced bya single bead can be determined from the Gauss theorem,it is equal to E = −q/4πε0(R + x)2, in which ε0 = 8.9 ×10⁻¹²F m−1, R = d/2, −q the total charge on the bead, and
x the distance from the bead surface. The resulting (attractive)force on the charged particle is then eE (with e the particlecharge). It follows that a particle situated at some distancefrom the bead will be progressively dragged towards thissurface. A particle is in fact surrounded by beads whichfinally induce a more complex electrostatic field resultingfrom the sum of the elementary fields. It follows that the forceacting on the particle whose position is r, is equal to Fe =−(eq/4πε0)
∑i |r − ri|−3(r − ri ), where the sum is taken on
all beads in the sample, whose center positions are given byri. On the other side, a particle moving relatively to the fluid atrest experiences a drag force equal to Fd = −6πμRr. Finally,a particle initially at rest in the fluid and situated at r0, willhave a motion described by the fundamental law of mechan-ics: mr = Fd + Fe. The solution of this equation taking intoaccount the initial condition provides the time �t (r0) for theparticle to reach the solid surface of one of the closest beads,i.e., those forming the wall of the pore containing the particle.This is more generally the characteristic time for a particle tobe adsorbed onto a solid surface.
On the other side, the characteristic time spent in a pore bya particle moving with the fluid is �tv = dp/V . We can thendetermine the domain (a surface) of the different positions r0
at the entrance of the pore for which �tv < �t (r0). Whenthe particle appears in this domain it will ultimately reach asolid surface within the duration of the flow through the pore.The ratio of this surface to the total surface of entrance in thepore, finally represents the probability to reach a solid surfaceduring the particle motion through the pore.
Obviously, we expect that this probability decreases whenthe flow velocity is increased. For example, let us considerthe simplistic case of a particle moving parallel to a beadsurface (i.e., its trajectory remains tangential to the beadsurface) as a result of liquid flow, and initially situated at adistance x0. Neglecting inertia and the other beads we findthat the approach to the bead is described from the equation:0 = −6πRμx − eq/4πε0(R + x)2, in which x is the currentdistance from the bead surface. Integrating this equationand assuming at first order that all distances remain smallcompared to R we get the time for the particle to reach thebead surface: �t (x0) = Kx0, with K = 24π2R3με0/eq. Sincethe time spent by the particle in the pore is approximatelydp/V , all particles initially situated at a distance smaller thanxc = (dp/K )V −1 should reach and stop on the pore surfacebefore they can exit the pore, while the others will exit thepore. However, when xc is larger than the pore size, i.e., forsufficiently low velocity, the probability to reach the pore wallis equal to 1. In this asymptotic case, we should observe astraight front of deposition. Otherwise, i.e., in the generalcase, the probability of adsorption of a particle entering thepore is proportional to xc/dp = (1/K )V −1.
During the flow of a suspension through the porousmedium the particles thus progressively adsorb to the beadsurface. However, as soon as a particle encounters anotherparticle, they strong repel each other. As a consequence, weexpect only the formation of a monolayer of adsorbed parti-cles. This implies that the concentration of particles increasesuntil no new particle reaching the bead can find a sufficientroom to be submitted to the attraction of the bead surfaceand at the same time sufficiently far from other particles. This
033074-7

G. GERBER, D. A. WEITZ, AND P. COUSSOT PHYSICAL REVIEW RESEARCH 2, 033074 (2020)
FIG. 5. Raw confocal images after successive cycles (suspension pulse + rinse) of injection starting from clean sample. Flow from left toright. Flow rate: Q = 13 μL/min (V = 0.55 mm/s).
situation (i.e., maximum concentration) corresponds to whatwe will call the saturation, even if we ignore the exact valueof the concentration of particles in such a case.
IV. EXPERIMENTAL RESULTS AND DISCUSSION
A. Global flow characteristics
Let us look at a typical series of confocal images takenafter successive cycles (see Fig. 4). Each image is composedof dark areas (no fluorescence, i.e., no adsorbed particles) andbright areas (containing adsorbed particles). At the inlet (farleft, dotted white line), a sharp transition from dark to brighthighlights the transition between the inlet tubing (no beads,particles cannot adsorb) and the porous system (particlesmeet solid surfaces and start adsorbing). The image is thebrightest around the porous medium entrance and decreasestowards the right (flow direction) up to a completely blackregion, where a priori no particles deposited (see Fig. 5).Globally, after each new cycle (pulse + rinse), the imagebecome brighter at larger distance, indicating that the particlesprogressively deposit farther in the sample. This is confirmedby the corresponding distributions of fluorescence intensity,which extend towards larger distance for successive cycles(see Fig. 6). Interestingly, the intensity near the entrancedoes not evolve with further injections: it seems to saturate(see Figs. 5 and 6). This observation is consistent with theassumption of a mono-layer formed by adsorption on the beadsurface. Here we can consider that the signal at saturationcorresponds to the maximum coverage that may be reachedunder such circumstances (i.e., suspension flow).
We then represent the fluorescence distribution rescalingthe signal by the mean value of the plateau level progres-sively formed from the entrance (see Fig. 6). One can nowobserve more precisely the progressive spreading towardslarger distance along with the extension of a plateau fromthe medium entrance. It is interesting to note that, in theplateau region, the profiles converge towards the same curve
exhibiting (fixed) fluctuations due to slight density hetero-geneities of the bead packing: this proves that the numberof deposited particles in the saturated region vary negligiblyfrom one test to another, and finally shows the reliabilityof our measurements. Moreover, the shape of the front ofthe profile remains approximately similar for the differentcycles (see Fig. 6), in agreement with our assumption oftraveling waves propagating through the sample. At last, theprofiles can be rather well represented by the expression (6)corresponding to the model for a homogeneous sample (seeFig. 6).
FIG. 6. Distribution of adsorbed particles (thick continuouslines) as a function of the distance along the porous mediumafter different numbers of injection cycles (from left to right)(V = 0.55 mm/s) : 1, 2, 3, 4, 5, 8, and 11. The signal intensity hasbeen rescaled by the plateau value reached at short distance. Thedashed lines correspond to the model fitted to data, i.e., Eq. (6), with1/k = 0.87 cm, and a shift along the sample axis associated with thetotal injected volume of particles after each number of injections.
033074-8

PROPAGATION AND ADSORPTION OF NANOPARTICLES … PHYSICAL REVIEW RESEARCH 2, 033074 (2020)
FIG. 7. Saturation as a function of distance in porous medium(after shifting, see text) for different flow velocities. For the sakeof clarity, we removed the part of the curves corresponding to theplateau reached at small distances. The dashed lines correspond tothe model (5) fitted to data with values for 1/k shown in the inset asa function of the flow velocity.
Data for different flow rates were collected, again afterdifferent cycles of injection. Similar results were obtainedfor the different flow rates: the profiles of fluorescence dis-tribution extend at larger depth with successive cycles; thesedifferent profiles can be shifted and superimposed along amaster curve for each flow rate (see Fig. 7). The fundamentalimpact of velocity thus clearly appears in this representation:the master profile extends over larger distance when the flowrate increases. Moreover, our model well represents theseprofiles for the different velocities in this range covering morethan two orders of magnitude, which provides a good supportto the theory. At last, the parameter 1/k fitted to data appearsto vary approximately with V 1/2, which means that 1/k wouldbe proportional to V −1/2. This result differs from that obtainedin the case of a flow around a single bead (i.e., V −1) (seeabove) but is qualitatively consistent with the expectations inthe general case, i.e., decrease with velocity increase.
B. Flow in confined regions
So far, the confocal images have been treated as a wholeto extract average deposition profiles over time and distancealong the porous medium. Actually, the same data may beused to study some local specificities of adsorption. A closerlook [see Fig. 8(b)] to the adsorption distribution from animage taken in a region of significant deposition for a typicalexperiment [see Fig. 8(a)] shows, as expected, depositedparticles outlining the surface of the silica beads in the form ofcircles (i.e., along the intersection between the imaging planeand the beads). The interior of these circles appears naturallydarker, since the signal here comes from close particles notsituated in the main optical focus plane.
We can nevertheless remark on the same picture somesmall regions much darker than the rest of the frame [seeFig. 8(b)]. From a higher resolution shot of a similar zonethe dark regions appear clearly around points of contact
FIG. 8. Deposition state for V = 0.55 mm s−1, cycle 3: (a) globalview and (b) selected window [white region in (a)] of the global view.White arrows pinpoint the dark regions.
between neighboring beads (see Fig. 9). These regions exhibitdifferent shapes depending on the relative orientation of theplane tangent to the two beads in contact and the plane ofobservation (confocal image). Large (circular) areas appearwhen these two planes are parallel, while elliptic regions areobserved when they are not parallel, these ellipses tending toa line when the two planes are perpendicular. Remarkably,this shows that such dark regions may be obtained along anyorientation of the contact between neighboring particles, i.e.,they are mostly independent of the flow direction. Never-theless note that we can observe a slight effect of the flow:these regions often exhibit a thin tail in the flow direction (seeFig. 8); but we will not discuss further this effect here.
From images taken at successive times in the same windowone can see that the apparent size of these regions changes
FIG. 9. High-resolution confocal imaging of the deposited distri-bution of Fig. 6, obtained by collecting the fluorescence signal from asample thickness three times larger. Three types of darker areas maybe distinguished: (a) disks, corresponding to contact plane parallelto the imaging plane, (c) lines, corresponding to contact planeperpendicular to the imaging plane, and (b) ellipses for intermediateorientations. (d) shows a thin tail.
033074-9
G. GERBER, D. A. WEITZ, AND P. COUSSOT PHYSICAL REVIEW RESEARCH 2, 033074 (2020)
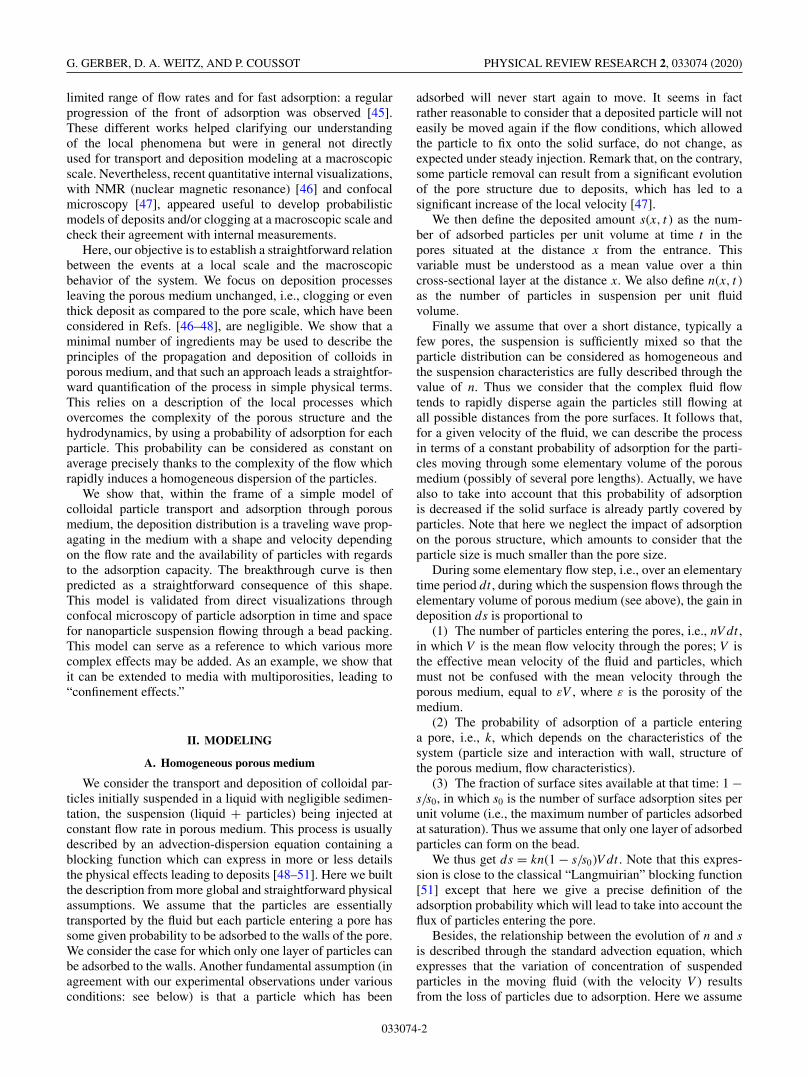
FIG. 10. Confinement effect at V = 0.55 mm/s : (a) images in asmall window at different times from the beginning of injection (fromtop to bottom: 5, 11, and 23 min.); (b) average signal (rescaled by thesaturation value) recorded as a function of the distance from the pointof contact at different times (every 25 seconds) (from bottom to top).All data around the point of contact have been taken into account,which explains the symmetrical representation. The thick red dottedlines correspond to the times at which the images of (a) have beenobtained.
as deposition progresses [see Fig. 10(a)], as if the adsorbedparticles invaded progressively these regions. A further look atthe local distribution of the signal around the point of contactbetween the beads provides a deeper insight in the process[see Fig. 10(b)]. At a sufficient distance (say, beyond ≈8 μm,i.e., in region A) from the point of contact the deposition isfast. At shorter distance (i.e., in the region B) the depositionis much slower. These data thus show that the region ofthe bead surface beyond some distance (i.e., ≈8 μm) fromthe point of contact is much more rapidly saturated thanthe inner region, which suggests that the coverage of thedark areas has a different dynamics than the rest of the beadsurface. Finally, looking at the deposition profile we see that itprogressively spreads towards the point of contact, in the formof a saturated front (maximum adsorption) [see Fig. 10(b)].This in particular means that the description of the adsorptionprocess in these regions, in the form of a progressive reductionof the size of the empty domain, is a good approximation.
It is clear that the dark regions correspond to the regionsof the surface of the beads for which the surrounding liquidis the most confined, i.e., situated at the smallest distancefrom the solid surfaces. This obviously suggests that the effectobserved, i.e., the slower dynamics of adsorption in theseregions, is due to this confinement. Actually, several effectsresulting from this confinement may tend to slow down theadsorption dynamics. The first effect of confinement is a ratioof liquid volume to solid surface lower than in the rest of thesample. As a consequence, for a similar particle concentrationin the liquid volume, the covering of a unit bead surface in theconfined region will be slower than elsewhere. Another effectof confinement is that particles necessarily need to move closeto already adsorbed particles to reach deeper regions (closerto the contact point). Thus they can be somewhat repelled bythese particles, which would slow down their access to deeperregions. Another effect directly reduces the concentration ofadsorbed particles in these regions: the particles are stoppedat some distance from the contact point because the distance
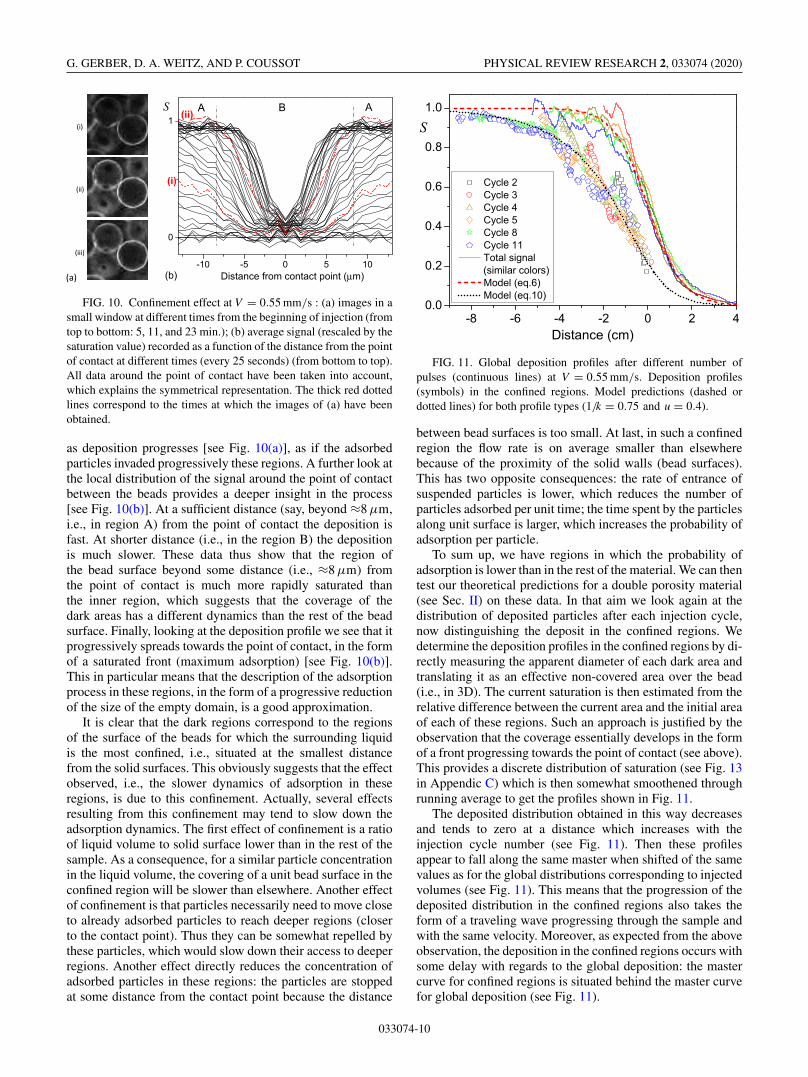
FIG. 11. Global deposition profiles after different number ofpulses (continuous lines) at V = 0.55 mm/s. Deposition profiles(symbols) in the confined regions. Model predictions (dashed ordotted lines) for both profile types (1/k = 0.75 and u = 0.4).
between bead surfaces is too small. At last, in such a confinedregion the flow rate is on average smaller than elsewherebecause of the proximity of the solid walls (bead surfaces).This has two opposite consequences: the rate of entrance ofsuspended particles is lower, which reduces the number ofparticles adsorbed per unit time; the time spent by the particlesalong unit surface is larger, which increases the probability ofadsorption per particle.
To sum up, we have regions in which the probability ofadsorption is lower than in the rest of the material. We can thentest our theoretical predictions for a double porosity material(see Sec. II) on these data. In that aim we look again at thedistribution of deposited particles after each injection cycle,now distinguishing the deposit in the confined regions. Wedetermine the deposition profiles in the confined regions by di-rectly measuring the apparent diameter of each dark area andtranslating it as an effective non-covered area over the bead(i.e., in 3D). The current saturation is then estimated from therelative difference between the current area and the initial areaof each of these regions. Such an approach is justified by theobservation that the coverage essentially develops in the formof a front progressing towards the point of contact (see above).This provides a discrete distribution of saturation (see Fig. 13in Appendic C) which is then somewhat smoothened throughrunning average to get the profiles shown in Fig. 11.
The deposited distribution obtained in this way decreasesand tends to zero at a distance which increases with theinjection cycle number (see Fig. 11). Then these profilesappear to fall along the same master when shifted of the samevalues as for the global distributions corresponding to injectedvolumes (see Fig. 11). This means that the progression of thedeposited distribution in the confined regions also takes theform of a traveling wave progressing through the sample andwith the same velocity. Moreover, as expected from the aboveobservation, the deposition in the confined regions occurs withsome delay with regards to the global deposition: the mastercurve for confined regions is situated behind the master curvefor global deposition (see Fig. 11).
033074-10

PROPAGATION AND ADSORPTION OF NANOPARTICLES … PHYSICAL REVIEW RESEARCH 2, 033074 (2020)
Let us now consider the number of particles expected tobe adsorbed in these regions. The maximum area of eachof these regions typically corresponds to a spherical cap ofapparent radius rc ≈ 8 μm, and the number of contacts of onebead with other beads is around 6 in a disordered packing. Asa consequence, the fraction of bead surface associated withsuch regions expresses as 3(rc/R)2/
√1 − (rc/R)2 ≈ 0.2. This
might represent the fraction of coverage associated with theseregions, i.e., s0,2/s0, but we can expect that the effective valueis lower, due to a more difficult access to some adsorption sitesat the approach of the contact point, as a result of electrostaticinteractions and geometrical confinement. Assuming for ex-ample that the deposit of particles is hindered in a sphericalcap of radius 4 μm [see Fig. 10(b)], we get a new fractionof coverage of these regions equal to 0.15. In addition, weclearly observe experimentally a delay between the depositin these regions and on the rest of the surface, thus S2 < S1.Under these conditions, considering that s ≈ s1 constitutes areasonable approximation.
In this context it is justified to use Eq. (5) to represent theglobal deposition profile as we did so far, and then transformit through (10) by fitting the parameter u. We can see that thisallows to well represent the stationary deposition distribution(see Fig. 11). In this way we get u = 0.35. The physical originof this value may now be analyzed. Let us recall that thetheoretical expression for u is β2ξ2k2/β1ξ2k1. We have ξ2/ξ1 =s0,1/s0,2, i.e., the ratio of maximum coverage of the two regiontypes, which according to the above analysis should be of theorder of 5. k2/k1 is the ratio of adsorption probabilities on thetwo surface types. As we excluded the region the closest tothe contact point in our estimation of s0,2 we kept a domainin which the impact of confinement on the probability ofadsorption under given flow velocity should be rather low withregards to that in the rest of the material, the only effect beinga smaller ratio of volume to surface. Thus, it is considered herethat the difference between k2 and k1 essentially comes fromthe difference of velocities in the different regions, so thatwe expect k2/k1 ≈ (V1/V2)1/2. At last we have β2/β1 = V2/V1,so that u ≈ 5(V2/V1)1/2. The point is now to estimate thecharacteristic velocity in each region V1 and V2. At as firstapproximation, from the Poiseuille law, we can consider thatunder similar pressure drop along one bead the mean velocitywill vary with the square size of the pore. A simple result isthen obtained for a “standard” pore, whose size was estimatedto be 1/6 of the bead diameter. But a similar estimation isnot straightforward for the confined regions, which makesus realize the limitations of the model: in these regions thedistance between walls continuously decreases towards zeroat the approach of the point contact. This suggests that fora more precise approach we should consider such regionsas a continuum of media of decreasing pore size. Such asophisticated approach nevertheless does not seem relevantwith regards to the precision of our data. Coming back to theestimation of a single pore size for the confined regions we canconsider that it corresponds to the gap between two beads ata distance of 5 microns of their point of contact. This givesa characteristic pore size of dp2 = 0.8 μm, and finally u ≈5(V2/V1)1/2 = 5dp2/dp = 0.4, a value almost exactly equal tothat found from the data (0.35), which confirms the validity ofour approach.
Finally, we can now evaluate the validity of the model topredict the data concerning confined regions for other flowvelocities. For V � 5.5 m s−1, the delay to fill the confinedregions was too large consistently with the above model (seeFig. 1) so that we could not observe it clearly within ourtest duration. For V = 0.05 m s−1 we would observe againthat the profiles for the confined regions advance as travelingwaves with the same velocity as the global profiles. Moreover,at our scale of observation the profiles are rather close tothe global profile and their shape is well represented bythe model keeping approximately the same value (0.4) foru, which confirms the consistency of the above model (seeexpected profiles in Fig. 1), but the scattering on data doesnot allow to give a precise estimation of this parameter in thatcase.
V. CONCLUSION
We proposed a simple probabilistic model for the trans-port and desposition of colloidal particles in porous medium.This model predicts that after some distance of injection thedeposition distribution is a traveling wave propagating inthe medium with a shape (frontal or extended) and velocitydepending on the flow rate and the availability of particleswith regards to the adsorption capacity. This model can serveas a reference model in which various additional effects maybe included, such as a multiporosity leading to confinementeffects. Besides we carried out original direct visualizationsthrough confocal microscopy of particle adsorption in timeand space for nanoparticle suspensions flowing through a beadpacking. This made it possible to measure the evolution ofthe deposition profiles in time distinguishing the deposition inconfined regions. The model appears to successfully predictthe different trends: traveling wave, deposition profile shape,profiles of deposition in confined regions.
The model relies on simplifying assumptions, such as noparticle removal after adsorption, negligible diffusion, inertiaand sedimentation, sufficient length of the initial pulse, etc,which have been verified in the experimental setup. How-ever, the interest of the model is that it describes the mainphysical effects through a reduced set of parameters whichencompasses several physicochemical effects. There is in-deed one fundamental parameter, i.e., the characteristic lengthof the deposition profile, which appears to encompass thesuspension concentration, the adsorption probability and thenumber of adsorption sites. A second parameter appears whenconfinement effects are taken into account, which describesthe relative capacities of adsorption of the different media. Inthis context it is possible to directly test the impact of varyingone physicochemical aspect, by looking at the variation itinduces on each of the two above parameters.
The general objective of this approach is to have a globalapproach of colloid transport, leaving apart as a first stepthe details of the physicochemistry, and instead taking intoaccount their effects globally, in the spirit of the approachof Ref. [55], but in a different way, by identifying the mainphysical mechanisms. In particular, we suggest that the shapeof breakthrough curves could be studied with the help of sucha model.
033074-11

G. GERBER, D. A. WEITZ, AND P. COUSSOT PHYSICAL REVIEW RESEARCH 2, 033074 (2020)
APPENDIX A: GENERAL SOLUTIONOF THE SET OF EQUATIONS (1)
Here we reproduce the solution of (1) as given by Leij et al.[52] for a pulse of duration �t :
n(x, t ) = n0
G(x, t ){H[x − V (t − �t )] − H (x − V t )}
× exp
[kn0
s0(V t − x)
],
s(x, t ) = s0 − s0
G(x, t )exp (kx)
with H the Heavyside function, and
G(x, t ) = exp (kx) − H (vt − x)
+{H[x − V (t − �t )] − H (x − V t )}
× exp
[kn0
s0(V t − x)
]
+ H[V (t − �t ) − x] exp
(kn0V t
s0
).
For a very long pulse (�t → ∞), we have H (x − V (t −�t )) = 1, so that the solution for s, i.e., the distribution ofparticles deposited at a given time, writes
s(x < V t ) = s0 − s0
1 + exp[ kn0
s0(V t − x) − kx
] − exp −kx,
s(x > V t ) = 0.
Under the condition that kn0V t � s0 the last term in thedenominator is negligible and we find an expression whichcan be rearranged as Eq. (5) by defining V1 in the same wayas in Eq. (2). From a similar approach we can find the sameresult for n.
We can also find the deposited distribution after the passageof a pulse of duration �t . In that aim, we look at the depositedvalue at the time t for which the back of the pulse was situatedat the distance x, which is such that x = V (t − �t ). Afterinsertion in the above expression for the general solution, wefind
S∗ = 1
1 + A exp[k(x − n0V �t/s0)],
with
A = 1
1 − exp(−kn0V �t/s0),
which may be approximated by Eq. (6) under the conditionthat kn0V �t � s0, i.e., a sufficiently long pulse.
APPENDIX B: PARTICLE SIZE DISTRIBUTION
The particle size distribution [see Fig. 12(b)] was deducedby analyzing SEM views of the particles dried on a flat silicasurface [see Fig. 12(a)].
APPENDIX C: RAW DATA FOR SATURATION INCONFINED REGION
The data of Fig. 11 for confinement effects have beenobtained by smoothening the raw data, which were obtainedfor each point of contact observed by confocal microscopy(see Fig. 13).
FIG. 12. View of the particles (a) and size distribution (b).
FIG. 13. Raw data (each point corresponds to a confined area)for saturation as a function of distance from medium entrance inconfined region for V = 0.55 m s−1 after different pulse cycles.
033074-12

PROPAGATION AND ADSORPTION OF NANOPARTICLES … PHYSICAL REVIEW RESEARCH 2, 033074 (2020)
[1] Z. Cai, J. Kim, and M. M. Benjamin, NOM removal by ad-sorption and membrane filtration using heated aluminum oxideparticles, Environ. Sci. Technol. 42, 619 (2008).
[2] R. K. Iler, Multilayers of colloidal particles, J. Colloid InterfaceSci. 21, 569 (1966).
[3] C. Tien and B. V. Ramarao, Granular Filtration of Aerosols andHydrosols, 2nd ed. (Elsevier, Amsterdam, 1989).
[4] N. P. Cheremisinoff, Liquid Filtration, 2nd ed. (Butterworth-Heinemann, Boston, 1998).
[5] M. B. Rothberg, Coronary artery disease as clogged pipes: amisconceptual model, Circ. Cardiovasc. Qual. Outcomes 6, 129(2013).
[6] R. C. Valentine and A. C. Allison, Virus particle adsorption.I. Theory of adsorption and experiments on the attachment ofparticles to non-biological surfaces, Biochim. Biophys. Acta 34,10 (1959).
[7] A. G. Matthysse, Attachment of Agrobacterium to plant sur-faces, Front. Plant Sci. 5, 252 (2014).
[8] M. G. Gabridge, Attachment of Mycoplasma pneumoniae totracheal monolayer outgrowths, Yale J. Biol. Med. 56, 657(1983).
[9] C. Bianco, J. E. Patiño Higuita, T. Tosco, A. Tiraferri, and R.Sethi, Controlled deposition of particles in porous media foreffective aquifer nanoremediation, Sci. Rep. 7, 12992 (2017).
[10] J. A. C. Barth et al., Mobility, turnover and storage of pollutantsin soils, sediments and waters: Achievements and results of theEU project AquaTerra – A review, Agron. Sustainable Dev. 29,161 (2009).
[11] S. A. Bradford and M. Bettahar, Straining, attachment anddetachment of Cryptosporidium oocysts in saturated porousmedia, J. Environ. Qual. 34, 469 (2005).
[12] T. Sparks, Solid-Liquid Filtration: A User’s Guide to Minimiz-ing Cost and Environmental Impact; Maximizing Quality andProductivity, 1st ed. (Butterworth-Heinemann, Oxford, 2012).
[13] G. Keir, V. Jegatheesan, and S. Vigneswaran, Deep bed filtra-tion: Modelling theory and practice, in Water and WastewaterTreatment Technologies, edited by S. Vigneswaran (EOLSS,Oxford, 2009).
[14] J. H. Masliyah and S. Bhattacharjee, Electrokinetic and ColloidTransport Phenomena, (Wiley, New York, 2005).
[15] R. F. Probstein, Physicochemical Hydrodynamics: An Introduc-tion (Wiley-Interscience, Hoboken, 2003).
[16] F. Kuhnen, K. Barmettler, S. Bhattacharjee, M. Elimelech, andR. Kretzschmar, Transport of iron oxide colloids in packedquartz sand media: Monolayer and multilayer deposition, J.Colloid Interface Sci. 231, 32 (2000).
[17] D. Liu, P. R. Johnson, and M. Elimelech, Colloid deposi-tion dynamics in flow-through porous media: Role of elec-trolyte concentration, Environmental Sci. Technol. 29, 2963(1995).
[18] J. N. Ryan and P. M. Gschwend, Effects of ionic strengthand flow rate on colloid release: Relating kinetics to inter-surface potential energy, J. Colloid Interface Sci. 164, 21(1994).
[19] M. W. Hahn, D. Abadzic, and C. R. O’Melia, Aquasols: Onthe role of secondary minima, Environ. Sci. Technol. 38, 5915(2004).
[20] D. Grolimund and M. Borkovec, Long-term release kineticsof colloidal particles from natural porous media, Environ. Sci.Technol. 33, 4054 (1999).
[21] D. Grolimund, M. Elimelech, and M. Borkovec, Aggregationand deposition kinetics of mobile colloidal particles in naturalporous media, Colloids Surf. A 191, 179 (2001).
[22] S. Redner and S. Datta, Clogging Time of a Filter, Phys. Rev.Lett. 84, 6018 (2000).
[23] B. Mustin and B. Stoeber, Deposition of particles frompolydisperse suspensions in microfluidic systems, Microfluid.Nanofluid. 9, 905 (2010).
[24] C.-H. Ko and M. Elimelech, The “shadow effect” in colloidtransport and deposition dynamics in granular porous media:Measurements and mechanisms, Environmental Sci. Technol.34, 3681 (2000).
[25] H. Ma, E. Pazmino, and W. P. Johnson, Surface heterogene-ity on hemispheres-in-cell model yields all experimentally-observed non-straining colloid retention mechanisms in porousmedia in the presence of energy barriers, Langmuir 27, 14982(2011).
[26] K.-M. Yao, M. T. Habibian, and C. R. O’Melia, Water and wastewater filtration. Concepts and applications, Environmental Sci.Technol. 5, 1105 (1971).
[27] S. A. Bradford and F. J. Leij, Modeling the transport and re-tention of polydispersed colloidal suspensions in porous media,Chemical Eng. Sci. 192, 972 (2018).
[28] P. Babakhani, J. Bridge, R. A. Doong, and T. Phenrat,Continuum-based models and concepts for the transport ofnanoparticles in saturated porous media: A state-of-the-sciencereview, Adv. Colloid Interface Sci. 246, 75 (2017).
[29] E. T. de Vries, A. Raoof, and M. T. van Genuchten, Multiscalemodelling of dual-porosity porous media; a computational pore-scale study for flow and solute transport, Adv. Water Resources105, 82 (2017).
[30] R. Kretzschmar, K. Barmettler, D. Grolimund, Y. D. Yan,M. Borkovec, and H. Sticher, Experimental determina-tion of colloid deposition rates and collision efficienciesin natural porous media, Water Resources Res. 33, 1129(1997).
[31] M. Elimelech, Kinetics of capture of colloidal particles inpacked beds under attractive double layer interactions, J.Colloid Interface Sci. 146, 337 (1991).
[32] A. Franchi and C. R. O’Melia, Effects of natural organic matterand solution chemistry on the deposition and reentrainmentof colloids in porous media, Environ. Sci. Technol. 37, 1122(2003).
[33] Y. Tan, J. T. Gannon, P. Baveye, and M. Alexander, Transport ofbacteria in an aquifer sand: Experiments and model simulations,Water Resour. Res. 30, 3243 (1994).
[34] B. Dersoir, M. R. de Saint Vincent, M. Abkarian, and H.Tabuteau, Clogging of a single pore by colloidal particles,Microfluid. Nanofluidics 19, 953 (2015).
[35] A. Sauret, K. Somszor, E. Villermaux, and E. Dressaire, Growthof clogs in parallel microchannels, Phys. Rev. Fluids 3, 104301(2018).
[36] A. G. Konstandopoulos, Deposit growth dynamics: particlesticking and scattering phenomena, Powder Technol. 109, 262(2000).
[37] O. Liot, A. Singh, P. Bacchin, P. Duru, J. F. Morris, and P.Joseph, Pore cross-talk in colloidal filtration, Sci. Rep. 8, 12460(2018).
[38] Z. B. Sendekie and P. Bacchin, Colloidal jamming dynamics inmicrochannel bottlenecks, Langmuir 32, 1478 (2016).
033074-13

G. GERBER, D. A. WEITZ, AND P. COUSSOT PHYSICAL REVIEW RESEARCH 2, 033074 (2020)
[39] E. Dressaire and A. Sauret, Clogging of microfluidic systems,Soft Matter 13, 37 (2017).
[40] N. Ochiai, E. L. Kraft, and J. S. Selker, Methods for colloidtransport visualization in pore networks, Water Resour. Res. 42,W12S06 (2006).
[41] A. P. Lehoux, S. Rodts, P. Faure, E. Michel, D. Courtier-Murias, and P. Coussot, Magnetic resonance imaging measure-ments evidence weak dispersion in homogeneous porous media,Phys. Rev. E 94, 053107 (2016).
[42] T. Baumann and C. J. Werth, Visualization of colloid transportthrough heterogeneous porous media using magnetic resonanceimaging, Colloids Surf. A 265, 2 (2005).
[43] T. Bhattacharjee and S. Datta, Confinement and activity regulatebacterial motion in porous media, Soft Matter 15, 9920 (2019).
[44] T. Bhattacharjee and S. Datta, Bacterial hopping and trappingin porous media, Nat. Commun. 10, 2075 (2019).
[45] A. P. Lehoux, P. Faure, E. Michel, D. Courtier-Murias, S. Rodts,and P. Coussot, Transport and adsorption of nano-colloids inporous media observed by magnetic resonance imaging, Transp.Porous Media 119, 403 (2017).
[46] G. Gerber, S. Rodts, P. Aimedieu, P. Faure, and P. Coussot,Particle-Size-Exclusion Clogging Regimes in Porous Media,Phys. Rev. Lett. 120, 148001 (2018).
[47] G. Gerber, M. Bensouda, D. A. Weitz, and P. Coussot, Self-Limited Accumulation of Colloids in Porous Media, Phys. Rev.Lett. 123, 158005 (2019).
[48] P. R. Johnson and M. Elimelech, Dynamics of colloid depo-sition in porous media: Blocking based on random sequentialadsorption, Langmuir 11, 801 (1995).
[49] Z. Adamczyk, M. Nattich-Rak, M. Sadowska, A. Michna,and K. Szczepaniak, Mechanisms of nanoparticle and biopar-ticle deposition–Kinetic aspects, Colloids and Surfaces:Physicochem. Eng. Aspects 439, 3 (2013).
[50] A. Massoudieh, N. Lu, X. Liang, T. H. Nguyen, and T. R. Ginn,Bayesian process-identification in bacteria transport in porousmedia, J. Contaminant Hydrology 153, 78 (2013).
[51] A. P. Lehoux, P. Faure, F. Lafolie, S. Rodts, D. Courtier-Murias, P. Coussot, and E. Michel, Combined time-lapse mag-netic resonance imaging and modeling to investigate colloiddeposition and transport in porous media, Water Res. 123, 12(2017).
[52] F. J. Leij, S. A. Bradford, Y. Wang, and A. Sciortino, Lang-muirian blocking of irreversible colloid retention: Analyticalsolution, moments, and setback distance, J. Environ. Qual. 44,1473 (2015).
[53] A. Anbari, H. T. Chien, S. Datta, W. Deng, D. A. Weitz,and J. Fan, Microfluidic Model Porous Media: Fabrication andApplications, Small 14, 1703575 (2018).
[54] G. K. Batchelor, An Introduction to Fluid Dynamics (CambridgeMath. Library, Cambridge, 2000).
[55] P. Bacchin, An energy map model for colloid transport,Chem. Eng. Sci. 158, 208 (2017).
033074-14