propagation model in indoor and outdoor for the lte...
TRANSCRIPT
Research ArticlePropagation Model in Indoor and Outdoorfor the LTE Communications
Sun-Kuk Noh 1 and DongYou Choi 2
1SW Convergence Institute, Chosun University, Gwangju, Republic of Korea2Dept. of Information and Communications, Chosun University, Gwangju, Republic of Korea
Correspondence should be addressed to DongYou Choi; [email protected]
Received 11 February 2019; Revised 29 April 2019; Accepted 14 May 2019; Published 16 June 2019
Academic Editor: Christoph F. Mecklenbrauker
Copyright © 2019 Sun-Kuk Noh and DongYou Choi. This is an open access article distributed under the Creative CommonsAttribution License, which permits unrestricted use, distribution, and reproduction in any medium, provided the original work isproperly cited.
Rapidly rising demand for radio communication and the explosion in the number of mobile communications service subscribershave led to the need for optimization in the development of fifth-generation (5G) mobile communication systems. Previous studieson the development of propagation models considering a propagation environment in the existing microwave band have beenmainly focused on analyzing the propagation characteristicswith regard to large-scale factors such as path losses, delay propagation,and angle diffusions. In this paper, we investigated the concept of spatial and time changes ratios in the measurement of wavepropagations and measured RSRP of Long Term Evolution (LTE) signals at three locations considering the time rate of 1% and50%. We confirmed the concept of spatial and time changes rate based on the results of analyzing the signal data measured andproposed the propagation models 1 and 2 in microcell downtown. The forecast results using proposed models 1 and 2 were betterthan the COST231 model in both indoor and outdoor measured places. It was predicted between a time rate of 1% and 50% indoorwithin 400m and outdoor within 200m. In the future, we will study the propagation model of 5G mobile communication as wellas the current 4G communication using artificial intelligence technology.
1. Introduction
Rapidly rising demand for radio communication and theexplosion in the number of mobile communications servicesubscribers have led to the need for optimization in thedevelopment of fifth-generation (5G)mobile communicationsystems. 5Gmobile systems will encompass frequencies from0.5 GHz to 100 GHz [1]. The development of competitive 5Gwireless transmission technology and efficient frequency-useresearch are based on understanding the characteristics ofthe exact radio channel. In terms of developments in nextgeneration mobile communication systems, performanceverification of the development system is essential, for whichit is necessary to estimate the exact wireless-space channel[2]. This is because this channel is based on the exact model,including elements of the wireless transmission applications,such as frequency, time, space, and polarization [3–8].
Previous studies on the development of propagationmodels considering a propagation environment in the exist-ing microwave band have been mainly focused on analyzing
the propagation characteristics with regard to large-scalefactors such as path losses, delay propagation, and anglediffusions [9–13]. However, considering the mobility of thesurrounding environment, the existing propagation modelsshow large prediction errors when predicting propagations;furthermore, it is difficult to compare the signal strength ofhomogeneous/heterogeneous systems by using such propa-gation models. Generally, in order to design a radio station,which can provide radio communication service with acertain level of quality, information on the radio signalpower and radio noise power in the applicable areas shouldbe obtained beforehand. In other words, it is required toobtain the information on the radio signals and noise inthe applicable areas to design communication systems thatensure that the communication service quality is higher thana certain standard. Therefore, it is required to consider thepropagation environment and mobility during propagationprediction. In addition, a time-varying propagation modelthat considers time and spatial changes is required when
HindawiInternational Journal of Antennas and PropagationVolume 2019, Article ID 3134613, 6 pageshttps://doi.org/10.1155/2019/3134613
2 International Journal of Antennas and Propagation
performing interference analysis using the results of thepropagation prediction [14].
In this study, we investigate the concept of spatial andtime changes rate in the measurement of wave propagationsand measure the reference signal receive power (RSRP) ofLong Term Evolution (LTE) signals at three locations indowntown considering the time rate of 1% and 50%. Weconfirm the concept of spatial and time changes rates basedon the results of analyzing the signal data measured. Basedon these results, we propose a propagationmodel consideringdistance and frequency inmicrocell downtown environment.
The rest of the paper is organized as follows: Section 2describes wave propagation model. Section 3 gives the prop-agation characteristics by considering the time and spatialchanges. Section 4 describes RSRPmeasurements and resultsanalysis. Section 5 describes proposal of propagation model.Finally, Section 6 is conclusions.
2. The Wave Propagation Model
The wave propagation model is based on the measure-ment results. This is because the measurement environmentincludes the shadowing parameter in a microcell urbanenvironment that includes multipath fading. In other words,the shadowing parameter is used for considering the signalpowers measured at two different locations even along thedistance between the same transceiver and the surroundingobjects; therefore, the path loss PL(d) in a specific locationhas random values with log-normal distribution. The generalform of the model is as follows.
PL (d) [dB] = PL (d) + X𝜎
= PL (do) + 10 × n × log( ddo) + X𝜎
(1)
In the above equation, n is path loss index, d is distancebetween base station (BS) and mobile station (MS), do isreference distance, and X𝜎 is a random variable with anaverage mean (m) of 0 and log-normal distribution withstandard deviation of 𝜎, wherein the log-normal distributionrepresents the shadowing effect. In addition, the transmissionmedium (communication channel)model can be representedin two parts as follows by designating themobile phone signalas r(t).
r (t) = m (t) 𝑟0 (𝑡)or 𝑟0 (𝑡) [dB] = r (t) −m (t) (2)
In (2), m(t) denotes long term fading, slow fading, andlog-normal fading, whose values vary according to the topog-raphy between the base station and the mobile terminal. A𝑟0(𝑡) denotes short term fading, fast fading, multipath fading,and Rayleigh fading, which occur owing to the reflectionsfrom the surrounding buildings or structures.
3. The Propagation Characteristics byConsidering the Time and Spatial Changes
The characteristics of the radio propagation signal accordingto time and space change rate can be defined as follows,similar to the radio fading rate, in ITU-R Recommendations[15, 16]. The ITU-R P. 1546 is a method for point-to-areapredictions for terrestrial services in the frequency range 30MHz to 3 000 MHz.
(1) Changes in the received signals are closely related tothe temporal and spatial characteristics.
(2) Measurements of the received signals must be per-formed for a considerable time at a fixed point.
(3) The expression and analysis of the measured signalsare represented in terms of the probability distribu-tion and statistical data obtained during the measure-ment time.
3.1. Time Changes Rate, Percentage of Time, pT%. In allmobile systems, the variations in the electric field strengthfor wave reception are mainly influenced by fading, and, inparticular, significant variations are observed in the short-wave band; therefore, automatic recording is continuouslyperformed at the general interval of 10–30 min becausemeasuring the electric field strength at a certain time isunnecessary. Subsequently, on the basis of these results, thepercentage (%) of time corresponding to a certain value indecibels (dB) or more is determined.
For example, when 50% value corresponds to 30 dB for10 min from the continuous measurement results, it impliesthat a value greater than 30 dB exists in the 5 min period outof the 10 min measurement time. The percentages of time arepurposely selected as 5%, 10%, 50%, 90%, 95%, etc.; however,50% is commonly selected as the percentage of time, and,therefore, it is also known as the median value. In order toprovide service coverage at any location, the received electricfield strength should be much higher than the minimallyrequired electric field strength.
3.2. Spatial Change Rate, Percentage of Location, pS%. Theline of sight (LOS) and non-line of sight (NLOS) wereconsidered in downtown areas by considering the applicablefrequencies (MHz) and distance (m) in the transmissionmeasurements for reflecting the spatial rates; the process insteps based on ITU-R P. 1411-5 is as follows [15].
𝐿𝑚𝑒𝑑𝑖𝑎𝑛𝐿𝑜𝑠
(d) = 32.45 + 20 log𝑓 + 20 log( d1000)
�L𝐿𝑜𝑆 (p) = 1.5624𝜎(√−2 ln (1 − 𝑝100) − 1.1774)
𝑤𝑖𝑡ℎ 𝜎 = 7𝑑𝐵𝐿𝐿𝑜𝑆 (d, p) = 𝐿𝑚𝑒𝑑𝑖𝑎𝑛
𝐿𝑜𝑆(𝑑) + �𝐿𝐿𝑜𝑆 (𝑝)
International Journal of Antennas and Propagation 3
Table 1: LoS and NLoS location variability corrections [15].
pS (%) �LLoS (dB) �LNLoS (dB) dLoS (m)1 -11.3 -16.3 97610 -7.9 -9.0 27650 0.0 0.0 4490 10.6 9.0 1699 20.3 16.3 10
𝐿𝑚𝑒𝑑𝑖𝑎𝑛𝑁𝐿𝑜𝑠
(d) = 9.5 + 45 log𝑓 + 40 log( d1000) + 𝐿𝑢𝑟𝑏𝑎𝑛
with 6.8𝑑𝐵 (𝑢𝑟𝑏𝑎𝑛) , 2.3𝑑𝐵 (𝑑𝑒𝑛𝑠𝑒 𝑢𝑟𝑏𝑎𝑛)�𝐿𝑁𝐿𝑜𝑆 (𝑝) = 𝜎𝑁−1 ( 𝑝
100) 𝑤𝑖𝑡ℎ 𝑖𝑡ℎ 𝜎 = 7𝑑𝐵𝐿𝑁𝐿𝑜𝑆 (d,p) = 𝐿𝑚𝑒𝑑𝑖𝑎𝑛
𝑁𝐿𝑜𝑆(𝑑) + �𝐿𝑁𝐿𝑜𝑆 (𝑝)
𝑑𝐿𝑜𝑆 (p) = 212 [log ( 𝑝100)2 − 64 log ( 𝑝
100)𝑖𝑓 𝑝 < 45
𝑑𝐿𝑜𝑆 (p) = 79.2 − 70 ( 𝑝100) 𝑜𝑡ℎ𝑒𝑟𝑤𝑖𝑠𝑒
(3)
(i) If d < 𝑑𝐿𝑜𝑆, then L(d,p) = 𝐿𝐿𝑜𝑆(𝑑, 𝑝).(ii) If d > 𝑑𝐿𝑜𝑆 + 𝑤, then L(d,p) = 𝐿𝑁𝐿𝑜𝑆(𝑑, 𝑝).(iii) Otherwise linearly interpolate between the values.
𝐿𝐿𝑜𝑆 (𝑑𝐿𝑜𝑆, 𝑝) , 𝐿𝑁𝐿𝑜𝑆 (𝑑𝐿𝑜𝑆 + 𝑤, 𝑝)𝐿𝐿𝑜𝑆 = 𝐿𝐿𝑜𝑆 (𝑑𝐿𝑜𝑆, 𝑝)
𝐿𝑁𝐿𝑜𝑆 = 𝐿𝑁𝐿𝑜𝑆 (𝑑𝐿𝑜𝑆 + 𝑤, 𝑝)L (d,p) = 𝐿𝐿𝑜𝑆 + (𝐿𝑁𝐿𝑜𝑆 − 𝐿𝐿𝑜𝑆) (𝑑 − 𝑑𝐿𝑜𝑆)𝑤
(4)
The width 𝑤 is introduced to provide a transition regionbetween the LoS and NLoS regions. This transition region isseen in the data and typically has a width of 𝑤 = 20 m. TheLoS and NLoS location variability corrections are shown inTable 1.
In Table 1, it can be seen that the spatial variationrate (pS) is inversely proportional to the distance (dLoS)between transmission and reception, and the loss increases.At pS (50%) the loss of LoS and NLoS location variabilitycorrections is zero.
4. Measurement and Results Analysis
4.1. Measurement Method. A random location was selectedfor measuring the time change rates, and the RSRP, whichis one of the various signals transmitted from the basestation using the mobile communication LTE network, was
BS
MS
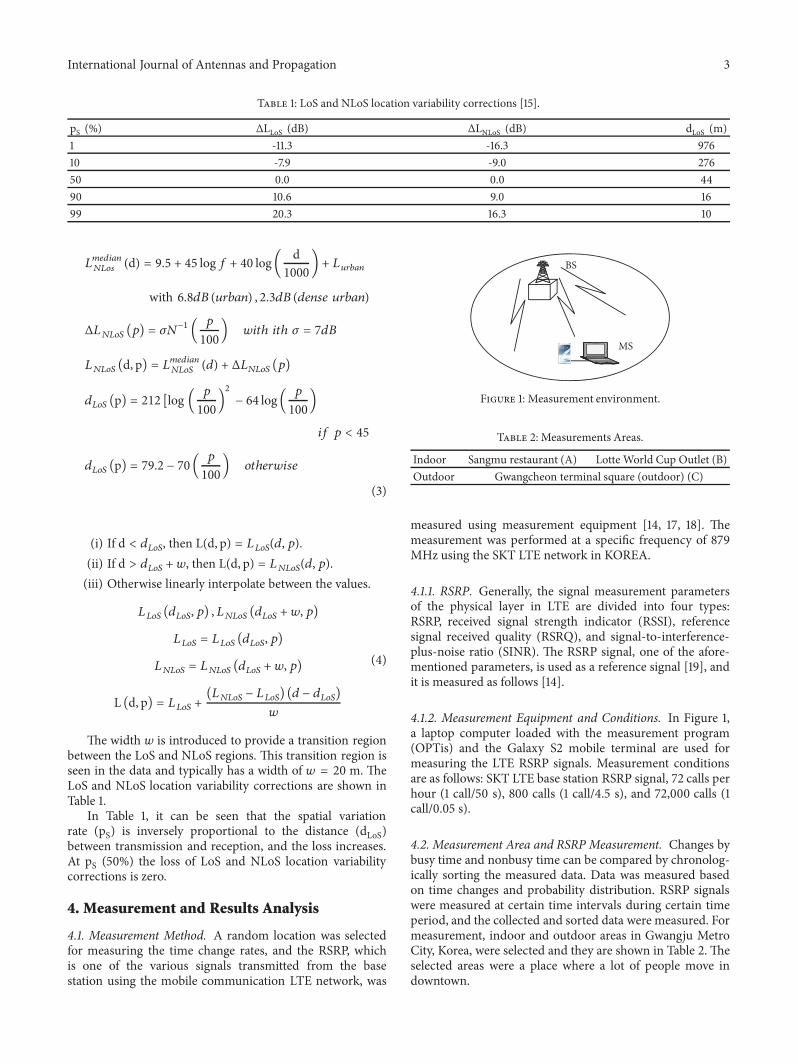
Figure 1: Measurement environment.
Table 2: Measurements Areas.
Indoor Sangmu restaurant (A) Lotte World Cup Outlet (B)Outdoor Gwangcheon terminal square (outdoor) (C)
measured using measurement equipment [14, 17, 18]. Themeasurement was performed at a specific frequency of 879MHz using the SKT LTE network in KOREA.
4.1.1. RSRP. Generally, the signal measurement parametersof the physical layer in LTE are divided into four types:RSRP, received signal strength indicator (RSSI), referencesignal received quality (RSRQ), and signal-to-interference-plus-noise ratio (SINR). The RSRP signal, one of the afore-mentioned parameters, is used as a reference signal [19], andit is measured as follows [14].
4.1.2. Measurement Equipment and Conditions. In Figure 1,a laptop computer loaded with the measurement program(OPTis) and the Galaxy S2 mobile terminal are used formeasuring the LTE RSRP signals. Measurement conditionsare as follows: SKT LTE base station RSRP signal, 72 calls perhour (1 call/50 s), 800 calls (1 call/4.5 s), and 72,000 calls (1call/0.05 s).
4.2. Measurement Area and RSRP Measurement. Changes bybusy time and nonbusy time can be compared by chronolog-ically sorting the measured data. Data was measured basedon time changes and probability distribution. RSRP signalswere measured at certain time intervals during certain timeperiod, and the collected and sorted data were measured. Formeasurement, indoor and outdoor areas in Gwangju MetroCity, Korea, were selected and they are shown in Table 2. Theselected areas were a place where a lot of people move indowntown.
4 International Journal of Antennas and Propagation
Table 3: RSRP measurements in busy time and nonbusy time.
Area A-1 A-2 B-1 B-2 C-1 C-2busy non-busy busy busy busy Busy
Distance (m) 104 303 119
Time Rate (pT%)
0 -73.92 -68.30 -95.57 -90.93 -78.31 -79.561 -73.48 -68.28 -91.80 -90.42 -58.38 -77.0050 (Median) -70.98 -65.37 -86.22 -86.95 -55.56 -74.00100 -64.61 -63.39 -79.16 -82.40 -53.75 -60.94Average -70.20 -65.52 -85.39 -86.93 -55.92 -73.05
In order to propose a wave propagation model reflectingthe characteristics of time/spatial changes, RSRP measuredthe time rates of the measurement values, at the same placeon a certain day and at the same place on another day of theweek. Two types of measurements were broadly performed:(1) measurement was conducted for 1∼2 hour each during thebusy hour and nonbusy hour at the same area (indoor) A; (2)measurement was performed at the same time (busy hour) ondifferent days at the same area (indoor and outdoor) B, C.Theresults are summarized in Table 3.
4.3. Result Analysis. In Table 3, The RSRP signal in thefloating population concentrated areas was affected by thesurrounding propagation environment according to thechanges in time. The comparison results indicated that thetime rates by locations in indoor areas, 1% and 50%, showeda difference of 2.5 ∼ 5.58 dBm. On the other hand, in theoutdoor area, time rates of 1%, 10%, and 50% showed adifference of approximately 2.82 ∼ 3.0 dBm.
We confirmed that signal quality is worse thanwhen thereis a large floating population in the same indoors (busy time).The measurement at a time rate of 1% means that the signalquality is bad and the measurement value at 50% of the timerate indoors and outdoors was similar to the average the totalmeasurement value. Also, we confirmed that signal qualityis worse than distance. Therefore, we have confirmed thatthe time rate was inversely proportional to the busy timewith a large floating population and the space rate to thetransmission and reception distance.
5. Proposal of Propagation Model Reflectingthe Characteristics of Time/Spatial Changes
The proposed model parameters that reflect the characteris-tics of time/spatial changes were shown in Table 4. Also, thereason for the propose model according to the measurementresult in Table 3, the measurement environment is themicrocell downtown environment in which the multipathfading exists, so that the shadowing parameter exists.
By Table 4 we proposed two models. Proposed model1 was (5) and the path loss exponent n was selected as 2.7by considering the measurement environment of downtown.Another proposed model 2 was as in (6).
PL [dB] = 31.28 + 10n log( dd0) + 𝛼
n = 2.7, d0 = 1m, 𝛼 = −11(5)
Table 4: The proposed model parameters.
Identifying the path(combined multipath)
Land indoor and outdoorpath
Determining the time rates 1%, 50%Determining the requiredfrequency 879 MHz
Determining the requireddistance 400 m
Determining the electricfield strength with regard tofrequency, distance,transmission antennaheight, and time rate(considering thetransmission antennaheight)
Transmission antennaheight
hb = 5–30 mReception antenna height
hm = 1.5 mTransmission and receptionantenna gain Gb, Gm = 1Simulation reflecting the
time rates
PL [dB] = 42.6 + 26 log( dd0) + 20log (f) + 𝛼
f = 879MHz, d0 = 1km, 𝛼 = −1(6)
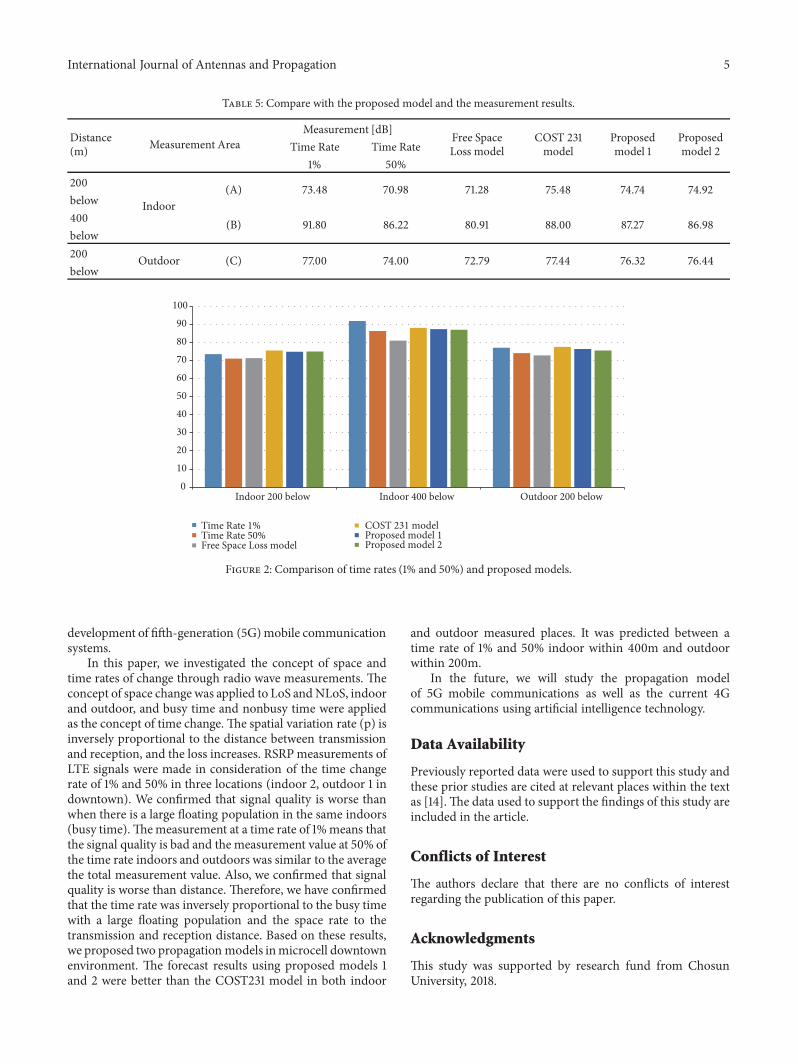
InTable 5 and Figure 2, FSL, COST231, proposedmodel 1,and proposed model 2 were compared with measured valuesat 1% and 50% of the time rates. The (A), (B), and (C) inTable 5 are indoor and outdoor area in Table 2.The proposedmodels 1 and 2 were compared with measurement values ofthe time rate 50% at measurement places. The difference was0.76 ∼ 1.05 dBm at 400m below indoor, the proposed modelswere approximately the time rate of 50%. At the indoor 200mbelow and the outdoor 200m below, the difference betweentime rate 50% and the proposed models was 3.76 ∼ 3.94 and2.32 ∼ 2.44 dBm, respectively. As a result, we have confirmedthat proposed model 1 can be more accurately predicted atoutdoor. On the other hand, proposed model 2 can be moreaccurately predicted by comparing the measured values atindoor below 400. Below 200 indoor, proposed model 1 wassimilar to proposed model 2.
6. Conclusions
Rapidly rising demand for radio communication and theexplosion in the number of mobile communications servicesubscribers have led to the need for optimization in the
International Journal of Antennas and Propagation 5
Table 5: Compare with the proposed model and the measurement results.
Distance(m) Measurement Area
Measurement [dB]Free SpaceLoss model
COST 231model
Proposedmodel 1
Proposedmodel 2Time Rate Time Rate
1% 50%200
Indoor(A) 73.48 70.98 71.28 75.48 74.74 74.92
below400 (B) 91.80 86.22 80.91 88.00 87.27 86.98below200 Outdoor (C) 77.00 74.00 72.79 77.44 76.32 76.44below
0
10
20
30
40
50
60
70
80
90
100
Indoor 200 below Indoor 400 below Outdoor 200 below
Time Rate 1%Time Rate 50%Free Space Loss model
COST 231 modelProposed model 1Proposed model 2
Figure 2: Comparison of time rates (1% and 50%) and proposed models.
development of fifth-generation (5G)mobile communicationsystems.
In this paper, we investigated the concept of space andtime rates of change through radio wave measurements. Theconcept of space change was applied to LoS andNLoS, indoorand outdoor, and busy time and nonbusy time were appliedas the concept of time change. The spatial variation rate (p) isinversely proportional to the distance between transmissionand reception, and the loss increases. RSRPmeasurements ofLTE signals were made in consideration of the time changerate of 1% and 50% in three locations (indoor 2, outdoor 1 indowntown). We confirmed that signal quality is worse thanwhen there is a large floating population in the same indoors(busy time).Themeasurement at a time rate of 1%means thatthe signal quality is bad and themeasurement value at 50% ofthe time rate indoors and outdoors was similar to the averagethe total measurement value. Also, we confirmed that signalquality is worse than distance. Therefore, we have confirmedthat the time rate was inversely proportional to the busy timewith a large floating population and the space rate to thetransmission and reception distance. Based on these results,we proposed two propagation models inmicrocell downtownenvironment. The forecast results using proposed models 1and 2 were better than the COST231 model in both indoor
and outdoor measured places. It was predicted between atime rate of 1% and 50% indoor within 400m and outdoorwithin 200m.
In the future, we will study the propagation modelof 5G mobile communications as well as the current 4Gcommunications using artificial intelligence technology.
Data Availability
Previously reported data were used to support this study andthese prior studies are cited at relevant places within the textas [14].The data used to support the findings of this study areincluded in the article.
Conflicts of Interest
The authors declare that there are no conflicts of interestregarding the publication of this paper.
Acknowledgments
This study was supported by research fund from ChosunUniversity, 2018.
6 International Journal of Antennas and Propagation
References
[1] T. S. Rappaport, Y. Xing, G. R. MacCartney, A. F. Molisch, E.Mellios, and J. Zhang, “Overview of millimeter wave communi-cations for fifth-generation (5G) wireless networks-with a focuson propagation models,” IEEE Transactions on Antennas andPropagation, vol. 65, no. 12, pp. 6213–6230, 2017.
[2] A. Osseiran, F. Boccardi, V. Braun, K. Kusume, P. Marsch,M. Maternia et al., “Scenarios for 5G mobile and wirelesscommunications: the vision of the METIS project,” IEEE Com-munications Magazine, vol. 52, no. 5, pp. 26–35, 2014.
[3] M. Landmann, K. Sivasondhivat, J.-I. Takada, I. Ida, and R.Thoma, “Polarization behavior of discretemultipath and diffusescattering in urban environments at 4.5 GHz,” Eurasip Journalon Wireless Communications and Networking, vol. 2007, ArticleID 57980, 2007.
[4] V. Degli-Esposti, D. Guiducci, A. de’Marsi, P. Azzi, and F.Fuschini, “An advanced field predictionmodel including diffusescattering,” IEEE Transactions on Antennas and Propagation,vol. 52, no. 7, pp. 1717–1728, 2004.
[5] J. Poutanen, J. Salmi, K. Haneda, V.-M.Kolmonen, F. Tufvesson,and P. Vainikainen, “Propagation characteristics of dense mul-tipath components,” IEEE Antennas and Wireless PropagationLetters, vol. 9, pp. 791–794, 2010.
[6] J. Jarvelainen and K. Haneda, “Sixty gigahertz indoor radiowave propagation prediction method based on full scatteringmodel,” Radio Science, vol. 49, no. 4, pp. 293–305, 2014.
[7] B.-J. Lee, J.-P. Cho, I.-H. Ra, and K.-S. Kim, “Propagationcharacterization based on geographic location variation for 5Gsmall cells,” Mobile Information Systems, vol. 2017, Article ID7028431, 8 pages, 2017.
[8] K. Kitao and S. Ichitsubo, “Path loss prediction formula forurban and suburban areas for 4G systems,” in IEEE, IEEE,Melbourne, Vic., Australia, 2006.
[9] S. Hiroshi, Y. Kenya, I. Takashi, and N. Yuichi, “Estimation ofhigh frequency NLOS path loss in street-cell environment,” inIEEE, pp. 336–340, IEEE, Hoi an, Vietnam, 2008.
[10] S. M. S. Majedi and F. Farzaneh, “A new empirical-physicalmethod for calculation of path loss for fixed wireless accessin suburban areas,” in Proceedings of the 2008 InternationalSymposium on Telecommunications, 2008.
[11] K. T. Herring, J. W. Holloway, D. H. Staelin, and D. W. Bliss,“Path-Loss characteristics of urban wireless channels,” IEEETransactions on Antennas and Propagation, vol. 58, no. 1, 2010.
[12] S. Y. Seidel and T. S. Rappaport, “914MHz path loss predictionmodels for indoor wireless communications in multiflooredbuildings,” IEEETransactions onAntennas and Propagation, vol.58, no. 1, 2010.
[13] H. El-Sallabi, D. S. Baum, P. Zetterberg, P. Kyosti, T. Rautiainen,and C. Schneider, “Wideband spatial channelmodel for MIMOsystems at 5 GHz in indoor and outdoor environments,” inIEEE, 2006.
[14] S.-K. Noh, G.-S. Kim, S. W. Kim, and D. Choi, “Measurementsand analysis for proposal of propagation models consideringtime and spatial variation of propagation environments inthe micro-wave band,” in Proceedings of the 5th InternationalConference on Information and Communication TechnologyConvergence, ICTC 2014, pp. 456–461, Republic of Korea,October 2014.
[15] ITU-R P.1411-5, http://www.itu.int/pub/R-REC/en.[16] ITU-R P.370, P.311, P.1410, P.1411, P.1470, http://www.itu.int/pub/
R-REC/en.
[17] M. NarandDit, C. Schneider, and W. Kotterman, “Quantifica-tion of scenario distance within generic winner channelmodel,”International Journal of Antennas and Propagation, vol. 2013,Article ID 176704, 17 pages, 2013.
[18] M. S. Hossain, R. Adhikary, and N. Yesmin, “Performanceevaluation of WINNER-II channel model for long term evo-lution (LTE),” International Journal of Scientific & EngineeringResearch, vol. 4, no. 5, 2013.
[19] https://www.3gpp.org/, 36.214.

International Journal of
AerospaceEngineeringHindawiwww.hindawi.com Volume 2018
RoboticsJournal of
Hindawiwww.hindawi.com Volume 2018
Hindawiwww.hindawi.com Volume 2018
Active and Passive Electronic Components
VLSI Design
Hindawiwww.hindawi.com Volume 2018
Hindawiwww.hindawi.com Volume 2018
Shock and Vibration
Hindawiwww.hindawi.com Volume 2018
Civil EngineeringAdvances in
Acoustics and VibrationAdvances in
Hindawiwww.hindawi.com Volume 2018
Hindawiwww.hindawi.com Volume 2018
Electrical and Computer Engineering
Journal of
Advances inOptoElectronics
Hindawiwww.hindawi.com
Volume 2018
Hindawi Publishing Corporation http://www.hindawi.com Volume 2013Hindawiwww.hindawi.com
The Scientific World Journal
Volume 2018
Control Scienceand Engineering
Journal of
Hindawiwww.hindawi.com Volume 2018
Hindawiwww.hindawi.com
Journal ofEngineeringVolume 2018
SensorsJournal of
Hindawiwww.hindawi.com Volume 2018
International Journal of
RotatingMachinery
Hindawiwww.hindawi.com Volume 2018
Modelling &Simulationin EngineeringHindawiwww.hindawi.com Volume 2018
Hindawiwww.hindawi.com Volume 2018
Chemical EngineeringInternational Journal of Antennas and
Propagation
International Journal of
Hindawiwww.hindawi.com Volume 2018
Hindawiwww.hindawi.com Volume 2018
Navigation and Observation
International Journal of
Hindawi
www.hindawi.com Volume 2018
Advances in
Multimedia
Submit your manuscripts atwww.hindawi.com