propane, n-butane and i-butane stabilization effects on
TRANSCRIPT
1
Propane, n-Butane and i-Butane
Stabilization Effects on Methane Gas
Hydrates
*Callum Smithcurtin university
Curtin University, 5 De Laeter Way, Bentley 6102, Perth WA. Australia
David Packgas measurement & auditing pty ltd
Gas Measurement & Auditing Pty Ltd, P.O Box 458. Kalamunda 6926, Perth WA.
Australia
Ahmed Barifcanicurtin university
Curtin University, 5 De Laeter Way, Bentley 6102, Perth WA. Australia
*Corresponding Author
2
Abstract
The goal of this work is to analyse the hydrate equilibria of methane + propane, i-butane and
n-butane gas mixtures. Experimental hydrate equilibrium data was acquired for various
compositions of these components in methane, ranging from 0.5 – 6.8 mol%. Applying this
information with the Clausius-Clapeyron equation, the extent of hydrate promotion was
demonstrated quantitatively by calculating the slope of the equation and the dissociation
enthalpy (ΔHd). Methane equilibria was found to be most sensitive towards propane and i-
butane, where very small concentrations were sufficient to increase the thermodynamic
conditions for hydrate equilibrium drastically. The degree of hydrate stabilisation, i.e.
transition from sI to sII hydrate, was immediate – there was no detectable composition
slightly above 0.0 mol% where propane or i-butane did not have a sII hydrate-promoting
impact, although one was implied with the aid of Calsep PVTsim calculations. Addition of n-
butane to methane was far less sensitive and was deemed inert from 0.0 – 0.5 mol%. It was
concluded that the sII hydrate was favoured when the n-butane composition exceeded 0.5 –
0.75 mol%. The influence of composition on stability was quantified by determining the
gradient of ΔHd versus mol% plots for the initial steep region that represents the increasing
occupancy of the sII guests. Average gradients of 11.66, 26.64 and 43.50 kJ/mol.mol% were
determined for n-butane, propane and i-butane addition to methane respectively. A hydrate-
inert range for propane/i-butane (in methane) was suspected according to the perceived
inflection point when less 0.5 mol%, implying the gradient was very low at some minute
concentration range starting at 0.0 mol%. Awareness of these sI to sII transition regions is
beneficial to natural gas recovery and processing as a small percentage of these
components may remain without being detrimental in terms of promoting the hydrate
equilibria.
Keywords: Enthalpy of dissociation; Gas hydrate; Hydrate structure
3
1. Introduction
This study explores the varying degree of hydrate stabilization offered by propane (C3), n-
butane (nC4) and i-butane (iC4) to hydrates of methane gas (C1). This stabilization effect is
individually explored with various compositions of the stabilizing gas in binary gas mixtures
with C1 between 20 and 160 bar. Experimentally determining the hydrate dissociation
temperature for the gas mixtures and comparing them to C1 hydrate dissociation data
indicates the extent of stabilization induced by the introduced gas. The hydrate promoting
effects of larger gas molecules in natural gas were reported in an earlier study by Hitchon
(1974). This effect was also observed in a previous study (Smith, et al., 2016). The study
confirmed that C3 and iC4 + nC4 were the greatest contributors of the natural gas
hydrocarbons in promoting the equilibrium conditions of natural gas hydrate.
An approximation of the C3/iC4/nC4 concentration range in C1 required to form the more
stable structure II hydrate is investigated. The intermediate gases, particularly C3, have been
shown to cause the formation conditions of C1 gas hydrates to shift to higher temperatures
and lower pressures, essentially promoting their formation. This has been experimentally
demonstrated recently by Schicks and co-workers where sII is the favoured configuration
(Schicks, et al., 2006). The large 51262 cavity of structure I (sI) hydrate is too small to
accommodate larger gas molecules, whereas the larger 51264 cavity present in sII lattices is
large enough for a larger molecule, such as C3 or iC4, to stabilize. Potential stabilization of
these larger sII cavities in the presence of C1 promotes the hydrate equilibrium conditions by
way of the formation of sII hydrates. Stabilization of C1 hydrates also manifests upon the
addition of sI hydrate formers. Ethane, for example, is capable of entering the 51262 cage of
sI hydrates according to its van der Waals radius (Lederhos, et al., 1993). Early hydrate
equilibrium studies performed by Deaton and Frost (1946) demonstrate the added stability
provided by ethane. Similarly, carbon dioxide also provides a stabilizing effect whilst
maintaining a sI lattice (Adisasmito, et al., 1991); (Adisasmito & Sloan, 1992). However, the
influence of sII formers are focused on in this study.
Although it has been determined that not all cavities are required to be occupied by a guest
(Shin, et al., 2009), particularly the larger cavities, hydrate formation occurs more readily
when the large cages are occupied due to thermodynamic stabilization. Due to C1’s size, it
cannot adequately stabilize the 51264 cage in sII hydrates; a size/cavity ratio of approximately
75% is required for a stable occupation of a cavity and this ratio is only 66.4% for C1
(Christiansen & Sloan, 1994), hence C1 prefers the 512 cavity. For sII hydrate configurations,
136 water molecules constitute a unit cell where a total of 24 cavities, 16 small 512 and 8
4
large 51264 cages, are available for occupation by a guest molecule. For a saturated hydrate
phase, this simplifies to a 17:1 molar ratio which is commonly denoted as the hydration
number, n. A hydration number of 17 represents complete occupation of all cages, but
because of the non-stoichiometric nature of hydrates, a hydration number greater than 17 is
more realistic. It therefore cannot be accurately assumed that a hydrate is fully stabilized due
to saturation on account of the extent of filling. Extent of filling is dependent on temperature,
pressure and guest molecule size (Cady, 1983). This therefore implies that the equilibrium
conditions are altered to a varying extent throughout the vapour-liquid-hydrate (V-Lw-H)
phase region when a fixed amount of sII promoting gas is introduced to C1. For example, it
has been previously determined (Smith et al. 2015) that the change in equilibrium
temperature is not fixed throughout the V-Lw-H region, but varies when at different points on
the equilibrium phase boundary. This effect is explored by experimenting with various binary
C1 gas compositions diluted with C3, iC4 and in some cases nC4 using a sapphire microcell
and comparing these results to pure C1 hydrate equilibrium data. N2 dilution of the sII
hydrate forming gases is also investigated to a minor extent.
2. Methodology
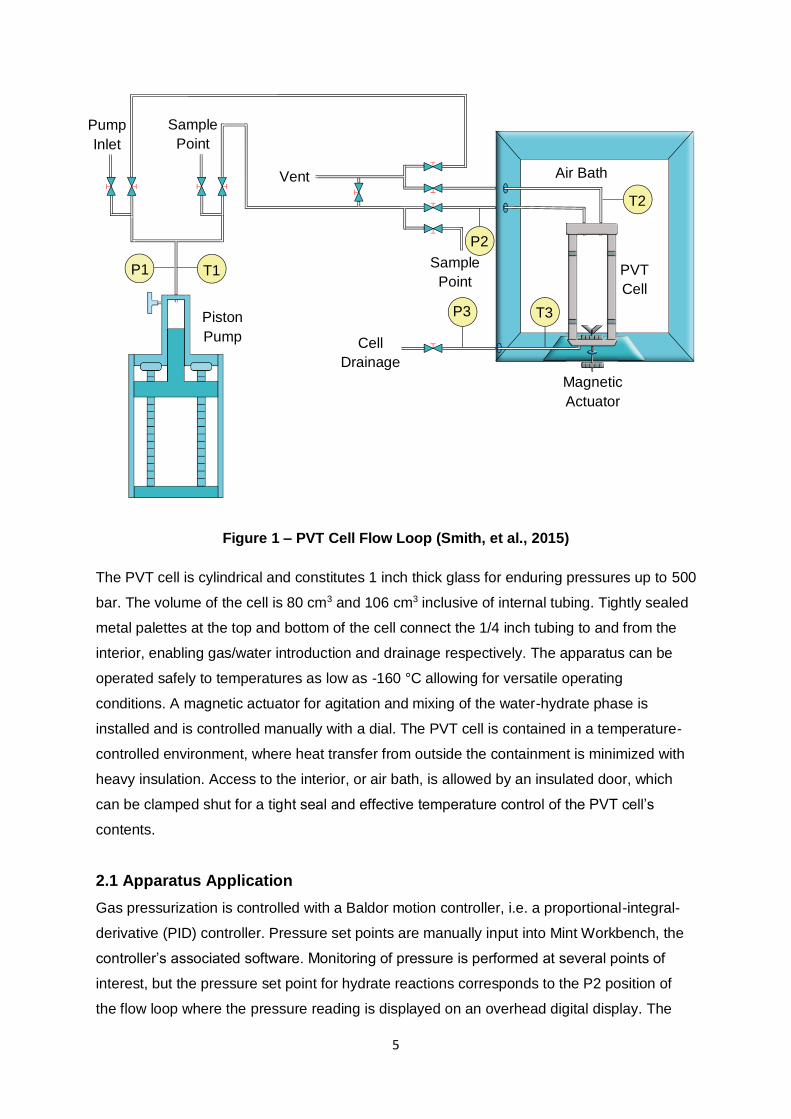
A hydrate reactor consisting of a PVT cell unit is the primary apparatus used for hydrate
synthesis. Other major equipment includes a piston pump and chiller, all of which are
integrated within a flow loop (Figure 1). The apparatus is associated with a Clean Gas
Technologies Australia (CGTA) laboratory that is especially capable of gas hydrate analysis
and CO2 capture. The flow loop utilizes 1/4 inch stainless steel tubing and manual ball
valves. Its simplicity makes handling and control of the flow loop a safe and non-demanding
process.
5
Figure 1 – PVT Cell Flow Loop (Smith, et al., 2015)
The PVT cell is cylindrical and constitutes 1 inch thick glass for enduring pressures up to 500
bar. The volume of the cell is 80 cm3 and 106 cm3 inclusive of internal tubing. Tightly sealed
metal palettes at the top and bottom of the cell connect the 1/4 inch tubing to and from the
interior, enabling gas/water introduction and drainage respectively. The apparatus can be
operated safely to temperatures as low as -160 °C allowing for versatile operating
conditions. A magnetic actuator for agitation and mixing of the water-hydrate phase is
installed and is controlled manually with a dial. The PVT cell is contained in a temperature-
controlled environment, where heat transfer from outside the containment is minimized with
heavy insulation. Access to the interior, or air bath, is allowed by an insulated door, which
can be clamped shut for a tight seal and effective temperature control of the PVT cell’s
contents.
2.1 Apparatus Application
Gas pressurization is controlled with a Baldor motion controller, i.e. a proportional-integral-
derivative (PID) controller. Pressure set points are manually input into Mint Workbench, the
controller’s associated software. Monitoring of pressure is performed at several points of
interest, but the pressure set point for hydrate reactions corresponds to the P2 position of
the flow loop where the pressure reading is displayed on an overhead digital display. The
PVT
Cell
Piston
Pump
Air Bath
Magnetic
Actuator
Cell
Drainage
Pump
Inlet
Sample
Point
Vent
P1 T1
T3
T2
Sample
Point
P3
P2
6
associated pressure expanded uncertainty is U(P) = ±0.25 bar. Although all valves from the
piston pump to the PVT cell are open, meaning all monitoring points will read the same, P2
is used for hydrate experiments in this study due to its proximity to the reaction mixture. This
allows a quicker response to pressure changes from heating and cooling, gas consumption
during hydrate formation and the release of gas from hydrate during dissociation.
For temperature monitoring, thermocouples with an expanded uncertainty of U(T) = 0.075 °C
allow temperature monitoring of the gas (T2) and water-hydrate (T3). The temperature of the
water-hydrate mixture is of primary interest as it is a far better indicator of the equilibrium
temperature than the gas phase. The thermocouple at position T3 is designated as the
controlled thermocouple. Temperature is controlled using FALCON software which utilizes
PID control. The desired temperature can be input or the rate of temperature change with
time can be specified, which is particularly useful for hydrate experiments because of the low
heating and cooling rates required for accurate hydrate equilibrium measurements (Tohidi, et
al., 2000). The chiller is used for cooling procedures and uses cooling water as the coolant.
Heating is supplied by an electrical heater. Heating and cooling rates are aided with the
implemented circulating fan in the air bath chamber.
When gas is required for sampling and subsequent analysis, the gas is drawn from one of
the sample points of the flow loop and sent to an MSR methane composition analyser. The
analyser is also used to confirm the initial compositions that were calculated based on
weighing by difference of pressurized gas canisters used to transfer gas into the flow loop. A
line dedicated to venting purposes is used to dispose of used gas from both the analyser
and PVT cell. The waste gas is directed to an outlet where it is safely released into the
atmosphere.
2.2 Operating Requirements
As with any form of experimentation, it is essential for the apparatus to be free from foreign
agents that may interfere. For this reason, purging with N2 was a necessary measure before
hydrate experiments could be conducted. This was followed by vacuuming of the system to
remove residual N2 and any remaining contaminants. Thorough cleaning of the cell was also
required to remove debris that can sometimes deposit on the inside of the glass.
Temperature control was performed in small increments for cooling and heating processes
to ensure that the identification of phase changes are clear and distinguishable. High heating
and cooling rates can introduce significant human error, especially since the observation of
hydrate formation and dissociation relies on human observation in this study. Therefore, high
heating and cooling rates can cause unreliable and biased equilibria (Tohidi, et al., 2000).
7
Temperature changes were consequently required to be performed in small increments so
that high heat transfer rates are avoided.
2.3 Experimental Procedure
Stainless steel canisters pressurized with pre-determined quantities of gas were released
into the piston pump via a manifold and then allowed to enter the cell. Pressurization of the
gas was furthered according to the required pressure and allowed to thermally equilibrate.
To determine hydrate equilibrium conditions, the isochoric temperature-search method was
chosen because it complements the configuration of the apparatus. The contents were
cooled in small increments until the formation of hydrates occurred, which were left to
develop completely. To promote hydrate formation and growth, the magnetic actuator was
set to approximately 300 rpm. The developed hydrate solid was heated in increments,
ensuring a clear observation of the hydrate dissociation/ equilibrium point. Heating was
continued to dissociate the hydrate completely.
2.4 Gas Preparation
The pure gases used for gas mixture preparation were supplied by BOC Australia and were
high purity scientific grade. Table 1 lists the materials used.
Table 1 – Experimental Materials
Gas Puritya (mol %) Supplier
Methane >99.995 BOC Aus.
Propane >99.99 BOC Aus.
i-Butane >99.99 BOC Aus.
n-Butane >99.99 BOC Aus.
Nitrogen >99.99 BOC Aus.
Distilled water - Laboratory-made
aStated by supplier
The gas mixtures were prepared by pressurizing stainless steel canisters with binary and in
some cases mixtures of C1 + C3/iC4/nC4 + N2. All mixtures constituted C1 as the filler. All
canisters were filled to an estimated pressure that when combined, the resultant mixture
would be of the desired composition. Calculations using the Peng-Robinson equation of
state were used as an estimation of the amount of gas and pressures required (Peng &
Robinson, 1976). Weighing-by-difference of the canisters confirmed the compositions of the
8
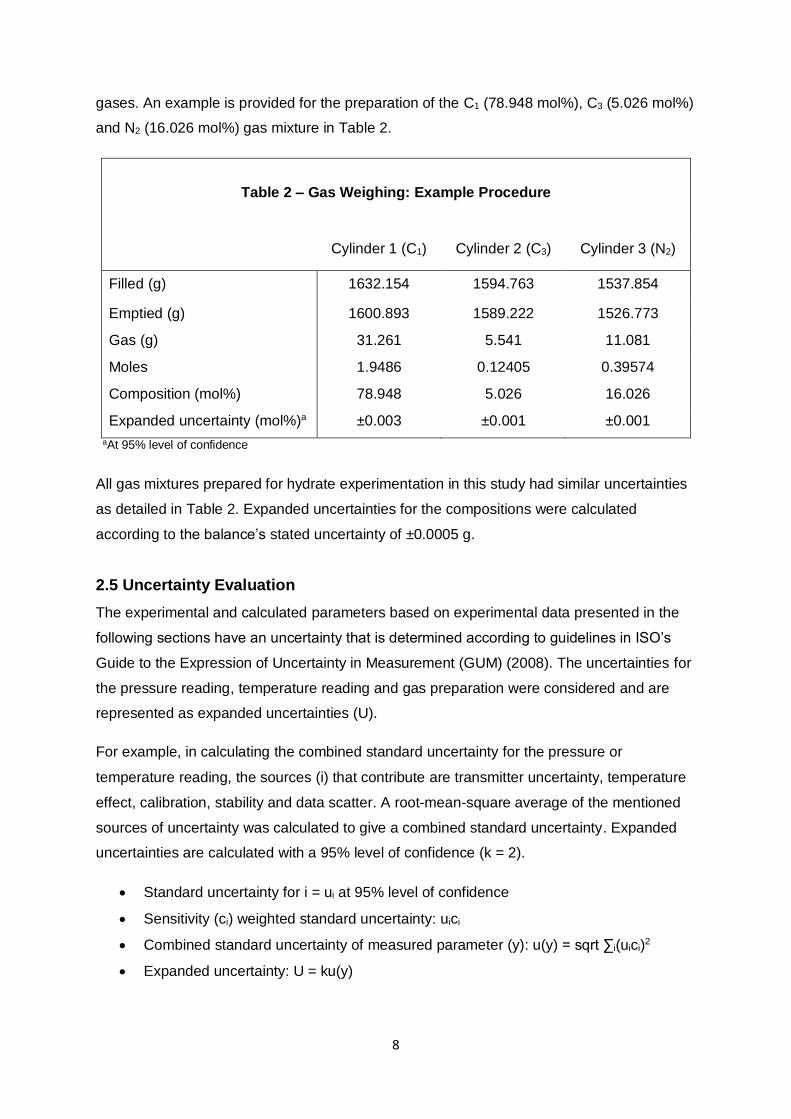
gases. An example is provided for the preparation of the C1 (78.948 mol%), C3 (5.026 mol%)
and N2 (16.026 mol%) gas mixture in Table 2.
Table 2 – Gas Weighing: Example Procedure
Cylinder 1 (C1) Cylinder 2 (C3) Cylinder 3 (N2)
Filled (g) 1632.154 1594.763 1537.854
Emptied (g) 1600.893 1589.222 1526.773
Gas (g) 31.261 5.541 11.081
Moles 1.9486 0.12405 0.39574
Composition (mol%) 78.948 5.026 16.026
Expanded uncertainty (mol%)a ±0.003 ±0.001 ±0.001
aAt 95% level of confidence
All gas mixtures prepared for hydrate experimentation in this study had similar uncertainties
as detailed in Table 2. Expanded uncertainties for the compositions were calculated
according to the balance’s stated uncertainty of ±0.0005 g.
2.5 Uncertainty Evaluation
The experimental and calculated parameters based on experimental data presented in the
following sections have an uncertainty that is determined according to guidelines in ISO’s
Guide to the Expression of Uncertainty in Measurement (GUM) (2008). The uncertainties for
the pressure reading, temperature reading and gas preparation were considered and are
represented as expanded uncertainties (U).
For example, in calculating the combined standard uncertainty for the pressure or
temperature reading, the sources (i) that contribute are transmitter uncertainty, temperature
effect, calibration, stability and data scatter. A root-mean-square average of the mentioned
sources of uncertainty was calculated to give a combined standard uncertainty. Expanded
uncertainties are calculated with a 95% level of confidence (k = 2).
Standard uncertainty for i = ui at 95% level of confidence
Sensitivity (ci) weighted standard uncertainty: uici
Combined standard uncertainty of measured parameter (y): u(y) = sqrt ∑i(uici)2
Expanded uncertainty: U = ku(y)
9
The expanded uncertainty for pressure, U(P), is ±0.25 bar. For temperature, U(T) varied
between each pressure-temperature point due to scatter and ranged from ±0.1 to ±0.2 °C.
Dissociation enthalpies (ΔHd) in section 3.2 were characterised using both temperature and
pressure measurements. Given that a set of equilibrium pressures and temperatures were
used to calculate the dissociation enthalpy for that particular set, U(ΔHd) was also variable
and ranged from ±0.6 to ±1.0 kJ/mol.
3. Results and Discussions
3.1 Hydrate Equilibrium Results
In the presence of water, the hydrate of most natural gases is sII (Sloan & Koh, 2008).
Natural gas hydrates constitute intermediate hydrocarbons such as C3 and the butanes,
particularly iC4, and form sII hydrates by occupying the large 51264 lattice cages (Kini, et al.,
2004). The primary natural gas constituent, C1, fills the smaller 512 cage and together with a
sII former, stabilise the hydrate lattice (Sloan & Koh, 2008). Natural gas can often contain
small concentrations of C3, i C4 and nC4. Small concentrations of these hydrocarbons with C1
can have a large effect on their hydrate equilibrium conditions relative to pure C1. The
proceeding results demonstrate the promotion of C1 equilibria when subjected to low
concentrations of sII formers. Phase equilibrium curves are constructed via individual data
points with an exponential least-squares fitted line.
10
Figure 2 – Methane-Propane Hydrate Equilibria
0
20
40
60
80
100
120
140
160
180
0 2 4 6 8 10 12 14 16 18 20 22 24
Pre
ssu
re (
ba
r)
Temperature (°C)
0% 0% Adisasmito et al. (1991)
0% Gayet et al. (2005) 0.516%
0.807% 1% Deaton & Frost (1946)
2.003% 4.033%
3.5% Mcleod & Campbell (1961) 5.026% + 16.026% N2
11
Figure 3 – Methane-i-Butane Hydrate Equilibria
0
20
40
60
80
100
120
140
160
180
0 2 4 6 8 10 12 14 16 18 20 22 24 26
Pre
ssu
re (
ba
r)
Temperature (°C)
0% 0% Adisasmito et al. (1991)
0% Gayet et al. (2005) 0.595%
1.2% Wu & Robinson (1976) 4.032%
4.6% Deaton & Frost (1946) 4.613% + 18.659% N2
6.813%
12
Figure 4 – Methane-n-Butane Hydrate Equilibria
0
20
40
60
80
100
120
140
160
180
0 2 4 6 8 10 12 14 16 18
Pre
ssu
re (
ba
r)
Temperature (°C)
0% 0% Adisasmito et al. (1991)
0% Gayet et al. (2005) 0.519%
1.007% 2.226%
2.6% Mcleod & Campbell (1961) 3.91% Ng & Robinson (1976)
4.375% + 17.428% N2 5.499%
13
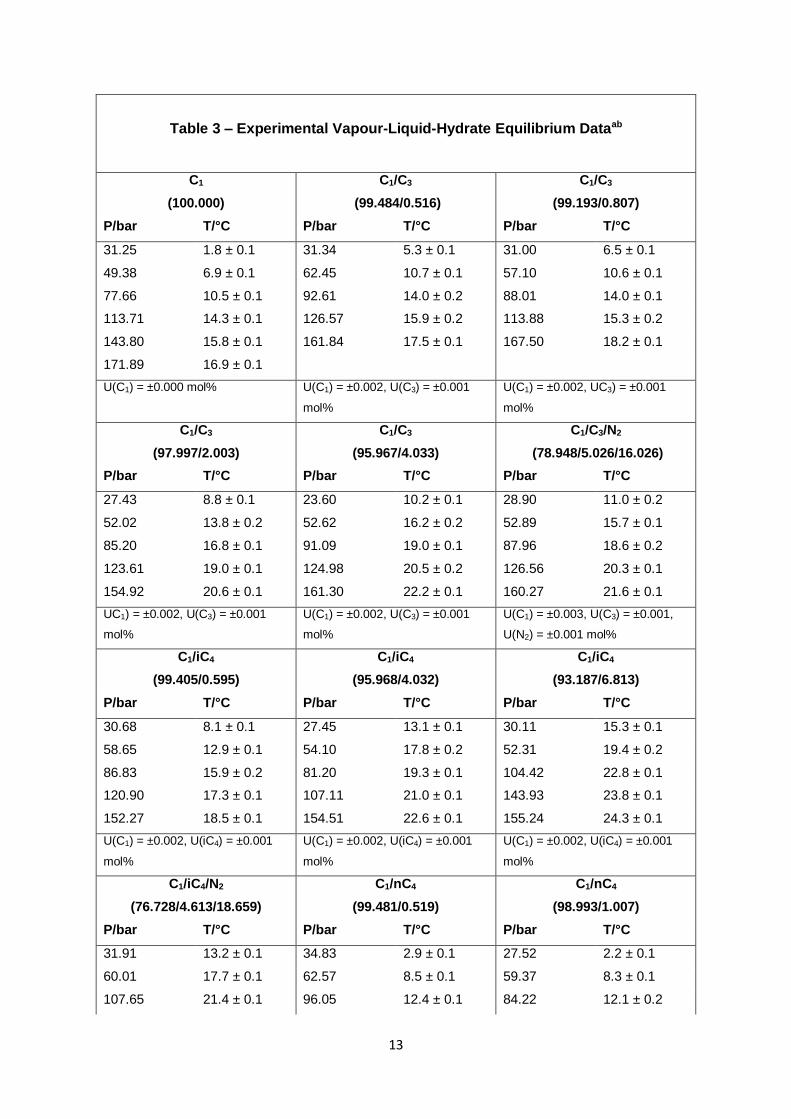
Table 3 – Experimental Vapour-Liquid-Hydrate Equilibrium Dataab
C1
(100.000)
C1/C3
(99.484/0.516)
C1/C3
(99.193/0.807)
P/bar T/°C P/bar T/°C P/bar T/°C
31.25 1.8 ± 0.1 31.34 5.3 ± 0.1 31.00 6.5 ± 0.1
49.38 6.9 ± 0.1 62.45 10.7 ± 0.1 57.10 10.6 ± 0.1
77.66 10.5 ± 0.1 92.61 14.0 ± 0.2 88.01 14.0 ± 0.1
113.71 14.3 ± 0.1 126.57 15.9 ± 0.2 113.88 15.3 ± 0.2
143.80 15.8 ± 0.1 161.84 17.5 ± 0.1 167.50 18.2 ± 0.1
171.89 16.9 ± 0.1
U(C1) = ±0.000 mol% U(C1) = ±0.002, U(C3) = ±0.001
mol%
U(C1) = ±0.002, UC3) = ±0.001
mol%
C1/C3
(97.997/2.003)
C1/C3
(95.967/4.033)
C1/C3/N2
(78.948/5.026/16.026)
P/bar T/°C P/bar T/°C P/bar T/°C
27.43 8.8 ± 0.1 23.60 10.2 ± 0.1 28.90 11.0 ± 0.2
52.02 13.8 ± 0.2 52.62 16.2 ± 0.2 52.89 15.7 ± 0.1
85.20 16.8 ± 0.1 91.09 19.0 ± 0.1 87.96 18.6 ± 0.2
123.61 19.0 ± 0.1 124.98 20.5 ± 0.2 126.56 20.3 ± 0.1
154.92 20.6 ± 0.1 161.30 22.2 ± 0.1 160.27 21.6 ± 0.1
UC1) = ±0.002, U(C3) = ±0.001
mol%
U(C1) = ±0.002, U(C3) = ±0.001
mol%
U(C1) = ±0.003, U(C3) = ±0.001,
U(N2) = ±0.001 mol%
C1/iC4
(99.405/0.595)
C1/iC4
(95.968/4.032)
C1/iC4
(93.187/6.813)
P/bar T/°C P/bar T/°C P/bar T/°C
30.68 8.1 ± 0.1 27.45 13.1 ± 0.1 30.11 15.3 ± 0.1
58.65 12.9 ± 0.1 54.10 17.8 ± 0.2 52.31 19.4 ± 0.2
86.83 15.9 ± 0.2 81.20 19.3 ± 0.1 104.42 22.8 ± 0.1
120.90 17.3 ± 0.1 107.11 21.0 ± 0.1 143.93 23.8 ± 0.1
152.27 18.5 ± 0.1 154.51 22.6 ± 0.1 155.24 24.3 ± 0.1
U(C1) = ±0.002, U(iC4) = ±0.001
mol%
U(C1) = ±0.002, U(iC4) = ±0.001
mol%
U(C1) = ±0.002, U(iC4) = ±0.001
mol%
C1/iC4/N2
(76.728/4.613/18.659)
C1/nC4
(99.481/0.519)
C1/nC4
(98.993/1.007)
P/bar T/°C P/bar T/°C P/bar T/°C
31.91 13.2 ± 0.1 34.83 2.9 ± 0.1 27.52 2.2 ± 0.1
60.01 17.7 ± 0.1 62.57 8.5 ± 0.1 59.37 8.3 ± 0.1
107.65 21.4 ± 0.1 96.05 12.4 ± 0.1 84.22 12.1 ± 0.2
14
149.63 22.7 ± 0.1 127.33 14.6 ± 0.2 127.31 14.8 ± 0.1
160.14 17.1 ± 0.1 159.06 17.4 ± 0.1
U(C1) = ±0.002, U(iC4) = ±0.001,
U(N2) = ±0.001 mol%
U(C1) = ±0.002, U(nC4) = ±0.001
mol%
U(C1) = ±0.002, U(nC4) = ±0.001
mol%
C1/nC4
(97.774/2.226)
C1/nC4
(94.501/5.499)
C1/nC4/N2
(78.197/4.375/17.428)
P/bar T/°C P/bar T/°C P/bar T/°C
29.00 4.5 ± 0.1 27.70 6.0 ± 0.1 27.45 4.8 ± 0.1
56.07 9.9 ± 0.2 55.51 10.8 ± 0.1 57.30 8.9 ± 0.1
88.13 12.0 ± 0.1 80.61 12.4 ± 0.2 84.83 11.9 ± 0.1
125.30 14.9 ± 0.1 116.84 14.9 ± 0.1 120.90 13.3 ± 0.2
U(C1) = ±0.002, U(nC4) = ±0.001
mol%
U(C1) = ±0.003, U(nC4) = ±0.001
mol%
U(C1) = ±0.002, U(nC4) = ±0.001,
U(N2) = ±0.001 mol%
aCompositions are mole percentages
bAll uncertainties are expanded uncertainties (U) at 95% level of confidence: U(P) = ±0.25 bar; U(T) is as
specified
15
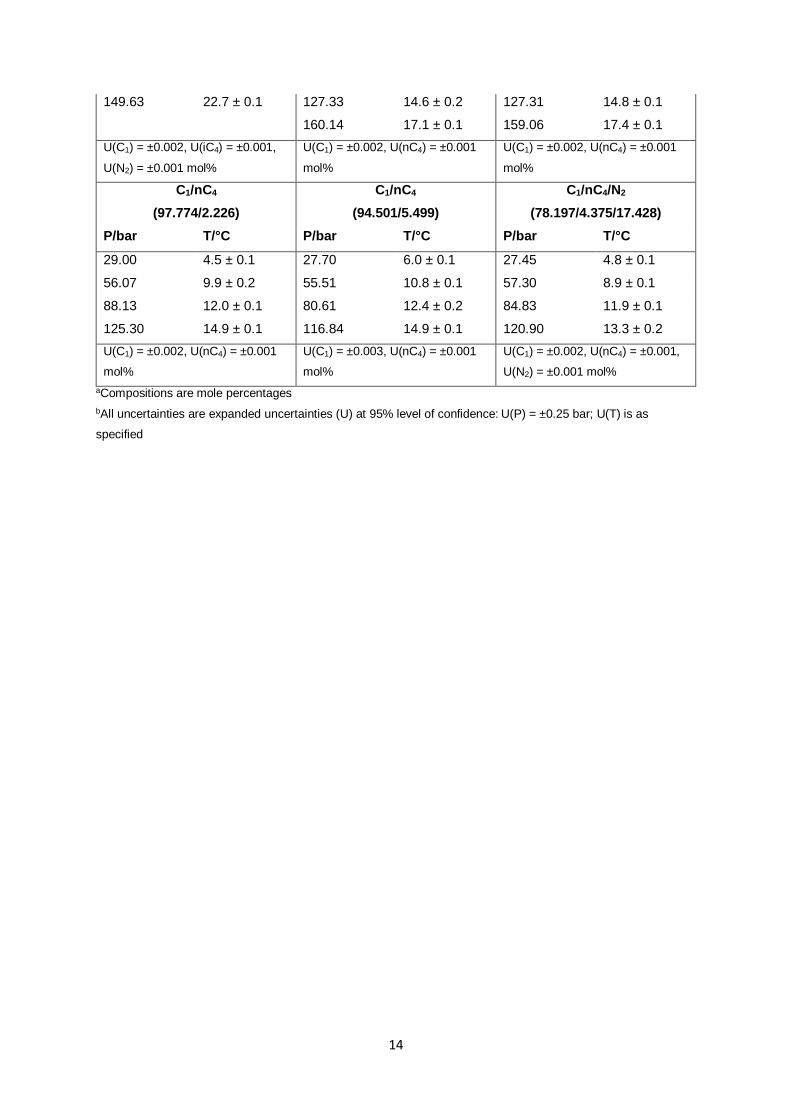
Table 4 – Literature Vapour-Liquid-Hydrate Equilibrium Dataa
C1
(100)
C1
(100)
C1/C3
(99/1)
P/bar T/°C P/bar T/°C P/bar T/°C
35.5 3.0 30.5 1.45 16.27 1.65
43.6 5.0 37.2 3.55 22.47 4.45
53.3 7.0 43.9 5.15 31.23 7.25
65.5 9.0 50.2 6.45 43.58 9.95
81.2 11.0 57.7 7.75
101.7 13.0 66.5 9.15
127.9 15.0 75.9 10.45
163.0 17.0 85.5 11.55
91.7 12.55
105.7 13.25
Gayet et al. (2005) Adisasmito et al. (1991) Deaton & Frost (1946)
C1/C3
(96.5/3.5)
C1/iC4
(99.8/1.2)
C1/iC4
(95.4/4.6)
P/bar T/°C P/bar T/°C P/bar T/°C
69.3 1.65 18.0 6.75 67.2 20.65
104.5 4.45 27.0 10.05 76.9 21.45
138.9 7.25 34.7 11.75 105.8 22.15
48.8 14.35 139.6 23.55
69.6 16.85
Mcleod & Campbell (1961) Wu & Robinson (1976) Mcleod & Campbell (1961)
C1/nC4
(97.4/2.6)
C1/nC4
(96.09/3.91)
P/bar T/°C P/bar T/°C
57.6 9.35 21.5 3.76
76.9 11.85 31.4 6.59
90.7 12.55 50.9 9.97
104.5 13.15 81.6 12.8
124.5 14.55 110.5 14.4
Mcleod & Campbell (1961) Ng & Robinson (1976)
aCompositions are mole percentages
The hydrate equilibria for C1-C3 in water has previously been documented by several
workers (Deaton & Frost, 1946); (Mcleod & Campbell, 1961). The promoting influence of C3
16
in the presence of C1 is apparent and such an effect on the hydrate equilibria with C1 can
also be interpreted from studies performed by Mcleod, Song and co-workers (Mcleod &
Campbell, 1961); (Song & Kobayashi, 1982). Likewise, the equilibria for C1-iC4/nC4 in water
is also documented (Deaton & Frost, 1946); (Wu, et al., 1976); (Mcleod & Campbell, 1961);
(Ng & Robinson, 1976). However, studies focusing on small C3/iC4/nC4 compositions are
uncommon. Very little literature material also deals with the effect of N2 on these hydrate
equilibria. Pressures greater than 250 bar are required for N2 hydrates to form, which is
beyond the N2 partial pressures investigated (van Cleef & Diepen, 1960). Therefore, the little
to no occupation of cavities by N2 at a low enough partial pressure can counteract the
promoting influence of C3, iC4 or nC4 by dilution. N2 dilution of the tested gas mixtures was
performed and their relative effects on hydrate equilibrium promotion by sII species are
discussed.
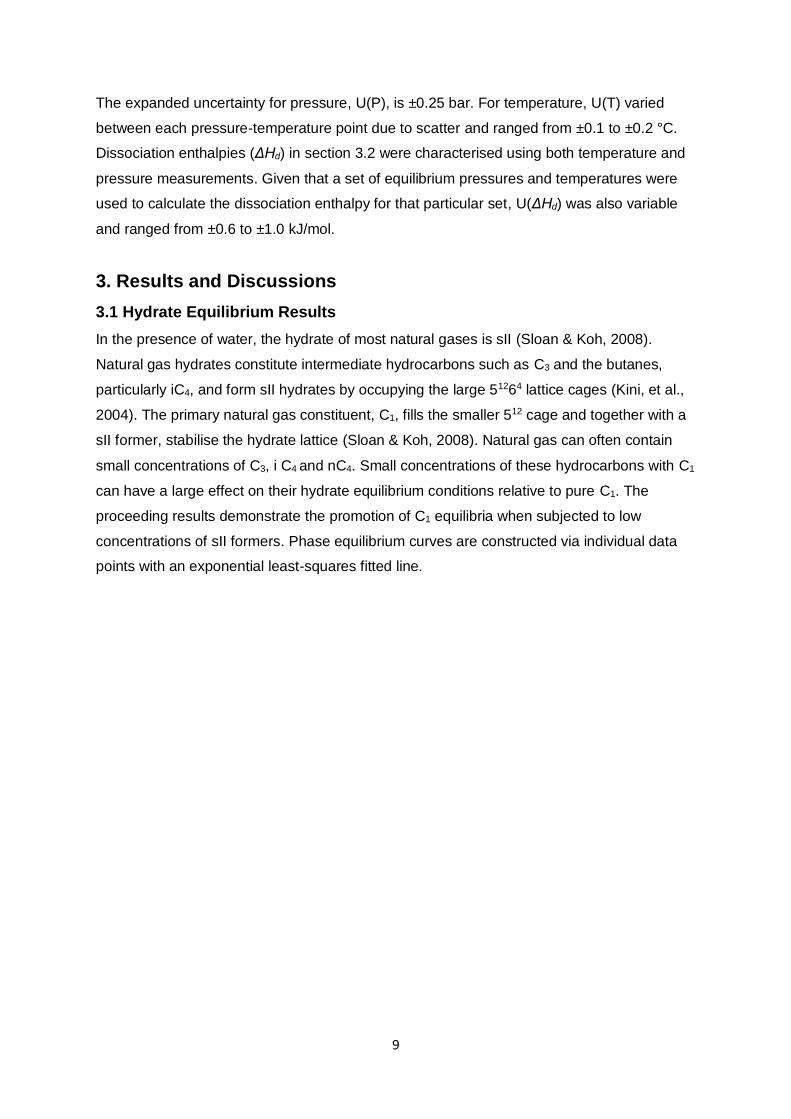
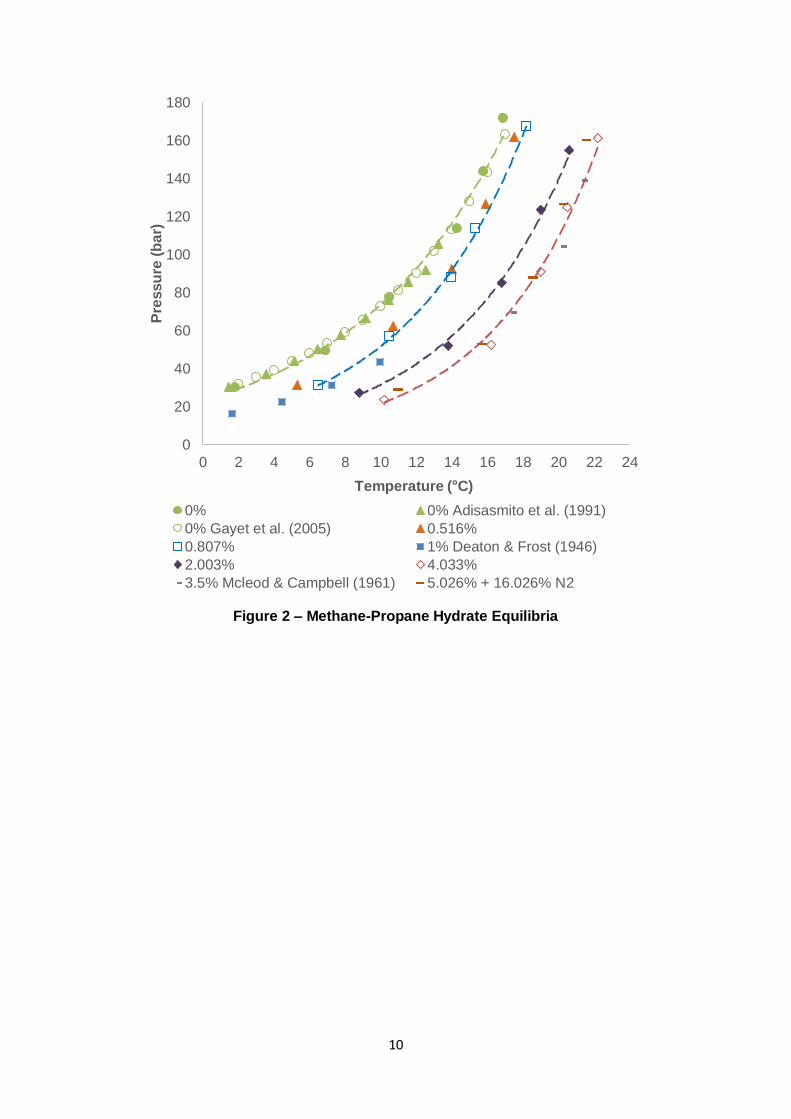
3.1.1 Methane-Propane & Methane-i-Butane
Figure 2 and Figure 3 present experimental hydrate equilibria for the mentioned gas
mixtures in addition to the inclusion of N2 in such systems. Modelling software (PVTsim v.20
with Peng-Robinson equation of state) provided validity to the C3 and iC4 data, with mostly
minor discrepancies. A clear indication of C3 and iC4’s synergistic effect on equilibria
promotion with C1 are their <1 mol% curves (0.807 and 0.595 mol% respectively), which
depict a greater equilibrium temperature (Teq) than pure C1 at any of tested pressures. Given
their small abundance, an observed shift ranging from 1 – 5 °C with respect to pure C1 for C3
(0.807 mol%) and 2 – 6 °C for iC4 (0.595 mol%) is significant. The 0.807 mol% C3 data is
also consistent with Deaton & Frost’s (1946) 1 mol% equilibria. Teq is slightly lower (at 0.807
mol%) for the available pressure points. Similarly, the 0.595 mol% iC4 results compare
favourably with Wu and co-workers’ 1.2 mol% iC4 data – the presented work lies
approximately halfway between the curve for C1 and literature data for 1.2 mol%.
Increasing the C3 concentration to 2.003 mol% drastically amplifies the resulting gas
mixture’s equilibria. Teq now ranges from 4 – 6.5 °C higher than pure C1. Further increasing
the composition to 4.033 mol% understandably increases Teq, but this increase is less
pronounced, i.e. as the C3 concentration increases, the subsequent increase in Teq reduces
in magnitude at a given pressure. A similar phenomenon occurs when increasing iC4
concentration to 4.033 mol% and further to 6.813 mol%. Reduced sensitivity of hydrate
equilibria promotion is rationalised by realising that a hydrate lattice constitutes a limited
quantity of cavities or adsorption sites and is described by the Langmuir isotherm in the van
der Waals-Platteeuw (vdWP) model shown in Eq. 1 (van der Waals & Platteeuw, 1959).
Fractional occupancy of cavity type i by guest species j, θij, is a function of the Langmuir
17
constant, Cij, and fugacity, fi. The availability of cavities inevitably decreases as more cavities
become occupied by guest molecules, giving rise to smaller and smaller increments in lattice
stability (and Teq increase) as fi increases.
θij = Cijfi
1 + ∑ Cijfii
Eq. 1
The introduction of N2 to a C1-C3/iC4 gas mixture with water demonstrated suppressive effect
of N2 on said hydrate system. Given the hydrate-inertness of N2 under this study’s
experimented pressures, the resulting effect is dilution of the hydrate guests (van Cleef &
Diepen, 1960); (Marshall, et al., 1964); (Jhaveri & Robinson, 1965). In comparison to the
4.033 mol% C3 gas, the 5.026 mol% C3 mixture with N2 (16.026 mol%) in Figure 2 displays
similar hydrate equilibria with approximately equivalent promotion (due to C3). The addition
of 16.026 mol% N2 means that the C1 concentration is lowered (78.948 mol% compared to
>96 mol% for C1-C3 mixtures), ensuring lower fC1 and less C1 512 (s) cavity occupation, θC1,s.
Similarly, the higher C3 concentration (5.026 to 4.033 mol%) provides an opposing,
stabilising effect by increasing fC3 and therefore the 51264 (l) cavity occupation by C3, θC3,l.
Such an increase in θC3,l is apparently significant enough to counteract the lowered θC1,s,
resulting in both gas mixtures exhibiting similar overall hydrate equilibrium shifts relative to
the pure C1 curve. This rationale also explains similar observations pertaining to the
counteracting effects of N2 dilution and equilibria promotion via iC4 in Figure 3 for the C1-iC4
system.
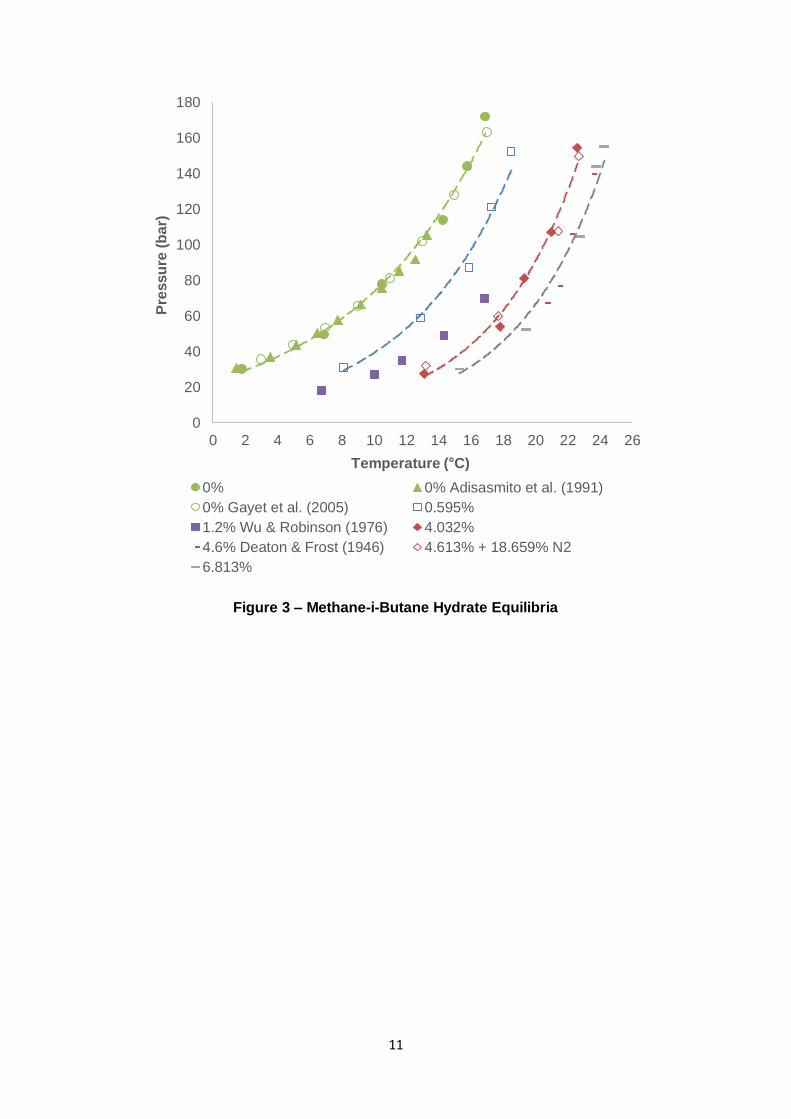
3.1.2 Methane-n-Butane
For some time, nC4 was presumed to be unable to form hydrates (given the presence of
water). Studies and reviews published in the mid-late 1960s demonstrated that nC4 was
seemingly incapable of forming hydrates (Musaev, 1966); (Byk & Fomina, 1968). From a
theoretical perspective, it was confirmed that the nC4 molecule was too large to fit into both
the sI and sII cavities (Parrish & Prausnitz, 1972). However, the presence of C1 can act as a
“help gas” and enables a hydrate phase consisting of nC4 and C1 to form (Mcleod &
Campbell, 1961); (Sloan & Koh, 2008). Experimental results for C1-nC4 gas mixtures are
presented in Figure 4.
Most notably, the introduction of nC4 to C1 provides far less promotion than C3 and iC4. This
was by the thermodynamic models implemented in PVTsim when applied with the Peng-
Robinson equation of state. An interesting observation is that as the nC4 composition is
increased, the equilibrium curve becomes steeper to the point where it intersects with the C1
curve. With the experimented nC4 compositions, this cross-over into the pure C1 hydrate’s
18
stability region occurs from approximately 80 – 120 bar. Mcleod and Campbell (1961) made
similar observations. As pressure increases, cavities in the hydrate lattice can become
distorted, slightly altering their dimensions – this phenomenon leads to difficulties regarding
nC4’s adsorption to the 51264 (large) structure II (sII) cavity (Ng & Robinson, 1976);
(Stackelber & Muller, 1951); (Claussen & Frost, 1951). The filling of the large sII cavity by
nC4 is not particularly favourable. Its molecule/cavity size ratio of 1.081 makes it difficult for
nC4 to experience attractive van der Waals forces in the cavity due to overlap of nC4 and the
water molecules’ van der Waals radii (Lederhos, et al., 1993). It can be concluded that the
combination of nC4’s size and the effect of lattice distortion with pressure, adding nC4 to C1
can inhibit the hydrate phase equilibria by acting as a non-former.
3.2 Dissociation Enthalpy Results
In previous discussions (section 4.1), it was clear that small concentrations of a compatible
hydrocarbon (C3, iC4, nC4) additive to C1 could promote the hydrate equilibrium conditions
quite substantially. The added component occupied the large cavity of the sII lattice, adding
stability to the hydrate phase. Given that only relatively small concentrations were necessary
to induce a promotion, it is of interest to confirm that the transition from C1 sI to C1-C3/iC4/nC4
sII hydrate is responsible for the observed promoting phenomena. The Clausius-Clapeyron
equation is used and is represented as follows:
d(lnP)
d(1/T) =
∆Hd
ZR Eq. 2
The Clausius-Clapeyron equation relates d(lnP)/d(1/T) (slope) to the dissociation enthalpy of
the hydrate, ΔHd. The R and Z symbols denote the gas constant and gas compressibility
respectively. The slope and ΔHd parameters are of particular importance because they are
indicative of the hydrate structure type (Sloan & Fleyfel, 1992). This form of the Clausius-
Clapeyron equation assumes that the volume change of the hydrate phase is insignificant
compared to the volume of gas. Our experiments involved a relatively minute quantity of
water, giving validity to this assumption. Hence, Eq. 2 can be applied to the data presented
in the previous section to determine the hydrate structure type for a gas mixture.
It is well known that the slope and ΔHd are proportional to the hydrate structure type and
remain relatively constant for any abundance of the added hydrocarbon (Sloan & Fleyfel,
1992); (Sloan & Koh, 2008). Sloan and co-workers (1992, 2008) demonstrated that slopes in
the regions of -8000 to -9000 and -14000 to -16000 K are typical for sI and sII hydrates
respectively. It is also understood that ΔHd is dependent on how well the guest species fits
into the hydrate cavity and the extent of occupation (Sloan & Koh, 2008). From Eq. 1, higher
concentrations (therefore fugacity) correspond to greater occupancy. We can therefore
19
expect that ΔHd (and slope) will increase when the concentration of C3/iC4/nC4 increases.
Whilst comparing hydrate stability with the composition of the sII gas species would be more
expressive, unfortunately, no single hydrate composition is reflective of the experimental
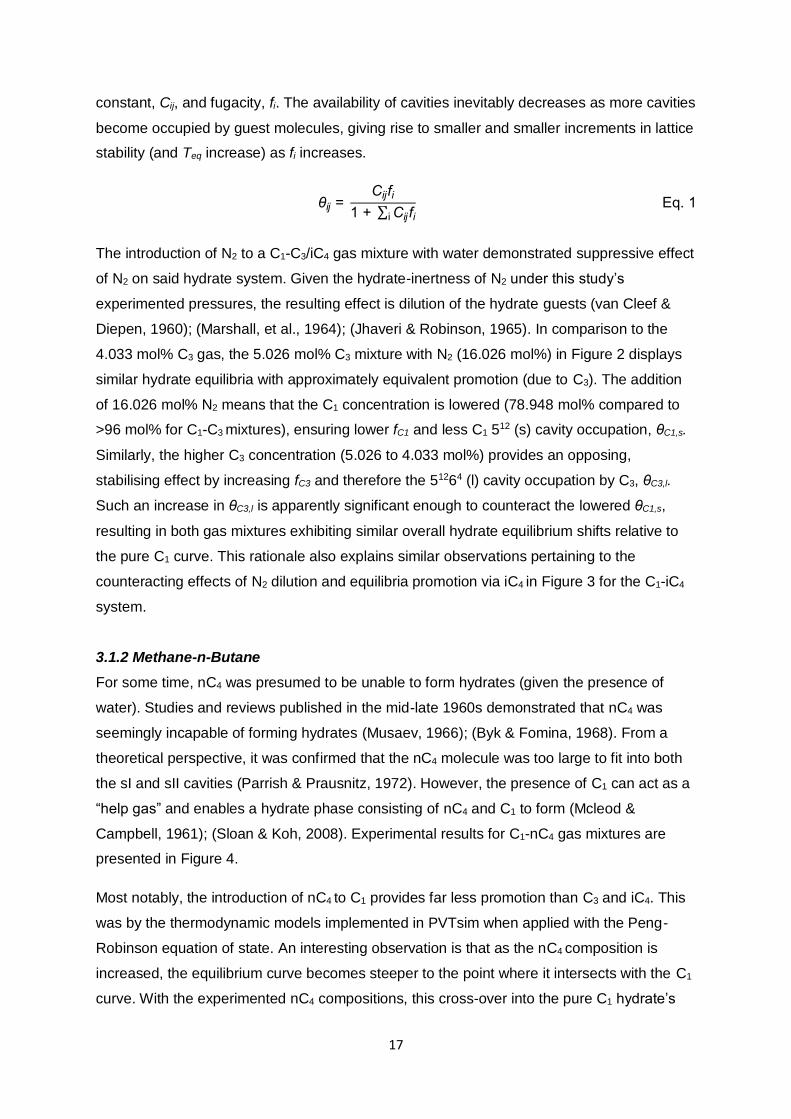
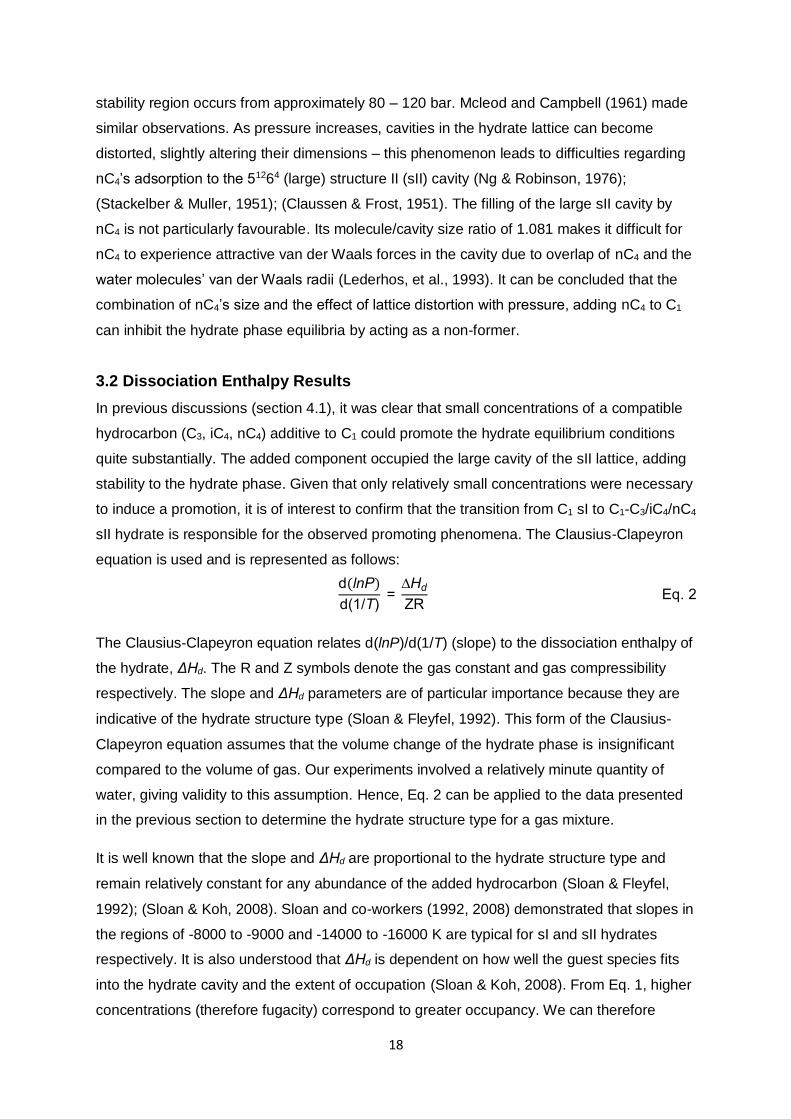
data set required in the calculation of dlnP/d(1/T) and ΔHd. Figure 5 and Figure 6
consequently illustrate the increasing sII-like configuration with gas composition.
Figure 5 – d(lnP)/d(1/T) against Composition (0 – 8.0 mol%)
7000
8000
9000
10000
11000
12000
13000
14000
15000
16000
0 2 4 6 8
-dln
P/d
(1/T
), K
Mol %
Propane Propane/N2 i-Butane
i-Butane/N2 n-Butane n-Butane/N2
20
Figure 6 – ΔHd against Composition (0 – 8.0 mol%)
50
60
70
80
90
100
110
0 2 4 6 8
ΔH
d(k
J/m
ol)
Mol %
Propane Propane/N2 i-Butane
i-Butane/N2 n-Butane n-Butane/N2
21
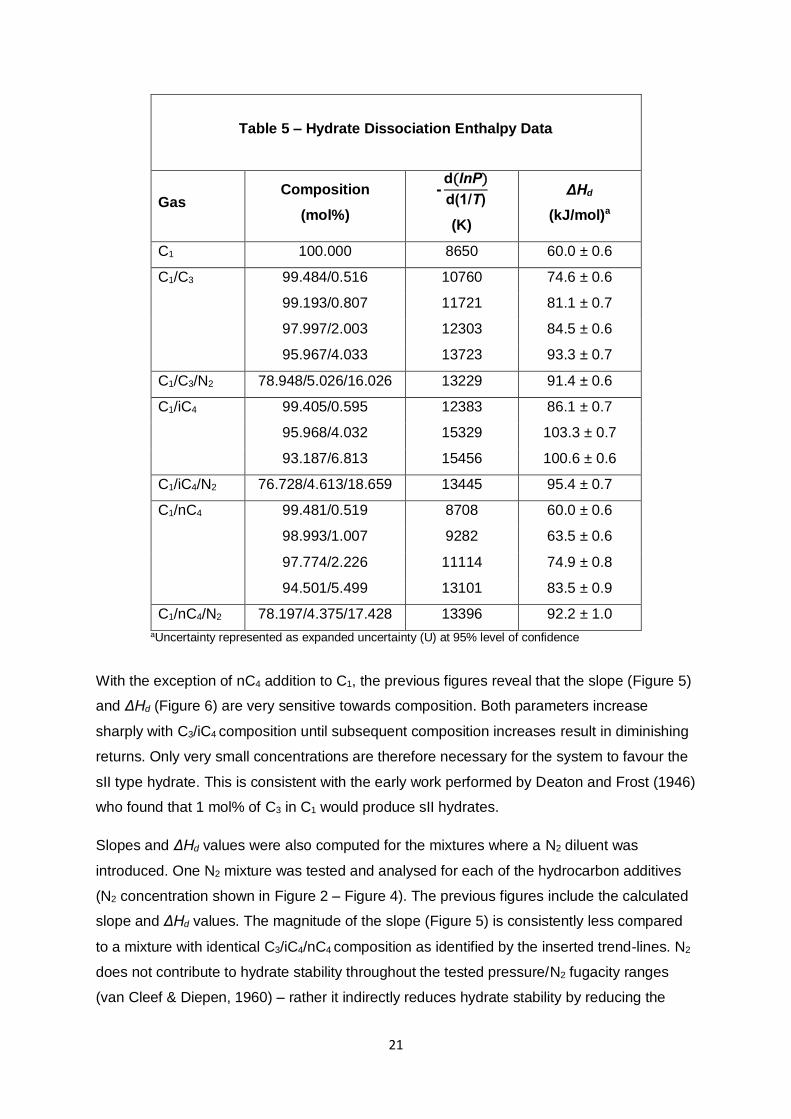
Table 5 – Hydrate Dissociation Enthalpy Data
Gas Composition
(mol%)
-d(lnP)
d(1/T)
(K)
ΔHd
(kJ/mol)a
C1 100.000 8650 60.0 ± 0.6
C1/C3 99.484/0.516 10760 74.6 ± 0.6
99.193/0.807 11721 81.1 ± 0.7
97.997/2.003 12303 84.5 ± 0.6
95.967/4.033 13723 93.3 ± 0.7
C1/C3/N2 78.948/5.026/16.026 13229 91.4 ± 0.6
C1/iC4 99.405/0.595 12383 86.1 ± 0.7
95.968/4.032 15329 103.3 ± 0.7
93.187/6.813 15456 100.6 ± 0.6
C1/iC4/N2 76.728/4.613/18.659 13445 95.4 ± 0.7
C1/nC4 99.481/0.519 8708 60.0 ± 0.6
98.993/1.007 9282 63.5 ± 0.6
97.774/2.226 11114 74.9 ± 0.8
94.501/5.499 13101 83.5 ± 0.9
C1/nC4/N2 78.197/4.375/17.428 13396 92.2 ± 1.0
aUncertainty represented as expanded uncertainty (U) at 95% level of confidence
With the exception of nC4 addition to C1, the previous figures reveal that the slope (Figure 5)
and ΔHd (Figure 6) are very sensitive towards composition. Both parameters increase
sharply with C3/iC4 composition until subsequent composition increases result in diminishing
returns. Only very small concentrations are therefore necessary for the system to favour the
sII type hydrate. This is consistent with the early work performed by Deaton and Frost (1946)
who found that 1 mol% of C3 in C1 would produce sII hydrates.
Slopes and ΔHd values were also computed for the mixtures where a N2 diluent was
introduced. One N2 mixture was tested and analysed for each of the hydrocarbon additives
(N2 concentration shown in Figure 2 – Figure 4). The previous figures include the calculated
slope and ΔHd values. The magnitude of the slope (Figure 5) is consistently less compared
to a mixture with identical C3/iC4/nC4 composition as identified by the inserted trend-lines. N2
does not contribute to hydrate stability throughout the tested pressure/N2 fugacity ranges
(van Cleef & Diepen, 1960) – rather it indirectly reduces hydrate stability by reducing the
22
occupation of potential guests due to their reduced fugacity. For example, a 5 mol% C3 (in
C1) mixture has slope a greater than a 5.026 mol% mixture + 16.026 mol% N2 (in C1) as
shown in Figure 5 of which can be explained by the reduced C1 fugacity and therefore lower
hydrate phase occupation. The opposite is generally true regarding ΔHd – it is higher when
N2 is included in the mixture. This is a consequence of N2’s compressibility. The value of ΔHd
depends on Z, the compressibility of the gas mixture. As calculated by the Peng-Robinson
(PR) equation, N2 has a higher Z value than the other gas constituents, leading to a higher
overall Z for mixtures involving N2 (Peng & Robinson, 1976). In accordance with Eq. 2, this
corresponds to a higher ΔHd. Such an occurrence does not manifest for the case of iC4
mixtures. In this instance the decline in slope for the 4.613 mol% + 18.659 mol% N2 mixture
is too significant for Z to counteract with respect to the predicted ΔHd of a 4.613 mol %
mixture without N2 in Figure 6.
Interestingly, the addition of nC4 has little to no effect until its composition reaches
approximately 0.5 mol%. This leads to the conclusion that nC4 is inert when <0.5 mol% and
has no direct influence towards the hydrate phase. Beyond 0.5 mol%, a similar initial profile
to C3 and iC4 exists where the Clausius-Clapeyron slope and ΔHd is steeply inclined before
flattening out. Of note is the steepness or sensitivity of the initial inclination of slope/ΔHd.
Observation leads to the conclusion that slope/ΔHd sensitivity, and therefore equilibria
promotion, towards composition is ranked as iC4 > C3 > nC4. This is summarised by
determining the gradient for the steep regions in Figure 5 and Figure 6, i.e. d(slope)/d(mol%)
and d(ΔHd)/d(mol%) respectively.
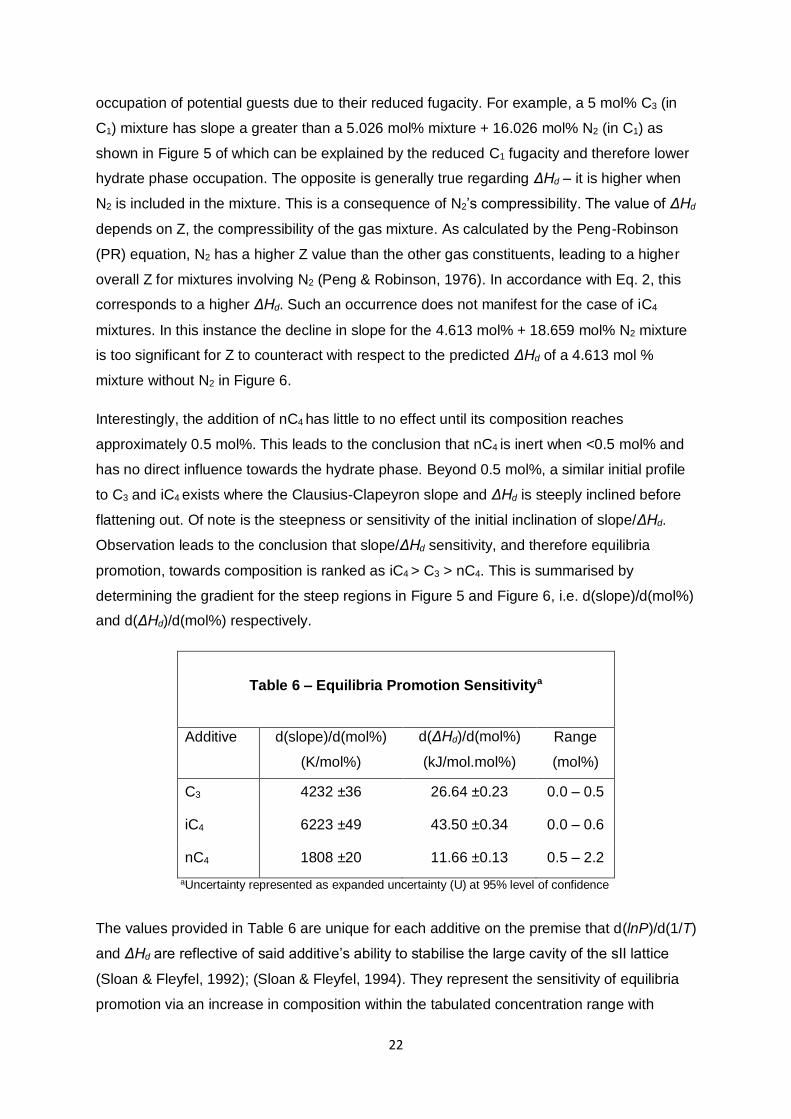
Table 6 – Equilibria Promotion Sensitivitya
Additive d(slope)/d(mol%)
(K/mol%)
d(ΔHd)/d(mol%)
(kJ/mol.mol%)
Range
(mol%)
C3 4232 ±36 26.64 ±0.23 0.0 – 0.5
iC4 6223 ±49 43.50 ±0.34 0.0 – 0.6
nC4 1808 ±20 11.66 ±0.13 0.5 – 2.2
aUncertainty represented as expanded uncertainty (U) at 95% level of confidence
The values provided in Table 6 are unique for each additive on the premise that d(lnP)/d(1/T)
and ΔHd are reflective of said additive’s ability to stabilise the large cavity of the sII lattice
(Sloan & Fleyfel, 1992); (Sloan & Fleyfel, 1994). They represent the sensitivity of equilibria
promotion via an increase in composition within the tabulated concentration range with
23
regards to ΔHd and the slope of the Clausius-Clapeyron equation. Provided that the
slope/ΔHd is known for a particular composition, equilibria for compositions within the given
range may be generated.
3.2.1 Structure Transition
In the previous section, Figure 5 and Figure 6 indicated that from 0.0 – 0.5 mol%, nC4 had no
obvious promoting effect towards the thermodynamic conditions of the resultant C1-nC4
hydrate equilibria. In identifying a similar phenomenon with the C1-C3/iC4, the vdWP model
with the PR equation of state incorporated in Calsep’s PVTsim software (ver. 20) was
consulted. Unfortunately, the experimental equipment made available was not sufficient in
accurately providing very low compositions without significant error associated with the
desired low C3/iC4/nC4 concentrations. Using computed values of pressure and temperature
for low additive compositions (0.0 – 0.5 mol%), d(lnP)/d(1/T) and ΔHd were calculated. They
are presented graphically in Figure 6, Figure 7 and Figure 8 respectively.
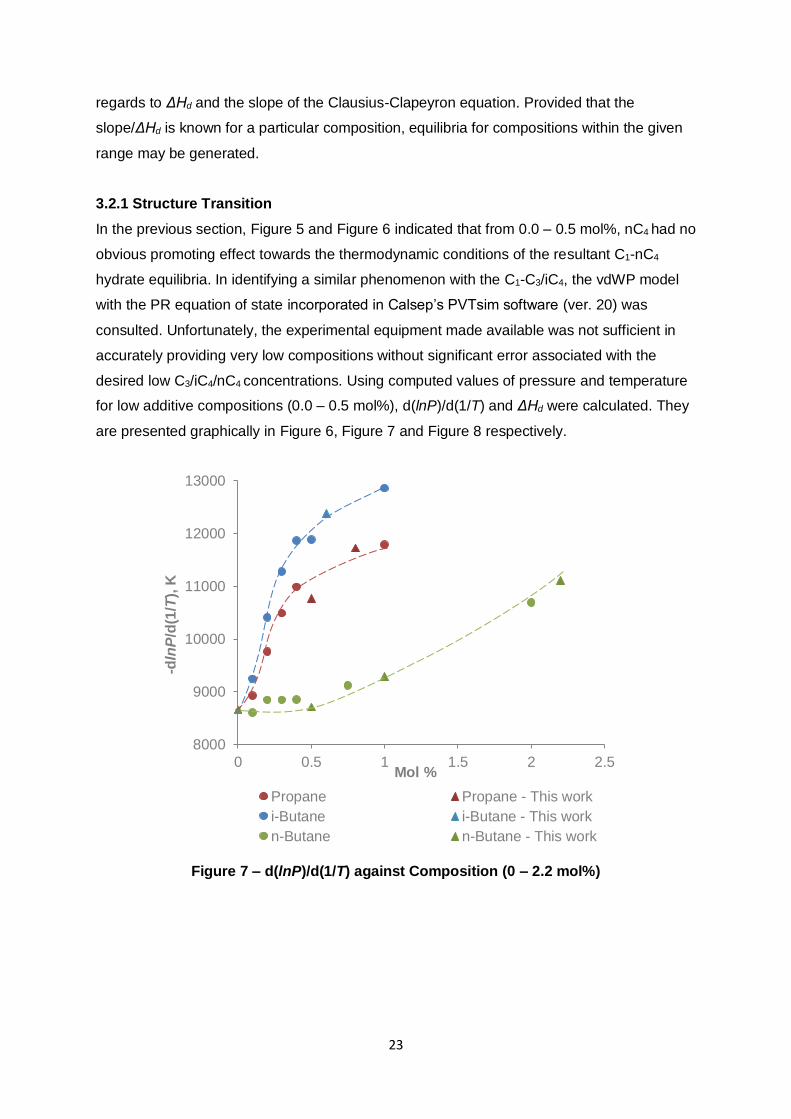
Figure 7 – d(lnP)/d(1/T) against Composition (0 – 2.2 mol%)
8000
9000
10000
11000
12000
13000
0 0.5 1 1.5 2 2.5
-dln
P/d
(1/T
), K
Mol %
Propane Propane - This work
i-Butane i-Butane - This work
n-Butane n-Butane - This work
24
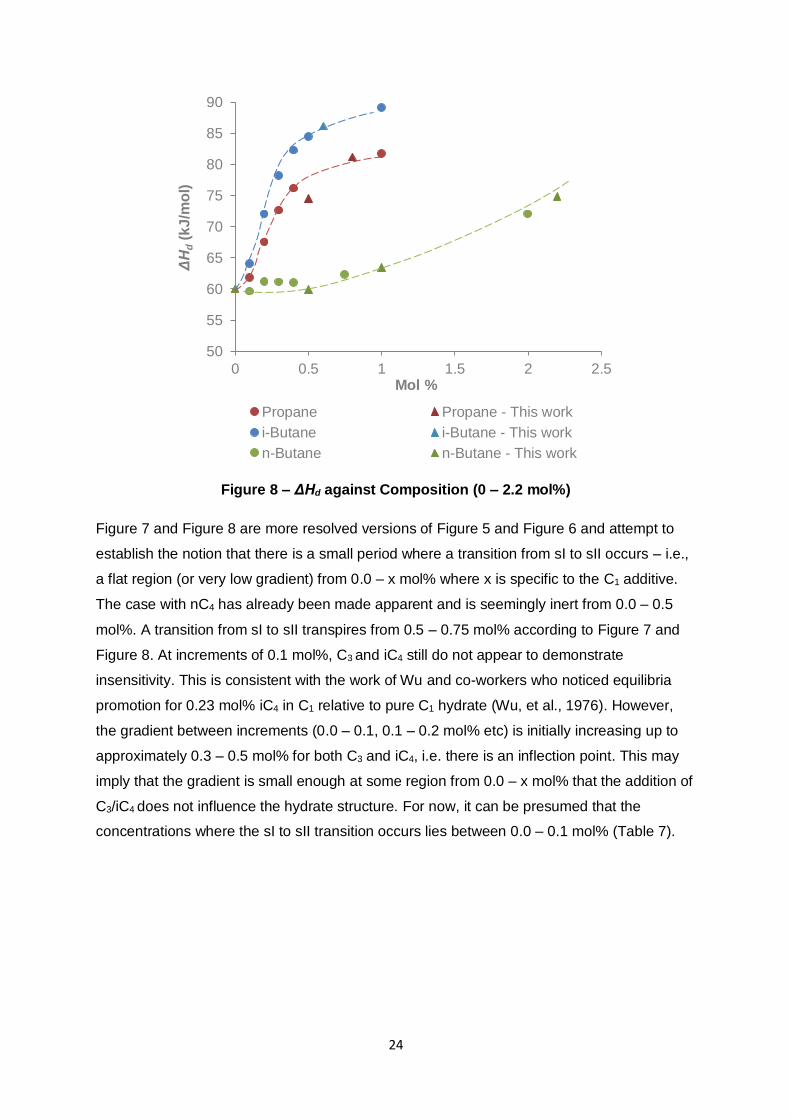
Figure 8 – ΔHd against Composition (0 – 2.2 mol%)
Figure 7 and Figure 8 are more resolved versions of Figure 5 and Figure 6 and attempt to
establish the notion that there is a small period where a transition from sI to sII occurs – i.e.,
a flat region (or very low gradient) from 0.0 – x mol% where x is specific to the C1 additive.
The case with nC4 has already been made apparent and is seemingly inert from 0.0 – 0.5
mol%. A transition from sI to sII transpires from 0.5 – 0.75 mol% according to Figure 7 and
Figure 8. At increments of 0.1 mol%, C3 and iC4 still do not appear to demonstrate
insensitivity. This is consistent with the work of Wu and co-workers who noticed equilibria
promotion for 0.23 mol% iC4 in C1 relative to pure C1 hydrate (Wu, et al., 1976). However,
the gradient between increments (0.0 – 0.1, 0.1 – 0.2 mol% etc) is initially increasing up to
approximately 0.3 – 0.5 mol% for both C3 and iC4, i.e. there is an inflection point. This may
imply that the gradient is small enough at some region from 0.0 – x mol% that the addition of
C3/iC4 does not influence the hydrate structure. For now, it can be presumed that the
concentrations where the sI to sII transition occurs lies between 0.0 – 0.1 mol% (Table 7).
50
55
60
65
70
75
80
85
90
0 0.5 1 1.5 2 2.5
ΔH
d(k
J/m
ol)
Mol %
Propane Propane - This work
i-Butane i-Butane - This work
n-Butane n-Butane - This work
25
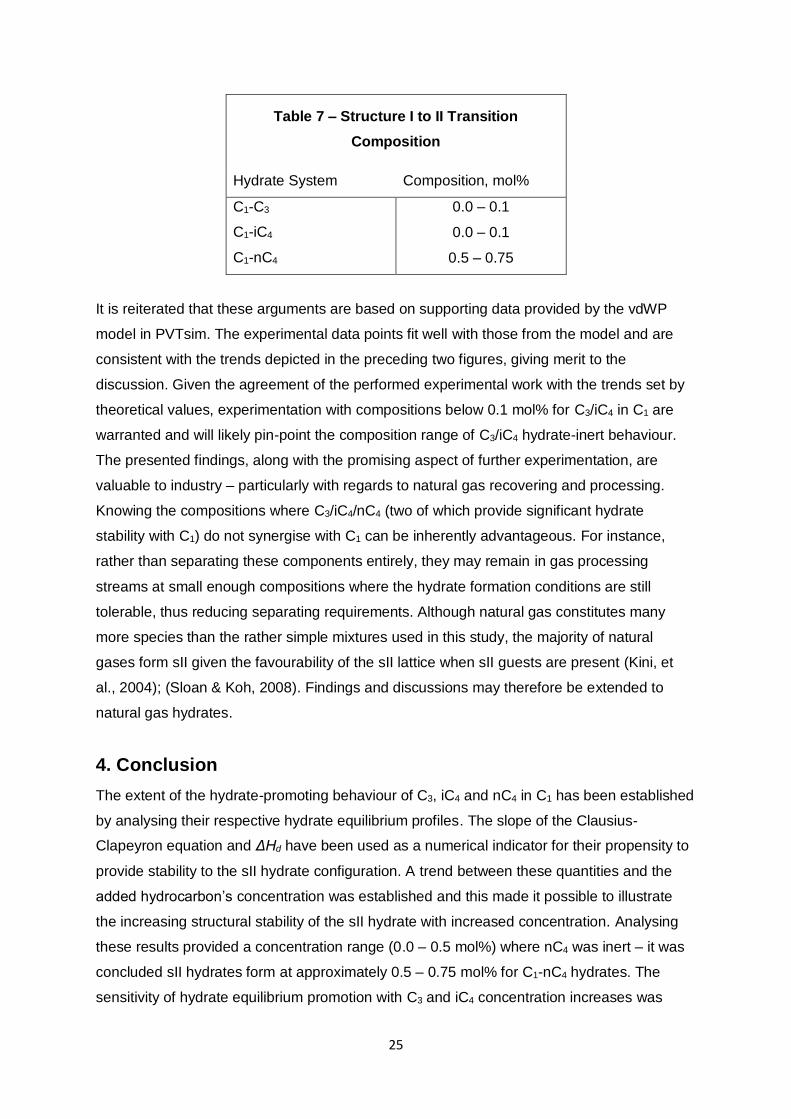
Table 7 – Structure I to II Transition
Composition
Hydrate System Composition, mol%
C1-C3 0.0 – 0.1
C1-iC4 0.0 – 0.1
C1-nC4 0.5 – 0.75
It is reiterated that these arguments are based on supporting data provided by the vdWP
model in PVTsim. The experimental data points fit well with those from the model and are
consistent with the trends depicted in the preceding two figures, giving merit to the
discussion. Given the agreement of the performed experimental work with the trends set by
theoretical values, experimentation with compositions below 0.1 mol% for C3/iC4 in C1 are
warranted and will likely pin-point the composition range of C3/iC4 hydrate-inert behaviour.
The presented findings, along with the promising aspect of further experimentation, are
valuable to industry – particularly with regards to natural gas recovering and processing.
Knowing the compositions where C3/iC4/nC4 (two of which provide significant hydrate
stability with C1) do not synergise with C1 can be inherently advantageous. For instance,
rather than separating these components entirely, they may remain in gas processing
streams at small enough compositions where the hydrate formation conditions are still
tolerable, thus reducing separating requirements. Although natural gas constitutes many
more species than the rather simple mixtures used in this study, the majority of natural
gases form sII given the favourability of the sII lattice when sII guests are present (Kini, et
al., 2004); (Sloan & Koh, 2008). Findings and discussions may therefore be extended to
natural gas hydrates.
4. Conclusion
The extent of the hydrate-promoting behaviour of C3, iC4 and nC4 in C1 has been established
by analysing their respective hydrate equilibrium profiles. The slope of the Clausius-
Clapeyron equation and ΔHd have been used as a numerical indicator for their propensity to
provide stability to the sII hydrate configuration. A trend between these quantities and the
added hydrocarbon’s concentration was established and this made it possible to illustrate
the increasing structural stability of the sII hydrate with increased concentration. Analysing
these results provided a concentration range (0.0 – 0.5 mol%) where nC4 was inert – it was
concluded sII hydrates form at approximately 0.5 – 0.75 mol% for C1-nC4 hydrates. The
sensitivity of hydrate equilibrium promotion with C3 and iC4 concentration increases was
26
mostly apparent at small concentrations. With aid of the implemented vdWP model in
PVTsim, the possibility of a small C3/iC4 inert range was implied (0.0 – 0.1 mol%).
Throughout the identified regions of high sensitivity, gradients of slope/ΔHd against
concentration were calculated and are unique for each additive. Provided the slope/ΔHd for a
particular set of equilibria at a composition within the specified range is known, equilibria for
other concentrations can be generated. The value behind this is its application to further
conformational investigation as well as to gas recovery and processing. Experimentally, the
minute concentration range for C3 and iC4 hydrate-inertness in C1 requires confirmation. With
this in mind, C3/iC4/nC4 may not be required to be separated completely from C1 for the
purpose of ensuring no promotion of the equilibrium thermodynamic parameters.
Acknowledgements
The authors wish to thank Shell Australia for their support behind this project. Their financial
and critical input has been invaluable.
27
References
Adisasmito, S., Frank, R. & Sloan, E., 1991. Hydrates of Carbon Dioxide and Methane
Mixtures. Journal of Chemical Engineering Data, pp. 68-71.
Adisasmito, S. & Sloan, E. D., 1992. Hydrates of Hydrocarbon Gases Containing Carbon
Dioxide. Journal of Chemical Engineering Data, pp. 343-349.
Byk, S. & Fomina, V., 1968. Gas Hydrates. Russian Chemical Reviews, pp. 469-91.
Cady, G. H., 1983. Composition of Gas Hydrates. Journal of Chemical Education, pp. 915-
918.
Christiansen, R. L. & Sloan, E. D., 1994. Mechanisms and Kinetics of Hydrate Formation.
Annals New York Academy of Sciences, pp. 283-305.
Claussen, W. & Frost, E., 1951. Suggested Structures of Water on Inert Gas Hydrates.
Journal of Chemical Physics, pp. 259-60.
Deaton, W. & Frost, E., 1946. Gas Hydrates and Their Relation to the Operation of Natural
Gas Pipelines, s.l.: U.S. Bureau of Mines.
Gayet, P. et al., 2005. Experimental Determination of Methane Hydrate Dissociation Curve
up to 55 MPa by Using a Small Amount of Surfactant as Hydrate Promoter. Chemical
Engineering Science, pp. 5751-58.
ISO, 2008. Evaluation of Measurement Data — Guide to the Expression of Uncertainty in
Measurement. s.l.:JCGM.
Jhaveri, J. & Robinson, D., 1965. Hydrates in the Methane-Nitrogen System. The Canadian
Journal of Chemical Engineering, pp. 75-8.
Kini, R., Dec, S. & Sloan, E., 2004. Methane + Propane Structure II Hydrate Formation
Kinetics. Journal of Physical Chemistry, pp. 9550-56.
Lederhos, J. P., Christiansen, L. & Sloan, E. D., 1993. A First Order Method of Hydrate
Equilibrium Estimation and its Use With New Structures. Fluid Phase Equilibria, pp. 83-445.
Marshall, D., Saito, S. & Kobayashi, R., 1964. Hydrates at High Pressures: Part 1. Methane-
Water, Argon-Water and Nitrogen-Water Systems. AIChE Journal, Volume 10, pp. 202-05.
Mcleod, H. & Campbell, J., 1961. Natural Gas Hydrates at Pressures to 10,000 psia. Journal
of Petroleum Technology, pp. 590-94.
Musaev, R., 1966. Candidate's Thesis, Moscow: All-Union Scientific Research Institute for
Gas.
Ng, H.-J. & Robinson, D., 1976. The Role of n-Butane in Hydrate Formation. AIChE Journal,
pp. 656-61.
Parrish, W. & Prausnitz, J., 1972. Dissociation Pressures of Gas Hydrates Formed by Gas
Mixtures. Ind. Eng. Chem. Process Des. Delep., pp. 26-34.
28
Peng, D.-Y. & Robinson, D., 1976. A New Two-Constant Equation of State. Industrial and
Engineering Chemistry: Fundamentals, pp. 59-64.
Schicks, J. et al., 2006. Phase Transitions in Mixed Gas Hydrates: Experimental
Observations versus Calculated Data. The Journal of Physical Chemistry, pp. 11468-74.
Shin, H. et al., 2009. Thermodynamic Stability, Spectroscopic Identification and Cage
Occupation of Binary CO2 Clathrate Hydrates. Chemical Engineering Science, pp. 5125-
5130.
Sloan, E. & Fleyfel, F., 1992. Hydrate Dissociation Enthalpy and Guest Size. Fluid Phase
Equilibria, pp. 123-140.
Sloan, E. & Fleyfel, F., 1994. Reply to "comments on: hydrate dissociation enthalpy and
guest size". Fluid Phase Equilibria, pp. 233-235.
Sloan, E. & Koh, C., 2008. Clathrate of Natural Gas Hydrates, Third Edition. s.l.:Taylor &
Francis Group.
Smith, C., Barifcani, A. & Pack, D., 2015. Gas Hydrate Formation And Dissociation
Numerical Modelling with Nitrogen and Carbon Dioxide. Journal of Natural Gas Science and
Engineering, Vol. 27, pp. 1118-28.
Smith, C., Barifcani, A. & Pack, D., 2016. Helium Substitution of Natural Gas Hydrocarbons
in the Analysis of their Hydrate. Journal of Natural Gas Science and Engineering, pp. 1293-
1300.
Song, K. & Kobayashi, R., 1982. Measurement and Interpretation of the Water Content of a
Methane-Propane Mixture in the Gaseous State in Equilibrium with Hydrate. Industrial &
Engineering Chemistry Fundamentals, pp. 391-95.
Stackelber, M. & Muller, H., 1951. On the Structure of Gas Hydrates. Journal of Chemical
Physics, pp. 1319-20.
Tohidi, B. et al., 2000. Improving the Accuracy of Gas Hydrate Dissociation Point
Measurements. Annals New York Academy of Sciences, pp. 924-931.
van Cleef, A. & Diepen, G., 1960. Gas Hydrates of Nitrogen and Oxygen. Recueil des
Travaux Chimiques des Pays-Bas, pp. 582-86.
van der Waals, J. & Platteeuw, J., 1959. Clathrate Solutions. Advances in Chemical Physics,
pp. 1-59.
Wu, B., Robinson, D. & Ng, H., 1976. Three- and Four-Phase Hydrate Forming Conditions in
Methane + Isobutane + Water. The Journal of Chemical Thermodynamics, pp. 461-69.