property review uae real estate report
TRANSCRIPT
Property Review
UAE Real Estate ReportQ1 2021

CONTENT
03ABU DHABI
11DUBAI
26AL AIN
20NORTHERN EMIRATES
30EMIRATES NBD
31AL TAMIMI & CO.

ABU DHABI MARKET OVERVIEW
Abu Dhabi Real Estate Report - Q1 20213
SUPPLY* RENTAL RATES SALES PRICESAsteco recorded the delivery of approximately 1,700 Apartments and 50 Villas in the first quarter of 2021 with another 11,600 Residential units expected before the end of the year, although some projects may incur delays and spill over into 2022. The majority of new supply, which is a considerable rise compared to 2020 (8,200 residential units in total), is projected to be delivered within the Investment Zones of Al Reem Island, Yas Island and Al Raha Beach, where construction activity is considerable.
Average Apartment Rental rates in Q1 2021 remained relatively stable with a marginal average quarterly decline of -1%. Annual rates, however, continued to soften, particularly within the lower end of the market, with some buildings noting decreases of -10% and -15%. There has been a marked rise in Tenant movement over the last three months, with a large majority looking to upgrade and/or upsize due to increased affordability within the mid to high end sector. Landlords continued to offer discounted Rental rates, flexible payments (up to 12 cheques, credit card payments) and incentives including rent free periods (up to 2 months), waived commission fees and redeemable retail mall vouchers. Despite ongoing economic challenges and COVID-19 concerns, the impact on the Villa market was positive, reflected by a surge in demand, particularly within well-developed villa communities such as Yas Island, Al Raha Beach, Saadiyat Island as well as the Al Reef community. Although average Villa Rental rates remained more or less unchanged over Q1 2021, there was a significant increase in rents for West Yas (more than 12%), Golf Gardens and Saadiyat Beach Villas. Annual changes were also marginal with average Villa Rental rates softening by -4%, noting the relatively limited number of Villa communities in Abu Dhabi. Despite only recording nominal quarterly Rental declines, the Office sector remained one of the most challenged asset classes in Abu Dhabi. Instead of allowing for marked rent reductions, Landlords increasingly offered incentives related to payment and lease terms (i.e.: rent free periods, service charge waivers and fit out cost contributions). It should be noted, however, that several Grade A and B Office buildings experienced a rise in demand from Chinese and Israeli companies looking to establish a base in Abu Dhabi.
Demand for and transaction activity of completed Villas remained high in Q1 2021, predominantly driven by the limited availability of good quality properties offered for sale at attractive rates. Aldar’s West Yas, for example, a residential development on Yas Island with over 1,000 Villas (4 BR and 5 BR), recorded a sharp rise in Sales prices, from the end of 2020. Similarly, the recently handed over units in Yas Acres, a villa community by the same developer, registered strong levels of demand and well positioned units were sold at a premium. Affordable communities such as Al Reef also noted heightened interest resulting in an average quarterly rise in Sales prices of 7%. Apartment Sales prices remained broadly unchanged over the last 3 months due to limited demand in this sector, particularly for older mid quality stock located across different areas in Abu Dhabi with annual rates softening by -2% on average.
*It is important to note that whilst a number of projects may have received completion certificates, Asteco does not consider a project delivered until the handover process has been initiated and the units are available for Lease in the open market.

APARTMENTSNO. OF UNITS
VILLASNO. OF UNITS
ABU DHABI SUPPLY
Abu Dhabi Real Estate Report -
6,150 1,700 11,000
2,050 50 600
Q1 2021
2020 Q1 2021 END OF 2021
4
COMPLETED IN COMPLETED IN PROJECTED

ABU DHABI APARTMENT RENTAL RATES
(All figures in AED 000’s p.a.)
STUDIO 1 BEDROOM 2 BEDROOMS 3 BEDROOMS % CHANGE
FROM TO FROM TO FROM TO FROM TO Q4 2020 - Q1 2021 Q1 2020 - Q1 2021
PRIME PROPERTIESABU DHABI ISLANDINVESTMENT AREAHIGH END PROPERTIES
ABU DHABI ISLANDCentral Abu DhabiCornicheKhalidya / Bateen
INVESTMENT AREA
Al Raha BeachMarina SquareShams Abu DhabiSaadiyat BeachYas Island
MID END PROPERTIESABU DHABI ISLAND
INVESTMENT AREAShams Abu DhabiNajmat & TamouhAl Raha Beach
OFF ISLAND Khalifa & MBZ CityLOW END PROPERTIES
ABU DHABI ISLANDCentral Abu DhabiCornicheKhalidiya / Bateen
INVESTMENT AREA Al ReefOFF ISLAND Khalifa & MBZ City
Abu Dhabi Real Estate Report -
-14%-33%-8%-1%
Q1 20215
Since Q4 2020 Since Q1 2020 Q4 2015Since peak
Q2 2012Since market lowY-o-YQ-o-Q
-1%0%
-6%-6%
0%0%
-9%-16%
-1%0%
-3%-2%
0%-3%
-7%-8%
0% -4%
-2% -11%
0% -6%0%0%
-7%-6%
0% -4%
-1% -8%
-1% -10%0% -7%0% -8%
0% -5%
-2% -8%
150 230170 280
120 125 115 130 105110140
145155
185 145 145160
170
90 14595 12590 130
115 130
55 9268 8065 8575 9260 75
160 170
- -
150
105115
135102115135
135
185
1159095
110
5860606852
120
110
100
758070
1006977
112
110
606564
60
455550 5845
100
75
65 10090 145
55 6065 7565 8065 8552 7055 7070 82
48 7550 60 50 68
42 70
40 4542 50 40 45 45 5232 42
70 80
50 65
- - 65 95
40 455570
50
55 70 40 4542 48- -
65
40 50- -
35 45
23 38
30 3530 3525 3832 40 22 32
50 55
45 48
% Change

% CHANGE
ABU DHABI APARTMENT SALES PRICES
Abu Dhabi Real Estate Report -
(All figures in AED per sq.ft.) 0 500 1,000 1,500 2,000(All figures in AED per sq.ft.) 0 500 1,000 1,500 2,000
AL BANDAR
AL MUNEERA
AL ZEINA
CITY OF LIGHTS (HYDRA)
CITY OF LIGHTS (OTHER PROJECTS*)
MARINA SQUARE
REEF DOWNTOWN
SAADIYAT BEACH RESIDENCES
SUN & SKY TOWERS
THE GATE
YAS ISLAND
1,050 1,400
775 900
925 1,100
950 1,150
750 850
825 1,000
1,150 1,350
775 950
850 975
850 975
Q4 2020 - Q1 2021 Q1 2020 - Q1 2021
600 800
0% -3%
0% -2%
0% -1%
0% 0%
0% -1%
0% -7%
0% 0%
0% 0%
0% 0%
0% 0%
-1% -4%
Q-o-Q Y-o-Y Since peak Since market lowQ4 2015 Q2 2012
4%
Since Q4 2020
0%
Since Q1 2020
-2% -34%
Q1 20216
% Change* Includes Meera Towers and Park View

ABU DHABI VILLA RENTAL RATES
(All figures in AED 000’s p.a.)
2 BEDROOMS 3 BEDROOMS 4 BEDROOMS 5 BEDROOMS % CHANGE
ABU DHABI ISLANDKhalidiya / BateenMushrif / Karama / ManaseerNahyan Camp / Muroor
INVESTMENT AREA
Al Raha BeachAl ReefHydra VillageSaadiyat Beach VillasHidd Al SaadiyatWest Yas
OFF ISLAND
Al Raha GardensGolf GardensKhalifa CityMohamed Bin Zayed
Abu Dhabi Real Estate Report -
FROM TO FROM TO FROM TO FROM TO Q4 2020 - Q1 2021 Q1 2020 - Q1 2021
Q1 2021
0%-22%-4%
Since Q1 2020
0%*
Since Q4 2020
7
Since peak Since market lowQ4 2015 Q4 2012
Q-o-Q Y-o-Y
- - - - - - - -
72 7552 57- - - -
- - - - - -- -
- -
140 160140 160125 155 165 185 90 100 62 70
270 310- -
130 145 190 200
115105 100 105
- -
145 175140 165145 170 185 260 125 135
- - 300 365300 330
140 160210 230105 130
130105
220 235
165 210150 205150 175240 260130 145
- -380 670330 710
180 205235 260125 155110 145
240 250
0%0%
-1%-3%
0%0%0%
-1%
-7%0%0%
-1%
1%4%2%
3%
6%0% -1%7%
0%0% -1%0%
12%12%
% Change** Excludes West Yas Villas

ABU DHABI VILLA SALES PRICES
% CHANGE
Abu Dhabi Real Estate Report -
(All figures in AED Million) 0 1 2 3 4 6 7 85 9
AL REEF VILLAS
2 BR3 BR4 BR5 BR
GOLF GARDENS
-3 BR4 BR5 BR
HIDD AL SAADIYAT
--
4 BR5 BR
HYDRA VILLAGE
2 BR3 BR
--
RAHA GARDENS
-3 BR4 BR5 BR
SAADIYAT BEACH VILLAS (STANDARD)
2 BR3 BR4 BR5 BR
--
4 BR
1.501.85
2.30
3.053.75
4.88
6.258.00
0.921.20
2.052.33
3.45
5.58
Q4 2020 - Q1 2021 Q1 2020 - Q1 2021
1.13
5.00
7.75
5.085.755 BR
WEST YAS
7% 3%
0% 0%
0% 0%
0% 0%
0% 0%
0% -8%
24% 24%
-1% -15%
Since Q4 2020 Since Q1 2020
1% 15%**
Q1 20218
Since peak Since market lowQ4 2015 Q4 2012
Q-o-Q Y-o-Y% Change** Excludes West Yas Villas ** Includes Raha Gardens, Golf Gardens & Al Reef Villas only. Later averages are reflective of an increase in new developments of higher quality.
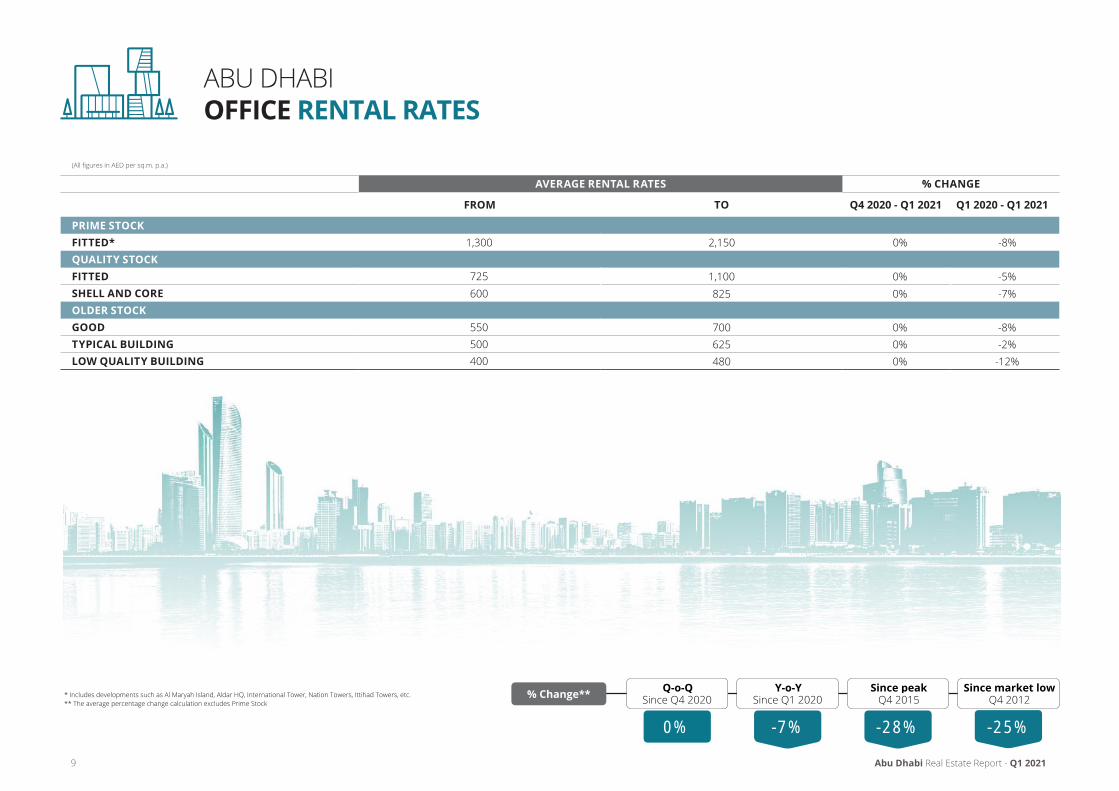
ABU DHABI OFFICE RENTAL RATES
(All figures in AED per sq.m. p.a.)
AVERAGE RENTAL RATES % CHANGE
FROM TO
PRIME STOCKFITTED*QUALITY STOCKFITTEDSHELL AND COREOLDER STOCKGOODTYPICAL BUILDINGLOW QUALITY BUILDING
Abu Dhabi Real Estate Report -
Q4 2020 - Q1 2021 Q1 2020 - Q1 2021
-25%-28%
Since Q1 2020
-7%0%
Since Q4 2020
Q1 20219
Since peak Since market lowQ4 2015 Q4 2012
Q-o-Q Y-o-Y* Includes developments such as Al Maryah Island, Aldar HQ, International Tower, Nation Towers, Ittihad Towers, etc. ** The average percentage change calculation excludes Prime Stock
1,300
725600
550500 400
2,150
1,100825
700625480
0%
0% 0%
0% 0% 0%
-8%
-5% -7%
-8% -2%
-12%
% Change**

Abu Dhabi Real Estate Report -
1 Al Bandar – Raha Beach2 Al Bateen Wharf3 Al Gurm4 Al Maqtaa5 Al Muneera – Al Raha Beach6 Al Nahyan Camp7 Al Raha Gardens8 Al Rayyana9 Al Reef10 Al Zeina – Al Raha Beach11 Baniyas12 Bateen Airport Area13 Bateen Area14 Bawabat Al Sharq15 Capital District (ADNEC)16 CBD / Tourist Club Area17 Corniche 18 Danet Abu Dhabi19 Eastern Mangroves20 Golf Gardens21 Hydra Village22 Khalidia / Al Hosn / Al Manhal23 Khalifa City A24 Khalifa City B25 Maryah Island26 MBZ City27 Mina28 Mushrif / Karama / Manaseer / Muroor29 Officer’sCity30 Rawdhat Abu Dhabi31 Reem Island - Marina Square32 Reem Island – Najmat Abu Dhabi33 Reem Island – rest of Shams Abu Dhabi34 Reem Island – City of Lights35 Reem Island – The Gate District36 Rihan Heights37 Saadiyat Beach District38 The Hills
YASISLAND
14
11
17
132
22
31
25
19
33
35
34
32
37
36
38
29
15
18
28
24
6
12
4
26
2320
8
1
7
109
5
30
27
16
3
21
33
11
11
22
ABU DHABI PROPERTY MAP
Q1 202110
Dubai Real Estate Report -
DUBAI MARKET OVERVIEW
11 Q1 2021
SUPPLY* RENTAL RATES SALES PRICES
*It is important to note that whilst a number of projects may have received completion certificates, Asteco does not consider a project delivered until the handover process has been initiated and the units are available for Lease in the open market.
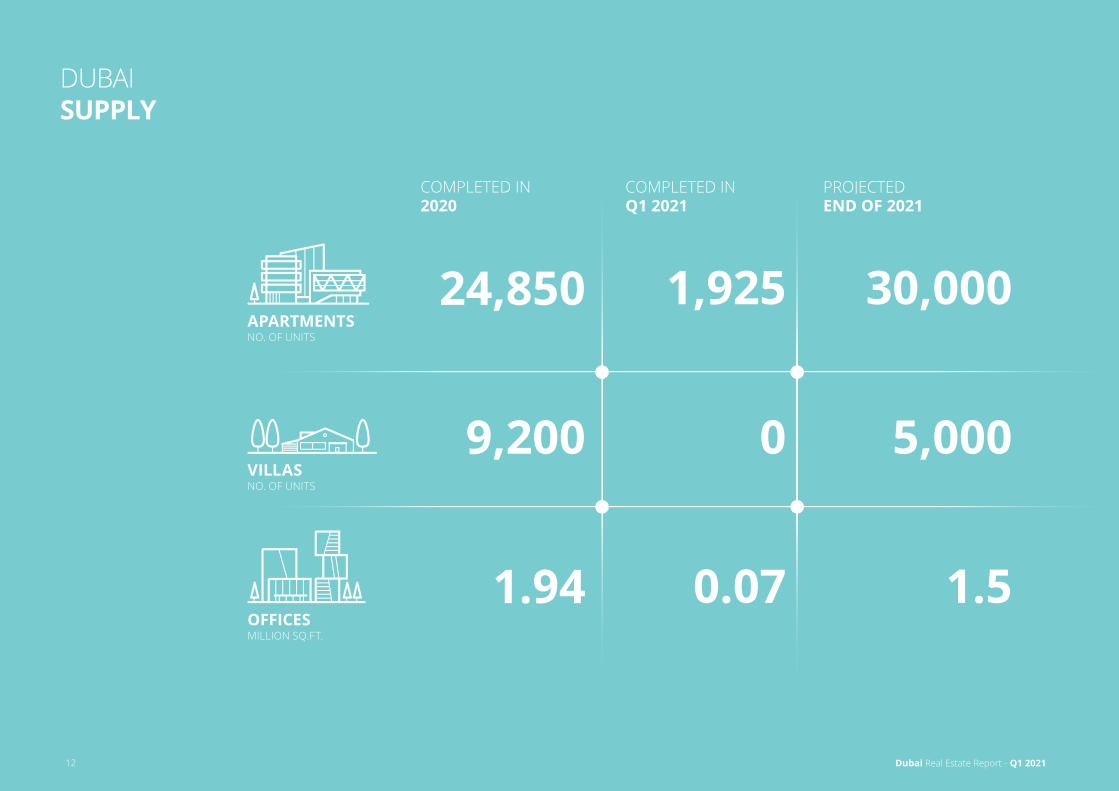
As a result of COVID-19 linked restrictions, uncertainties and obstacles, new supply fell short of earlier estimates and presented a significant drop compared to previous quarters. Whilst no large-scale Villa developments were handed over during the first 3 months of 2021, new Apartment supply stood at 1,925 units with notable deliveries in emerging communities such as Dubai Hills Estate and Dubai Creek Harbour. Office completions were marginal at 70,000 sq.ft. of space. However, at the time of the report, a number of projects were in the last stage of construction/handover and are expected to enter the market within the next 3 to 6 months. There has also been a modest rise in new project launches (off-plan, under construction and completed developments), which were generally well received by Investors and End-users alike.
Rental rate growth in Q1 2021 was nothing short of a ‘mixed bag’ with positive and negative changes recorded on an inter (across) and intra (within) community level. Whilst average Apartment and Villa Rental rates grew by 1% and 4% over the first quarter, annual declines remained in contraction at -10% and -2%, respectively. It should be noted, however, that Asteco recorded significant fluctuations across different developments and/or buildings ranging from single digit declines to double digit increases. Villa developments (mature and emerging) in particular recorded a surge in demand and consequently a rise in Rental and occupancy rates as a result of changing working and living habits. Office Rental rates continued their downward trajectory with quarterly and annual drops of -3% and -18% in line with stunted employment/business growth and the continued uncertainty regarding the speed of economic recovery.
Similar to the Leasing market, the unprecedented COVID-19 situation has affected Sales prices markedly and to varying degrees with an average quarterly growth of 3% for Apartments and 6% for Villas. Whilst some of the impact has been adverse, particularly in regards to Investment properties (typically driven by Rental returns and/or business revenues) such as Educational, Hospitality and Office sectors, there have been notable exceptions, underpinned by improved market sentiment and pro-active Government initiatives/announcements including the introduction of the self-sponsored ‘Remote Work Visa’ (1 year), the 5-year self-sponsored ‘Multiple Entry Tourist Visa’ and the Dubai 2040 Urban Master Plan. The effect on the Residential sector (where demand is often a combination of Investor driven returns and End-user requirements) has been much more nuanced. A prominent beneficiary has been the Villa segment with a marked increase in activity, inasmuch that Sales prices for the Arabian Ranches, Meadows and Springs, for example, rose by 9% over the quarter. Indeed, it would appear that COVID-19 has proven the catalyst for the current rally. Apartment Sales have also shown an increased level of interest since the beginning of 2021 with both activity and prices in certain communities such as Jumeirah Village (5%) and Dubai Sports City (5%) recording notable gains. However, the economic impact of COVID-19 on the real estate market has yet to be fully quantified. Over the short to medium term it is likely to heighten levels of uncertainty, and the potential for increased volatility (both in terms of values and activity) will continue. Until greater stability returns to the market it is difficult to predict when conditions will normalise and how transactional volumes and values will be affected.
APARTMENTSNO. OF UNITS
VILLASNO. OF UNITS
OFFICESMILLION SQ.FT.
DUBAI SUPPLY
Dubai Real Estate Report -
24,850 1,925
9,200
2020 Q1 2021 END OF 2021
30,000
0 5,000
1.94 0.07 1.5
12 Q1 2021
COMPLETED IN COMPLETED IN PROJECTED
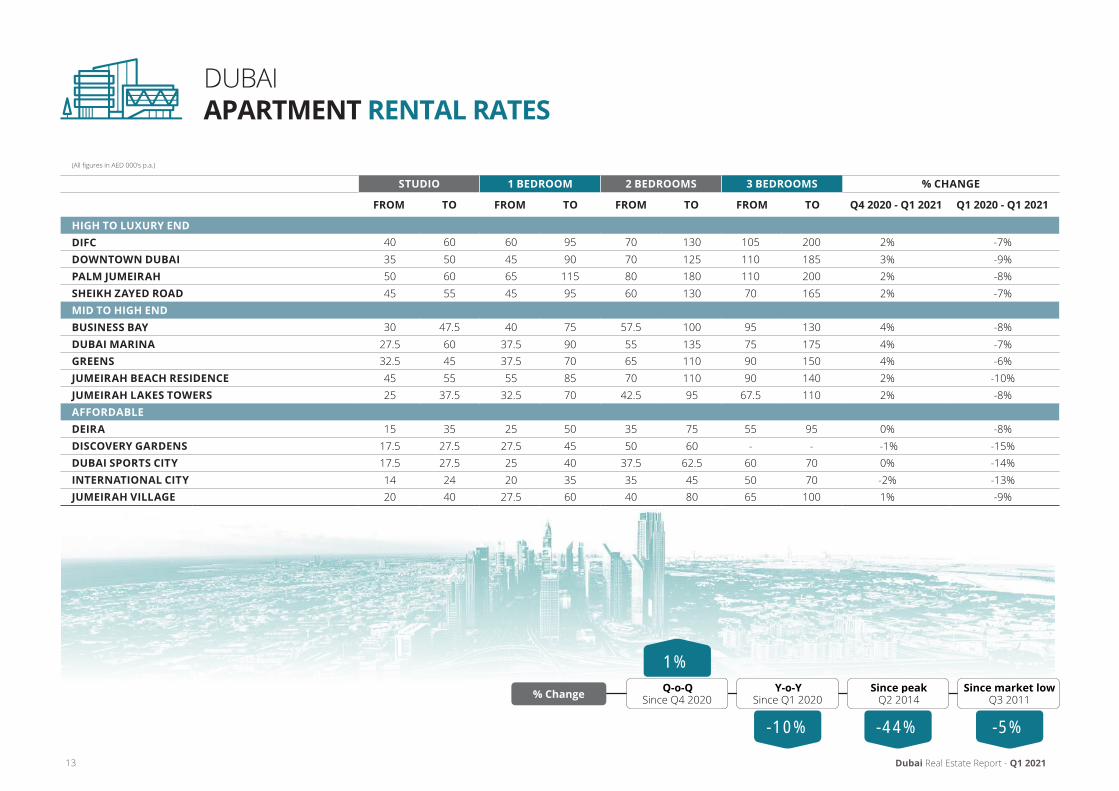
DUBAI APARTMENT RENTAL RATES
(All figures in AED 000’s p.a.)
STUDIO 1 BEDROOM 2 BEDROOMS 3 BEDROOMS % CHANGE
HIGH TO LUXURY ENDDIFCDOWNTOWN DUBAIPALM JUMEIRAHSHEIKH ZAYED ROADMID TO HIGH ENDBUSINESS BAYDUBAI MARINAGREENSJUMEIRAH BEACH RESIDENCEJUMEIRAH LAKES TOWERSAFFORDABLEDEIRADISCOVERY GARDENSDUBAI SPORTS CITYINTERNATIONAL CITYJUMEIRAH VILLAGE
Dubai Real Estate Report -
FROM TO FROM TO FROM TO FROM TO Q4 2020 - Q1 2021 Q1 2020 - Q1 2021
1%
-5%-44%
Since Q1 2020
-10%
Since Q4 2020
13 Q1 2021
Since peak Since market lowQ2 2014 Q3 2011
Y-o-YQ-o-Q
40 6035 5050 6045 55
30 47.527.5 6032.5 4545 5525 37.5
351517.5 27.517.5 27.514 2420 40
60 9545 9065 11545 95
40 7537.5 9037.5 7055 85
32.5 70
25 5027.5 4525 4020 35
27.5 60
1307070 125
1808013060
57.5 10055 13565 11070 110
42.5 95
35 7550 60
62.537.535 4540 80
105 200110 185110 20070 165
95 13017575
90 15090 140
67.5 110
9555-
60 -
7050 7065 100
2%3%2%2%
4%4%4%2%2%
0% -1%0%-2%1%
-7%-9%-8%-7%
-8%-7%-6%
-10%-8%
-8%-15%-14%-13%-9%
% Change
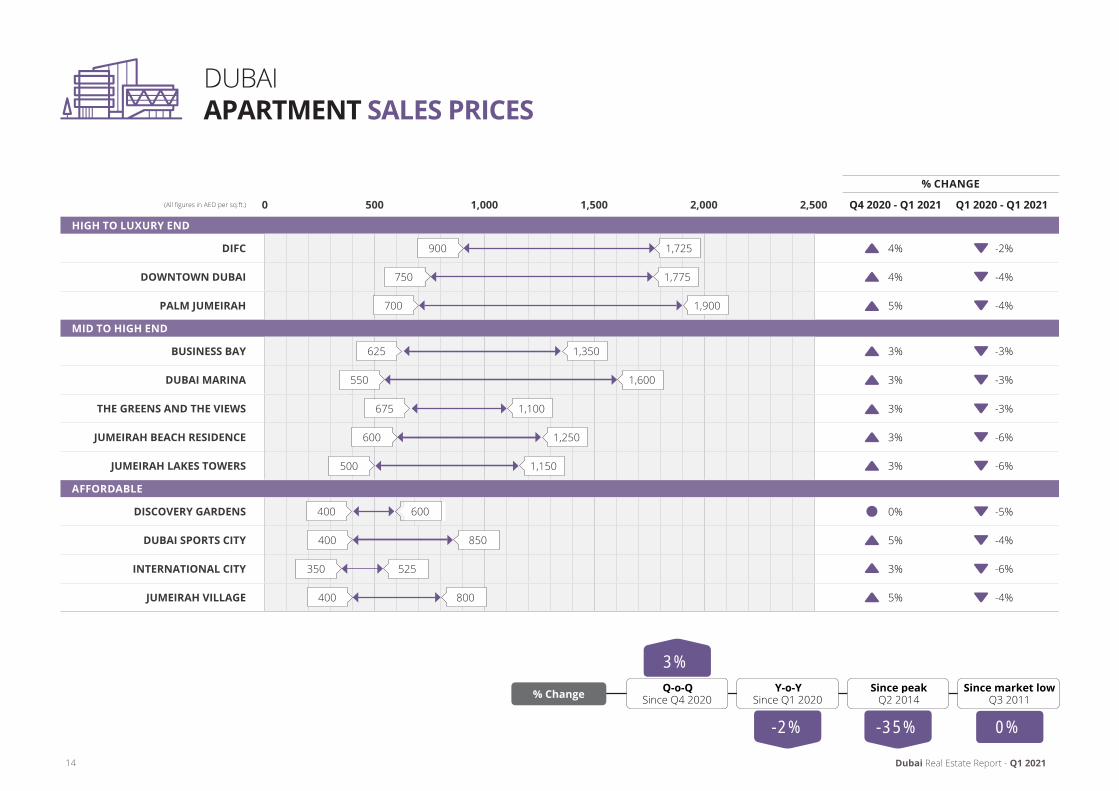
DUBAI APARTMENT SALES PRICES
% CHANGE
Dubai Real Estate Report -
(All figures in AED per sq.ft.)
HIGH TO LUXURY END
DIFC
DOWNTOWN DUBAI
PALM JUMEIRAH
MID TO HIGH END
BUSINESS BAY
DUBAI MARINA
THE GREENS AND THE VIEWS
JUMEIRAH BEACH RESIDENCE
JUMEIRAH LAKES TOWERS
AFFORDABLE
DISCOVERY GARDENS
DUBAI SPORTS CITY
INTERNATIONAL CITY
JUMEIRAH VILLAGE
0 500 1,000 1,500 2,5002,000
900 1,725
625 1,350
750 1,775
550 1,600
400 850
500 1,150
675 1,100
350 525
700 1,900
600 1,250
400 800
600400
Q4 2020 - Q1 2021 Q1 2020 - Q1 2021
3%
Since Q4 2020 Since Q1 2020
-2% -35% 0%
14 Q1 2021
4% -2%
4% -4%
5% -4%
3% -3%
3% -3%
3% -3%
3% -6%
3% -6%
0% -5%
5% -4%
3% -6%
5% -4%
Q-o-Q Y-o-Y Since peakQ2 2014
Since market lowQ3 2011% Change

DUBAI VILLA RENTAL RATES
(All figures in AED 000’s p.a.)
2 BEDROOMS 3 BEDROOMS 4 BEDROOMS 5 BEDROOMS % CHANGE
AKOYA OXYGENARABIAN RANCHESDUBAI HILLS ESTATEDUBAI SILICON OASIS (CEDRE VILLAS)DUBAI SPORTS CITY (VICTORY HEIGHTS)JUMEIRAH/UMM SUQEIMJUMEIRAH PARKJUMEIRAH VILLAGEMEADOWSMIRDIFPALM JUMEIRAHSPRINGS
Dubai Real Estate Report -
FROM TO FROM TO FROM TO FROM TO Q4 2020 - Q1 2021 Q1 2020 - Q1 2021
THE LAKES
4%
Since Q1 2020
-1% -35% 0%
Since Q4 2020Q-o-Q Y-o-Y Since peak
Q2 2014Since market low
Q2 2012
Q1 202115
90 130
- -- -
- -72.5 100
- -50 70- -
75 110
37.5 65105 160115 165130 140100 125110 195165 19080 115
130 18060 110
150 250110 150
70 80130 200125 230135 140125 160110 245165 24085 125
170 23580 120
220 385- -
75 85200 275145 250150 180140 230135 275230 280100 140200 25585 120
350 750- -
2% -11%4% 2%8% 0%6% 1%2% -7%5% -3%8% 9%4% -4%4% 3%0% -6%4% 4%5% -1%
% Change
-1%2%300250240190170145--

DUBAI VILLA SALES PRICES
% CHANGE
Dubai Real Estate Report -
(All figures in AED per sq.ft.)
AKOYA OXYGEN
ARABIAN RANCHES
JUMEIRAH PARK
JUMEIRAH VILLAGE
MEADOWS
PALM JUMEIRAH
SPRINGS
0 1,000 2,000 3,000 4,000
450 625
750 1,400
700 1,100
375 700
775 1,150
900 3,300
675 1,075
Q4 2020 - Q1 2021 Q1 2020 - Q1 2021
675 1,100
DUBAI HILLS ESTATE
-41% -1%
Since Q4 2020 Since Q1 2020
3%6%
16 Q1 2021
8% 3%
6% 0%
6% 0%
7% 15%
5% -5%
9% 9%
8% 8%
9% 13%
Y-o-YQ-o-Q Since peakQ2 2014
Since market lowQ3 2011% Change
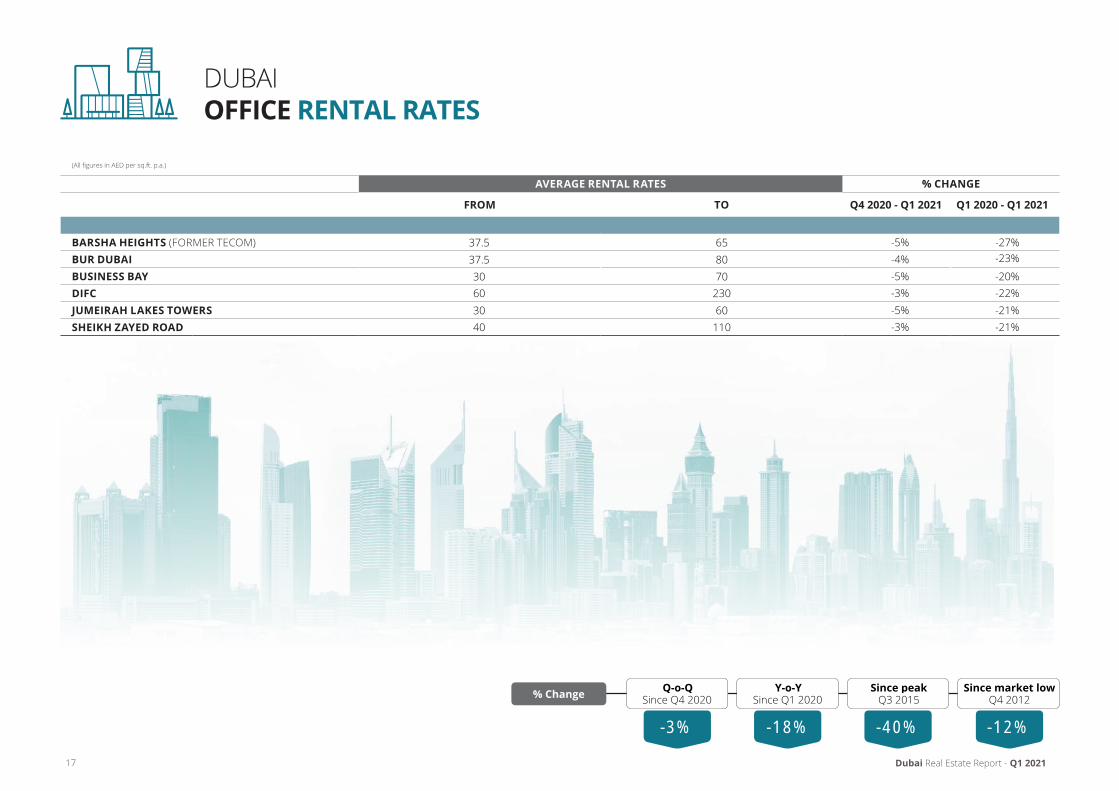
(All figures in AED per sq.ft. p.a.)
AVERAGE RENTAL RATES % CHANGE
FROM TO
BARSHA HEIGHTS (FORMER TECOM)BUR DUBAIBUSINESS BAYDIFCJUMEIRAH LAKES TOWERSSHEIKH ZAYED ROAD
DUBAI OFFICE RENTAL RATES
Dubai Real Estate Report -
Q4 2020 - Q1 2021 Q1 2020 - Q1 2021
-3% -18% -40% -12%
Since Q4 2020 Since Q1 2020
0%
17 Q1 2021
Q-o-Q Y-o-Y Since peak Since market lowQ4 2012Q3 2015
37.5 6537.5 8030 7060 23030 6040 110
-27%-5%-23%-4%-20%-5%
-3% -22%-21%-5%
-3% -21%
% Change

DUBAI OFFICE SALES PRICES
% CHANGE
Dubai Real Estate Report -
(All figures in AED per sq.ft.)
BARSHA HEIGHTS (FORMER TECOM)
BUSINESS BAY
DIFC
JUMEIRAH LAKES TOWERS
0 500 1,000 1,500 2,000
410 750
450 1,100
950 1,550
325 875
Q4 2020 - Q1 2021 Q1 2020 - Q1 2021
-2% -9% -40% -7%
Since Q4 2020 Since Q1 2020
-1% -11%
-4% -14%
-2% -8%
0% -10%
Q-o-Q Y-o-Y Since peakQ1 2015 Q2 2012
Since market low
Q1 202118
% Change

DUBAI PROPERTY MAP
311
311
311
611
611
611
1111
44
44
21
2
4
3
5
27
2324
25
6 8
62
6459
57
5856
55
61
70
6665
67
6872
69
71
85
50
4748
51
49
73
4645
63
7876
77
87
86
81
84
83
7
31
29
30
22
28
26
3235
53
52
41
37 38
34
9
15 1817
1410
16
36
1113
1220
19
42
43
82
80
79
44
54
6075
74
39 40
33
1
To Sharjah
To Abu Dhabi
Arabian Gulf
1 Veneto2 Badrah3 Bluewater Island4 JBR5 Dubai Marina6 Dubai Internet City,
Dubai Media City & Knowledge Village
7 Palm Jumeirah8 Umm Suqeim9 Jumeirah10 Jumeirah Bay Island11 City Walk12 Al Satwa13 Sheikh Zayed Road14 La Mer15 Pearl Jumeirah16 Bur Dubai17 Dubai Maritime City18 Port Rashid19 Deira Island20 Deira21 Downtown Jebel Ali22 Wasl Gate23 Al Furjan24 Discovery Gardens25 Jumeirah Park26 Jumeirah Islands27 Jumeirah Lakes
Towers28 Springs / Meadows29 Emirates Hills30 The Lakes31 The Greens32 Barsha Heights
(Tecom C) 33 Al Barsha34 Business Bay35 Downtown Dubai36 DIFC37 Dubai Design District38 Dubai Healthcare
City Phase 2 39 Al Jadaf40 Jaddaf Waterfront
(Culture Village)41 Dubai Festival City42 Al Nahda43 Al Qusais44 Muhaisnah
45 Jumeirah Village Triangle
46 Jumeirah Village Circle47 Dubai Science Park48 Arjan49 Dubai Hills Estate50 Living Legends51 Al Barari52 MBR City53 Meydan54 Dubai Creek Harbour55 Commercial District 56 Golf District57 Logistic District58 Aviation District59 Expo 202060 Residential District61 Dubai Investment
Park62 Green Community63 Dubai Production
City (IMPZ)64 Jumeirah Golf Estates65 Victory Heights66 Dubai Sports City67 MotorCity68 Dubai Studio City69 Damac Hills70 Remraam71 Mudon72 Arabian Ranches73 Dubailand74 Falcon City of
Wonders75 The Villa76 Liwan77 Dubai Residence
Complex78 Dubai Silicon Oasis79 Dubai Academic
International City80 International
City Phase 2 & 381 International City82 Al Warqaa83 Mirdif84 UptownMirdiff85 Town Square86 Mira87 Akoya Oxygen
Dubai Real Estate Report -19 Q1 2021

Northern Emirates Real Estate Report -
NORTHERN EMIRATES MARKET OVERVIEW
20
RENTAL RATES
Q1 2021
Apartment Rental rates across the Northern Emirates remained more or less stable over Q1 2021, with marginal declines of -1% for high end properties in Ras Al Khaimah (RAK) and Fujairah. Annual drops averaged 8%. Limited demand resulting from stagnant business growth resulted in Sharjah Office Rental rate declines of -4% over the quarter and -21% compared with the same period last year.
Despite COVID-19 related challenges, on a global and local level, there have been some signs of growing confidence in the Real Estate market. Apartment Sales prices in Sharjah increased by 3% over the last 3 months, whilst RAK recorded no change. According to the Sharjah Real Estate Registration Directorate (SRERD), 64,459 transactions valued at AED 15.9 billion were recorded in 2020, a 5% growth compared to 2019. The majority of those transactions concerned the Residential sector (75.3%), followed by Commercial (11.1%), Industrial (10.4%) and Agricultural (3.2%). In March 2021, Majid Al Futtaim opened City Centre at Al Zahia, the largest super regional mall in the Northern Emirates spreading over 1.47 million sq.ft. of gross leasable space and featuring more than 360 brands. Prominent project launches in Q1 2021 included the last phase of Al Mamsha by Alef Group, adding 159 x 1 BR units (six different layouts) to the master plan development. Al Mamsha Edge offers flexible payment plans with 0% down payment and monthly installments of below 1%. In support of the UAE Green Initiative, Rawasi Real Estate launched the first ‘2 Pearl ESTIDAMA’ rated project in Fujairah, a sustainable Residential development extending 18,000 sq.ft. Naseem Al Bahar is located in Al Faseel, near mountains and springs and consists of 80 x G+1 townhouses. Residents of the 4 BR units are expected to save up to 50% in utility bills due to energy efficiency. Notwithstanding some of the positive developments, continued economic uncertainty is likely to put further pressure on the Real Estate market in the Northern Emirates in the short to medium term.
SALES PRICES
GENERAL

NORTHERN EMIRATES APARTMENT RENTAL RATES
(All figures in AED 000's p.a.)
STUDIO 1 BEDROOM 2 BEDROOMS 3 BEDROOMS % CHANGE
SHARJAHTypicalHigh End
AJMANTypicalHigh End
UMM AL QUWAIN
RAS AL KHAIMAHTypicalHigh End
FUJAIRAHTypicalHigh End
Northern Emirates Real Estate Report -
FROM TO FROM TO FROM TO FROM TO Q4 2020 - Q1 2021 Q1 2020 - Q1 2021
0% -8% -39% -16%
Since Q4 2020 Since Q1 2020
Q1 202121
Q-o-Q Y-o-Y Since peak Since market lowQ4 2012Q1 2015
9 1415 2010 1212 1710 13
11.5 1516 2313 16.518 22
12 17.518 3412 1415 2515 2016 2022 3716 2227 34
15 2221 5014 2020 3520 2817 2934 4920 26.532 47
28 3132 6520 2830 4027 3032 4152 7232 3850 62
0% -13%0% -13%0% -10%0% -6%0% -6%0% -7%-1% -4%0% -9%-1% -4%
% Change

SHARJAH APARTMENT RENTAL RATES
(All figures in AED 000’s p.a.)
STUDIO 1 BEDROOM 2 BEDROOMS 3 BEDROOMS % CHANGE
AL MAJAZAL QASIMIAHAL NAHDAAL KHAN (AL MAMZAR)ABU SHAGARAAL BUTINAAL YARMOOKROLLAAL WAHDACORNICHE
Northern Emirates Real Estate Report -
FROM TO FROM TO FROM TO FROM TO Q4 2020 - Q1 2021 Q1 2020 - Q1 2021
Since Q1 2020
-9% -41% -7%
Since Q4 2020
0%
22 Q1 2021
Q-o-Q Y-o-Y Since peakQ1 2015
Since market lowQ4 2011% Change
13 17.511 1612 2014 1812 1709 1310 1310 1213 1813 20
18 3013.5 2615 3219 3015 2412 2114 1613 1816 2322 28
22 4216 3418 4525 4720 3215 2415 2016 2322 3325 40
29 6530 4332 6536 6030 4028 3628 3828 3528 4235 65
0% -10%0% -7%0% -3%0% -7%0% -5%0% -11%0% -12%0% -13%0% -12%0% -10%
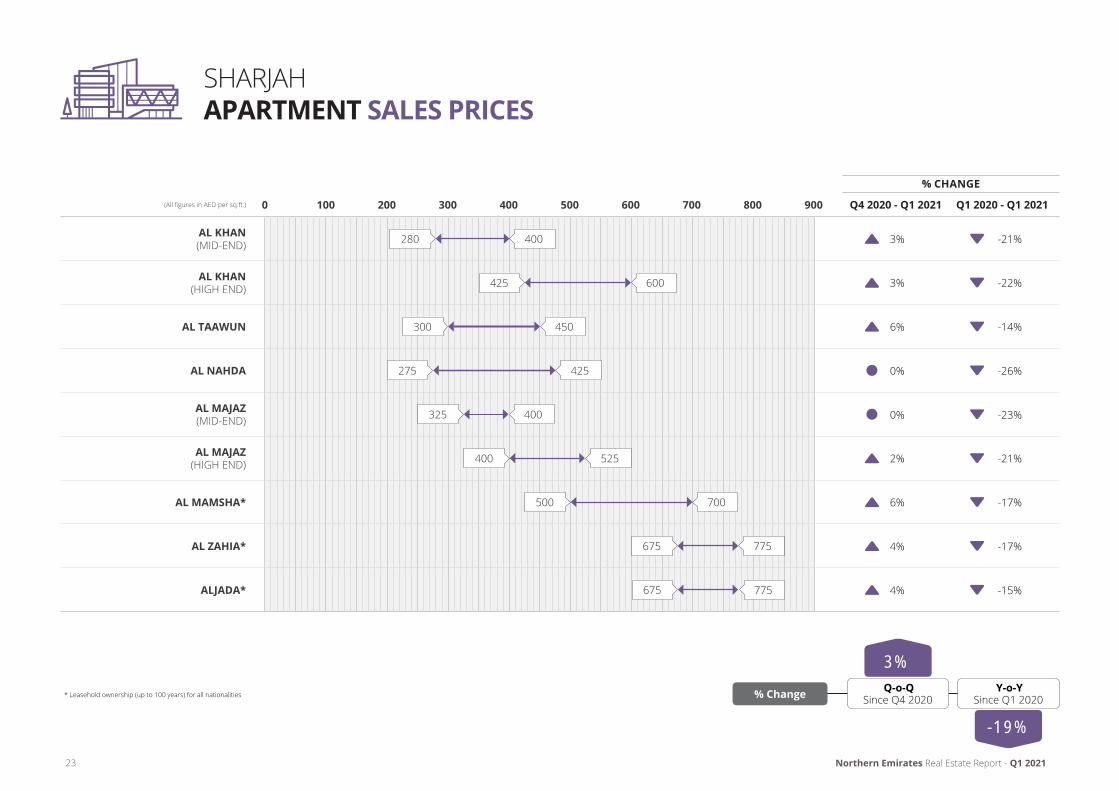
SHARJAH APARTMENT SALES PRICES
% CHANGE
Northern Emirates Real Estate Report -
AL KHAN (MID-END)
AL KHAN (HIGH END)
AL TAAWUN
AL NAHDA
AL MAJAZ (MID-END)
AL MAJAZ (HIGH END)
AL MAMSHA*
AL ZAHIA*
ALJADA*
280 400
325 400
425 600
275 425
675 775
500 700
300 450
675 775
400 525
Q4 2020 - Q1 2021 Q1 2020 - Q1 2021600400 500 900800700(All figures in AED per sq.ft.) 0 100 200 300
3%
3%
6%
0%
0%
2%
6%
4%
4%
-21%
-22%
-14%
-26%
-23%
-21%
-17%
-17%
-15%
23 Q1 2021
3%
Since Q1 2020
-19%
Since Q4 2020Q-o-Q Y-o-Y% Change* Leasehold ownership (up to 100 years) for all nationalities

SHARJAH OFFICE RENTAL RATES
(All figures in AED per sq.ft. p.a.)
AVERAGE RENTAL RATES % CHANGE
FROM TO
AL TAAWUN ROADCORNICHE AREAAL WAHDAAL QASEMEHCLOCK R/AAL YARMOOKINDUSTRIAL AREA
Northern Emirates Real Estate Report -
Q4 2020 - Q1 2021 Q1 2020 - Q1 2021
Since Q1 2020
-21%
Since Q4 2020
-4%
24 Q1 2021
Q-o-Q Y-o-Y
252825202520 30
32.530
32.542.532.5
20 30
-6%-1%-9%-4%-4%-6% -20%
-24%-22%-21%-19%-19%
-6% -22%
% Change

NORTHERN EMIRATES MAP
Arabian Gulf
311
11
11
11
5
1
10
8
9
3
2
6
4
7
ABU DHABI
DUBAI
SHARJAH FUJAIRAH
RAS AL KHAIMAHUMM AL QUWAIN
AJMAN
SHARJAH
1 Abu Shagara2 Al Khan3 Al Majaz4 Al Nahda5 Al Qasimiyah6 Al Taawun7 Al Wahda8 Corniche / Buhaira9 Khaledia10 King Faisal and King Abdul Aziz Streets
Mina Al Arab
Marjan Island
1
2
Al Hamra
3
RAS AL KHAIMAH
1 Mina Al Arab2 Marjan Island3 Al Hamra
UNITED ARAB EMIRATES
Northern Emirates Real Estate Report - 25 Q1 2021

Al Ain Real Estate Report -
AL AIN MARKET OVERVIEW
26 Q1 2021
The Al Ain Real Estate market recorded increased activity in Q1 2021 as a result of an internal migration with Tenants taking advantage of lower Rental rates. However, rising vacancy rates (since early 2020) due to job losses and salary cuts continued to put pressure on Landlords.
Apartment Rental rate reductions averaged -3% over the last three months; however, several prime compounds recorded drops of more than -5%, particularly those priced above market rates.
The change in Villa Rental rates was less pronounced, with quarterly and annual declines of -1% and -4%, respectively.
Discounts and incentives such as rent free periods (up to 3 months) and flexible payment terms (up to 12 cheques) became the norm in Al Ain.
Although both the Office and Retail sectors remained under pressure, there has been a modest rise in market activity during the first 3 months of the year with increased demand from companies in the retail/F&B and healthcare sectors looking for commercial/converted Villa units and/or small buildings.
Whilst net effective Office rents decreased across all areas, incentives somewhat offset larger average reductions.
It is apparent that the unprecedented COVID-19 situation has affected various segments of the Real Estate sector differently, down to (sub) category/segment levels.

AL AIN APARTMENT RENTAL RATES
(All figures in AED 000’s p.a.)
1 BEDROOM 2 BEDROOMS 3 BEDROOMS % CHANGE
MATURE BUILDINGSNEW BUILDINGSPRIME COMPOUNDS
AL AIN VILLA RENTAL RATES
(All figures in AED 000’s p.a.)
3 BEDROOMS 4 BEDROOMS 5 BEDROOMS % CHANGE
MATURE VILLASAl Jimi, Town Centre, Zaker, Other(*)Al TowayaPrime Compounds
RECENT BUILDAl Jimi, Town Centre, Zaker, Other(*)Al TowayaPrime Compounds
Al Ain Real Estate Report -
FROM TO FROM TO FROM TO Q4 2020 - Q1 2021 Q1 2020 - Q1 2021
FROM TO FROM TO FROM TO Q4 2020 - Q1 2021 Q1 2020 - Q1 2021
Since Q1 2020Since Q4 2020
-4%-22%-4% -3%
22 26 31 35 43 48 -1% -1%2927 34 37 52 62 -1% -3%
30 35 42 48 60 80 -6% -6%
9%
Since Q1 2020
-4% -23%
Since Q4 2020
-1%
Q-o-Q Y-o-Y Since peakQ4 2015
Since market lowQ4 2012
Since peakQ4 2015
Since market lowQ4 2012
Q-o-Q Y-o-Y
Q1 202127
45 48 65 71 82 91 -1% -3%65 70 85 90 90 95 0% -2%80 85 95 103 115 120 0% -3%56 63 75 80 95 105 -1% -2%75 78 85 90 105 110 0% -3%90 95 100 110 130 135 0% -4%
% Change
% Change
* Includes Al Khabisi, Al Muwaiji, Al Manasir and Al Masoudi areas

AL AIN RETAIL RENTAL RATES
AL AIN OFFICE RENTAL RATES
% CHANGE
(All figures in AED per sq.m. p.a.)
KHALIFA STREET
AUD AL TOUBA STREET
MAIN STREET
SENAYA STREET
% CHANGE
(All figures in AED per sq.m. p.a.)
KHALIFA STREET / MAIN STREET
PRIME MALL
SENAYA STREET
Al Ain Real Estate Report -
0 200100 400300 600500 1,000800 900700
0 1,000500 2,0001,500 2,500 3,000
550 840
550 840
550 840
340 530
900 2,100
1,350 2,800
630 1,450
Q4 2020 - Q1 2021 Q1 2020 - Q1 2021
Q4 2020 - Q1 2021 Q1 2020 - Q1 2021
-2% -2%
-2% -2%
-2% -2%
-3% -3%
-3% -3% -13% -31%
0% -2% -10% -10%
28 Q1 2021
0% -2%
0% -1%
0% -1%
Since Q1 2020Since Q4 2020Since peak
Q4 2015Since market low
Q3 2012Q-o-Q Y-o-Y
Since Q1 2020Since Q4 2020Q-o-Q Y-o-Y Since peak
Q4 2015Since market low
Q4 2011% Change
% Change
TO FROM
TO FROM

Town Centre
Al Jimi
Al Khabisi
Al Muwaiji
Al Masoudi
Zaker
Al Towaya
East Airport District
Al Foaa
Hili
Al Oattara
Al Buraimi
Al Mutaredh
Al Jahili
AlMutawa’a
Al Sarooj
Al Shuwaimah
Aflaj
Al KhrairDefence
Al Dhahir Um GhafahJebel Hafeet
NeimaAl Qisais
Al Shuaibah
Al Aqabiyya
Zoo District
Falaj Hazza’a
Asharej
Al Markhaniya
Al Dahmaa
Al Bateen
Al Maqam
Gharebah
Al Salamat District
Al Yahar South
Al Yahar North
Al AinInternational
Airport
SULTANATE OF OMAN
Khalifa Bin Zayed St.
Khalifa Bin Zayed St.
Moh
d Bi
n Kh
alifa
St
Baniyas St
Ardh
Jow
St
Emira
tes
St
Zayed Bin Sultan St.
Al Ain Real Estate Report -
AL AIN PROPERTY MAP
29 Q1 2021

The outlook for GCC budgets is much better than it was at the start of the year, following OPEC’s decision to curtail oil production for longer. Emirates NBD now expects Brent oil to average USD 67.5/b in 2021, 56% higher than in 2020. However, even at this higher oil price, most GCC budgets will remain in deficit this year, with the exception of the UAE and Qatar, where we expect small surpluses. As a result, we expect that governments in the region will be unlikely to aggressively boost spending to drive growth this year, and will instead prioritise deficit reduction.
As a result of a relatively conservative fiscal stance in the region over the last year – especially when compared with the largesse seen in the US, Japan and to a smaller extent Europe - we have maintained that the recovery in the non-oil sectors in the GCC economies this year would be largely driven by improving external conditions: the normalisation of activity as vaccines are rolled out, recovery in global trade volumes, rebound in travel and tourism and increased investment.
The PMI survey data indicated a slowdown in activity across the three biggest GCC economies in February as tighter restrictions were reimposed or extended in most major economies to curb the spread of the coronavirus. The UAE’s PMI averaged 50.9 over January-February, indicating very little expansion in the non-oil sectors at the start of the year. Firms appeared to be cautious about the outlook and this is likely weighing on private sector investment.
Moreover, the loss of private sector jobs since Q2 2020 has led to a decline in the expatriate population in the region. S&P Global Ratings estimates that the population of the GCC declined by -4% last year. This will likely have a negative impact on the speed with which GCC private sector consumption will rebound, particularly for countries where the majority of the population is expatriate, such as the UAE and Kuwait.
Reluctant to boost spending to drive growth, governments in the region have increasingly focused on structural reforms in order to attract investment and talent and boost domestic demand.
Earlier this month, Saudi Arabia enacted changes to its labour regulations to allow greater job mobility for expatriates, which could result in better alignment of salaries for foreign workers and Saudi nationals, and improve the attractiveness of the kingdom for more highly skilled employees. Saudi Arabia also announced that from 2024, it would only award contracts to companies that had their regional headquarters in the kingdom. While the specifics around this rule have yet to be clarified, it is aimed at requiring international firms to increase their investment – both financial and human capital - in the kingdom over the next three years. Saudi Arabia has pledged to continue developing the necessary infrastructure (education, healthcare, transport, leisure) to make the country a more attractive destination for foreign investment as well.
The UAE has announced several new and expanded visa schemes over the last year in an effort to attract and retain talent. The 10-year “golden visa” scheme was expanded to include a broader segment of the population, and new remote working visas and retirement visas were also introduced. Legislation to allow 100% foreign ownership of onshore companies was also passed, and is a key component of the recently announced industrial development strategy, which aims to double the size of the UAE’s manufacturing sector over the next decade, along with increasing research and development spending.
One of the key goals of the industrial development strategy is to create (skilled) jobs in the private sector which is essential for attracting and retaining talent, and boosting domestic demand. Importantly the strategy does not rely on a specific budgetary commitment from the government, but rather on creating the right environment through legislative reforms, providing incentives for investment, and providing financing to support SMEs in the industrial sector.
However, we also recognise that structural reforms take time to implement and to yield results, and the eventual outcome will depend on how effectively the reforms and development strategies are executed.
Author: Khatija Haque, Chief Economist and Head of Research, Emirates NBD
GCC budgets to remain in deficit even with oil averaging USD 67.5/b
Oil production cuts to weight on GCC growth in 2021
Source: Emirates NBD Research
USD
/b%
y/y
Source: Haver Analytics, Emirates NBD Research
120
100
80
60
40
20
0
6
4
2
0
-2
-4
-6
Saudi Arabia
2015 2016 2017 2018 2019 2020e 2021f 2022f
UAE Kuwait Oman Bahrain
Estimated 2021 budget break-even oil price Forecast average brent oil price
Normal GDP weighted average GCC growth
30 Emirates NBD - Q1 2021

RETIREMENT VISA The Retirement Visa has been recently announced and is exclusively issued by General Directorate of Residency and Foreign Affairs (GDRFA). This visa comes with a fixed term of 5 years renewable if the applicant meets the requirements at the time of renewal.
RETIREMENT VISA REQUIREMENTS For this visa, the applicant must be above 55 years of age, and should have either invested AED 2,000,000 in a real estate property or have saving deposits in a UAE bank of not less than AED 1,000,000 with a tenure of not less than 3 years or have an active monthly income of AED 20,000.
Finally, there has also been a new amendment to the implementing regulation of the Nationality Law which now allows foreign nationals to acquire UAE citizenship subject to meeting certain eligibility criteria. It is important to note that the UAE citizenship requirements are separate and distinct from the above mentioned visa requirements, and applying for the UAE citizenship is not a straight forward process and investors who qualify for UAE citizenship are nominated by the Ruler’s Court, Crown Prince’s Court in the local Emirate, Executive Councils of UAE and the Cabinet of UAE based on the respective federal nominations.
Looking ahead, Dubai continues to retain its top position as being an attractive destination for wealthy investors to obtain property investment visas which is currently subject to minimal criteria and does not even require a language test. As some countries consider raising their taxes on the wealthy, the Dubai residency visa options offer an excellent opportunity for potential tax savings and a luxury lifestyle.
DUBAI RESIDENCY VISA OPTIONS FOR PROPERTY INVESTORSDubai has introduced many initiatives to facilitate the investment in the Emirate. Investors can obtain a long term residency visa not only by employment, acquiring business or have savings in UAE banks, but they can also acquire a residency visa by investing in real estate assets in Dubai. Such visa will also allow its holder to sponsor his or her family members. The term of the property visa is determined based on the amount of investment invested in the real estate property. We at Al Tamimi & Company regularly assist our clients with obtaining property investor visas.
PROPERTY VISA The minimum term an investor can acquire from investing in real estate properties is 3 years and the maximum term is 5 years.
REQUIREMENTS OF 3-YEAR PROPERTY VISA In order to apply for the 3-year visa, the applicant must own a property or several properties in the Emirate of Dubai worth a minimum of AED 1,000,000 in total. The Dubai Land Department (DLD) requires that the purchased property must be a completed property (i.e. not off plan). The DLD approve the visa even if the property is subject to an existing mortgage, provided that 50% of the property value or an amount equal to AED 1,000,000 has been paid to the bank or seller. As a result, the investor has flexibility to pay AED 500,000 towards the purchase price of the property and obtain a mortgage to finance the remainder purchase price and still be eligible to apply for the visa.
REQUIREMENTS OF 5-YEAR PROPERTY VISAIn order to apply for the 5-year visa, the applicant must own a property or several properties in Dubai worth a minimum of AED 5,000,000 in total. The purchased property must be a completed property and not off plan. The key distinction from the 3-year visa is that the property or the entire portfolio of properties subject to the application must be mortgage free, i.e. the purchase price must be fully paid for, otherwise the applicant will not be eligible to this visa.
It is an essential requirement for both types of visas that the purchased property must be obtained by way of sale and purchase and not by way of gift or grant by the Ruler.
Both 3-year and 5-year visa are normally issued within two weeks.
Further details of the 5-year visa are available on the DLD website at:
https://dubailand.gov.ae/en/services/service-directory/visa-request-for-real-estate-owners/#/
Author: Aruna Mukherji, Associate - Real Estate Salman Khaled, Paralegal - Real Estate
Property Visa Retirement Visa
31 Al Tamimi & Co. - Q1 2021

DISCLAIMER: The information contained in this report has been obtained from and is based upon sources that Asteco Property Management believes to be reliable; however, no warranty or representation, expressed or implied, is made to the accuracy or completeness of the information contained herein, and same is submitted subject to errors, omissions, change of price, rental or other conditions, withdrawal without notice, and to any special listing conditions imposed by our principals. Asteco Property Management will not be held responsible for any third-party contributions. All opinions and estimates included in this report constitute Asteco Property Management’s judgment, as of the date of this report and are subject to change without notice. Figures contained in this report are derived from a basket of locations highlighted in this report and therefore represent a snapshot of the UAE market. Averages, however, represent a wider range of areas. Particularly exclusive or unique projects have been excluded from the data to avoid distorting averages. Due care and attention has been used in the preparation of forecast information. However, actual results may vary from forecasts and any variation may be materially positive or negative. Forecasts, by their very nature, involve risk and uncertainty because they relate to future events and circumstances which are beyond Asteco Property Management’s control. For a full in-depth study of the market, please contact Asteco Property Management’s Research team. Asteco Property Management LLC. Commercial License No. 218551. Paid-up Capital AED 4,000,000. | ORN 180
20210315/astrep898
About Asteco
Acquired by Aldar Estates in early 2021, Asteco is a major regional and international award-winning full-service real estate services company that was formed in 1985 and has gained enormous respect for consistently delivering high quality, professional, value-added real estate services in a transparent manner. The company is also widely recognised for its involvement with many of the projects that have defined the landscape and physical infrastructure of the United Arab Emirates.
The world-class company has a distinguished and important combination of local knowledge and international expertise and has been renowned for its application of the latest technological tools and innovations, its commitment to transparency, winning strategies and human expertise.
Undisputed Real Estate experts with a regional presence to serve its customers, Asteco proudly represents a significant number of the region’s top property Owners, Developers and Investors.
Asteco offers a wide range of services and solutions to its clients from Sales & Leasing, Property Consultancy & Management, Owners’ Association Consultancy & Management and Clubhouse & Lifestyle Management to Building Consultancy, Retail Management, Valuation and Advisory as well as Franchising services. The company applies innovative solutions and cutting-edge technology to add tangible value for its clients at every stage of the property lifecycle and to continuously elevate customer experience.
VALUATION & ADVISORY Our professional advisory services are conducted by suitably qualified personnel all of whom have had extensive Real Estate experience within the Middle East and internationally.
Our valuations are carried out in accordance with the Royal Institution of Chartered Surveyors (RICS) and International Valuation Standards (IVS) and are undertaken by appropriately qualified valuers with extensive local experience.
The Professional Services Asteco conducts throughout the region include:
• Consultancy & Advisory services• Market research• Valuation services
SALESAsteco has established a large regional property Sales division with representatives based in the UAE, Qatar and Jordan. Our Sales teams have extensive experience in the negotiation and sale of a variety of assets.
LEASINGAsteco has been instrumental in the Leasing of many high-profile developments across the GCC.
PROPERTY MANAGEMENT Asteco provides comprehensive Property Management services to all property Owners, whether a single unit (IPM) or a regional mixed-use portfolio. Our focus is on maximising value for our Clients.
OWNERS ASSOCIATION Asteco has the experience, systems, procedures and manuals in place to provide streamlined comprehensive Association Management and Consultancy services to residential, commercial and mixed-use communities throughout the GCC Region
BUILDING CONSULTANCY The Building Consultancy Team at Asteco have a wealth of experience supporting their Clients throughout all stages of the built asset lifecycle. Each of the team’s highly trained surveyors have an in-depth knowledge of construction technology, building pathology and effective project management methods which enable us to provide our clients with a comprehensive building consultancy service.
FRANCHISEOur brand, network, system and procedures are now available in territories across the MENA region. Our Licensing services currently include Real Estate Brokerage Franchising and associated support services with many of the key elements designed specifically around the Franchisee, making it a truly unique and bespoke franchise opportunity.
HP Aengaar
Chief Executive Officer+971 2 408 [email protected]
John Stevens MSc, BSc (Hons), MRICS
Executive Director -Property Management+971 4 403 [email protected]
John Allen BSc, MRICS
Executive Director - Valuation & Advisory+971 4 403 [email protected]
James Joughin BSc (Hons), MRICS
Senior Associate Director - Head of Valuations +971 4 403 [email protected]
Jenny Weidling BA (Hons)
Manager - Research and Advisory, Dubai+971 4 403 [email protected]
Ghada Amhaz MSc
Manager - Research and Advisory, Abu Dhabi+971 2 626 [email protected]
Tamer Ibrahim Chaaban BE
Associate Director / General Manager - Al Ain+971 3 766 [email protected]