propertylink group 2016 09 15 - research-doc.credit-suisse.com
TRANSCRIPT

DISCLOSURE APPENDIX AT THE BACK OF THIS REPORT CONTAINS IMPORTANT DISCLOSURES, ANALYST CERTIFICATIONS, LEGAL ENTITY DISCLOSURE AND THE STATUS OF NON-US ANALYSTS. US Disclosure: Credit Suisse does and seeks to do business with companies covered in its research reports. As a result, investors should be aware that the Firm may have a conflict of interest that could affect the objectivity of this report. Investors should consider this report as only a single factor in making their investment decision.
15 September 2016 Asia Pacific/Australia
Equity Research Real Estate Management & Development
Propertylink Group
(PLG.AX / PLG AU) Rating OUTPERFORM Price (15-Sep,A$) .75 Target Price (A$) .92 Target price ESG risk (%) Market cap (A$mn) 452.1 Yr avg. mthly trading (A$mn) 109.0 Projected return: Capital gain (%) 22.7 Dividend yield (net %) 9.3 Total return (%) 32.0 *Stock ratings are relative to the relevant country benchmark.
¹Target price is for 12 months.
[V] = Stock Considered Volatile (see Disclosure Appendix)
Research Analysts
Mikhail Mohl
61 2 8205 4413
Ian Randall
612 8205 4580
Martin Patz
61 2 8205 4018
Specialist sales: Bhupen Master
61 2 8205 4792
INITIATION
8.70% implied cap rate, 5% MT growth
■ 32% Total Return. We initiate coverage on PLG with an Outperform rating
and a $0.92 Target Price. Our SOTP val ascribes no premium to the book
WACR (7.65%) & 12.0x to funds mgt, similarly, our DCF val adopts a sector
high 11.2% geared cost of equity. PLG offers a prospective distribution yield
of 9.1%, which equates to a 420bp spread to the A-REIT average.
■ What's being priced in? At current levels, PLG is trading on an implied cap
rate of 8.70%, reflecting a 7% discount to current book values vs the 6% avg
premium implied for A-REITs. Similarly, running spot bonds through our DCF
valuations suggests PLG is pricing in un-levered terminal growth of -1.8% vs
+1.4% for A-REITs. Notably, this is despite PLG's 5.2%pa MT (FY17-21)
FFO growth trajectory under our base case or 8.0%pa under our bull case.
Our base case assumes a 39% reduction in average AUM growth (in
absolute terms) relative to FY15 & FY16 AUM growth. As such, we believe
execution risks around leasing & FUM growth are being more than priced in.
■ Investment case. PLG is an Australia-focused internally managed property
trust with a fully integrated real estate platform, a $685mn portfolio of 33
predominantly industrial assets (>80% Sydney & Melbourne) with a rapidly
growing funds management platform (~$1bn) backed by 8 global institutional
investors. PLG backs its deep in-house asset management capability to take
advantage of typically B–Grade commercial assets with value add potential.
■ Solid progress since listing. PLG has made a promising start to the 2017
fiscal year. 2.5mths into the year, PLG is running ahead of PDS estimates on
a number of fronts including leasing (90% tenant retention ytd / 11 of 27
deals completed), debt costs, co-investment income and property
management & leasing fees. Post the Denison acquisition (~$176m), PLG is
targeting a further ~$500m of acquisitions in FY17 and is currently bidding
(or in exclusive due-diligence) on ~$280m of potential transactions.
Performance 1M 3M 12M Absolute (%) -7.41 Relative (%) -2.13
Financial and valuation metrics
Year 6/17E 6/18E 6/19E Revenue (A$ mn) - - - EBITDA (A$ mn) 53 58 60 EBIT (A$ mn) 53 58 60 Net Income (Adj.) (A$ mn) 43 47 49 EPS (Adj.) (Ac) 7.21 7.82 8.12 Change from previous EPS (%) EPS growth (%) 8.5 3.9 Consensus EPS (Ac) 7.00 7.00 8.00 P/E (x) 10.4 9.6 9.2 Dividends (Ac) 6.85 7.43 7.69 Dividend yield (%) 9.1 9.9 10.3 Price/Book (x) 0.9 0.9 0.9 Net debt/EBITDA (x) 5.1 4.8 4.7
Source: Company data, Thomson Reuters, Credit Suisse estimates

15 September 2016
Propertylink Group
(PLG.AX / PLG AU) 2
Table of contents
Executive Summary 4
Investment thesis...................................................................................................... 4
PLG overview ........................................................................................................... 4
$0.92 Target Price, Outperform Rating 5
Valuation methodologies .......................................................................................... 7
Peer comparison .................................................................................................... 10
Operational progress since listing 14
Financial Forecasts 15
Strengths and opportunities 20
Key risks 26
Investment portfolio 29
Portfolio metrics and comps ................................................................................... 32
External Funds 34
Business overview .................................................................................................. 34
Historical performance of External funds ............................................................... 36
Management fees ................................................................................................... 36
Co-investments in External funds........................................................................... 37
External fund investors ........................................................................................... 37
Australian Industrial Markets 39
Sydney .................................................................................................................... 39
Melbourne ............................................................................................................... 41
Brisbane ................................................................................................................. 43
Perth ....................................................................................................................... 45
ESG 47
Summary ................................................................................................................ 47
Environment ........................................................................................................... 47
Social ...................................................................................................................... 48
Governance ............................................................................................................ 48
Senior management and board 51
Senior management team ...................................................................................... 51
Board of Directors .................................................................................................. 52

15 September 2016
Propertylink Group
(PLG.AX / PLG AU) 3
Propertylink Group (PLG.AX / PLG AU)
Price (15 Sep 2016): A$0.75; Rating: OUTPERFORM; Target Price: A$0.92; Analyst: Mikhail Mohl
Income Statement 6/17E 6/18E 6/19E
Net Property Income 49 50 51 Residential Development income - - - Construction income - - - Infrastructure development 3 2 1 Operating Expenses (excl. D&A) (11) (12) (12) EBITDA 53 58 60 EBIT 53 58 60 Net interest exp. (9) (10) (10) Other non-operating & non-recurring items (19) (20) (20) Profit before tax 44 48 50 Surplus/deficit on inv property 0 0 0 Income tax (1) (1) (1) Minorities - - - Exceptionals 0 0 0 Net profit (Reported) 43 47 49 Analyst after tax adjustments 0 0 0 Normalised NPAT 43 47 49 Distributable income to unitholders 43 47 49
Balance Sheet 6/17E 6/18E 6/19E
Cash & equivalents 8 10 11 Receivables 0 0 0 Other current assets 4 4 4 Current assets 12 13 15 Property, plant & equip. 92 92 92 Intangibles 5 5 5 Properties under development 0 0 0 Investment properties 614 626 638 Other assets 50 59 67 Total assets 773 795 816 Accounts Payables 0 0 0 Interest bearing debt - Current 0 0 0 Other short-term liabilities 0 0 0 Total current liabilities 0 0 0 Interest bearing debt - Non-Current 280 287 293 Other non-current Liabilities 9 9 9 Total liabilities 288 296 302 Ordinary Equity 485 499 514 Minorities & Others - - - Total liabilities and equity 773 795 816
Cash Flow 6/17E 6/18E 6/19E
EBIT 53 58 60 Net Interest (9) (10) (10) Depr & Amort 0 0 0 Tax Paid (1) (1) (1) Change in Working capital -0 -0 -0 Other cash and non-cash items 1 2 3 Operating cashflow 44 49 52 Capex (17) (1) (1) Capex - expansionary (16) 0 0 Capex - Maintenance (1) (1) (1) Acquisitions & Invest 0 0 0 Asset sale proceeds 9 0 0 Other - - - Investing cashflow (7) (1) (1) Dividends paid (41) (45) (46) Equity raised - - - Net borrowings 7 0 0 Other financing cash in/(outflows) 0 0 0 Financing cashflow (35) (45) (46) Total cashflow 2 3 4 Adjustments 0 0 0 Movement in cash/equivalents 2 3 4
Earnings 6/17E 6/18E 6/19E
Equiv. FPO (period avg) (mn) 603 603 603 EPS (CS underlying) (C) 7.2 7.8 8.1 EPS Growth (%) - 8.5 3.9 Net Income Margin 88.8 93.4 95.2 DPS (C) 6.9 7.4 7.7 AFFO per share (C) 7.1 7.7 7.9 NTA per share (C) 79.7 82.1 84.6 NRI growth - 3.2 1.9
Valuation 6/17E 6/18E 6/19E
EV/EBITDA (x) 13.4 12.4 12.0 P/E (CS) (x) 10.4 9.6 9.2 P/NTA (X) 0.9 0.9 0.9 P/AFFO (X) 10.6 9.8 9.5 Dividend Yield (%) 9.1 9.9 10.3
Returns 6/17E 6/18E 6/19E
Return on Equity (%) 9.0 9.4 9.5 ROIC (avg.) (%) - 7.4 7.5 Asset turnover (X) 0.1 0.1 0.1 Interest Cover 5.7 6.0 6.1
Gearing 6/17E 6/18E 6/19E
Net debt / Investment properties (%) 44.2 44.4 44.2 Debt / EBITDA (X) 5.2 4.9 4.9 Total Liabilities / Total Assets (%) 37.3 37.2 37.0 Dividend Cover - - - Prem/disc NTA (%) (5.9) (8.6) (11.3)
MSCI IVA Rating
Share price performance
On 15-Sep-2016 the S&P ASX 200 Index closed at 5239.9
On 15-Sep-2016 the spot exchange rate was A$1.34/US$1
Source: Company data, Credit Suisse estimates
Global Local Country
Environment Social Governance
0
1
2
3
4
5
6
7
8
G
LC
G
L CG
L
C

15 September 2016
Propertylink Group
(PLG.AX / PLG AU) 4
Executive Summary
Investment thesis
We view Propertylink as a relatively unique real estate investment opportunity in the
context of the A-REIT sector. PLG has an experienced management team (+20yrs
average experience), a fully integrated real estate platform and a sound balance sheet,
which means it is well positioned to deal with its relatively high level of income expiry risk
in the medium term, but also continue to demonstrate its ability to add value. Our analysis
and site visits suggest PLG has had good success in adding value to the majority of
balance sheet and fund acquisitions in recent years on the back of well executed asset
specific leasing and positioning strategies.
In our view, PLG's business model is well positioned to generate above sector average
earnings growth in the medium term. PLG's track record of growing its FUM base
considerably in recent years, whilst still generating very strong returns for its investors
demonstrates this capability. Furthermore, even based on our conservative medium term
FUM growth assumptions, we believe PLG can generate considerably higher quality
investment management fees as the magnitude of transactional fees reduces relative to
the FUM base, but also, we see considerable scope to improve margins overtime given
each dollar of incremental FUM is more than twice as profitable as the existing fee base.
PLG overview
PLG is the only Australia-focused, internally managed industrial & logistics trust and
integrated investment and asset management platform. PLG wholly owns a diversified
portfolio of 33 industrial properties (including Business parks) located across Sydney,
Melbourne, Brisbane and Perth. The portfolio was independently valued at $685m as at 30
June 2016, has an occupancy rate of 95.0%, a weighted average lease expiry (WALE) of
3.6 years (by income and by GLA) and a diversified income profile with approximately 176
tenants and no single tenant contributing more than 5% of lease income.
Figure 1: Balance sheet portfolio summary (as at June 2016)
Source: Company data
The investment and asset management business generates fee revenue from the
management of External funds, as well as income from distributions paid in respect of
PLG's fund co-investments. On our estimates, investment management (excluding co-
investment income) represents ~9% of FY17 operating EBIT. As at 30 June 2016, the
investment and asset management business had total AUM of over $1.55bn, of which
approximately $873m is managed through 9 External funds. Subsequent to listing, PLG
launched a 10th fund (Propertylink Enhanced Partnership) to house the ~$176m Denison
portfolio acquisition. In addition, PLG settled on the $135m Charter Hall industrial portfolio
acquisition on behalf of PAIP II. These transactions are consistent with the Group's goal to
grow external FUM by $675m (net) to >$1.5bn in FY17.
Number of properties 33
Independent valuation (A$m) $685.0
Gross lettable area (sqm) 515,403
Occupancy by GLA 95.0%
WALE by income (years) 3.6
WALE by GLA (years) 3.6
Weighted Average Capitalisation Rate 7.92%
Passing net rental income (p.a.) $52,892,279
Fully leased passing net rental income (p.a.) $56,207,488

15 September 2016
Propertylink Group
(PLG.AX / PLG AU) 5
$0.92 Target Price, Outperform Rating We initiative coverage on PLG with an Outperform rating
Our PLG Target Price of $0.92 represents 23% capital upside from current pricing and a
prospective total shareholder return of 32% compared with 3% and 9% (arithmetic
average) respectively on offer from our broader A-REIT coverage universe.
Figure 2: CS Total Shareholder Returns & Ratings Figure 3: Credit Suisse A-REIT ratings composition
Source: Credit Suisse estimates Source: Credit Suisse estimates
Execution risk more than priced in
At PLG's last close of $0.75, PLG is trading on par with its NTA backing, however, this
ignores the contribution from the Group's investment management business, which
contributes 12% of FY18 operating EBIT (post cost allocation). On our estimates, PLG is
trading on an implied cap rate of 8.70% (vs a book WACR of 7.65%) and has the most
undervalued portfolio in the sector (Figure 4). Specifically, we have deducted our valuation
of PLG's investment management business ($82m / 12.0x EBIT multiple) from the current
enterprise value, which implies that the market is ascribing a 6% discount to the book
value of PLG's industrial portfolio compared with a +6% average premium (arithmetic) for
the broader A-REIT sector.
Another valuation exercise we believe provides a good cross-check to our SOTP is to run
spot bonds (risk free rate) through our 5yr DCF valuations in order to estimate the terminal
growth rate that is implied by current share prices. We then compare this on an unlevered
basis and overlay this with the level of capital being retained by each A-REIT over the 5yr
forecast period. Once again, this highlights PLG's considerable relative and absolute value
proposition. Specifically, this analysis suggests that PLG's current share price is implying
unlevered terminal growth of -1.8% vs +1.4% on average for A-REITs (Figure 5).
-10%
-5%
0%
5%
10%
15%
20%
25%
30%
PLG WFD SCG GPT GDI SGP MGR GMG IOF VCX DXS CQR CMW SCP BWP CHC
Neutral UnderperformOutperform
OUTPERFORM25%
NEUTRAL37%
UNDERPERFORM38%
Pricing in a negative terminal growth rate

15 September 2016
Propertylink Group
(PLG.AX / PLG AU) 6
Figure 4: Implied premium (discount) to book value Figure 5: Implied un-levered terminal growth rate
Source: Company data, Credit Suisse estimates Source: Credit Suisse estimates
Below we provide a valuation sensitivity highlighting the valuation upside (downside) vs
the current share price based on tighter (softer) cap rates and higher (lower) EBIT
multiples on investment management EBIT within our SOTP valuation framework (all other
variables/assumptions held constant).
Figure 6: SOTP valuation sensitivity – WACR & Funds Mgmt multiples
Source: Credit Suisse estimates
Figure 7: SOTP valuation upside to current share price
Source: Credit Suisse estimates
Above sector average growth on conservative FUM growth assumptions
Furthermore, we estimate PLG can deliver above sector average (4.2%) FFO ps growth of
5.5% per annum over FY17 to FY20, despite allowing for 39% reduction in FUM growth in
absolute terms relative to the prior two years and PLG's considerably larger FUM base
(/platform). Notably, our estimates assume comparable NOI growth of ~1.9% pa (allowing
for some negative re-leasing spreads detracting from higher embedded fixed increases).
In addition we have not explicitly incorporated any balance sheet acquisitions, which would
be highly accretive given PLG's ~3.2% WACD.
23%
10%9%
8%6% 6%
5%3%
1%
-2% -2%
-4%
-7%-10%
-5%
0%
5%
10%
15%
20%
25%
BW
P
SC
P
CQ
R
DX
S
CM
W
VC
X
IOF
GP
T
SG
P
SC
G
GD
I
MG
R
PLG
-40%
-30%
-20%
-10%
0%
10%
20%
30%
40%
-3.0%
-2.0%
-1.0%
0.0%
1.0%
2.0%
3.0%
SC
P
DX
S
CH
C
CM
W
MG
R
CQ
R
VC
X
BW
P
IOF
GP
T
A-R
EIT
WF
D
GM
G
SG
P
SC
G
GD
I
PLG
Implied unlevered term growth (LHS) Sector avg growth (LHS) % of A-FFO retained (RHS)
7.05% 7.25% 7.45% 7.65% 7.85% 8.05% 8.25%
0.0x $0.89 $0.85 $0.81 $0.78 $0.74 $0.71 $0.68
4.0x $0.93 $0.89 $0.86 $0.82 $0.79 $0.76 $0.73
8.0x $0.98 $0.94 $0.90 $0.87 $0.83 $0.80 $0.77
12.0x $1.03 $0.98 $0.95 $0.92 $0.87 $0.84 $0.81
16.0x $1.07 $1.03 $0.99 $0.95 $0.92 $0.88 $0.85
20.0x $1.12 $1.07 $1.03 $1.00 $0.96 $0.93 $0.89
FM MultipleWeighted Avg Cap Rate
7.05% 7.25% 7.45% 7.65% 7.85% 8.05% 8.25%
0.0x 17% 12% 7% 3% -3% -7% -11%
4.0x 22% 17% 13% 8% 4% 0% -4%
8.0x 29% 24% 18% 14% 9% 5% 1%
12.0x 36% 29% 25% 21% 14% 11% 7%
16.0x 41% 36% 30% 25% 21% 16% 12%
20.0x 47% 41% 36% 32% 26% 22% 17%
FM MultipleWeighted Avg Cap Rate
Pricing in cap rate expansion and no value
to Funds Mgmt
6% MT growth despite assuming significantly
slower FUM growth

15 September 2016
Propertylink Group
(PLG.AX / PLG AU) 7
Figure 8: Propertylink AUM growth FY13 to FY20f
Source: Company data, Credit Suisse estimates
Valuation methodologies
We have used two primary valuation techniques in arriving at a valuation of the equity of
PLG: (1) a DCF-based valuation of forecast Adjusted Funds From Operations (A-FFO);
and (2) an NAV-based valuation (SOTP).
DCF-based equity valuation: $0.93
Our DCF valuation discounts five years of forecast Adjusted Funds From Operations (A-
FFO).
Key valuation parameters include:
■ An assumed risk-free rate of 4.0%.
■ Equity risk premium of 5.0%.
■ The adoption of an unlevered Beta of 0.91x.
■ We then adjust the applied Beta to take into account PLG's leverage (debt to equity),
resulting in a cost of equity of 11.2%.
■ We allow for terminal (geared) growth of 3.30%, resulting in a terminal yield of 7.88%.
■ Our A-FFO forecasts assume average External FUM growth via acquisition over FY18-
21 of $263m per annum (vs PLG's forecast $675m of FUM additions in FY17), in
addition to underlying valuation growth for PLG's FUM in line with forecast property
income growth (~2.0% per annum).
39
295
1,068
1,558
2,233
2,6962,859
3,098
$0
$500
$1,000
$1,500
$2,000
$2,500
$3,000
$3,500
FY13 FY14 FY15 FY16 FY17pf FY18f FY19f FY20f
43%
21%
6%
8%
656%
262%
46%

15 September 2016
Propertylink Group
(PLG.AX / PLG AU) 8
Figure 9: A-REIT geared cost of equity
Based on a 4% Rf (domestic A-REITs) / 5% ERP & our explicit levered beta assumptions
Source: Credit Suisse estimates
NAV (SOTP) based equity valuation: $0.91
Our SOTP valuation uses FY18F as the base year. With PLG's forecasts assuming a 43%
increase in external FUM over FY17, we believe adopting FY18 as the base valuation year
provides a more "stabilised" picture of PLG's Fund and Asset Management earnings.
Our NAV-based valuation is predicated on the following key valuation parameters:
■ Income from investment properties: Valuation capitalises our estimate of FY18 fully
leased NOI. We apply a WACR of 7.65%, reflecting no additional cap rate tightening to
the current book weighted average cap rate (7.65%). We believe this is conservative
considering the extent to which secondary industrial investment yield compression has
lagged that of prime. This is illustrated in the chart below which is representative of the
broader Sydney industrial market. We note that as at June 2016, the spread between
prime and secondary industrial yields stood at 127bps compared with only 29bps in
Sep-2007 and an average of 108bps since 2000.
0.0%
2.0%
4.0%
6.0%
8.0%
10.0%
12.0%
CM
W
PLG GD
I
CH
C
SC
P
GM
G
CQ
R
SG
P
MG
R
DX
S
IOF
VC
X
GP
T
SC
G
BW
P
WF
D
Rf (trend) Geared premium
Secondary yields spreads to prime
remain considerable

15 September 2016
Propertylink Group
(PLG.AX / PLG AU) 9
Figure 10: Sydney Prime vs Secondary Industrial Yields
Mind the gap
Source: JLL Research, Credit Suisse estimates
■ Income from investment management: Our NAV valuation applies 12.0x to our
FY18F investment management EBIT. In setting our multiple, we have had regard for
the multiples implied by the trading prices of comparable businesses within the A-REIT
sector. Although several A-REITs engage in Funds Management activities, for most
groups, these represent a relatively small component of overall earnings. Hence,
estimating an implied multiple for the Funds Management earnings of these groups
entails a high degree of subjectivity.
In our view, Charter Hall Group (CHC.AX) and Goodman Group (GMG.AX) offer the
"cleanest" comps for PLG's Fund and Asset Management businesses. We estimate
that current market pricing implies FY18F EBIT multiples for these Groups' Investment
Management businesses of 15.8x and 12.5x respectively. In setting our multiple range
for PLG relative to those implied for CHC and GMG, we have taken into account
several factors, including: (1) the absence of performance fees from our earnings
forecasts for PLG (whereas we estimate these will make up 9% and 7% of CHC and
GMG Investment Management revenues respectively in FY18f); (2) PLG's relatively
short track-record in its current form, vs the well-established CHC and GMG
businesses; (3) PLG's far smaller scale in terms of FUM. It could be argued that this
size differential warrants either a discount for PLG (reflecting its less established
nature) or a premium (given greater growth potential and scaleability benefits, given
that PLG believes its current cost base could support far higher levels of FUM).
■ Cornerstone investment in External funds: We value PLG's drawn cornerstone
equity stakes in line with our estimate of their book value in FY18.
■ Corporate expenses & other net assets. From our derived asset-level valuation, we
then deduct forecast RE fees and other expenses (capitalised at 10.0x), net debt and
other assets / (liabilities).
0.00%
0.50%
1.00%
1.50%
2.00%
2.50%
4.00%
5.00%
6.00%
7.00%
8.00%
9.00%
10.00%
11.00%
Dec-05 Jun-07 Dec-08 Jun-10 Dec-11 Jun-13 Dec-14 Jun-16
Spread (RHS) Sydney Prime Sydney Secondary
We apply 12x vs 16x implied for CHC

15 September 2016
Propertylink Group
(PLG.AX / PLG AU) 10
Figure 11: PLG.AX – SOTP Val (FY18)
Source: Company data, Credit Suisse estimates
Adopted valuation: $0.92
Our adopted valuation represents the mid-point of our DCF-based and SOTP valuations.
In setting our valuation range, we have also taken into account FFO yield, dividend yield
and price to NTA relativities versus comparable groups. This valuation range reflects:
■ A multiple of 1.22x net tangible assets (NTA).
■ A forecast annualised distributable earnings yield (based on FY17 forecasts) of 7.4%.
■ A forecast annualised distribution yield (again based on FY17 forecasts) of 7.8%.
Figure 12: Valuation summary metrics at variable pricing
Source: IRESS, Company data, Credit Suisse estimates
Peer comparison
As an owner and investment manager of predominantly industrial real estate assets and
funds, PLG has a number of domestic companies that are relevant for valuation purposes.
We have examined eleven comparable A-REITs with reference to a number of valuation
and performance measures.
Investment Properties 56.2 7.65% 735.3
Cornerstones (FY18f avg book value) 54
Management (post notional overhead allocation) 6.5 12.0x 78
Gross Asset Value 867
Corporate costs (50bp MER) -3.7 10.0x -36.8
Net debt (FY18f avg) -274.5
Net other assets -4.8
Net asset value 551.0
Weighted avg securities on issue (FY18; fully diluted) 603
Value per security 0.91$
Propertylink SOTP Val FY18f / trend
income
Cap rate /
multiple
Value
(A$m)
Equity pricing range A$ $0.65 $0.75 $0.85 $0.95 $1.05
Premium / (discount) to last close) -14.5% -1.3% 11.8% 25.0% 38.2%
Premium / (discount) to NTA ps -13.9% -0.7% 12.6% 25.8% 39.1%
Premium / (discount) to CS TP -29.4% -18.6% -7.7% 3.1% 14.0%
FY17 FFO Multiple 9.0x 10.4x 11.8x 13.2x 14.6x
FY18 FFO Multiple 8.3x 9.6x 10.9x 12.1x 13.4x
FY17 DPS Yield 10.5% 9.1% 8.1% 7.2% 6.5%
FY18 DPS Yield 11.4% 9.9% 8.7% 7.8% 7.1%
Weighted average cap rate 7.65% 7.65% 7.65% 7.65% 7.65%
Implied Cap Rate 9.50% 8.72% 8.00% 7.45% 6.95%
15 September 2016
Propertylink Group
(PLG.AX / PLG AU) 11
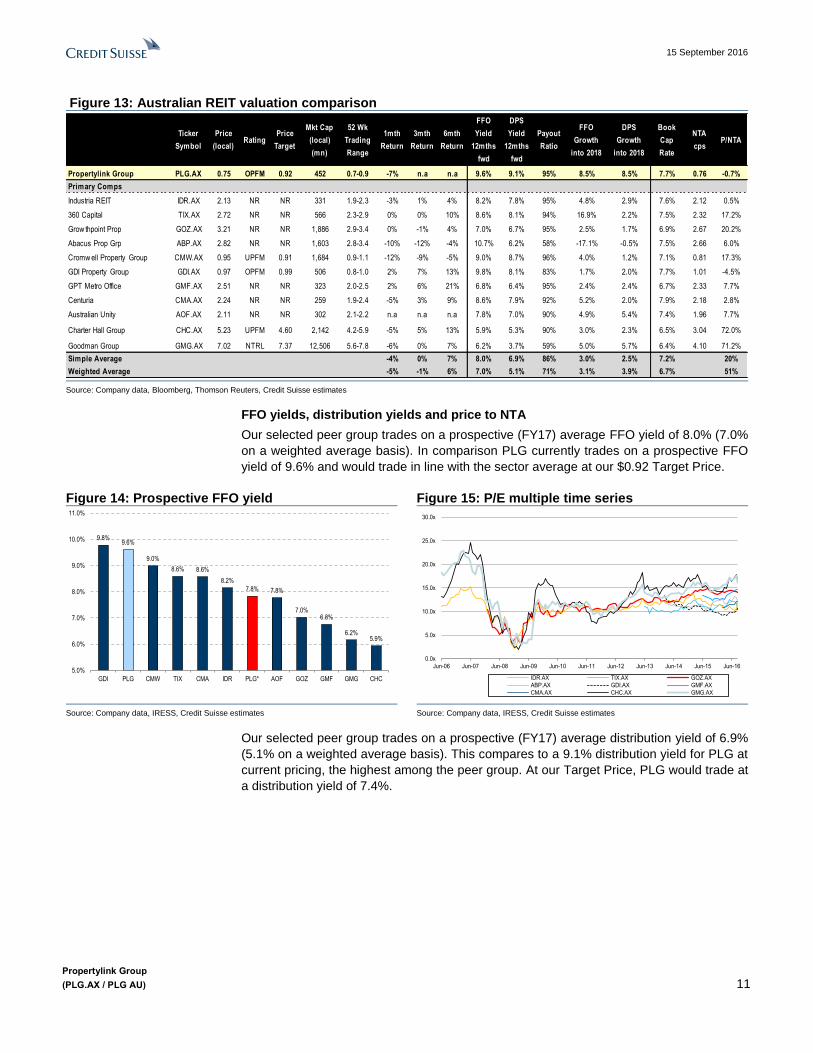
Figure 13: Australian REIT valuation comparison
Source: Company data, Bloomberg, Thomson Reuters, Credit Suisse estimates
FFO yields, distribution yields and price to NTA
Our selected peer group trades on a prospective (FY17) average FFO yield of 8.0% (7.0%
on a weighted average basis). In comparison PLG currently trades on a prospective FFO
yield of 9.6% and would trade in line with the sector average at our $0.92 Target Price.
Figure 14: Prospective FFO yield Figure 15: P/E multiple time series
Source: Company data, IRESS, Credit Suisse estimates Source: Company data, IRESS, Credit Suisse estimates
Our selected peer group trades on a prospective (FY17) average distribution yield of 6.9%
(5.1% on a weighted average basis). This compares to a 9.1% distribution yield for PLG at
current pricing, the highest among the peer group. At our Target Price, PLG would trade at
a distribution yield of 7.4%.
Ticker
Symbol
Price
(local)Rating
Price
Target
Mkt Cap
(local)
(mn)
52 Wk
Trading
Range
1mth
Return
3mth
Return
6mth
Return
FFO
Yield
12mths
fwd
DPS
Yield
12mths
fwd
Payout
Ratio
FFO
Growth
into 2018
DPS
Growth
into 2018
Book
Cap
Rate
NTA
cpsP/NTA
Propertylink Group PLG.AX 0.75 OPFM 0.92 452 0.7-0.9 -7% n.a n.a 9.6% 9.1% 95% 8.5% 8.5% 7.7% 0.76 -0.7%
Primary Comps
Industria REIT IDR.AX 2.13 NR NR 331 1.9-2.3 -3% 1% 4% 8.2% 7.8% 95% 4.8% 2.9% 7.6% 2.12 0.5%
360 Capital TIX.AX 2.72 NR NR 566 2.3-2.9 0% 0% 10% 8.6% 8.1% 94% 16.9% 2.2% 7.5% 2.32 17.2%
Grow thpoint Prop GOZ.AX 3.21 NR NR 1,886 2.9-3.4 0% -1% 4% 7.0% 6.7% 95% 2.5% 1.7% 6.9% 2.67 20.2%
Abacus Prop Grp ABP.AX 2.82 NR NR 1,603 2.8-3.4 -10% -12% -4% 10.7% 6.2% 58% -17.1% -0.5% 7.5% 2.66 6.0%
Cromw ell Property Group CMW.AX 0.95 UPFM 0.91 1,684 0.9-1.1 -12% -9% -5% 9.0% 8.7% 96% 4.0% 1.2% 7.1% 0.81 17.3%
GDI Property Group GDI.AX 0.97 OPFM 0.99 506 0.8-1.0 2% 7% 13% 9.8% 8.1% 83% 1.7% 2.0% 7.7% 1.01 -4.5%
GPT Metro Office GMF.AX 2.51 NR NR 323 2.0-2.5 2% 6% 21% 6.8% 6.4% 95% 2.4% 2.4% 6.7% 2.33 7.7%
Centuria CMA.AX 2.24 NR NR 259 1.9-2.4 -5% 3% 9% 8.6% 7.9% 92% 5.2% 2.0% 7.9% 2.18 2.8%
Australian Unity AOF.AX 2.11 NR NR 302 2.1-2.2 n.a n.a n.a 7.8% 7.0% 90% 4.9% 5.4% 7.4% 1.96 7.7%
Charter Hall Group CHC.AX 5.23 UPFM 4.60 2,142 4.2-5.9 -5% 5% 13% 5.9% 5.3% 90% 3.0% 2.3% 6.5% 3.04 72.0%
Goodman Group GMG.AX 7.02 NTRL 7.37 12,506 5.6-7.8 -6% 0% 7% 6.2% 3.7% 59% 5.0% 5.7% 6.4% 4.10 71.2%
Simple Average -4% 0% 7% 8.0% 6.9% 86% 3.0% 2.5% 7.2% 20%
Weighted Average -5% -1% 6% 7.0% 5.1% 71% 3.1% 3.9% 6.7% 51%
9.8%9.6%
9.0%
8.6% 8.6%
8.2%
7.8% 7.8%
7.0%6.8%
6.2%5.9%
5.0%
6.0%
7.0%
8.0%
9.0%
10.0%
11.0%
GDI PLG CMW TIX CMA IDR PLG* AOF GOZ GMF GMG CHC
0.0x
5.0x
10.0x
15.0x
20.0x
25.0x
30.0x
Jun-06 Jun-07 Jun-08 Jun-09 Jun-10 Jun-11 Jun-12 Jun-13 Jun-14 Jun-15 Jun-16
IDR.AX TIX.AX GOZ.AX
ABP.AX GDI.AX GMF.AX
CMA.AX CHC.AX GMG.AX

15 September 2016
Propertylink Group
(PLG.AX / PLG AU) 12
Figure 16: Prospective dividend yield Figure 17: Distribution yield time-series
Source: Company data, IRESS, Credit Suisse estimates Source: Company data, IRESS, Credit Suisse estimates
Our selected peer group trades on an average price to NTA multiple of 1.20x or 1.53x for
Group's with active income streams such as GMG, CHC and CMW. In comparison PLG
currently trades at a 1% discount to NTA.
Figure 18: Premium (discount) to NTA Figure 19: Price/NTA time-series
Source: Company data, IRESS, Credit Suisse estimates Source: Company data, IRESS, Credit Suisse estimates
9.1%
8.7%
8.1% 8.1% 7.9%7.8%
7.4%
7.0%6.7%
6.4%6.2%
5.3%
3.7%
3.0%
4.0%
5.0%
6.0%
7.0%
8.0%
9.0%
10.0%
PLG CMW GDI TIX CMA IDR PLG* AOF GOZ GMF ABP CHC GMG
*At price target
2.0%
3.0%
4.0%
5.0%
6.0%
7.0%
8.0%
9.0%
10.0%
11.0%
12.0%
Feb-10 Aug-10 Feb-11 Aug-11 Feb-12 Aug-12 Feb-13 Aug-13 Feb-14 Aug-14 Feb-15 Aug-15 Feb-16 Aug-16
IDR.AX TIX.AX GOZ.AX ABP.AX GDI.AX
GMF.AX AOF.AX CHC.AX GMG.AX
72.0% 71.2%
21.8% 20.2%17.3% 17.2%
7.7% 7.7% 6.0%2.8%
0.5%
-0.7%-4.5%-10.0%
0.0%
10.0%
20.0%
30.0%
40.0%
50.0%
60.0%
70.0%
80.0%
CHC GMG PLG* GOZ CMW TIX GMF AOF ABP CMA IDR PLG GDI
*At price target
0.6x
0.8x
1.0x
1.2x
1.4x
1.6x
1.8x
2.0x
2.2x
2.4x
Jul-13 Oct-13 Jan-14 Apr-14 Jul-14 Oct-14 Jan-15 Apr-15 Jul-15 Oct-15 Jan-16 Apr-16 Jul-16
IDR.AX TIX.AX GOZ.AX ABP.AX GDI.AX
GMF.AX CMA.AX CHC.AX GMG.AX

15 September 2016
Propertylink Group
(PLG.AX / PLG AU) 13
Credit Suisse bottom up A-REIT valuation tables
Figure 20: A-REIT Leader Tables
Source: Company data, Credit Suisse estimates
Bottom Up Sector Valuation Preferences
TickerCurrent
Price ($)
Target
Price ($)
Prem. / (Disc)
to Target
Price
Dividend
Yield
TSR
(%)
Earnings
Yield
12mth
fwd PE
FY16-17
EPS
Growth
FY17-19
EPS
Growth
EPS Yield
plus 3yr
growth
Book Cap
Rate
Prem. /
(Disc) to NTARating
LLC.AX 13.26 17.00 -22.9% 5.3% 33.7% 9.8% 10.2x 8.2% 9.4% 19.2% NA n.a OUTPERFORM
PLG.AX 0.76 0.92 -19.7% 9.1% 31.1% 9.5% 10.5x n.a 6.5% 16.0% 7.7% -0.7% OUTPERFORM
WFD.AX 9.56 11.34 -16.0% 3.5% 22.2% 4.9% 20.5x 5.2% 12.5% 17.3% 4.9% 60.4% OUTPERFORM
SCG.AX 4.53 5.27 -14.5% 4.8% 21.3% 5.3% 18.9x 5.3% 5.2% 10.5% 5.6% 31.5% OUTPERFORM
GPT.AX 4.77 5.21 -9.4% 5.1% 14.4% 6.4% 15.7x 2.9% 4.1% 10.5% 5.9% 8.9% NEUTRAL
GDI.AX 0.94 0.99 -7.0% 8.2% 13.8% 9.6% 10.4x -0.7% 5.4% 15.1% 7.5% -7.2% OUTPERFORM
MGR.AX 2.16 2.30 -7.2% 4.8% 11.6% 6.7% 14.9x 11.3% 1.8% 8.5% 6.5% 12.2% NEUTRAL
SGP.AX 4.50 4.73 -6.1% 5.7% 11.0% 6.6% 15.3x 6.0% 6.0% 12.5% 6.5% 17.7% NEUTRAL
GMG.AX 6.93 7.37 -6.7% 3.7% 10.1% 6.2% 16.1x 7.0% 6.6% 12.8% 6.6% 69.0% NEUTRAL
IOF.AX 4.33 4.48 -4.4% 4.6% 8.3% 6.8% 14.8x 2.2% 2.8% 9.5% 6.3% 2.2% NEUTRAL
VCX.AX 3.02 3.08 -3.2% 5.8% 7.8% 6.2% 16.1x -1.7% 4.3% 10.6% 6.1% 16.6% NEUTRAL
DXS.AX 8.68 8.78 -2.2% 5.2% 6.4% 7.3% 13.7x 0.6% -1.0% 6.4% 6.5% 15.3% UNDERPERFORM
CQR.AX 4.08 4.00 0.3% 7.1% 5.3% 7.5% 13.3x 1.1% 3.6% 11.1% 6.9% 7.5% UNDERPERFORM
CMW.AX 0.96 0.91 3.8% 8.7% 3.2% 8.8% 11.3x -9.5% 2.0% 10.9% 7.5% 18.8% UNDERPERFORM
SCP.AX 2.13 2.04 2.8% 5.9% 2.0% 6.6% 15.1x 2.5% 4.7% 11.3% 7.3% 10.7% UNDERPERFORM
BWP.AX 3.06 2.92 3.5% 5.7% 1.1% 5.7% 17.6x 3.3% 3.1% 8.7% 6.8% 19.5% UNDERPERFORM
CHC.AX 5.17 4.60 11.1% 5.4% -5.6% 6.0% 16.7x 2.0% 3.8% 9.8% 6.6% 70.1% UNDERPERFORM
Average -5.8% 5.8% 11.6% 7.1% 14.8x 2.9% 4.8% 11.8% 6.6% 22.0%
Weighted -9.1% 5.0% 14.8% 6.3% 16.3x 4.4% 5.6% 11.9% 5.7% 28.9%
Thursday, 15 Sep, 2016

15 September 2016
Propertylink Group
(PLG.AX / PLG AU) 14
Operational progress since listing PLG has made a promising start to the 2017 fiscal year. Two and a half months into the
year, we note that PLG is running ahead of PDS estimates on a number of fronts including
investment portfolio leasing, debt costs, co-investment income and is well on track in
regards to property management, leasing and acquisition fees.
Denison transaction – 26% targeted FY17 acquisitions in the bag
Most notably, PLG exercised its option to acquire the 13 asset Denison portfolio on August
31 2016 for ~$176m. As expected, PLG acquired 9 of the assets for $142m and
subsequently sold 4 assets to individual buyers at a ~10% premium (~$3m) to PLG's
acquisition price. Notably, PLG acquired the portfolio at a ~10% discount to book values
and reflected a passing yield of 8.9%. In line with the supplementary PDS, PLG have
committed $17.7m of equity (or 25%) to the new PEP fund which includes Goldman Sachs
as the sole investor. Management are confident of growing the PEP fund with further
acquisitions and PLG are likely to maintain a 25% stake in the fund. The large co-
investment stake in PEP (25%) means that PLG has already secured its FY17 PDS
forecast for co-investment income.
Well positioned in terms of investment management fees for FY17
Similarly, PLG has secured in excess of 3 quarters of its forecast property management,
leasing fees and acquisition fees. Compositionally, the gap is largely made up by
acquisition fees. To date, PLG has secured $1.5m of the $3.5m full year forecast. We note
that PLG anticipate to complete a further ~$500m of acquisitions by year end and are
currently bidding (or in due diligence) on ~$280m of opportunities at present for its PAIP II
and SEDCO Funds. We note that PLG is also on track to dispose of 36-52 National
Boulevard, Campbellfield (Vic), with settlement forecast for late September 2016.
Year-to-date tenant retention running at 90%
We note that PLG has already completed 11 of the 27 leases that are forecast to be
completed over FY17. We understand that 10 of these were renewals with no income
downtime and the single new lease over ~600sqm of office space at the Villawood
property was not included in PDS forecasts for FY17. Below we highlight some more
colour on leasing progress to date on several key assets.
Figure 21: Leasing progress and update on key expiries
Source: Company data, Credit Suisse estimates
Secured interest swaps 32bp below PDS forecasts
PLG secured better than expected terms on interest rate hedging over 50% of its drawn
debt ($128m). PLG locked in 3yr and 5yr swaps at a rate of 1.83%, which was 32bp below
PDS expectations of 2.15%. PLG are now forecasting a WACD of ~3.2% for FY17.
Property State BV $%
Total
Cap
Rate
Occu-
pancy
WALE
(yrs)
GLA
(sqm)CS Comment
Gundah & Beaumont Rd, Mt Kuring-GaiNSW 56.2 8% 7.25% 98% 1.8 34,037
In discussions w ith key tenant Sheldon & Hammond (14% NPI) re a 5yr lease extension over 5,300sqm expiring in
Jan-17
Whitside & Main Rd, Clayton VIC 24.0 4% 8.50% 100% 0.5 28,195
Were previously looking to extend Corning Cable on a ST basis over ~11,000sqn, how ever, there is another tenant
interested in a a longer term deal over the entre 28,000sqm
Melbourne Markets, EppingVIC 92.0 13% 7.50% 100% 5.5 74,968
PLG replaced a distressed tenant w ith a new tenant on a long term (10yr) deal and achieved a 20% higher rent
7 Modal Crescent, Canning ValeWA 16.4 2% 8.00% 100% 0.3 15,251
Cahill Transport expected to renew its lease over 7,090sqm (October 2016 expiry)
44 Mandarin St, Villaw oodNSW 18.0 3% 9.75% 92% 3.0 20,294
Completed an off ice lease over 600sqm to a new tenant - upside to PDS forecasts
17-19 Leadership Way, WangaraWA 7.0 1% 8.25% 100% 0.6 5,415
Existing teant Pentair renew ed over the entire property 5,145sqm (August 2016 expiry). Likely to have exercised its
3 year option
39-41 McDow ell St, WelshpoolWA 8.0 1% 8.00% 100% 0.7 6,925
Confident that existing tenant (Iron Mountain) is likely to renew its lease over the entire property
8 Sylvania Way, LisarowNSW 7.4 1% 10.00% 100% 0.9 9,933
Demand stronger than expected w ith 2 potential leasing options. Non-core asset. Likely to be sold post leasing
success
122 New ton Rd, Wetherill ParkNSW 16.3 2% 7.00% 0% 0.0 9,614
Confident spec development w ill be leased on completion (Feb 2017)
15 September 2016
Propertylink Group
(PLG.AX / PLG AU) 15
Financial Forecasts Above sector average growth on conservative FUM growth assumptions
Our earnings forecasts include proforma income statement estimates in addition to our
explicit forecasts from FY17 onwards.
We note that PLG's ability to generate earnings growth in excess of inflation (adjusted
leverage) is largely dependent on its ability to grow Funds Under Management (FUM) in its
investment management business. The operating leverage in investment management
earnings is material with each dollar of incremental FUM generating an incremental margin
of in excess of 70%, on our estimates. Furthermore, 'one off' acquisition fees also
represent a material proportion of FFO – for example, proforma (FY17) acquisition fees of
$3.5m equates to 8.0% of proforma FFO.
We have adopted relatively conservative FUM growth assumptions in our explicit forecasts
from FY17 onwards at this juncture. We are also cognisant that proforma estimates are
based on growing external FUM by $675m, representing 77% growth on the FY16 external
FUM base. We note, however, that this figure reduces to 57% after adjusting for the
$176m Denison portfolio acquisition that recently settled.
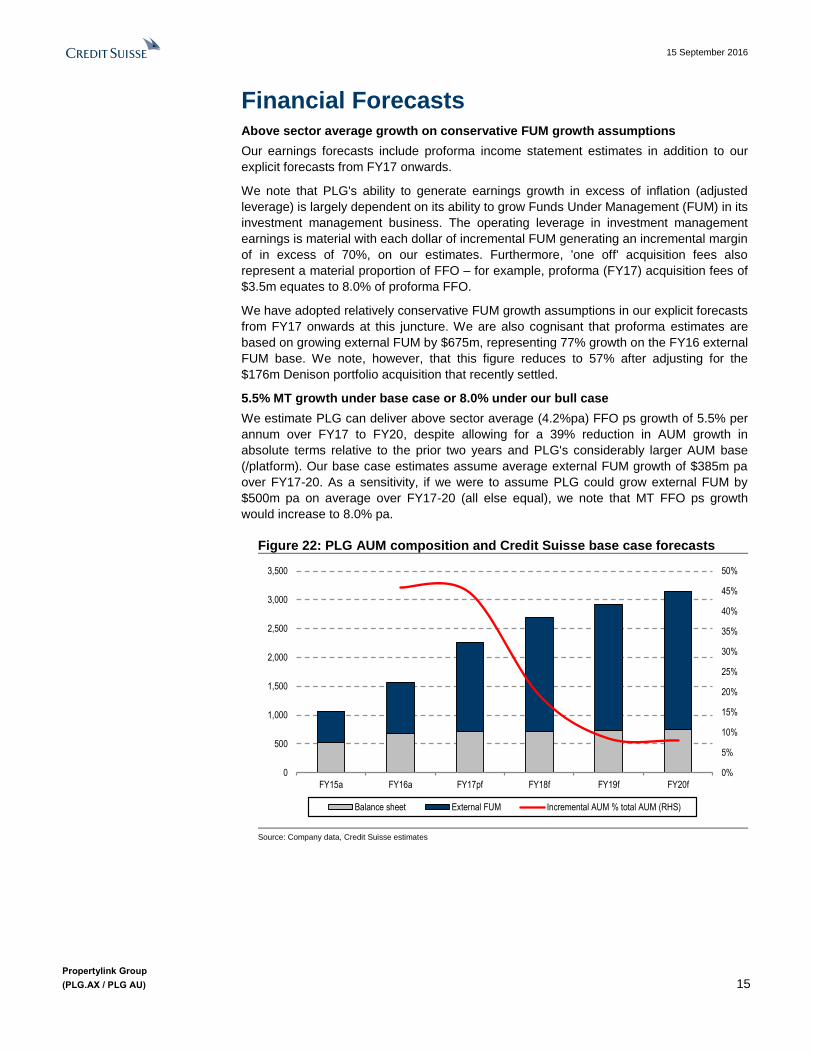
5.5% MT growth under base case or 8.0% under our bull case
We estimate PLG can deliver above sector average (4.2%pa) FFO ps growth of 5.5% per
annum over FY17 to FY20, despite allowing for a 39% reduction in AUM growth in
absolute terms relative to the prior two years and PLG's considerably larger AUM base
(/platform). Our base case estimates assume average external FUM growth of $385m pa
over FY17-20. As a sensitivity, if we were to assume PLG could grow external FUM by
$500m pa on average over FY17-20 (all else equal), we note that MT FFO ps growth
would increase to 8.0% pa.
Figure 22: PLG AUM composition and Credit Suisse base case forecasts
Source: Company data, Credit Suisse estimates
0%
5%
10%
15%
20%
25%
30%
35%
40%
45%
50%
0
500
1,000
1,500
2,000
2,500
3,000
3,500
FY15a FY16a FY17pf FY18f FY19f FY20f
Balance sheet External FUM Incremental AUM % total AUM (RHS)
15 September 2016
Propertylink Group
(PLG.AX / PLG AU) 16
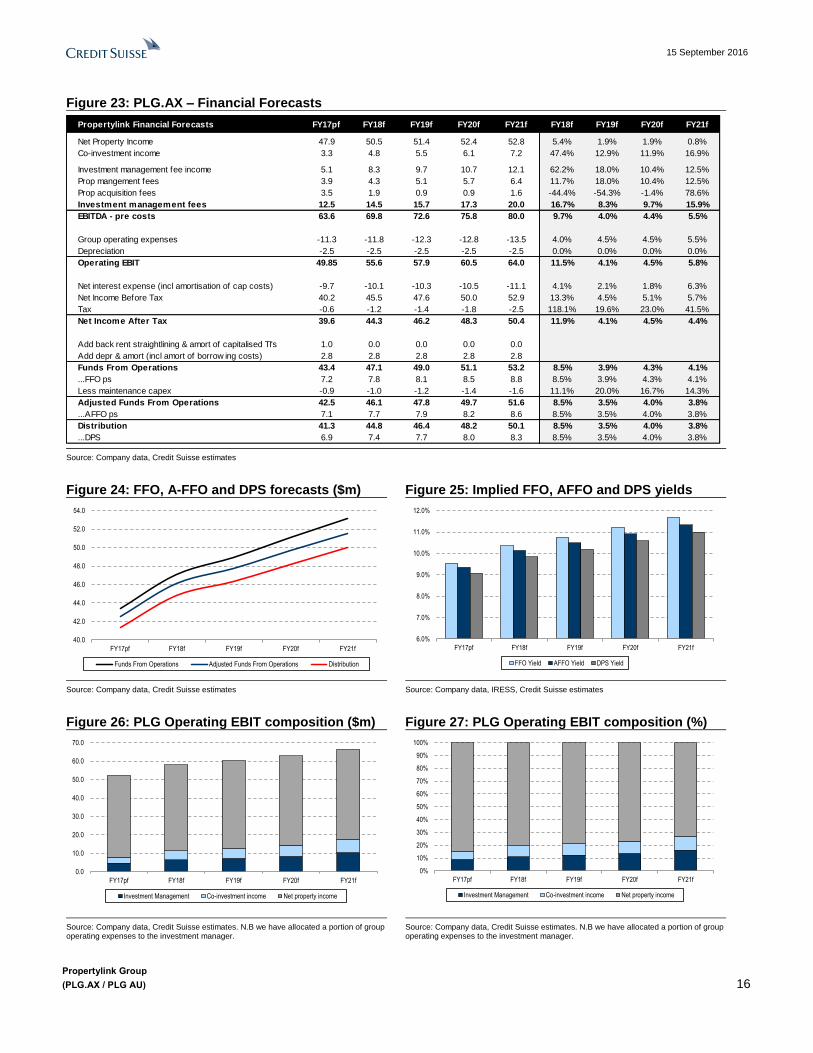
Figure 23: PLG.AX – Financial Forecasts
Source: Company data, Credit Suisse estimates
Figure 24: FFO, A-FFO and DPS forecasts ($m) Figure 25: Implied FFO, AFFO and DPS yields
Source: Company data, Credit Suisse estimates Source: Company data, IRESS, Credit Suisse estimates
Figure 26: PLG Operating EBIT composition ($m) Figure 27: PLG Operating EBIT composition (%)
Source: Company data, Credit Suisse estimates. N.B we have allocated a portion of group operating expenses to the investment manager.
Source: Company data, Credit Suisse estimates. N.B we have allocated a portion of group operating expenses to the investment manager.
Propertylink Financial Forecasts FY17pf FY18f FY19f FY20f FY21f FY18f FY19f FY20f FY21f
Net Property Income 47.9 50.5 51.4 52.4 52.8 5.4% 1.9% 1.9% 0.8%
Co-investment income 3.3 4.8 5.5 6.1 7.2 47.4% 12.9% 11.9% 16.9%
Investment management fee income 5.1 8.3 9.7 10.7 12.1 62.2% 18.0% 10.4% 12.5%
Prop mangement fees 3.9 4.3 5.1 5.7 6.4 11.7% 18.0% 10.4% 12.5%
Prop acquisition fees 3.5 1.9 0.9 0.9 1.6 -44.4% -54.3% -1.4% 78.6%
Investment management fees 12.5 14.5 15.7 17.3 20.0 16.7% 8.3% 9.7% 15.9%
EBITDA - pre costs 63.6 69.8 72.6 75.8 80.0 9.7% 4.0% 4.4% 5.5%
Group operating expenses -11.3 -11.8 -12.3 -12.8 -13.5 4.0% 4.5% 4.5% 5.5%
Depreciation -2.5 -2.5 -2.5 -2.5 -2.5 0.0% 0.0% 0.0% 0.0%
Operating EBIT 49.85 55.6 57.9 60.5 64.0 11.5% 4.1% 4.5% 5.8%
Net interest expense (incl amortisation of cap costs) -9.7 -10.1 -10.3 -10.5 -11.1 4.1% 2.1% 1.8% 6.3%
Net Income Before Tax 40.2 45.5 47.6 50.0 52.9 13.3% 4.5% 5.1% 5.7%
Tax -0.6 -1.2 -1.4 -1.8 -2.5 118.1% 19.6% 23.0% 41.5%
Net Income After Tax 39.6 44.3 46.2 48.3 50.4 11.9% 4.1% 4.5% 4.4%
Add back rent straightlining & amort of capitalised TI's 1.0 0.0 0.0 0.0 0.0
Add depr & amort (incl amort of borrow ing costs) 2.8 2.8 2.8 2.8 2.8
Funds From Operations 43.4 47.1 49.0 51.1 53.2 8.5% 3.9% 4.3% 4.1%
...FFO ps 7.2 7.8 8.1 8.5 8.8 8.5% 3.9% 4.3% 4.1%
Less maintenance capex -0.9 -1.0 -1.2 -1.4 -1.6 11.1% 20.0% 16.7% 14.3%
Adjusted Funds From Operations 42.5 46.1 47.8 49.7 51.6 8.5% 3.5% 4.0% 3.8%
...AFFO ps 7.1 7.7 7.9 8.2 8.6 8.5% 3.5% 4.0% 3.8%
Distribution 41.3 44.8 46.4 48.2 50.1 8.5% 3.5% 4.0% 3.8%
...DPS 6.9 7.4 7.7 8.0 8.3 8.5% 3.5% 4.0% 3.8%
40.0
42.0
44.0
46.0
48.0
50.0
52.0
54.0
FY17pf FY18f FY19f FY20f FY21f
Funds From Operations Adjusted Funds From Operations Distribution
6.0%
7.0%
8.0%
9.0%
10.0%
11.0%
12.0%
FY17pf FY18f FY19f FY20f FY21f
FFO Yield AFFO Yield DPS Yield
0.0
10.0
20.0
30.0
40.0
50.0
60.0
70.0
FY17pf FY18f FY19f FY20f FY21f
Investment Management Co-investment income Net property income
0%
10%
20%
30%
40%
50%
60%
70%
80%
90%
100%
FY17pf FY18f FY19f FY20f FY21f
Investment Management Co-investment income Net property income

15 September 2016
Propertylink Group
(PLG.AX / PLG AU) 17
Below, we provide some additional colour on key income and expense items:
Net property income
Our estimates assume comparable NOI growth of ~1.9% pa (implicitly incorporating
negative re-leasing spreads partly offsetting the positive impact of higher embedded fixed
increases) and relatively stable occupancy and tenant retention levels (~95% and ~65%,
respectively). We believe this is appropriate given PLG has c.47% of income expiring over
the next 3 years. In addition, we have not explicitly incorporated any balance sheet
acquisitions, which would be highly accretive given PLG's 3.2% WACD.
Figure 28: A-REIT avg occupancy & comp NOIg Figure 29: A-REIT Industrial Comp NOI growth
Source: Company data, Credit Suisse estimates Source: Company data, Credit Suisse estimates. N.B DXS on effective basis.
Co-investment income
PLG's co-investment income consists of its equity accounted share of income from co-
investment stakes in its External Funds. PLG typically targets co-investment stakes of 5-
10%. Notably, given the relatively high leverage (~55%) in PLG's external funds, the co-
investment stakes generate a high yield (>10%).
Our forecasts assume PLG's co-investment stakes grow in-line with our discrete external
FUM growth assumptions (in addition to organic asset growth) – i.e. we have assumed a
constant PLG co-investment stake (~10%) for acquisitions from FY17 onwards. We
assume PLG's $23.9m drawn co-investment stake as at June 2016 increases to $49.9m
by June 2017 (consistent with PDS forecasts for an additional $26m to co-invest in the
$750m of targeted acquisitions).
Specifically, PLG has already committed $17.7m (25% equity stake) towards the recently
established PEP fund following the settlement of the Denison portfolio ($142m). The
remaining $8.3m of co-investments which form the $26m of additional forecast co-
investments over FY17 are expected to be invested in PAIP II, POP III and SEDCO.
Investment management
PLG generates both recurring and 'one-off' transactional and performance fees from its
External Funds platform (detailed below).
Notably, acquisition fees represent 28% of FY17 proforma investment management EBIT,
however, given our assumption for a more moderate rate of FUM growth over FY-18-21,
this reduces to 8% on average. As such, the underlying quality of investment management
earnings should improve overtime. We note that our forecasts do not explicitly assume any
performance fees including the $9.5m of performance fees that would be crystalised if the
asset in the POP II (320 Pitt St) Fund was sold down at its current valuation.
94.4%
-1.3%
-2.0%
-1.0%
0.0%
1.0%
2.0%
3.0%
4.0%
5.0%
92.5%
93.5%
94.5%
95.5%
96.5%
97.5%
98.5%
Dec-08 Dec-09 Dec-10 Dec-11 Dec-12 Dec-13 Dec-14 Dec-15
A-REIT average occupancy A-REIT average comparable NOI growth
-8.0%
-6.0%
-4.0%
-2.0%
0.0%
2.0%
4.0%
6.0%
8.0%
10.0%
Dec-12 Jun-13 Dec-13 Jun-14
Dec-14 Jun-15 Dec-15 Jun-16
GPT DXSGPT MGR

15 September 2016
Propertylink Group
(PLG.AX / PLG AU) 18
Figure 30: PLG—External fund fee schedule
Source: Company data
We forecast investment management fees (comprising funds management, acquisition
and property management and leasing) increase from $12.5m in FY17 (proforma) to
$20.1m by FY21 (12.6% CAGR). We note however that this does not take into account the
scalability benefits as unallocated group costs increase below the rate of FUM growth.
After separately allocating trust expenses (based on a 50bp MER), our analysis suggests
that net investment management EBIT increases by 23%pa over FY17 to FY21.
This is illustrated below, Figure 31 highlights that net investment management fees (after
allowing for our estimate of the costs required to achieve those fees) as a percentage of
External FUM are forecast to moderately improve despite the fact that acquisition fees
reduce by 69% on average ($1.3m) over FY18-21 relative to FY17 ($3.5m)
Figure 31: Investment Management Fees as % External FUM
Net IM fees should steadily increase despite lower transactional fees in our est.
Source: Credit Suisse estimates
Type Description Typical Range
Acquisition feesPayable when Propertylink acquires property on behalf of the External Fund. A one-off
fee paid on settlement of an asset acquisition.0.45% - 0.50% of GAV p.a.
Base feesAn ongoing base management fee. Typically paid on a quarterly basis in arrears in
March, June, September and December.0.45% - 0.50% of GAV p.a.
Performance fees
A performance fee payable to Propertylink, and based on the level of return Propertylink
has generated for the investors in the External Funds. Typically paid on the return of
capital to External Funds Investors post an asset sale (or sales).
20.0% - 40.0% of fund
outperformance above hurdles
of 10.0% - 15.0%
Property management feesA fee payable for the day to day management of the properties in the External Fund. Paid
monthly in arrears.
2.0% - 2.5% of gross income
p.a.
Leasing fees
Payable when Propertylink signs a new tenant to the property or renews a lease, and
may be based on the length of the tenancy. Paid on the successful execution of a new
lease.
Market standard rates
Project management feesPayable where Propertylink oversees projects undertaken on properties (including
developments and improvements). Paid as invoices are paid in relation to a project.Market standard rates
0.00%
0.20%
0.40%
0.60%
0.80%
1.00%
1.20%
FY17pf FY18f FY19f FY20f FY21f
Gross IM fees % External FUM Net IM fees % External FUM

15 September 2016
Propertylink Group
(PLG.AX / PLG AU) 19
Interest expense
PLG has initially drawn $256.6m (35% balance sheet gearing) from its $300m syndicated
bank debt facility, which comprises two tranches of $150m over both three and five year
durations and in aggregate giving the group a weighted average debt maturity of four
years. Notably, the margin on the 3yr facility of 135bp compares to 160bp for the 5yr
facility, however these rates increase to 150bp and 160bp, respectively in the event that
PLG's balance sheet LVR exceeds 40%.
We note that PLG's policy is to hedge its interest rate exposure to between 50% and
100% of drawn borrowing. We understand that post-IPO, PLG has hedged 50% of its
drawn debt at more favorable rates than those assumed in PDS forecasts.
PLG guided to a WACD of 3.52% for FY17, which we have assumed will be relatively
static in the MT (with upside potential) based on our economists view that the interest rate
easing cycle may still have some way to go. We allow for interest costs to tick up to 4.25%
by FY20, which is broadly consistent with what we have assumed for other A-REITs with
standard hedging profiles.
Figure 32: PLG vs peer weighted average debt cost Figure 33: PLG vs peer look through gearing
Source: Company data Source: Company data
Figure 34: PLG vs peer weighted avg debt maturity Figure 35: PLG vs peer % debt hedged
Source: Company data Source: Company data
Distributions
PLG's distribution policy is to payout 80% to 100% of distributable earnings. PDS
forecasts for FY17 reflect a 95% payout ratio on this basis. Our explicit forecasts from
FY18-21 assume an average payout ratio of 94% of distributable income or 97.1% of
Adjusted Funds From Operations (A-FFO).
0.0%
1.0%
2.0%
3.0%
4.0%
5.0%
6.0%
ABP GMF CHC GDI GOZ IDR CMA TIX AOF Propertylink
0.0%
5.0%
10.0%
15.0%
20.0%
25.0%
30.0%
35.0%
40.0%
45.0%
TIX GOZ Propertylink GDI CMA IDR ABP AOF GMF CHC
0.0
0.5
1.0
1.5
2.0
2.5
3.0
3.5
4.0
4.5
5.0
AOF GOZ Propertylink CHC CMA GMF ABP IDR GDI TIX
0%
10%
20%
30%
40%
50%
60%
70%
80%
90%
100%
TIX CHC AOF GOZ IDR GMF CMA ABP GDI Propertylink

15 September 2016
Propertylink Group
(PLG.AX / PLG AU) 20
Strengths and opportunities Australia focused and internally managed platform
We note that PLG is the only Australia-focused, internally managed industrial & logistics
trust and integrated investment and asset management platform
Stable income and structured rental growth & Portfolio diversification
PLG provides investors exposure to institutional grade industrial, logistics and commercial
office real estate assets which are well diversified by geography, tenants and leasing
profile. We see the portfolio's 81% exposure (by revenue) to Sydney and Melbourne and
the portfolio's diversified tenant base (with no single tenant contributing more than 5% of
total lease income) as attractive. We also note that approximately 90% of leases (by
income) are subject to annual fixed or CPI-linked rent reviews. Furthermore, PLG has a
strong history of retaining existing tenants. We note the retention rate for all expiring
leases for the 12 months ending 30 June 2016 was 83.9%.
Figure 36: Portfolio geographic diversification Figure 37: Portfolio asset diversification
Note: As at 30 June 2016. Source: Company data Note: As at 30 June 2016. Source: Company data
Access to an experienced and stable management team with over 20 years average
experience and majority independent board. Highly experienced management team
and majority independent board
PLG's senior management team has over 20 years average experience and has worked
together since 2009. Furthermore, we note that PLG has a well-established governance
structure due to its 15 years as an unlisted public company. The board has over 30 years
average corporate and industry experience and in excess of five years average tenure in
relation to PLG.
Established and rapidly growing investment and asset management platform,
backed by leading global investors
Since 30 June 2013, the business has successfully grown AUM from $39m to over
$1.55bn as at 30 June 2016. Management forecasts AUM growth of $675m in FY17,
which is generally consistent with the quantum of AUM growth achieved over the past two
years. In August, PLG launched a 10th fund (Propertylink Enhanced Partnership) to house
the $142m Denison portfolio acquisition.
Sydney46%
Melbourne34%
Brisbane15%
Perth5%
Unit Estate21%
Business Park17%
Logistics31%
Industrial29%
Development2%

15 September 2016
Propertylink Group
(PLG.AX / PLG AU) 21
Figure 38: PLG historical and forecast growth in total AUM
A$m unless otherwise stated
Source: Company data
PLG intends to establish new external funds as additional capital is made available by its
new and existing investors. It is currently in the process of raising further capital for two of
the External funds:
■ PAIP II: The second PLG Australian Industrial Partnership vehicle has a target AUM of
$700m to $900m. As noted above, PAIP II has a mandate to pursue core-plus and
value-add industrial and logistics investment opportunities across Australia’s capital
cities. As at 30 June 2016, PAIP II had $127.0m of equity commitments and $166.8m
of assets.
■ POP III: A multi-asset fund targeting core-plus and value-add office assets. As at 30
June 2016, the fund had $44.5m of equity commitments and had successfully acquired
$91.1m of assets.
According to Colliers International, PLG was the second largest acquirer of Industrial
assets (by value) over 2014/15. The company was second to Frasers Centrepoint but
came in ahead of Charter Hall, Mapletree Logistics Trust and Mirvac Group.
We note that the balance sheet portfolio was originally the PLG Australian Industrial
Partnership (PAIP), which was the Group's flagship External fund. The cornerstone
investors of this fund were Goldman Sachs and Grosvenor. Notably, the Fund achieved
rapid growth through acquisitions from early 2014 to mid-2015.
On our estimates, almost 70% of the portfolio (PAIP) was acquired by way of portfolio
acquisitions as illustrated below. Breaking these transactions down by their book value (as
at 30 June 2016), we can see that the majority of the portfolio was acquired from Equity
Commonwealth (19%), Abacus (18%), Valad (18%), AMP (13%) and Dexus (11%). We
note that many of these transactions included additional assets that form part of PLG's
External funds.
39
295
1,068
1,558
2,233
$0
$500
$1,000
$1,500
$2,000
$2,500
FY13 FY14 FY15 FY16F FY17F
43%
656%
262%
46%

15 September 2016
Propertylink Group
(PLG.AX / PLG AU) 22
Figure 39: Book value of balance sheet portfolio acquisitions
As at 30 June 2016
Source: Company data
PLG's existing investors within its External funds include significant global institutional
investors from North America, Europe, Middle East, Asia and Australia. These include
Goldman Sachs, Grosvenor Group, The Norinchukin Bank, Townsend Group, Fosun,
Sedco and Al Salam Bank. We note these investors have considerable AUM and some
are actively looking to increase their exposure to Australian commercial real estate. Given
five of these major investors have only invested in Australia with PLG to date, we believe
PLG is well positioned to grow AUM from both existing and new funds with its existing
investor base.
Operational leverage in funds management
PLG typically earns 70-75bp in recurring fees (investment management and property
management) on external AUM and one-off acquisition fees, which are typically 50bp of
the fair value of the assets acquired. In our view, the funds management business has
considerable operating leverage with operating margins expected to grow as AUM grows.
PLG has now reached a scale where significant increases in AUM will only require a
relatively small increase in direct headcount.
Opportunity to earn performance fees
We note that since the establishment of POP I, POP II, PALT and PAIP, PLG has
delivered a weighted average equity (levered) IRR of 28.5% across these External funds.
To date, PLG has earned a performance fee of $26.2m from the divestment of the PAIP
fund. While this fee is not attributable to new investors, any future performance fees will
however be available for distribution to PLG Security holders. Whilst performance fees are
not included in the pro forma forecasts we note that a performance fee of $9.5m would be
payable to PLG if the properties in the External funds were sold at their current valuation
on 30 June 2016. However, we note that the final amount of performance fees is ultimately
dependent on the sale proceeds realised for the properties when actually sold.
Further value potential through active asset management
PLG has a fully integrated investment and asset management business platform which
provides it with the ability to actively manage assets to deliver superior risk-adjusted
returns. As such, PLG sees its relatively low weighted average lease expiry (WALE) as an
AMP13%
Valad8%
Abacus18%
Equity Commonwealth
19%
Dexus11%
Other31%

15 September 2016
Propertylink Group
(PLG.AX / PLG AU) 23
opportunity to re-set leases on better terms for certain properties and extend the WALE,
which should result in valuation uplift (all else equal).
15 Talavera Rd, Macquarie Park is one case study. This property was acquired from
AMP in June 2015 for ~$34m. Since acquiring the asset, PLG has re-leased 75% of the
leases, increasing the WALE from 2.4 years to 4.4 years and is currently refurbishing the
building. The property has since been re-valued at $62m as at 30 June 2016. Similarly, we
also note that the ten assets acquired from Abacus and its managed (ADIF II) fund in June
2014 for $106.7m have since been re-valued at $124.8m reflecting leasing success such
as the new ten-year lease at 144-168 National Boulevard, Campbellfield with the existing
tenant and new leases (albeit short-term) over 100% of the property at 4 Brunker Rd,
Chullora.
122 Newton Rd, Wetherill Park is another value-add opportunity. The property was
acquired from Metcash in May 2015 and is entirely vacant. PLG will speculatively develop
a new 8,914 sqm warehouse at the rear of the property and refurbish the existing
warehouse (9,614 sqm). PLG has allowed for $9.6m in capital expenditure in FY17 with
work scheduled to commence in August 2016 and practical completion expected in
February 2017. PLG will target rents of $115-120/sqm for the new warehouse and
$105/sqm for the existing property. Given the tight prevailing occupier conditions in this
established industrial market, we expected lease enquiry levels should ramp up as
building works near completion.
144-156 McCredie Rd, Smithfield is another property where leasing success could
deliver solid valuation upside given the current book value of $19.7m equates to a
relatively modest $997/sqm of GLA. We note the property was acquired as part of a
portfolio transaction with Valad in October 2014. This existing tenant (Trust Company) will
formally vacate the c.20,000 sqm property in January 2017. The property is a classic
secondary industrial warehouse located in a well-established industrial market that attracts
national and international manufacturing and logistics space users. The property is
suitable for a variety of users given its 7 to 10m clearance and a flexible configuration that
provides future subdivision opportunities. PLG will undertake a comprehensive
refurbishment program at expiry in order to minimise downtime and enhance the
marketability of the asset to prospective tenants.
In the table below, we also highlight a number of other balance sheet properties where
PLG will look to add value through active asset management.

15 September 2016
Propertylink Group
(PLG.AX / PLG AU) 24
Figure 40: Key opportunities to add value through active management
Source: Company data
We also note two assets within the single-asset External funds POP I and POP II, which
have considerable potential upside through repositioning and may ultimately result in
performance fees for the Group:
■ 73 Miller St, North Sydney (POP I). PLG acquired the property in January 2015 for
$116.5m from an Investa managed wholesale fund. The acquisition was acquired
through POP I which is backed by cornerstone investor Fosun. The book value of the
property is $130m as at 30 June 2016 and PLG has a $5.8m co-investment in the fund.
Notably, PLG is awaiting the outcome of the current planning review under way in
North Sydney. However, based on its preliminary due diligence, it may be feasible to
demolish the existing 13-storey building in order to build a taller more efficient (c.20-
storey) commercial building. The property is fully leased and the major tenant is
Government Property NSW which has a June 2019 expiry. As such, any potential re-
development would not take place until late 2019.
■ 320 Pitt St, Sydney (POP II). PLG acquired the property in June 2015 for $200m
(8.26% cap rate) from Equity Commonwealth Trust as part of a broader transaction
($303.3m) which included eight industrial assets. This specific asset was acquired
through POP II, which is backed by cornerstone investors Goldman Sachs and
Grosvenor Group. The longer term strategy is to reposition this secondary property
through refurbishment. We note that PLG investigated the feasibility of residential
conversion but found this would be challenging given the building has no basement car
parking.
Balance Sheet Properties State BV $/sqmOccu-
pancy
Cap
Rate
GLA
(sqm)
WALE
(yrs)CS Comment
7 Gundah & 22 Beaumont Rd, Mt Kuring-Gai NSW 56.2 1,604 98.0% 7.25% 35,037 1.8Acquired from local private developer. Well presented and modern multi-unit estate. Looking to renew Sheldon &
Hammond (14.1% NPI) on a longer term lease. Market rents around $125/sqm. Incentives relatively low at ~10%
10-12 Pike St, Rydelmere NSW 21.9 1,094 100.0% 8.50% 20,022 2.0
Older syle secondary grade industrial facility located in a precinct that has been identif ied for higher & better use.
100% leased to WACO Kw ikform until June 2018. Strategy is to renew as much as as possible and generate cash
f low , w hilst continuing to explore future development potential w ith neighbouring landlords (i.e. GMG, DXS, AMP)
150-156 McCredie Rd, Smithfield NSW 19.7 997 100.0% 8.50% 19,765 0.6Secondary grade property - looking for new tenant w ith the near term expected departure of the incumbent tenant
(Trust Company).
122 New ton Rd, Wetherill Park NSW 16.3 1,695 0.0% 7.00% 9,614 0.0Previously occupied by Mitre 10. Propertylink is planning to refurbish the existing building and speculatively develop
the rear building and w ill target rents of $115-120/sqm for the new build
4 Brunker Rd, Chullora NSW 11.0 1,711 100.0% 7.25% 6,428 2.7 Was 25% vacant w hen acquired. Now 100% leased
1 Orielton Rd, Smeaton Grange NSW 8.2 1,066 30.6% 7.50% 7,689 1.2 This is a secondary grade Unit Estate and is just under 70% vacant.
8 Sylvania Way, Lisarow NSW 7.4 745 100.0% 10.00% 9,933 0.9 Non-core asset. Likely to be sold to ow ner occupier at some point dow n the track
71-93 Whitside & 74-78 Main Rd, Clayton VIC 24.0 851 100.0% 8.50% 28,195 0.53 buildings on 6.6ha of land w ith future subdivision potential. Entirely leased to Corning Cable w ho supply cable to
NBNco. Likely to contract to 11ksqm on a S-T extentsion. PLG noted that another tenant may lease the entire facility
18-24 Ricketts Rd, Mount Waverley VIC 16.9 1,895 100.0% 7.75% 8,916 2.4B-grade Business Park. Multi-tenanted property. Office Rents $185-225/sqm & Industrial $75/sqm. Strategy to
extend WALE through renew als
1-5 Lake Dr, Dingley VIC 16.4 941 100.0% 7.50% 17,430 2.0Built late 80's. Leased to Unicharm w ho manufacture nappies. Tenant may look to contract from 18ksqm to 10ksqm.
Tenant may relocate to new smaller facility. Propertylink could strata the property. Property is currently over-rented
82 Taryn Dr, Epping VIC 12.3 1,161 100.0% 7.00% 10,590 1.8Leased to Stanley Black & Decker w ho have a brief in the market and are looking to re-locate to the South East
region - expect to vacate
25 Strezlecki Ave, Sunshine West VIC 10.7 1,022 100.0% 7.50% 10,467 3.5Strategy is to entend the current lease w ith Bitzer and also in discussions w ith the tenant about the potential to
develop another facility on the residual land of the site
36-52 National Blvd, Campbellf ield* VIC 9.3 795 0.0% 7.50% 11,705 0.0 100% vacant and currently in DD w ith local investor. Currently expected to settle in September 2016
571 Mount Derrimut Rd, Derrimut VIC 7.7 921 0.0% 7.25% 8,357 0.0 Completely vacant since Nov-15. Previously occupied by GAM steel. Highly competitive market
7 Modal Crescent, Canning Vale WA 16.4 1,075 100.0% 8.00% 15,251 0.3 Strategy is to renew the Cahill Transport lease, w hich is set to expire in October 2016 (7,090sqm)
17-19 Leadership Way, Wangara WA 7.0 1,293 100.0% 8.25% 5,415 0.6 Pentair Flow Control has exercised its right to extend the least by 3 years over the entire facility
39-41 McDow ell St, Welshpool WA 8.0 1,155 100.0% 8.00% 6,925 0.7100% leased to Iron Mountain (lease expiry on Feb-17). Tenant (Recall) delayed renew al negotiations after being
acquired by Iron Mountain. Management expect to renew this lease

15 September 2016
Propertylink Group
(PLG.AX / PLG AU) 25
However, given the current strength of the Sydney B-Grade office market, which is
expected to improve further as c.60,000 sqm of commercial space is withdrawn to
accommodate new metro stations (displacing incumbent tenants), we expect the longer
term strategy will be a major refurbishment. PLG is likely to undertake a rolling
refurbishment of the building including lobby upgrades, new lifts and end of trip
facilities. This will enable the property to attract higher rents than the current passing
rent of c.$600/sqm (market closer to $700/sqm). The timing will largely depend on
Telstra who is the major tenant with a lease expiry in 2020.

15 September 2016
Propertylink Group
(PLG.AX / PLG AU) 26
Key risks Retention of key personnel
PLG's senior management team is a critical part of the company's business and growth
strategy. If PLG was to lose any of its senior management members or was unable to
employ adequate replacement personnel, its operations could be adversely affected. In
particular, we see the greatest "key man" risk in the External funds business, which, like
any Funds Management business, is underpinned by relationships with the existing
management team. In the event of a material change in personnel, it is not unreasonable
to assume that the potential growth of the External funds business and the existing Assets
Under Management (AUM) could be negatively impacted.
Ability to secure additional capital and fund assets at attractive pricing
In our view, PLG's ability to grow Fund and Asset Management earnings is dependent on
sourcing additional capital from investors and acquiring further assets for third party funds
at attractive prices. Importantly, further growth in FUM is implicit in our adopted valuation
range for PLG.
FUM growth key to generating above sector average FFO ps growth
We note that PLG's ability to generate earnings growth in excess of inflation (adjusted
leverage) is largely dependent on its ability to grow Funds Under Management (FUM) in its
investment management business. The operating leverage in investment management
earnings is material with each dollar of incremental FUM generating an incremental margin
of in excess of 70%, on our estimates. Furthermore, 'one off' acquisition fees also
represent a material proportion of FFO – for example, proforma (FY17) acquisition fees of
$3.5m equates to 8.0% of proforma FFO or 28% of Fund and Asset Management
revenues. We are also cognisant that proforma estimates are based on growing external
FUM by $675m, representing 77% growth on the FY16 external FUM base. We note,
however, that this figure reduces to 57% after adjusting for the $176m Denison portfolio
acquisition that recently settled.
Figure 41: PLG growth drivers: FY17-21 CAGR
Source: Credit Suisse estimates
Cyclicality of real estate values
PLG's Fund Management fees are tied to the market value of its Funds Under
Management. Hence, material shifts in industrial market valuations (upward or downward)
0.0%
5.0%
10.0%
15.0%
20.0%
25.0%
Net PropertyIncome
Net interestexpense
Groupoperatingexpenses
AdjustedFunds FromOperations
Distribution Funds FromOperations
Investmentmanagement
fees
Co-investmentincome

15 September 2016
Propertylink Group
(PLG.AX / PLG AU) 27
will impact (positively or negatively) upon PLG's Fund Management fees and overall level
of profitability.
Re-leasing and vacancy risk given PLG's relatively short WALE
PLG's assets are generally secondary grade in nature and could be subject to higher
downtime and capital expenditure (incentives and maintenance capex) when leases
expire, which in turn could have a negative impact on rental income.
We note that PLG's portfolio has relatively high lease expiry risk relative to peers with
~44% of leases expiring by CY18. Similarly, PLG's portfolio WALE of 3.6 years is the
second lowest in the sector after ABP and is below the A-REIT average of 5.6 years. We
note however, that PLG's tenant retention rate for all expiring leases for the 12 months
ending 30 June 2016 was 83.9% and the retention rate for the Portfolio on a standalone
basis was 63.2%, which fares well relative to peers.
Figure 42: PLG Portfolio Lease Expiry Profile Figure 43: A-REIT Industrial Portfolio WALE
Source: Company data, Credit Suisse estimates Source: Company data, Credit Suisse estimates
We believe that in certain instances, some smaller secondary grade industrial assets will
be more difficult to lease-up, particularly those exposed to more challenging markets. For
example, we see potential downside risks to existing vacancies and near-term expiries for
properties located in West Melbourne, Campbellfield and Perth.
Specifically, the existing vacancy at 571 Mount Derrimut Rd, Derrimut (8,357 sqm) is
located in the highly competitive Melbourne West market where there is over 350,000 sqm
of vacant stock according to Knight Frank. To date, the property has received only limited
enquiry. The property has been vacant since November 2015 and is forecast to be re-
leased by the end of the calendar year.
PLG's second largest Melbourne asset at 71-93 Whitside Rd, Clayton in the South East
of Melbourne is entirely leased to Corning Cable over 28,195 sqm which is also PLG's
largest single tenant exposure (c.5% income). Notably, PLG expects the tenant will
downsize by around 17,700 sqm and may only extend their lease for a relatively short
duration (c.2 years) at this juncture. More recently however, we understand that PLG is in
discussions with a prospective tenant which may look to occupy the entire facility on a
longer term lease. We note the property comprises three freestanding warehouses and
offers good heavy vehicle access, facilitated by multiple entry points along two street
frontages. We note that the potential risks are party mitigated by the stronger occupier
market conditions in the South East Melbourne market with existing vacant stock tracking
at historic average levels.
Similarly, we see potential risk at 82 Taryn Drive, Epping (VIC), located in the
oversupplied Melbourne North market, which has the highest overall vacancy (430,000
sqm) of all the Melbourne industrial markets, according to Knight Frank. The property has
a WALE of 1.8 years and the major tenant Stanley Black and Decker has notified PLG of
its intention to vacate in May 2018. Despite the challenging market backdrop, we note that
the property is relatively modern (built in 2008) and offers a high clearance distribution
12.6%16.3% 15.3%
9.0%
46.8%
0%
10%
20%
30%
40%
50%
60%
70%
CY16 CY17 CY18 CY19 CY20+ 0.1
1.1
2.1
3.1
4.1
5.1
6.1
7.1
8.1
9.1
GPT MGR GOZ IDR TIX DXS Propertylink ABP

15 September 2016
Propertylink Group
(PLG.AX / PLG AU) 28
warehouse with direct access to the Hume Freeway. The site is suitable for a range of
users and is located in the established suburb of Epping and is in close proximity to the
new Melbourne Markets.
Figure 44: PLG - major vacancies Figure 45: PLG - upcoming lease expiries
Source: Company data Source: Company data
Development risk
There are typically higher risks associated with development activities than holding
developed assets. The risks faced by PLG in relation to existing or future development
projects include construction delays (which may result in a loss of rent), and development
costs may be materially greater than expected.
Following completion of development works, PLG may also be exposed to residual
defects, which although are mitigated by certain contractual protections and obligations or
third parties to rectify defects, the Group remains exposed to potential losses
We note that PLG's only development project is at 122 Newton Rd, Wetherill Park, which
involves a speculative development of a relatively minor (8,914 sqm) facility at the rear of
the existing property. PLG anticipates the construction to commence in August 2016 with
practical completion in February 2017 and is expected to cost $9.6m. Importantly, the
property is located in the established Wetherill Park market in Sydney's South East and
should benefit from relatively strong occupier demand fundamentals.
0%
20%
40%
60%
80%
100%
120%
122
New
ton
Rd,
Wet
heril
l Par
k
36-5
2 N
atio
nal B
lvd,
Cam
pbel
lfiel
d
571
Mou
nt D
errim
ut R
d,D
errim
ut
1 O
rielto
n R
d, S
mea
ton
Gra
nge
848
Bou
ndar
y R
d,R
ichl
ands
57-1
01 B
alha
m R
d,A
rche
rfie
ld
44 M
anda
rin S
t,V
illaw
ood
50-5
2 A
irds
Rd,
Min
to
13 B
ound
ary
Rd,
Nor
thm
ead
Gun
dah
& B
eaum
ont R
d,M
t Kur
ing-
Gai
Vac
ancy
0.0
0.2
0.4
0.6
0.8
1.0
1.2
1.4
1 O
rielto
n R
d, S
mea
ton
Gra
nge
8 S
ylva
nia
Way
, Lis
arow
39-4
1 M
cDow
ell S
t,W
elsh
pool
144-
156
McC
redi
e R
d,S
mith
field
17-1
9 Le
ader
ship
Way
,W
anga
ra
71-9
3 W
hits
ide
Rd
& 7
4-78
Mai
n R
d, C
layt
on
7 M
odal
Cre
scen
t,C
anni
ng V
ale
Yea
rs

15 September 2016
Propertylink Group
(PLG.AX / PLG AU) 29
Investment portfolio Portfolio summary
PLG owns a diversified portfolio of 33 industrial properties located across Sydney,
Melbourne, Brisbane and Perth. The Portfolio was independently valued at $685m as at
30 June 2016, has an occupancy rate of 95.0%, a weighted average lease expiry (WALE)
of 3.6 years (by income and by GLA) and a diversified income profile with approximately
176 tenants with no single tenant contributing more than 5% of lease income.
Figure 46: PLG balance sheet portfolio
Source: Company data
Balance Sheet Properties State Valuation $/sqm% of
portfolioOccupancy
Initial
YieldCap Rate
GLA
(sqm)
WALE
(yrs)
Acquisition
dateAcquired from
15 Talavera Rd, Macquarie Park NSW 62.0 4,922 9.1% 100.0% 7.36% 7.25% 12,597 3.9 Jun-2015 AMP
7 Gundah & 22 Beaumont Rd, Mt Kuring-Gai NSW 56.2 1,651 8.2% 98.0% 7.63% 7.25% 34,037 1.8 Jan-2015 Industrial Parks of Australia
16 Rodborough Rd, Frenchs Forest NSW 29.7 3,532 4.3% 100.0% 7.42% 7.00% 8,410 6.5 Jun-2015 Equity Commonw ealth
50-52 Airds Rd, Minto NSW 27.2 1,160 4.0% 91.9% 8.45% 8.00% 23,452 3.6 Jul-2014 JSKM Pty Ltd
10-12 Pike St, Rydelmere NSW 21.9 1,094 3.2% 100.0% 9.68% 8.50% 20,022 2.0 Jun-2014 Abacus
144-156 McCredie Rd, Smithfield NSW 19.7 997 2.9% 100.0% 9.55% 8.50% 19,765 0.6 Oct-2014 Valad
44 Mandarin St, Villaw ood NSW 18.0 887 2.6% 91.8% 7.98% 9.75% 20,294 3.0 Jun-2015 Equity Commonw ealth
164-166 New ton Rd, Wetherill Park NSW 17.3 1,459 2.5% 100.0% 8.00% 7.50% 11,854 2.1 Oct-2014 Valad
122 New ton Rd, Wetherill Park NSW 16.3 1,695 2.4% 0.0% 0.00% 7.00% 9,614 0.0 May-2015 Metcash
4 Brunker Rd, Chullora NSW 11.0 1,711 1.6% 100.0% 6.87% 7.25% 6,428 2.7 Jun-2014 Abacus ADIF II
22 Rodborough Rd, Frenchs Forest NSW 10.5 2,602 1.5% 100.0% 8.65% 7.50% 4,035 6.7 Jun-2015 Equity Commonw ealth
13 Boundary Rd, Northmead NSW 10.2 1,802 1.5% 95.0% 7.30% 7.00% 5,660 2.5 Jun-2014 Abacus ADIF II
1 Orielton Rd, Smeaton Grange NSW 8.2 1,066 1.2% 30.6% 1.41% 7.50% 7,689 1.2 Jun-2014 Abacus
8 Sylvania Way, Lisarow NSW 7.4 745 1.1% 100.0% 13.01% 10.00% 9,933 0.9 Jun-2014 Abacus
Melbourne Markets, 315 Cooper St, Epping VIC 92.0 1,227 13.4% 100.0% 8.55% 7.50% 74,968 5.5 Jul-2014 Hansen Yuncken
71-93 Whitside & 74-78 Main Rd, Clayton VIC 24.0 851 3.5% 100.0% 10.07% 8.50% 28,195 0.5 Jun-2015 Equity Commonw ealth
144-168 National Blvd, Campbellf ield VIC 22.8 1,372 3.3% 100.0% 6.65% 6.50% 16,620 8.5 Jun-2014 Abacus ADIF II
18-24 Ricketts Rd, Mount Waverley VIC 16.9 1,895 2.5% 100.0% 8.19% 7.75% 8,916 2.4 Jul-2014 AMP
1-5 Lake Dr, Dingley VIC 16.4 941 2.4% 100.0% 8.84% 7.50% 17,431 2.0 Jun-2014 Abacus ADIF II
127-161 Cherry Lane, Laverton North VIC 14.0 546 2.0% 100.0% 11.04% 10.00% 25,639 6.3 Jun-2015 Equity Commonw ealth
82 Taryn Dr, Epping VIC 12.3 1,161 1.8% 100.0% 8.62% 7.00% 10,590 1.8 Jul-2014 AMP
25 Strezlecki Ave, Sunshine West VIC 10.7 1,022 1.6% 100.0% 7.62% 7.50% 10,467 3.5 Feb-2014 Charter Hall
63 Woodlands Dr, Braeside VIC 9.9 1,303 1.4% 100.0% 6.89% 6.50% 7,598 7.9 Jun-2014 Abacus ADIF II
36-52 National Blvd, Campbellf ield VIC 9.3 795 1.4% 0.0% 0.00% 7.50% 11,705 0.0 Jun-2014 Abacus
571 Mount Derrimut Rd, Derrimut VIC 7.7 925 1.1% 0.0% 0.00% 7.25% 8,321 0.0 Jun-2014 Abacus ADIF II
163 Vilking Dr, Wacol QLD 46.8 1,809 6.8% 100.0% 6.49% 6.50% 25,869 6.2 Feb-2014 Dexus
57-101 Balham Rd, Archerfield QLD 27.7 1,138 4.0% 77.8% 7.21% 8.50% 24,335 3.1 Feb-2014 Dexus
848 Boundary Rd, Richlands QLD 13.7 1,395 2.0% 69.4% 5.13% 8.25% 9,818 1.9 Oct-2014 Valad
9-13 Titanium Court, Crestmead QLD 6.9 1,066 1.0% 100.0% 7.83% 7.50% 6,472 4.4 Jun-2015 Equity Commonw ealth
37-53 Eurora St, Kingston QLD 7.2 1,181 1.1% 100.0% 8.97% 8.00% 6,096 2.1 Oct-2014 Valad
7 Modal Crescent, Canning Vale WA 16.4 1,075 2.4% 100.0% 9.25% 8.00% 15,251 0.3 Jun-2015 Equity Commonw ealth
17-19 Leadership Way, Wangara WA 7.0 1,293 1.0% 100.0% 9.66% 8.25% 5,415 0.6 Jun-2015 Equity Commonw ealth
39-41 McDow ell St, Welshpool WA 8.0 1,155 1.2% 100.0% 9.10% 8.00% 6,925 0.7 n.a n.a
Total / weighted average 685.0 132.9 100% 95.0% 7.94% 7.65% (1) 515,403 3.6

15 September 2016
Propertylink Group
(PLG.AX / PLG AU) 30
Figure 47: Portfolio summary (as at June 2016)
Source: Company data
■ Rental structure. Approximately 90% of lease income from properties within the
Portfolio is subject to annual fixed or CPI-linked rent reviews. Provisions for market rent
reviews exist at intervals within all leases and predominantly contain ratchet provisions.
Figure 48: Rental review composition (as at 30 June 2016)
Source: Company data
■ Lease expiries and tenant retention. PLG's portfolio has relatively high lease expiry
risk relative to peers with ~44% of leases expiring by CY18. We note however, that
PLG's tenant retention rate for all expiring leases for the 12 months ending 30 June
2016 was 83.9% and the retention rate for the Portfolio on a standalone basis was
63.2%, which fares well relative to peers.
Number of properties 33
Independent valuation (A$m) $685.0
Gross lettable area (sqm) 514,454
Occupancy by GLA 95.0%
WALE by income (years) 3.6
WALE by GLA (years) 3.6
Weighted Average Capitalisation Rate 7.65%
Passing net rental income (p.a.) $52,892,279
Fully leased passing net rental income (p.a.) $56,207,488
5%
24%
34%
2%1%
34%
CPI 3%-3.5% 3.5%-4.0% <3% >4% CPI (Cap + Collar)

15 September 2016
Propertylink Group
(PLG.AX / PLG AU) 31
Figure 49: PLG portfolio lease expiry profile
Source: Company data
■ Major tenants. PLG has about 176 tenants across its portfolio with no single tenant
contributing more than 5% of lease income. Figure 50 illustrates PLG's ten major
tenancies which represent about 30% of total portfolio income.
Figure 50: PLG Major Tenants
Source: Company data
■ Geographic composition. The PLG portfolio is diversified across four States and
Territories with the strongest weighting to New South Wales (46%) and Victoria (34%).
Notably the portfolio has a limited exposure to the challenged resources-based
markets of Brisbane (15%) and Perth (5%).
■ Asset diversification. The Portfolio is also diversified across asset classes, with
industrial, logistics and multi-let unit estates properties constituting 81% (by asset
value) of the Portfolio as at 30 June 2016.
12.6%16.3% 15.3%
9.0%
46.8%
0%
10%
20%
30%
40%
50%
60%
70%
CY16 CY17 CY18 CY19 CY20+
0.0% 1.0% 2.0% 3.0% 4.0% 5.0% 6.0%
Stanley Black & Decker
Supply Linq
Cotton On
Unicharm Australasia
Pacific Brands
VIP Plastics
The Trust Company
Virgin Active
WACO Kwikform
Corning Cable Systems

15 September 2016
Propertylink Group
(PLG.AX / PLG AU) 32
Figure 51: Geographic diversification
as at 30 June 2016
Figure 52: Asset diversification
as at 30 June 2016
Source: Company data Source: Company data
The table below summarises the geographic composition of the industrial portfolios for
PLG and A-REIT peers.
Figure 53: A-REIT industrial portfolio geographic composition by state PLG IDR TIX GOZ ABP DXS GPT MGR Average
NSW 46% 35% 44% 14% 20% 57% 66% 85% 46%
VIC 34% 21% 25% 45% 33% 36% 22% 7% 27%
QLD 15% 41% 19% 20% 13% 5% 12% n.a 16%
WA 5% 0% 9% 12% n.a n.a n.a n.a 3%
SA n.a 3% 1% 9% 17% 2% n.a n.a 5%
ACT n.a 0% 2% 0% 17% n.a n.a n.a 3%
Other n.a n.a n.a 0% n.a n.a n.a 8% 1%
Source: Company data, Credit Suisse estimates
Portfolio metrics and comps
■ Portfolio value. PLG's $685m balance sheet portfolio places it above Industria (IDR)
and Abacus (ABP) but below other A-REIT peers.
■ Portfolio cap rates. PLG's industrial portfolio WACR of 7.65% is slightly above the A-
REIT average of 7.30% and is the second highest across the sector after ABP.
■ Portfolio Weighted Average Lease Expiry (WALE). The PLG portfolio has a WALE
of 3.6 years, which is the second lowest in the sector after ABP and below the A-REIT
average of 5.6 years.
■ Occupancy. PLG's portfolio is 95% occupied as at 30 June 2016, which is in line with
the A-REIT average as at June 2016 (Figure 58).
■ Portfolio lease expiry. PLG has a relatively high level of upcoming expiries (31.6%)
over FY17 and FY18 relative to A-REIT peers which have ~20% of leases expiring on
average over this period (Figure 59).
Sydney46%
Melbourne34%
Brisbane15%
Perth5%
Unit Estate21%
Business Park17%
Logistics31%
Industrial29%
Development2%

15 September 2016
Propertylink Group
(PLG.AX / PLG AU) 33
Figure 54: A-REIT Industrial portfolio value ($m) Figure 55: A-REIT Industrial portfolio value ($/sqm)
Source: Company data, Credit Suisse estimates Source: Company data, Credit Suisse estimates
Figure 56: A-REIT industrial portfolio WACR Figure 57: A-REIT Industrial Portfolio WALE
Source: Company data, Credit Suisse estimates Source: Company data, Credit Suisse estimates
Figure 58: A-REIT industrial portfolio – Vacancy Figure 59: Portfolio lease expiry (FY17 + FY18)
Source: Company data Source: Company data. Note: Reflects CY for PLG
0
200
400
600
800
1,000
1,200
1,400
1,600
DXS GPT GOZ TIX MGR Propertylink IDR ABP0
500
1,000
1,500
2,000
2,500
3,000
IDR GPT MGR DXS GOZ Propertylink TIX ABP
6.0%
6.5%
7.0%
7.5%
8.0%
8.5%
9.0%
ABP Propertylink IDR TIX DXS GOZ GPT MGR
0.1
1.1
2.1
3.1
4.1
5.1
6.1
7.1
8.1
9.1
GPT MGR GOZ IDR TIX DXS Propertylink ABP
0.0%
2.0%
4.0%
6.0%
8.0%
10.0%
12.0%
DXS GPT ABP Propertylink IDR TIX MGR GOZ
0.0%
5.0%
10.0%
15.0%
20.0%
25.0%
30.0%
35.0%
Propertylink GPT DXS ABP TIX MGR IDR

15 September 2016
Propertylink Group
(PLG.AX / PLG AU) 34
External Funds
Business overview
PLG’s investment and asset management business focuses on institutional, investment
grade Australian property, primarily in the industrial, logistics and commercial office
sectors.
PLG currently manages 10 external funds (including PEP) on behalf of global institutional
investors, including banks, REITs, pension funds, insurance companies, large corporates,
family offices and investment advisors. Existing investors include Goldman Sachs,
Grosvenor Group, The Norinchukin Bank, Townsend Group and Fosun.
PLG co-invests with its funds investors providing an alignment of interests and an ability to
share in the risks and returns offered by the funds. The total value of PLG's drawn equity
co-investments as at 30 June 2016 was $23.9m ($41.6m including PEP).
As at 30 June 2016, the investment and asset management business had total AUM of
over $1.55bn ($1.69bn including PEP), of which approximately $873m ($1.0bn including
PEP) is managed through External funds.
Figure 60: Overview of PLG's External funds
As at June 2016 – excludes PEP
Source: Company data

15 September 2016
Propertylink Group
(PLG.AX / PLG AU) 35
Figure 61: PLG – summary of External funds
Source: Company data
A brief history of the industrial and logistics External funds is provided below:
■ PAIP II: Following the closure of the investment of new real estate assets in PAIP, a
new fund, PLG Australian Industrial Partnership II (“PAIP II”), was established in 2015.
PAIP II follows a similar investment model to the model PAIP had when it was
established, targeting a portfolio of core-plus and value-add industrial and logistics
assets. PAIP II has a target AUM of $700m to $900m. It has a mandate to pursue core-
plus and value-add industrial and logistics investment opportunities across Australia’s
capital cities. As at 30 June 2016, PAIP II had $127m of equity commitments and
$166.8m of assets.
■ SEDCO Mandate: Established in 2015 with a mandate to target a portfolio of core
industrial and logistics assets, although more recently the mandate has been expanded
to enable PLG to target value-add opportunities.
■ Confidential Mandate: Established in 2015 on behalf of an Australian-based
alternative investment manager to acquire and own a single core logistics property.
■ PLG Australian Logistics Trust (“PALT”): Established in 2013 to own two core long
lease logistics assets in Brisbane and Melbourne.
■ M&G Mandate: A management mandate for two core logistics assets in Sydney and
Melbourne. This mandate primarily covers property management services, with a small
component of strategic advisory.
■ The Gantry Investment Trust: Established in 2010 on behalf of small wholesale
investors (prior to the existing management team joining PLG). The fund holds one
asset in Fortitude Valley, Brisbane, which has a development approval to build 230
apartments.
The investment and asset management business also manages a series of commercial
office funds.
■ POP I & POP II: The PLG Office Partnership (“POP”) and PLG Office Partnership II
(“POP II”) series of funds were established in February 2015 and June 2015
respectively, as core-plus, single office asset mandates.
■ POP III: A third office fund, PLG Office Partnership III (“POP III”), opened for
investment in March 2016. Rather than having a single asset mandate, the investment
and asset management business will target total asset value of approximately $450m.
The risk spectrum for POP III is flexible, with office assets from core-plus to value-add
being considered for acquisition, should they meet the investment objectives of the
fund. As at 30 June 2016, the fund had $44.5m of equity commitments and had
successfully acquired $91.1m of assets.
Diversified
Fund PAIP II1 SEDCO
Mandate
Confidential
Mandate 2 PALT
M&G
Mandate 3
Gantry
Investment
Trust
POP POP II POP III PEP Total
Establishment 2015 2015 2015 2013 2014 2010 2014 2015 2016 2016
AUM 166.8 29 42.8 69.0 85.4 14.3 130 245.0 91.1 141.9 1015.3
Committed Equity ($m) 127.0 14.0 18.0 26.5 N/A 7.9 116.7 93.6 44.5 70.7 518.9
Target AUM ($m) 700.0-900.0 N/A 42.8 69 85.4 14.3 130 245 450 N/A 1,700+
Target IRR 14-16% 11% 13% 14% N/A N/A 15% 15% 12-14% 17% 11-16%
Review date 2020 N/A3rd
anniversaryN/A Oct-16 N/A N/A
7th
anniversary
6th
anniversary2023
1.Data excludes CHC (PAIP II) transactions
2. Mandate on behalf of an Australian-based alternative investment manager
3. The M&G mandate is expected to be w ound up during FY17
Industrial and Logistics Commercial Office

15 September 2016
Propertylink Group
(PLG.AX / PLG AU) 36
Since listing PLG has made further progress in meeting its target to grow external FUM to
above $1.5bn in FY17.
■ PEP: In August 2016, PLG announced the acquisition of a $141.93 million portfolio of
from Denison Funds Management. The portfolio of nine industrial, commercial and
retail assets will be managed under a new external fund, Propertylink Enhanced
Partnership (PEP), in which Goldman and Sachs and PLG are the investors, with PLG
contributing 25% of the equity ($17.7m).
■ PAIP II: PLG settled on the acquisition of an industrial portfolio for $135m from Charter
Hall. The acquisitions was made on behalf of PLG's PAIP II fund in 1H17.
Historical performance of External funds
Prior to the disposal of assets in a fund, investors in the fund typically assess PLG’s
performance by referencing the Internal Rate of Return generated by the fund. PLG has
calculated that the funds it manages have achieved a combined IRR of 28.5% since
establishment.
Performance fees payable to PLG are based on the levels of return generated for
investors upon the sale of fund assets as compared to benchmark return hurdles. As such,
IRR calculations are an indicator as to whether PLG’s performance in managing the
relevant assets may earn PLG additional performance fees, although whether
performance fees are ultimately paid will depend on the valuation ultimately realised in the
particular External fund relative to the return hurdles.
Figure 62: PLG external historical performance*
N.B * Combined * Combined IRR is calculated as the weighted average (by total equity) IRR from POP, POP II, PALT, PAIP and the Confidential Mandate. Source: Company data.
Management fees
The investment and asset management business principally generates fee revenue from
the management of the External funds. Management fees vary from fund to fund, and are
based on the nature and mandate of the fund. Figure 63 provides a summary of the types
of fees that are generated from the External funds:
26.9%
30.9%
28.5%
24.0%
25.0%
26.0%
27.0%
28.0%
29.0%
30.0%
31.0%
32.0%
Industrial and Logistics Office Combined

15 September 2016
Propertylink Group
(PLG.AX / PLG AU) 37
Figure 63: PLG—External fund fee schedule
Source: Company data
Co-investments in External funds
PLG generally aims to hold a 5% to 25% interest in each of the External funds it manages.
It may initially take a larger co-investment stake upfront to establish a new fund before
engaging new or existing investors, allowing PLG to reduce its co-investment stake.
PLG had total committed co-investments in External funds of $26m as at 30 June 2016, of
which $23.9m has been drawn.
We note that in August 2016, PLG committed an additional $17.7m of equity as part of the
acquisition of the Denison portfolio ($142m) and the establishment of PEP. The $17.7m of
additional equity represents 68% of the $26m targeted by PLG to be invested into existing
funds during FY17.
Figure 64: PLG – co-investment summary
Source: Company data
External fund investors
The investment and asset management business is supported by global institutional
investors. External funds Investors include global institutional investors in North America,
Europe, Middle East, Asia and Australia. A summary of the key External funds Investors is
provided in Figure 65.
Type Description Typical Range
Acquisition feesPayable when Propertylink acquires property on behalf of the External Fund. A one-off
fee paid on settlement of an asset acquisition.0.45% - 0.50% of GAV p.a.
Base feesAn ongoing base management fee. Typically paid on a quarterly basis in arrears in
March, June, September and December.0.45% - 0.50% of GAV p.a.
Performance fees
A performance fee payable to Propertylink, and based on the level of return Propertylink
has generated for the investors in the External Funds. Typically paid on the return of
capital to External Funds Investors post an asset sale (or sales).
20.0% - 40.0% of fund
outperformance above hurdles
of 10.0% - 15.0%
Property management feesA fee payable for the day to day management of the properties in the External Fund. Paid
monthly in arrears.
2.0% - 2.5% of gross income
p.a.
Leasing fees
Payable when Propertylink signs a new tenant to the property or renews a lease, and
may be based on the length of the tenancy. Paid on the successful execution of a new
lease.
Market standard rates
Project management feesPayable where Propertylink oversees projects undertaken on properties (including
developments and improvements). Paid as invoices are paid in relation to a project.Market standard rates
Diversified
Fund PAIP II1 SEDCO
Mandate
Confidential
Mandate 2 PALT
M&G
Mandate 3
Gantry
Investment
Trust
POP POP II POP III PEP Total
AUM 166.8 29.0 42.8 69.0 85.4 14.3 130 245 91.1 141.9 1015.3
Propertylink committed co-
investment ($m)5.0 1.0 1.8 2.7 - - 5.8 4.7 5.0 17.7 43.7
Propertylink drawn co-investment 3.2 0.9 2.2 2.8 - - 6.5 6.3 2.0 17.7 41.6
Propertylink co-investment (%) 3.7% 6.4% 12.2% 10.6% - - 5.6% 6.7% 4.8% 25% 3.7% - 25%
1.Data excludes CHC (PAIP II) transactions
2. Mandate on behalf of an Australian-based alternative investment manager
3. The M&G mandate is expected to be w ound up during FY17
Industrial and Logistics Commercial Office

15 September 2016
Propertylink Group
(PLG.AX / PLG AU) 38
Figure 65: PLG—fund investor summary
Source: Company data
Name Indicative AUM Overview
The Norinchukin Bank US$830bn
The Norinchukin Bank is a long-standing Japanese financial institution established by
Japan’s agricultural cooperatives. It is a leading institutional investor, with total assets
of approximately US$830 billion invested globally (as at September 2015). The
Norinchukin Bank is a key investor in PAIP II.
Fosun RMB 63.4bn
Fosun International Limited is a company incorporated under the laws of Hong Kong
and its shares are listed on the main board of The Stock Exchange of Hong Kong
Limited. The principal businesses of the Fosun Group are (i) integrated finance
(wealth) which includes four key segments: insurance, investment, wealth
management and internet finance; and (ii) industrial operations which include five key
segments: health, happiness, steel, property development and sales and resources.
Total assets under management of the Fosun Group for the year ended 31 December
2015 is approximately RMB63.4 billion.
Goldman Sachs US$1,252bn
Goldman Sachs is a leading global investment banking, securities and investment
management firm that provides a wide range of financial services to a substantial and
diversified client base that includes corporations, financial institutions, governments
and individuals.
Grosvenor Group US$17.2bn
Grosvenor Group is a privately owned property group, operating across three
continents. Grosvenor has previously partnered with Propertylink to invest in PAIP, and
has also invested in POP II and III through its Indirect Investments arm.
SEDCO US$3.9bn
SEDCO, the Saudi Economic and Development Company is a leading Sharia
compliant organisation, responsible for a spectrum of operating companies, real
estate investments, and public and private investments globally. By creating what is
believed to be the first Sharia-compliant investment structure in Australia, Propertylink
has been able to benefit from SEDCO’s investment
M&G Investments US$360bn
M&G Investments is a leading global retail and institutional fund manager, with
approximately US$360 billion assets under management across equities, multiasset,
fixed income, real estate and cash.
Townsend Group US$13.6bnThe Townsend Group is a global investment platform, serving a diverse group of
institutional investors.
Al Salam Bank- Bahrain US$4.5bn1 Al Salam Bank-Bahrain is a diversified Islamic Bank, investing across real estate and
corporations globally.1 Total assets

15 September 2016
Propertylink Group
(PLG.AX / PLG AU) 39
Australian Industrial Markets Propertylink geographic exposures
The Propertylink balance sheet portfolio is diversified across 4 States and Territories with
the strongest weighting to Sydney (46%) & Melbourne (34%). Notably the Fund has limited
exposure to the challenged resource-based markets of Brisbane (15%) & Perth (5%).
Sydney
Demand conditions in the broader Sydney industrial market remain robust supported by
strong construction activity in the residential and infrastructure sector. In 2015 annual
gross take-up reached ~860k sqm well above the ten-year average of ~607k sqm. Gross
take-up volumes continue to be driven by leasing activity in the new build market, with pre-
lease and design and construct deals accounting for a majority of leasing activity. Going
forward, demand for industrial space is expected to remain positive with ongoing economic
growth in New South Wales as well considerable investment in the infrastructure sector
set to support occupier activity.
Figure 66: Industrial demand (gross take-up) Figure 67: Industrial supply (completions)
Source: JLL Research Source: JLL Research
Over the past three years, the Sydney market experienced only limited levels of new
supply, with ~350k sqm being completed in 2015, compared to the 20-year average of
~500k sqm. Supported by high levels of pre-commitments, overall development activity is
expected to rise and see stronger levels of new industrial stock to enter the market in the
medium term.
Rental market conditions remain generally positive but have been mixed across individual
sub-markets over the past 12 months. In particularly Sydney's South and Inner West
precincts have experienced tighter leasing conditions as the ongoing trend of rezoning and
residential conversions is reducing the stock base and hence putting upward pressure on
rents. This trend is expected to continue and should support rental growth going forward in
these areas.
-
100,000
200,000
300,000
400,000
500,000
600,000
700,000
800,000
900,000
1,000,000
2007 2008 2009 2010 2011 2012 2013 2014 2015 2016 YTD
Sq
ua
re m
ete
r
-
100,000
200,000
300,000
400,000
500,000
600,000
700,000
800,000
900,000
1,000,000
1,100,000
2007 2008 2009 2010 2011 2012 2013 2014 2015 2016e*
Squ
are
met
er
*Under construction or complete
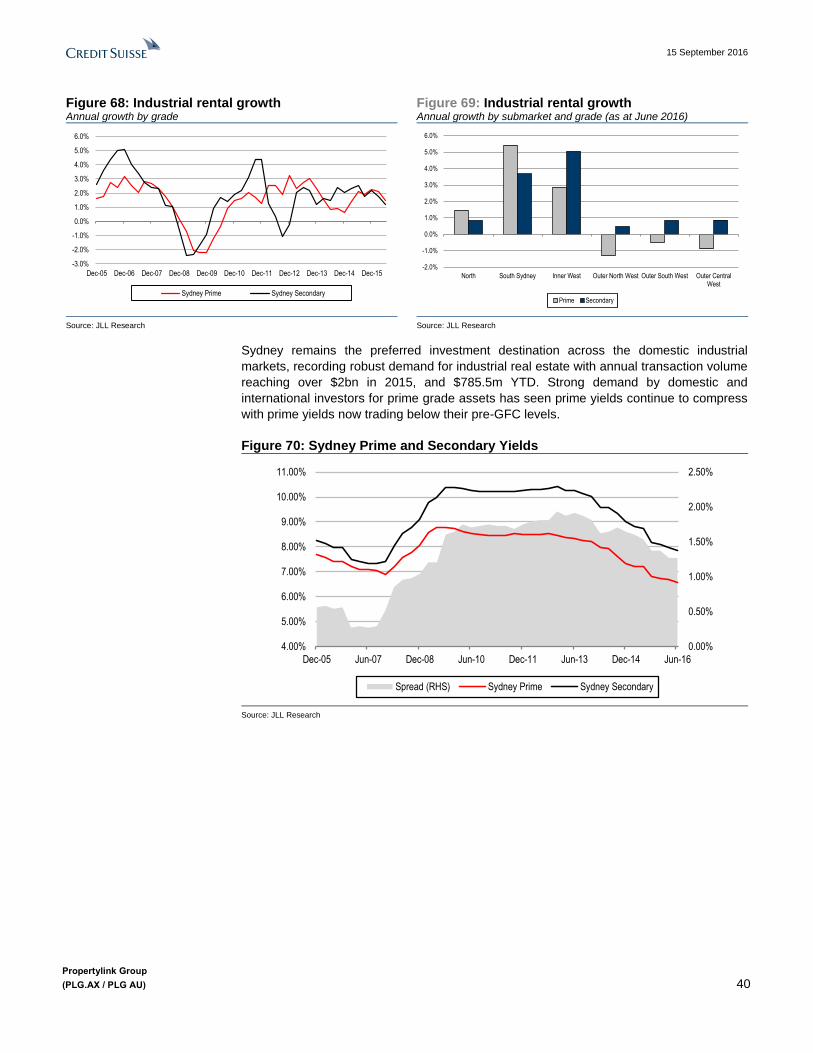
15 September 2016
Propertylink Group
(PLG.AX / PLG AU) 40
Figure 68: Industrial rental growth Annual growth by grade
Figure 69: Industrial rental growth Annual growth by submarket and grade (as at June 2016)
Source: JLL Research Source: JLL Research
Sydney remains the preferred investment destination across the domestic industrial
markets, recording robust demand for industrial real estate with annual transaction volume
reaching over $2bn in 2015, and $785.5m YTD. Strong demand by domestic and
international investors for prime grade assets has seen prime yields continue to compress
with prime yields now trading below their pre-GFC levels.
Figure 70: Sydney Prime and Secondary Yields
Source: JLL Research
-3.0%
-2.0%
-1.0%
0.0%
1.0%
2.0%
3.0%
4.0%
5.0%
6.0%
Dec-05 Dec-06 Dec-07 Dec-08 Dec-09 Dec-10 Dec-11 Dec-12 Dec-13 Dec-14 Dec-15
Sydney Prime Sydney Secondary
-2.0%
-1.0%
0.0%
1.0%
2.0%
3.0%
4.0%
5.0%
6.0%
North South Sydney Inner West Outer North West Outer South West Outer CentralWest
Prime Secondary
0.00%
0.50%
1.00%
1.50%
2.00%
2.50%
4.00%
5.00%
6.00%
7.00%
8.00%
9.00%
10.00%
11.00%
Dec-05 Jun-07 Dec-08 Jun-10 Dec-11 Jun-13 Dec-14 Jun-16
Spread (RHS) Sydney Prime Sydney Secondary

15 September 2016
Propertylink Group
(PLG.AX / PLG AU) 41
Figure 71: Sydney industrial transaction activity and yields
Source: Colliers Research
Key submarkets for Propertylink
Sydney North
The Sydney North precinct continues to be characterised by a lack of stock for both
occupiers and investors. As a result the market has experienced yield compression as well
as positive rental growth in both the Prime and Secondary markets. However, landlords
remain reluctant to offer longer term leases as they await the outcome of major rezoning
plans. This has pushed occupiers further north, benefitting leasing activity in markets such
Mount Kuring-Gai.
Sydney South West
The south western corridor is one of Sydney's major growth areas and as such is
experiencing strong levels of industrial leasing activity. The precinct continues to benefit
from tenant migration out of the Inner West and South Sydney precincts, where ongoing
residential rezoning has caused a lack of available industrial space.
The outlook for the South West remains attractive. The precinct is set to cater for a new
terminal at Port Botany and should also benefit from the development of the Moorebank
Intermodal, Australia's largest intermodal freight precinct. Furthermore, the precinct is also
expected to experience significant investment into road infrastructure, including upgrades
to the M5 and Hume Highway, which will provide improved access to the Sydney Airport,
the Port of Sydney as well as the Sydney CBD.
Melbourne
Occupier demand for warehousing and logistic space in Melbourne remains robust
supported by ongoing strong activity at the Port of Melbourne and a solid residential
construction market. In 2015 Melbourne recorded industrial gross take-up of ~700k sqm
well above the ten-year average of ~580k sqm and the highest annual levels since 2006.
The most active precincts were the South East and West where almost half of all leasing
activity was recorded.

15 September 2016
Propertylink Group
(PLG.AX / PLG AU) 42
Figure 72: Industrial demand (gross take-up) Figure 73: Industrial supply (completions)
Source: JLL Research Source: JLL Research
Post the Global Financial Crisis, industrial project completion levels were limited but have
picked up considerably since 2014. While still remaining below the ten-year average in
2015, Melbourne recorded the largest amount of stock completions across Australia
adding about 450k sqm to total stock levels. The outlook for supply remains strong with a
large pipeline of new projects planned and under construction. However, speculative
development remains limited with the majority of new projects securing pre-commitments
prior to construction start.
Figure 74: Industrial rental growth Annual growth by grade
Figure 75: Industrial rental growth Annual growth by submarket and grade (as at June 2016)
Source: JLL Research Source: JLL Research
Despite solid occupier demand and take-up levels, prime rental growth across Melbourne
remains muted due to significant competition amongst developers and landlords of
existing premises to secure tenants. However, with limited stock available, the secondary
market has experienced solid rental growth over the past 12 months across most
precincts.
-
100,000
200,000
300,000
400,000
500,000
600,000
700,000
800,000
2007 2008 2009 2010 2011 2012 2013 2014 2015 2016 YTD
Sq
ua
re m
ete
r
-
100,000
200,000
300,000
400,000
500,000
600,000
700,000
800,000
900,000
1,000,000
1,100,000
2007 2008 2009 2010 2011 2012 2013 2014 2015 2016e*
Squ
are
met
er
*Under construction or complete
-10.0%
-5.0%
0.0%
5.0%
10.0%
15.0%
Dec-05 Dec-06 Dec-07 Dec-08 Dec-09 Dec-10 Dec-11 Dec-12 Dec-13 Dec-14 Dec-15
Melbourne Prime Melbounre Secondary
0.0%
2.0%
4.0%
6.0%
8.0%
10.0%
12.0%
North West South East City Fringe
Prime Secondary

15 September 2016
Propertylink Group
(PLG.AX / PLG AU) 43
Figure 76: Melbourne Prime vs Secondary Yields
Mind the gap
Source: JLL Research
The Melbourne industrial market continues to be characterised by strong investment
demand by both domestic as well as offshore capital with transaction volumes reaching a
record $1.5bn in 2015 and $447.9m YTD. The large volume of capital searching for
investment grade assets has continued to drive capital value appreciation with prime
yields now trading below pre-GFC levels.
Key submarkets for Propertylink
Melbourne West
The Melbourne West precinct remains the preferred location by major logistic companies
given its proximity to strategic transport infrastructure. Despite strong leasing activity,
elevated levels of supply have led to an increase in vacancy levels, which in turn has put
downward pressure on rents. However, land values have started to pick up over the past
18 months after stable to negative growth for the previous two-and-a-half years, which
indicates the level of land supply is slowing. Going forward key infrastructure projects such
as the Western distributor should support ongoing demand by the transport, distribution
and logistics sector in the Melbourne West.
Melbourne North
Similar to Melbourne West, the North precinct has also experienced significant levels of
supply. Project completions in Melbourne North accounted for almost half of all new supply
entering Melbourne over the past 12 months, which has limited the upside for rental growth.
Melbourne's North is expected to be the first market to be affected by the upcoming
closures in the car manufacturing industry with Ford being the first manufacturer to cease
production in 2016. However, with its proximity to the Melbourne Airport the precinct
remains an attractive location for exporting industries. As such, Melbourne North has
already experienced a shift in demand, with the decline in the automotive industry being
partly offset by rising demand by sectors such as food manufacturing.
Brisbane The Queensland economy continues to be impacted by the slowdown in the mining sector
but strong residential construction and growing trade activity in the Port of Brisbane
continue to support the local transport and logistics sector. Industrial gross take-up in 2015
reached ~464k sqm, the highest level since 2012. However, tenant movement activity over
the past two quarters was soft as tenants opted to extend existing leases rather than
committing to new premises as a consequence of landlords offering significant incentives.
0.00%
0.50%
1.00%
1.50%
2.00%
2.50%
4.00%
5.00%
6.00%
7.00%
8.00%
9.00%
10.00%
11.00%
Dec-05 Jun-07 Dec-08 Jun-10 Dec-11 Jun-13 Dec-14 Jun-16
Spread (RHS) Melbourne Prime Melbourne Secondary

15 September 2016
Propertylink Group
(PLG.AX / PLG AU) 44
Industrial completions in 2015 reached about 354k sqm, which was softer than compared
to 2014 but in line with the ten-year average. With limited stock under construction or in
the planning stage, supply levels in the medium term are expected to be significantly lower
compared to the previous years.
Figure 77: Industrial demand (gross take-up) Figure 78: Industrial supply (completions)
Source: JLL Research Source: JLL Research
Due to subdued leasing conditions and fierce competition amongst developers and
landlords to secure or keep tenants, rental conditions in both the Prime and Secondary
markets remain challenging. Prime and secondary stock in the Southern precinct was the
most affected, experiencing the biggest annual declines in rental growth.
Figure 79: Industrial rental growth Annual growth by grade
Figure 80: Industrial rental growth Annual growth by submarket and grade (as at June 2016)
Source: JLL Research Source: JLL Research
Despite the challenging leasing conditions, investor demand for industrial assets remains
robust, with Brisbane recording transaction volumes of $854m in 2015. Strong capital
inflows to the sector and a lack of investment grade product have led to continued yield
compression across the Brisbane industrial precincts.
-
100,000
200,000
300,000
400,000
500,000
600,000
700,000
2007 2008 2009 2010 2011 2012 2013 2014 2015 2016 YTD
Sq
ua
re m
ete
r
-
100,000
200,000
300,000
400,000
500,000
600,000
700,000
2007 2008 2009 2010 2011 2012 2013 2014 2015 2016e*
Squ
are
met
er
*Under construction or complete
-10.0%
-5.0%
0.0%
5.0%
10.0%
15.0%
20.0%
Dec-05 Jun-07 Dec-08 Jun-10 Dec-11 Jun-13 Dec-14 Jun-16
Brisbane Prime Brisbane Secondary
-3.0%
-2.5%
-2.0%
-1.5%
-1.0%
-0.5%
0.0%
0.5%
Northern Southern Trade Coast
Prime Secondary

15 September 2016
Propertylink Group
(PLG.AX / PLG AU) 45
Figure 81: Brisbane Prime and Secondary Yields
Source: JLL Research
Southern precinct
While the Southern precinct continues to record the strongest level of leasing activity in the
Brisbane market it was also the most active one in terms of new supply, which in turn has
put pressure on rental growth. Going forward the precinct is set to benefit from Government
investment in transport infrastructure such as the widening of the Ipswich Motorway which
will further support the expansion of the Acacia Ridge freight intermodal terminal.
Perth
With the contraction in the resources market and the subsequent slowdown in economic
activity, employment and population growth, demand conditions in the Perth industrial
market remain subdued. With ongoing consolidation in the occupier market vacancy levels
continue to rise.
Figure 82: Industrial demand (gross take-up) Figure 83: Industrial supply (completions)
Source: JLL Research Source: JLL Research
The Perth Industrial market experienced limited levels of supply in 2015, however, there is
a significant pipeline scheduled to enter the market in 2016.
0.00%
0.20%
0.40%
0.60%
0.80%
1.00%
1.20%
1.40%
1.60%
1.80%
2.00%
4.00%
5.00%
6.00%
7.00%
8.00%
9.00%
10.00%
11.00%
12.00%
Dec-05 Jun-07 Dec-08 Jun-10 Dec-11 Jun-13 Dec-14 Jun-16
Spread (RHS) Brisbane Prime Brisbane Secondary
-
50,000
100,000
150,000
200,000
250,000
300,000
350,000
400,000
2007 2008 2009 2010 2011 2012 2013 2014 2015 2016 YTD
Sq
ua
re m
ete
r
-
100,000
200,000
300,000
400,000
2007 2008 2009 2010 2011 2012 2013 2014 2015 2016e*
Squ
are
met
er
*Under construction or complete

15 September 2016
Propertylink Group
(PLG.AX / PLG AU) 46
Figure 84: Industrial rental growth Annual growth by grade
Figure 85: Industrial rental growth Annual growth by submarket and grade (as at June 2016)
Source: JLL Research Source: JLL Research
In line with challenging demand conditions, industrial rents have continued to trend lower.
With occupiers having plenty of space options available, landlords have started to offer
greater levels of incentives to keep and secure tenants. Rents across all precincts have
been affected by the large amount of vacant space with soft leasing conditions expected to
prevail over the medium term.
Despite the challenging economic conditions, investment demand for industrial assets in
Perth remains robust with solid levels of transactional activity. Due to ongoing investment
demand the Perth industrial market has experienced considerable yield compression over
the past 18 months.
Figure 86: Perth Prime and Secondary Yields
Source: JLL Research
-15.0%
-10.0%
-5.0%
0.0%
5.0%
10.0%
15.0%
Sep-09 May-10 Jan-11 Sep-11 May-12 Jan-13 Sep-13 May-14 Jan-15 Sep-15 May-16
Perth Prime Perth Secondary
-6.0%
-5.0%
-4.0%
-3.0%
-2.0%
-1.0%
0.0%
North South East
Prime Secondary
0.00%
0.20%
0.40%
0.60%
0.80%
1.00%
1.20%
1.40%
1.60%
4.00%
5.00%
6.00%
7.00%
8.00%
9.00%
10.00%
11.00%
Dec-05 Jan-07 Feb-08 Mar-09 Apr-10 May-11 Jun-12 Jul-13 Aug-14 Sep-15
Spread (RHS) Perth Prime Perth Secondary

15 September 2016
Propertylink Group
(PLG.AX / PLG AU) 47
ESG
Summary
■ Disclosure: PropertyLink have very little disclosure on the ESG front, which is not
unusual among small cap companies..
■ Climate change: We highlight a possible long-term climate adaptation risk associated
with flooding in low-lying industrial areas, and with risks associated with the health,
safety and environmental liabilities of tenants, however we do not see these as
material at this stage.
■ Governance: PLG has a board well experienced in the property business and in the
process of an IPO. WE note that the 9 person board has three executive directors and
two long serving directors, including the Chairman, leaving only four non-executive
independent directors. In addition, the board is all-male. Post the IPO, as with many
small cap companies, the addition of new directors with skills in the listed space may
add to the diversity and skill-set required by the board in the future.
■ Valuation: We do not include any downside impact in our target price for ESG.
Environment
Disclosure
■ PropertyLink have very little disclosure on the ESG front, which is not unusual among
small caps. For covered companies in this sector, MSCI consider Opportunities in
Green Buildings, Health & Safety, Human Capital Development and Corporate
Governance as the most material issues. SASB view Energy management, Water and
Wastewater management, Lifecycle impacts and Climate Change Adaptation as the
material issues for the industry. We note that not being the operator of properties
PropertyLink has little exposure to above themes which relate to operations at their
properties.
Opportunities in Green Buildings
■ Given PropertyLink's business model – which focuses on industrial properties rather
than high-end developments – we see opportunities in green buildings as being limited.
Climate Change Adaptation
■ Flooding in low lying areas risk: Climate Change Adaptation risk may be relevant for
PropertyLink, as it owns primarily industrial properties and many of these tend to be
developed in low-lying areas. This is a mid-range risk, but in the case that sea levels
rise the frequency of flooding events in low lying areas will increase, which may impact
PropertyLink properties.
■ It is difficult to gauge the exposure of PropertyLink's portfolio on this front as
government flood maps often do not extend across suburban industrial areas.
However, we note that a few properties jump out at us from personal experience. 138
Viking Drive in Wacol in Queensland sits next to the Wolston Park Golf course, across
the Ipswich Motorway. The Golf course has recently been a site of flooding – being one
of the first Brisbane parks to go underwater in the 2011 floods. Scrubby Creek – which
runs close to the 37 Eurora St property in Kingston in QLD – most recently flooded in
2013. We have not run the fine comb over PropertyLink's entire portfolio, as we think
individual property exposure is unlikely to be material, with risk effectively diversified by
the number of properties in the portfolio and their wide geographic distribution.

15 September 2016
Propertylink Group
(PLG.AX / PLG AU) 48
Exposure to Industrial Liability
■ We note that were PropertyLink to have exposure to liabilities associated with property
operation or cleanup for their industrial properties this may present a very long-run risk.
PropertyLink highlight possible exposure to health and safety liability in their risk
disclosure, and although we have no disclosure on this front this may possibly extend
to issues such as cleanup liability.
■ There is a risk that liability arising from occupational health and safety matters at a
property in the Portfolio or in an External Fund may be attributable to the Group as the
landlord instead of, or as well as, the tenant. Such liability may include fines and
penalties imposed by regulatory authorities as well as claims for compensation from
injured parties, and may not be fully covered by insurance policies. Any such liabilities
may be incurred by the Group (which are not covered by insurance policies) and could
materially adversely affect the financial performance of the Group and Distributions.
■ PropertyLink's tenants undertake a mix of activities, most being light industrial. As such
we think their exposure to environmental liability through the property portfolio is likely
to be limited.
Social
Health & Safety
■ PropertyLink do not presently have significant disclosure on Health & Safety, which is
identified as an important consideration for the sector. Although this is material for
other REITs thanks to their operation of properties, this may be less material for
PropertyLink as a property owner. PropertyLink do note that they may have exposure
to the health and safety liabilities of their tenants, a risk which we cover in more detail
above.
Human Capital
■ As with health and safety, at this stage PropertyLink do not have significant disclosure
on their human capital management. We note that PropertyLink's board and senior
management ranks contain no women. PropertyLink do have a diversity policy as
outlined in section 9 of their IPO disclosure, which involves the remuneration and
nominations committee setting measurable objectives for diversity each year. Although
not covered in depth as of yet, further disclosure is promised in the annual report.
Governance
Board
■ Board size appears large: The Board has 9 directors (Figure 87). Based on our
analysis in a previous note published here, we have found board sizes of 6-8 members
for companies below $5bn market capitalisation have out-performed companies with
both smaller and larger boards over 2008-2013.
■ Board renewal and tenure: The median tenure on the Board is 5.1 years, nicely
within the 4-6 year "sweet spot" (Figure 88). We note the company has appointed one
independent director in the past five years. Two board members have 16 years' tenure.
We raise these issues as a focus if Boards lose too much corporate memory
unexpectedly when Board succession planning is not smooth.
■ Board independence: The board has three executive directors, which is unusual for
an ASX listed company. In addition its Chairman and one other non-executive director,
Mr Christopher Ryan, have 16 years tenure, which would mean we no longer consider
them independent.

15 September 2016
Propertylink Group
(PLG.AX / PLG AU) 49
■ Gender diversity: The 9 person board is all male (Figure 89). ASX guidelines call for
at least 30% female representation on Boards by 2018, which for PLG would mean
three female directors.
■ Director workload: We raise some concerns with the workload of several Board
members, which may warrant further investigation, especially now the PLG is a listed
company. We note Chris Ryan, Derek Nix and Anthony Ryan all appear to have
external executive roles in addition to their non-executive board roles at PLG. Chris
Ryan is executive director of InvestorLink Group, but we note his M&A and IPO
experience would have been invaluable for PLG. Derek Nix is Managing Director and
Principal of Nix Anderson, a construction management and advisory firm. Anthony
Ryan is a real estate consultant. We count a chairmanship as equivalent to two
appointments due to the higher workload involved (Figure 90 ).
■ Fees: NED fees are capped at $600,000, with an expectation they will not exceed
$340,000 in FY17. NED roles are paid $50,0000, with an additional $20,000 for the
Chair role and $10,0000 for a Committee Chair. There are 2 committees – The Audit
Risk Committee and the Remuneration and Nominations Committee.
■ Shareholding: Post the IPO, directors are listed as owning 2.8-4.9% of the issued
securities.
■ Director disclosure: Stephen Day was a NED at Kayzanate Pty Limited, which was
unable to service its bank facility with NAB post the GFC. The company was
deregistered in 2009, and re-registered in 2015 to allow NAB to allow NAB to exercise
its rights as mortgagee. Peter McDonald was a director of companies that were unable
to service their debt post the GFC. Peter Day personally guaranteed these companies
and he entered voluntary bankruptcy in 2010. This was annulled in 2011, with the
effect that it is treated as if it never occurred. Peter was also a director of BTSY Pty
Limited which provided funding to the above companies. Creditors would this company
up in 2010 and it was deregistered in 2014.
■ Related party disclosures: Nix Anderson, a company related to Derek Nix, provides
~$10,000 per month in consulting. An entity associated with Peter Ryan has acted an
financial adviser to PLG. The fee of $350,000 is intended to be applied to purchasing
securities in PGL.
Figure 87: Directors, tenure and independence
Source: Company data, Credit Suisse estimates
Peter Lancken May-00 16.4 Male Yes - tenure >10 years Non-Executive Chair
Stuart Dawes Jun-16 0.3 Male Chief Executive, Executive Director
Stephen Day Jun-11 5.3 Male Executive Director, Vice Chairman
Ian Hutchinson Mar-13 3.5 Male Non-Executive Director
Christopher Ryan May-00 16.4 Male Yes - tenure >10 years Non-Executive Director
Derek Nix Aug-11 5.1 Male Non-Executive Director
David Epper Aug-11 5.1 Male Non-Executive Director
Peter McDonald Dec-14 1.8 Male Executive Director
Anthony Ryan Jun-16 0.3 Male Non-Executive Director
Median_tenure median 5.1
Average_tenure mean 6.0
DirectorTenure on the
Board (yrs)Gender Independent Position

15 September 2016
Propertylink Group
(PLG.AX / PLG AU) 50
Figure 88: Board - tenure Figure 89: Board - gender diversity
Source: Company data, Credit Suisse estimates Source: Company data, Credit Suisse estimates
Figure 90: Director workload
Source: Company data, Credit Suisse estimates
Remuneration
■ CEO base of $550,000: Stuart Dawes the CEO will have a base salary of $550,000.
The other two executive directors will have a base salary of $525,000.
■ CEO max STI of $660,000: The CEO is entitled to a target STI of $330,000 and a
maximum STI of $660,000, 120% of base salary. 50% will be paid in cash and 50%
into deferred equity for 1 year. Budgeted funds from operation will be a gateway hurdle
for the STI, but no further details have been disclosed. The STI hurdles will include
non-financial hurdles which are being formulated.
■ The CEO is entitled to an LTI award in the form of rights with a face value of
$275,000. Performance hurdles are 50% based on relative TSR to the ASX300 A-
REITS index over three years, with the vesting norm of 50% vesting at the 50th
percentile and 100% vesting at the 75th percentile. The other 50% of the LTI rights is
subject to a 3 year CAGR EPS hurdle of 6-8.5% with vesting of 50% if CAGR EPS is
6% through to 100% vesting for a CAGR EPS of 8.5%.
■ In total the maximum salary package for the CEO is valued at $1.485mn.
MSCI ESG
■ MSCI ESG does not rate PLG.
Target Price Impacts from ESG
■ We do not include any downside impact in our target price for ESG.
33%
45%
22%
First term Second TermThird Term More than three terms
100%
0%
Male Female

15 September 2016
Propertylink Group
(PLG.AX / PLG AU) 51
Senior management and board
Senior management team
Stuart Dawes, Chief Executive Officer
Stuart has over 17 years’ experience in the property industry in a variety of executive
roles. Prior to being appointed Chief Executive Officer of PLG, Stuart was PLG’s Chief
Operating Officer (“COO”) since 2014, in addition to his role as Head of Investment
Management which he has held since 2009. As COO and head of investment
management, Stuart was responsible for the oversight of the operations of the PLG Group
in addition to leading PLG’s investment management business. Under Stuart’s leadership,
the PLG investment management business has grown from $36m to over $1.55bn in
assets under management.
Prior to joining PLG, Stuart worked in the United Kingdom for Lendlease Investment
Management, where he primarily focused on the development of new fund and investment
opportunities. Before moving to the United Kingdom in 2003, Stuart worked with
Lendlease’s Australian wholesale fund, Australian Prime Property Fund. Stuart also has
experience with Barclays Capital in its European structured finance business, where he
concentrated on debt and equity transactions within Europe.
Stuart holds a Bachelor of Commerce from the University of Western Sydney and a
Master of Applied Finance from Macquarie University.
Stephen Day, Vice Chairman and Executive Director
Steve has a career spanning over 31 years in the property industry in a variety of
executive roles in Australia and overseas. Steve is currently Executive Director of PLG, a
role in which he is responsible for managing mergers & acquisitions, assisting the property
team on deal flow and chairing the review of property strategy and operations, in addition
to assisting the CEO with corporate strategy and wholesale investor relationships.
Steve was formerly the managing director of PLG where he was responsible for the
strategic direction and day-to-day leadership of PLG. Steve was co-founder and Executive
Chairman of Valad. Steve guided the strategic growth of Valad to achieve in excess of
$10bn in AUM. In 2009, he founded Echo Capital which merged with PLG in 2011. Steve’s
previous experience includes various roles with Lendlease from 1985 to 1995.
Steve holds a Bachelor of Economics from Macquarie University. He is a fellow of the
Royal Institute of Chartered Surveyors (FRICS), sits on the Australian Chapter Board of
the Asia Pacific Real Estate Association (APREA) and is a Fellow of the Australian
Property Institute (API).
Peter McDonald, Executive Director & Head of Property
Peter has 27 years of property market experience across the industrial and office sectors
within Australia. As Head of Property, Peter is ultimately responsible for the overall
operations of the Portfolio and the management of the Property team. Peter has a
particular focus on capital transactions and has sourced or been heavily involved in all of
the Group’s acquisitions to date.
His previous experience includes senior roles with Jones Lang LaSalle, Lendlease, Dexus
and Valad and has a long track record in concluding major acquisitions and leasing
transactions.
Peter holds an Associate Diploma in Business (Valuation).

15 September 2016
Propertylink Group
(PLG.AX / PLG AU) 52
Tony Groth, Chief Financial Officer
Tony joined PLG in July 2015 as Chief Financial Officer, following PLG’s decision to
internalise outsourced administration and accounting services previously provided by the
Investorlink Group. Prior to joining PLG Tony spent eight years as Chief Operating Officer of
Investorlink Group, where, among other tasks, he was responsible for the provision of
services to PLG. In total, Tony has been associated with PLG operations for over nine years.
Tony has more than 30 years’ experience in the financial services industry. Tony was a
business services partner with the Sydney office of Grant Thornton from 1983 to 1999.
Between 2000 and 2007 Tony managed a polystyrene manufacturing business, helping
build it from a start up to a prominent market share position in both the Sydney and
Melbourne markets.
Tony is a Non-Executive Director of ASX listed company 99 Wuxian Limited, and Non-
Executive Director and Treasurer of Oatlands Golf Club Limited. Tony a Fellow of the
Institute of Chartered Accountants in Australia.
Board of Directors
Peter Lancken, Independent Chairman
Peter joined the PLG Board in May 2000. He has a career spanning over 25 years in a
range of executive and director roles in equipment hire, industrial, and real estate
companies. Peter was formerly the Managing Director and Non-Executive Chairman of
Kennards Hire Pty Limited. He managed an era of growth spanning two decades with
Kennards with sales now exceeding $300m from a network of over 170 locations and
remains on the Board as a Non-Executive Director.
Peter is also a Non-Executive Director of Acrow Formwork and Scaffolding Pty Ltd. He
was the deputy chairman and non-executive director of CMA Corporation Limited, a public
company listed on the ASX.
Peter holds a Bachelor of Engineering (Civil) from the University of New South Wales, is a
Fellow of the Institute of Engineers Australia and is a member of the Australian Institute of
Company Directors.
Stuart Dawes, Chief Executive Officer and Executive Director
See Senior Management section.
Stephen Day, Vice Chairman and Executive Director
See Senior Management section.
Ian Hutchinson, Independent Non-Executive Director
Ian joined the PLG Board in March 2013. He has been a professional non-executive
company director for over 20 years. Before that he was Chairman and Senior Partner of
one of Australia’s largest law firms, Freehills (now Herbert Smith Freehills).
Ian was the Representative of Lloyds of London Underwriters, appointed under the
Australian Insurance Act, and Counsel for Lloyds Australia. He has been the chairman or a
director of companies, both listed on the Australian Securities Exchange and non-listed
companies, across a broad range of industries and services, including investment banking,
financial services, life and general insurance, mining and energy, property, transport,
hotels, infrastructure and health. Ian is Chairman and President of the Global
Sustainability Foundation in New York. He is also Vice-Chairman of Wealth Resources Pty
Limited, a Chinese-owned energy company in Australia. Ian holds a Bachelor of Laws and
is a Fellow of the Australian Institute of Company Directors. He is actively involved in the
Australian Institute of Company Directors, and gives presentations to company directors
and assists in training and mentoring directors

15 September 2016
Propertylink Group
(PLG.AX / PLG AU) 53
Christopher Ryan, Independent Non-Executive Director
Chris joined the PLG Board in May 2000. He is an Executive Director of Investorlink Group
Limited, a Sydney-based corporate finance and advisory firm. Chris has diverse
experience and expertise in mergers and acquisitions together with initial public offerings.
He has advised on ASX listings since 1986. Chris has served as Chairman of ASX listed
Bravura Solutions Limited and China Waste Corporation Limited and is currently Co-
Chairman of ASX listed TTG Fintech Limited (ASX:TTG) and Non-Executive Director of
eCargo Holdings Limited (ASX: ECG).
Chris holds a Bachelor of Financial Administration from the University of New England and
is a Fellow of the Institute of Chartered Accountants in Australia.
Derek Nix, Independent Non-Executive Director
Derek joined the PLG Board in August 2011. Derek is the Managing Director and Principal
of Nix Anderson Pty Ltd, a construction project management and property advisory firm
working principally in the commercial, industrial, health and retail sectors. Nix Andersons’s
clients include LGS, Aventus, Health Infrastructure, Colonial First State, Stockland,
Charter Hall and other industry leaders.
Derek has over 35 years’ experience in the construction and property industry. Initially with
Concrete Constructions Group Limited, where he was project manager, he later moved to
the Reed Group Pty Ltd where over 17 years, he covered roles from commercial manager,
and chief estimator to project manager, becoming a director in 1988 before leaving and
forming Nix Management in 1999. In 2014 Nix Management merged with industry leading
infrastructure delivery expert, Scott Anderson, to become Nix Anderson Pty Ltd.
Derek holds a Bachelor of Applied Science (Building) (Hons) from the University of
Technology (Sydney) and is a member of the Property Council.
David Epper, Independent Non-Executive Director
David joined the PLG Board in August 2011. He has over 40 years’ experience in the
insurance underwriting business and is the former managing director and owner of
Accident & Health International Underwriting Pty Ltd. David owned and operated this
business from 1998 to 2015 before selling the business to CGU Insurance Australia.
David is a Life Governor of Autism Spectrum Australia and was also awarded the Order of
Australia Medal in 2014. He is a Member of the Australian and New Zealand Institute of
Insurance and Finance.
Peter McDonald, Executive Director
See Senior Management Section.
Anthony Ryan, Non-Executive Director
Anthony joined the PLG Board in 2016. He is a real estate finance professional with over
20 years’ experience in Australia and Asia spanning real estate corporate, project and
structured finance. Anthony is a former managing director of JPMorgan and was head of
real estate investment banking for Asia.
Anthony is also a Non-Executive Director of Grocon Group Holdings, an Australian Tier 1
construction contractor and developer, Real Estate Consultant to OCP Asia, an alternative
asset manager based in Hong Kong and an Independent Member of the PLG Australia
Industrial Partnership II (PAIP II) Investment Committee.
Anthony holds a Bachelor of Commerce from the University of New South Wales.

15 September 2016
Propertylink Group
(PLG.AX / PLG AU) 54
Companies Mentioned (Price as of 15-Sep-2016) 360 Capital (TIX.AX, A$2.67) Abacus Prop Grp (ABP.AX, A$2.8) Centuria (CMA.AX, A$2.17) Charter Hall Group (CHC.AX, A$5.19) Charter Hall Retail REIT (CQR.AX, A$4.11) Cromwell Property Group (CMW.AX, A$0.96) Dexus Property Group (DXS.AX, A$8.75) GDI Property Group (GDI.AX, A$0.94) GPT Group (GPT.AX, A$4.79) GPT Metro Office (GMF.AX, A$2.51) Goodman Group (GMG.AX, A$6.99) Growthpoint Prop (GOZ.AX, A$3.16) Investa Office Fund (IOF.AX, A$4.35) Lend Lease (LLC.AX, A$13.32) Mirvac Group (MGR.AX, A$2.18) Propertylink Group (PLG.AX, A$0.75, OUTPERFORM, TP A$0.92) SCA Property Group (SCP.AX, A$2.13) Scentre Group (SCG.AX, A$4.55) Westfield Corporation (WFD.AX, A$9.59)
Disclosure Appendix
Important Global Disclosures Mikhail Mohl and Ian Randall each certify, with respect to the companies or securities that the individual analyzes, that (1) the views expressed in this report accurately reflect his or her personal views about all of the subject companies and securities and (2) no part of his or her compensation was, is or will be directly or indirectly related to the specific recommendations or views expressed in this report. The analyst(s) responsible for preparing this research report received Compensation that is based upon various factors including Credit Suisse's total revenues, a portion of which are generated by Credit Suisse's investment banking activities
As of December 10, 2012 Analysts’ stock rating are defined as follows: Outperform (O) : The stock’s total return is expected to outperform the relevant benchmark* over the next 12 months. Neutral (N) : The stock’s total return is expected to be in line with the relevant benchmark* over the next 12 months. Underperform (U) : The stock’s total return is expected to underperform the relevant benchmark* over the next 12 months. *Relevant benchmark by region: As of 10th December 2012, Japanese ratings are based on a stock’s total return relative to the analyst's coverage universe which consists of all companies covered by the analyst within the relevant sector, with Outperforms representing the most attractive, Neutrals the less attractive, and Underperforms the least attractive investment opportunities. As of 2nd October 2012, U.S. and Canadian as well as European ra tings are based on a stock’s total return relative to the analyst's coverage universe which consists of all companies covered by the analyst within the relevant sector, with Outperforms representing the most attractive, Neutrals the less attractive, and Underperforms the least attractive investment opportunities. F or Latin American and non-Japan Asia stocks, ratings are based on a stock’s total return relative to the average total return of the relevant country or regional benchmark; prior to 2nd October 2012 U.S. and Canadian ratings were based on (1) a stock’s absolute total return potential to its current share price and (2) the relative attractiveness of a stock’s total return potential within an analyst’s coverage universe. For Australian and New Zealand stocks, the expected total return (ETR) calculation includ es 12-month rolling dividend yield. An Outperform rating is assigned where an ETR is greater than or equal to 7.5%; Underperform where an ETR less than or equal to 5%. A Neutral may be assigned where the ETR is between -5% and 15%. The overlapping rating range allows analysts to assign a rating that puts ETR in the context of associated risks. Prior to 18 May 2015, ETR ranges for Outperform and Underperform ratings did not overlap with Neutral thresholds between 15% and 7.5%, wh ich was in operation from 7 July 2011. Restricted (R) : In certain circumstances, Credit Suisse policy and/or applicable law and regulations preclude certain types of communications, including an investment recommendation, during the course of Credit Suisse's engagement in an investment banking transaction and in certain other circumstances. Not Rated (NR) : Credit Suisse Equity Research does not have an investment rating or view on the stock or any other securities related to the company at this time. Not Covered (NC) : Credit Suisse Equity Research does not provide ongoing coverage of the company or offer an investment rating or investment view on the equity security of the company or related products.
Volatility Indicator [V] : A stock is defined as volatile if the stock price has moved up or down by 20% or more in a month in at least 8 of the past 24 months or the analyst expects significant volatility going forward.
Analysts’ sector weightings are distinct from analysts’ stock ratings and are based on the analyst’s expectations for the fundamentals and/or valuation of the sector* relative to the group’s historic fundamentals and/or valuation: Overweight : The analyst’s expectation for the sector’s fundamentals and/or valuation is favorable over the next 12 months. Market Weight : The analyst’s expectation for the sector’s fundamentals and/or valuation is neutral over the next 12 months. Underweight : The analyst’s expectation for the sector’s fundamentals and/or valuation is cautious over the next 12 months. *An analyst’s coverage sector consists of all companies covered by the analyst within the relevant sector. An analyst may cover multiple sectors.

15 September 2016
Propertylink Group
(PLG.AX / PLG AU) 55
Credit Suisse's distribution of stock ratings (and banking clients) is:
Global Ratings Distribution
Rating Versus universe (%) Of which banking clients (%) Outperform/Buy* 53% (50% banking clients) Neutral/Hold* 29% (24% banking clients) Underperform/Sell* 18% (44% banking clients) Restricted 0% *For purposes of the NYSE and NASD ratings distribution disclosure requirements, our stock ratings of Outperform, Neutral, and Underperform most closely correspond to Buy, Hold, and Sell, respectively; however, the meanings are not the same, as our stock ratings are determined on a relative basis. (Please refer to definitions above.) An investor's decision to buy or sell a security should be based on investment objectives, current holdings, and other individ ual factors.
Credit Suisse’s policy is to update research reports as it deems appropriate, based on developments with the subject company, the sector or the market that may have a material impact on the research views or opinions stated herein. Credit Suisse's policy is only to publish investment research that is impartial, independent, clear, fair and not misleading. For more detail please refer to Credit Suisse's Policies for Managing Conflicts of Interest in connection with Investment Research: http://www.csfb.com/research-and-analytics/disclaimer/managing_conflicts_disclaimer.html Credit Suisse does not provide any tax advice. Any statement herein regarding any US federal tax is not intended or written to be used, and cannot be used, by any taxpayer for the purposes of avoiding any penalties. See the Companies Mentioned section for full company names The subject company (GDI.AX, MGR.AX, LLC.AX, WFD.AX, SCG.AX, SCP.AX) currently is, or was during the 12-month period preceding the date of distribution of this report, a client of Credit Suisse. Credit Suisse provided investment banking services to the subject company (PLG.AX, WFD.AX) within the past 12 months. Credit Suisse has managed or co-managed a public offering of securities for the subject company (PLG.AX) within the past 12 months. Credit Suisse provided non-investment banking services to the subject company (SCP.AX) within the past 12 months Credit Suisse has received investment banking related compensation from the subject company (PLG.AX, WFD.AX) within the past 12 months Credit Suisse expects to receive or intends to seek investment banking related compensation from the subject company (CMW.AX, CQR.AX, CHC.AX, GPT.AX, GDI.AX, GMG.AX, MGR.AX, LLC.AX, PLG.AX, WFD.AX, SCG.AX, SCP.AX) within the next 3 months. Credit Suisse has received compensation for products and services other than investment banking services from the subject company (SCP.AX) within the past 12 months As of the end of the preceding month, Credit Suisse beneficially own 1% or more of a class of common equity securities of (GPT.AX, MGR.AX, LLC.AX, PLG.AX, SCG.AX).
Target Price and Rating Valuation Methodology and Risks: (12 months) for Propertylink Group (PLG.AX)
Method: We strike our $0.92 Target Price for Propertylink Group at the mid-point of our SOTP ($0.91) and DCF ($0.93) valuations. Our DCF
includes an RFR of 4% and ERT of 5%, beta 0.91x. PLG trades at an 18% discount to our TP and offers a 9.0% distribution yield, which is almost double the sector average. Hence, we assign PLG an Outperform rating
Risk: Key risks to our $0.92 Target Price and Outperform rating for Propertylink Group include a marked deteriorating in Australian industrial market conditions, which given PLG's relatively short WALE and relatively high MT expiry profile could have a disporportionately negative impact on both PLG's income and valuations relative to peers. Other risks include personnel risk, re-leasing and vacancy risk, development risk, real estate values cyclicality, the ability to generate FUM growth and the ability to secure additional capital and fund assets at attractive pricing.
For other important disclosures concerning companies featured in this report, including price charts, please visit the website at https://rave.credit-suisse.com/disclosures or call +1 (877) 291-2683. For date and time of production, dissemination and history of recommendation for the subject company(ies) featured in this report, disseminated within the past 12 months, please refer to the link: https://rave.credit-suisse.com/disclosures/view/report?i=248276&v=moirgkb8g80r8hc7yy6wn4n .
Important Regional Disclosures Singapore recipients should contact Credit Suisse AG, Singapore Branch for any matters arising from this research report. The analyst(s) involved in the preparation of this report may participate in events hosted by the subject company, including site visits. Credit Suisse does not accept or permit analysts to accept payment or reimbursement for travel expenses associated with these events. Restrictions on certain Canadian securities are indicated by the following abbreviations: NVS--Non-Voting shares; RVS--Restricted Voting Shares; SVS--Subordinate Voting Shares. Individuals receiving this report from a Canadian investment dealer that is not affiliated with Credit Suisse should be advised that this report may not contain regulatory disclosures the non-affiliated Canadian investment dealer would be required to make if this were its own report. For Credit Suisse Securities (Canada), Inc.'s policies and procedures regarding the dissemination of equity research, please visit https://www.credit-suisse.com/sites/disclaimers-ib/en/canada-research-policy.html. Credit Suisse has acted as lead manager or syndicate member in a public offering of securities for the subject company (GDI.AX, SCG.AX) within the past 3 years. Principal is not guaranteed in the case of equities because equity prices are variable. Commission is the commission rate or the amount agreed with a customer when setting up an account or at any time after that.

15 September 2016
Propertylink Group
(PLG.AX / PLG AU) 56
This research report is authored by: Credit Suisse Equities (Australia) Limited ................................................................................................. Mikhail Mohl ; Ian Randall ; Martin Patz To the extent this is a report authored in whole or in part by a non-U.S. analyst and is made available in the U.S., the following are important disclosures regarding any non-U.S. analyst contributors: The non-U.S. research analysts listed below (if any) are not registered/qualified as research analysts with FINRA. The non-U.S. research analysts listed below may not be associated persons of CSSU and therefore may not be subject to the NASD Rule 2711 and NYSE Rule 472 restrictions on communications with a subject company, public appearances and trading securities held by a research analyst account. Credit Suisse Equities (Australia) Limited ................................................................................................. Mikhail Mohl ; Ian Randall ; Martin Patz
For Credit Suisse disclosure information on other companies mentioned in this report, please visit the website at https://rave.credit-suisse.com/disclosures or call +1 (877) 291-2683.

15 September 2016
Propertylink Group
(PLG.AX / PLG AU) 57
This report is produced by subsidiaries and affiliates of Credit Suisse operating under its Global Markets Division. For more information on our structure, please use the following link: https://www.credit-suisse.com/who-we-are This report may contain material that is not directed to, or intended for distribution to or use by, any person or entity who is a citizen or resident of or located in any locality, state, country or other jurisdiction where such distribution, publication, availability or use would be contrary to law or regulation or which would subject Credit Suisse or its affiliates ("CS") to any registration or licensing requirement within such jurisdiction. All material presented in this report, unless specifically indicated otherwise, is under copyright to CS. None of the material, nor its content, nor any copy of it, may be altered in any way, transmitted to, copied or distributed to any other party, without the prior express written permission of CS. All trademarks, service marks and logos used in this report are trademarks or service marks or registered trademarks or service marks of CS or its affiliates.The information, tools and material presented in this report are provided to you for information purposes only and are not to be used or considered as an offer or the solicitation of an offer to sell or to buy or subscribe for securities or other financial instruments. CS may not have taken any steps to ensure that the securities referred to in this report are suitable for any particular investor. CS will not treat recipients of this report as its customers by virtue of their receiving this report. The investments and services contained or referred to in this report may not be suitable for you and it is recommended that you consult an independent investment advisor if you are in doubt about such investments or investment services. Nothing in this report constitutes investment, legal, accounting or tax advice, or a representation that any investment or strategy is suitable or appropriate to your individual circumstances, or otherwise constitutes a personal recommendation to you. CS does not advise on the tax consequences of investments and you are advised to contact an independent tax adviser. Please note in particular that the bases and levels of taxation may change. Information and opinions presented in this report have been obtained or derived from sources believed by CS to be reliable, but CS makes no representation as to their accuracy or completeness. CS accepts no liability for loss arising from the use of the material presented in this report, except that this exclusion of liability does not apply to the extent that such liability arises under specific statutes or regulations applicable to CS. This report is not to be relied upon in substitution for the exercise of independent judgment. CS may have issued, and may in the future issue, other communications that are inconsistent with, and reach different conclusions from, the information presented in this report. Those communications reflect the different assumptions, views and analytical methods of the analysts who prepared them and CS is under no obligation to ensure that such other communications are brought to the attention of any recipient of this report. Some investments referred to in this report will be offered solely by a single entity and in the case of some investments solely by CS, or an associate of CS or CS may be the only market maker in such investments. Past performance should not be taken as an indication or guarantee of future performance, and no representation or warranty, express or implied, is made regarding future performance. Information, opinions and estimates contained in this report reflect a judgment at its original date of publication by CS and are subject to change without notice. The price, value of and income from any of the securities or financial instruments mentioned in this report can fall as well as rise. The value of securities and financial instruments is subject to exchange rate fluctuation that may have a positive or adverse effect on the price or income of such securities or financial instruments. Investors in securities such as ADR's, the values of which are influenced by currency volatility, effectively assume this risk. Structured securities are complex instruments, typically involve a high degree of risk and are intended for sale only to sophisticated investors who are capable of understanding and assuming the risks involved. The market value of any structured security may be affected by changes in economic, financial and political factors (including, but not limited to, spot and forward interest and exchange rates), time to maturity, market conditions and volatility, and the credit quality of any issuer or reference issuer. Any investor interested in purchasing a structured product should conduct their own investigation and analysis of the product and consult with their own professional advisers as to the risks involved in making such a purchase. Some investments discussed in this report may have a high level of volatility. High volatility investments may experience sudden and large falls in their value causing losses when that investment is realised. Those losses may equal your original investment. Indeed, in the case of some investments the potential losses may exceed the amount of initial investment and, in such circumstances, you may be required to pay more money to support those losses. Income yields from investments may fluctuate and, in consequence, initial capital paid to make the investment may be used as part of that income yield. Some investments may not be readily realisable and it may be difficult to sell or realise those investments, similarly it may prove difficult for you to obtain reliable information about the value, or risks, to which such an investment is exposed. This report may provide the addresses of, or contain hyperlinks to, websites. Except to the extent to which the report refers to website material of CS, CS has not reviewed any such site and takes no responsibility for the content contained therein. Such address or hyperlink (including addresses or hyperlinks to CS's own website material) is provided solely for your convenience and information and the content of any such website does not in any way form part of this document. Accessing such website or following such link through this report or CS's website shall be at your own risk.
This report is issued and distributed in European Union (except Switzerland): by Credit Suisse Securities (Europe) Limited, One Cabot Square, London E14 4QJ, England, which is authorised by the Prudential Regulation Authority and regulated by the Financial Conduct Authority and the Prudential Regulation Authority. Germany: Credit Suisse Securities (Europe) Limited Niederlassung Frankfurt am Main regulated by the Bundesanstalt fuer Finanzdienstleistungsaufsicht ("BaFin"). United States and Canada: Credit Suisse Securities (USA) LLC; Switzerland: Credit Suisse AG; Brazil: Banco de Investimentos Credit Suisse (Brasil) S.A or its affiliates; Mexico: Banco Credit Suisse (México), S.A. (transactions related to the securities mentioned in this report will only be effected in compliance with applicable regulation); Japan: by Credit Suisse Securities (Japan) Limited, Financial Instruments Firm, Director-General of Kanto Local Finance Bureau ( Kinsho) No. 66, a member of Japan Securities Dealers Association, The Financial Futures Association of Japan, Japan Investment Advisers Association, Type II Financial Instruments Firms Association; Hong Kong: Credit Suisse (Hong Kong) Limited; Australia: Credit Suisse Equities (Australia) Limited; Thailand: Credit Suisse Securities (Thailand) Limited, regulated by the Office of the Securities and Exchange Commission, Thailand, having registered address at 990 Abdulrahim Place, 27th Floor, Unit 2701, Rama IV Road, Silom, Bangrak, Bangkok10500, Thailand, Tel. +66 2614 6000; Malaysia: Credit Suisse Securities (Malaysia) Sdn Bhd, Credit Suisse AG, Singapore Branch; India: Credit Suisse Securities (India) Private Limited (CIN no.U67120MH1996PTC104392) regulated by the Securities and Exchange Board of India as Research Analyst (registration no. INH 000001030) and as Stock Broker (registration no. INB230970637; INF230970637; INB010970631; INF010970631), having registered address at 9th Floor, Ceejay House, Dr.A.B. Road, Worli, Mumbai - 18, India, T- +91-22 6777 3777; South Korea: Credit Suisse Securities (Europe) Limited, Seoul Branch; Taiwan: Credit Suisse AG Taipei Securities Branch; Indonesia: PT Credit Suisse Securities Indonesia; Philippines: Credit Suisse Securities (Philippines ) Inc., and elsewhere in the world by the relevant authorised affiliate of the above. Additional Regional Disclaimers Hong Kong: Credit Suisse (Hong Kong) Limited ("CSHK") is licensed and regulated by the Securities and Futures Commission of Hong Kong under the laws of Hong Kong, which differ from Australian laws. CSHKL does not hold an Australian financial services licence (AFSL) and is exempt from the requirement to hold an AFSL under the Corporations Act 2001 (the Act) under Class Order 03/1103 published by the ASIC in respect of financial services provided to Australian wholesale clients (within the meaning of section 761G of the Act). Research on Taiwanese securities produced by Credit Suisse AG, Taipei Securities Branch has been prepared by a registered Senior Business Person. Malaysia: Research provided to residents of Malaysia is authorised by the Head of Research for Credit Suisse Securities (Malaysia) Sdn Bhd, to whom they should direct any queries on +603 2723 2020. Singapore: This report has been prepared and issued for distribution in Singapore to institutional investors, accredited investors and expert investors (each as defined under the Financial Advisers Regulations) only, and is also distributed by Credit Suisse AG, Singapore branch to overseas investors (as defined under the Financial Advisers Regulations). By virtue of your status as an institutional investor, accredited investor, expert investor or overseas investor, Credit Suisse AG, Singapore branch is exempted from complying with certain compliance requirements under the Financial Advisers Act, Chapter 110 of Singapore (the "FAA"), the Financial Advisers Regulations and the relevant Notices and Guidelines issued thereunder, in respect of any financial advisory service which Credit Suisse AG, Singapore branch may provide to you. UAE: This information is being distributed by Credit Suisse AG (DIFC Branch), duly licensed and regulated by the Dubai Financial Services Authority (“DFSA”). Related financial services or products are only made available to Professional Clients or Market Counterparties, as defined by the DFSA, and are not intended for any other persons. Credit Suisse AG (DIFC Branch) is located on Level 9 East, The Gate Building, DIFC, Dubai, United Arab Emirates. EU: This report has been produced by subsidiaries and affiliates of Credit Suisse operating under its Global Markets Division This research may not conform to Canadian disclosure requirements. In jurisdictions where CS is not already registered or licensed to trade in securities, transactions will only be effected in accordance with applicable securities legislation, which will vary from jurisdiction to jurisdiction and may require that the trade be made in accordance with applicable exemptions from registration or licensing requirements. Non-US customers wishing to effect a transaction should contact a CS entity in their local jurisdiction unless governing law permits otherwise. US customers wishing to effect a transaction should do so only by contacting a representative at Credit Suisse Securities (USA) LLC in the US. Please note that this research was originally prepared and issued by CS for distribution to their market professional and institutional investor customers. Recipients who are not market professional or institutional investor customers of CS should seek the advice of their independent financial advisor prior to taking any investment decision based on this report or for any necessary explanation of its contents. This research may relate to investments or services of a person outside of the UK or to other matters which are not authorised by the Prudential Regulation Authority and regulated by the Financial Conduct Authority and the Prudential Regulation Authority or in respect of which the protections of the Prudential Regulation Authority and Financial Conduct Authority for private customers and/or the UK compensation scheme may not be available, and further details as to where this may be the case are available upon request in respect of this report. CS may provide various services to US municipal entities or obligated persons ("municipalities"), including suggesting individual transactions or trades and entering into such transactions. Any services CS provides to municipalities are not viewed as "advice" within the meaning of Section 975 of the Dodd-Frank Wall Street Reform and Consumer Protection Act. CS is providing any such services and related information solely on an arm's length basis and not as an advisor or fiduciary to the municipality. In connection with the provision of the any such services, there is no agreement, direct or indirect, between any municipality (including the officials,management, employees or agents thereof) and CS for CS to provide advice to the municipality. Municipalities should consult with their financial, accounting and legal advisors regarding any such services provided by CS. In addition, CS is not acting for direct or indirect compensation to solicit the municipality on behalf of an unaffiliated broker, dealer, municipal securities dealer, municipal advisor, or investment adviser for the purpose of obtaining or retaining an engagement by the municipality for or in connection with Municipal Financial Products, the issuance of municipal securities, or of an investment adviser to provide investment advisory services to or on behalf of the municipality. If this report is being distributed by a financial institution other than Credit Suisse AG, or its affiliates, that financial institution is solely responsible for distribution. Clients of that institution should contact that institution to effect a transaction in the securities mentioned in this report or require further information. This report does not constitute investment advice by Credit Suisse to the clients of the distributing financial institution, and neither Credit Suisse AG, its affiliates, and their respective officers, directors and employees accept any liability whatsoever for any direct or consequential loss arising from their use of this report or its content. Principal is not guaranteed. Commission is the commission rate or the amount agreed with a customer when setting up an account or at any time after that. Copyright © 2016 CREDIT SUISSE AG and/or its affiliates. All rights reserved.
Investment principal on bonds can be eroded depending on sale price or market price. In addition, there are bonds on which investment principal can be eroded due to changes in redemption amounts. Care is required when investing in such instruments. When you purchase non-listed Japanese fixed income securities (Japanese government bonds, Japanese municipal bonds, Japanese government guaranteed bonds, Japanese corporate bonds) from CS as a seller, you will be requested to pay the purchase price only.