proposal 01 tighter - solar and heliospheric observatory ... · 5/8/2001 · large-scale solar...
TRANSCRIPT

78 79 80 81 82 83 84 85 86 87 88 89 90 91 92 93 94 95 96 97 98 99 00 01 Year
1363
1364
1365
1366
1367
1368
1369
So
lar
Irra
dia
nce
(W
m−
2)
0 2000 4000 6000 8000Days (Epoch Jan 0, 1980)
HF
AC
RIM
I
HF
AC
RIM
I
HF
AC
RIM
II
VIR
GO
0.1%
The SOHO Solar Cycle
Mission

Captions for figures on the cover:Figure 8, top. The solar corona at 1.5 MK (EIT) and the line-of-sight flow (blue-red) and magnetic network (black) patterns at 0.63MK (SUMER) in a polar coronal holeFigure 1, middle. The total solar irradiance, measured by various spacecraft instruments over the last two solar cycles. The data in green are from SOHO VIRGO sensorsFigure 12, bottom. Can we predict the appearance of active regions before they reach the photosphere?
Table of Contents
I. Executive Summary . . . . . . . . . . . . . . . . . . . . . . . . . . . . . . . . . . . . . . . . . . . . . . . . . . . . . . 1II. Goals: SOHO and NASA . . . . . . . . . . . . . . . . . . . . . . . . . . . . . . . . . . . . . . . . . . . . . . . . . 2III. Scientific Insights from SOHO, 1998-2001 . . . . . . . . . . . . . . . . . . . . . . . . . . . . . . . . . . . 3 Solar Interior and Total Irradiance . . . . . . . . . . . . . . . . . . . . . . . . . . . . . . . . . . . . . . 3 The Solar Atmosphere . . . . . . . . . . . . . . . . . . . . . . . . . . . . . . . . . . . . . . . . . . . . . . . . . 5 The Heliosphere . . . . . . . . . . . . . . . . . . . . . . . . . . . . . . . . . . . . . . . . . . . . . . . . . . . . . . 8 Space Weather . . . . . . . . . . . . . . . . . . . . . . . . . . . . . . . . . . . . . . . . . . . . . . . . . . . . . . . 10IV. The Promise of a SOHO Solar Cycle Mission, 2001-2005 . . . . . . . . . . . . . . . . . . . . . 11V. Education and Public Outreach . . . . . . . . . . . . . . . . . . . . . . . . . . . . . . . . . . . . . . . . . . . 14VI. Why Keep SOHO Going? . . . . . . . . . . . . . . . . . . . . . . . . . . . . . . . . . . . . . . . . . . . . . . . . 15Appendix A. SOHO Publication Record, 1997- 2001Q1 . . . . . . . . . . . . . . . . . . . . . . . . . 16Appendix B. Instrument Status as of 2001 April 23 . . . . . . . . . . . . . . . . . . . . . . . . . . . . . 17References . . . . . . . . . . . . . . . . . . . . . . . . . . . . . . . . . . . . . . . . . . . . . . . . . . . . . . . . . . . . . . . . . 20VII. Technical/Management . . . . . . . . . . . . . . . . . . . . . . . . . . . . . . . . . . . . . . . . . . . . . . . . . 22 A. Science Operations and Data Analysis Budget . . . . . . . . . . . . . . . . . . . . . . . . 22 B. Mission Operations Budget . . . . . . . . . . . . . . . . . . . . . . . . . . . . . . . . . . . . . . . . . 25
1
Solar and Heliospheric Observatory (SOHO)
Presenter: J.B. Gurman, US Project Scientist for SOHO
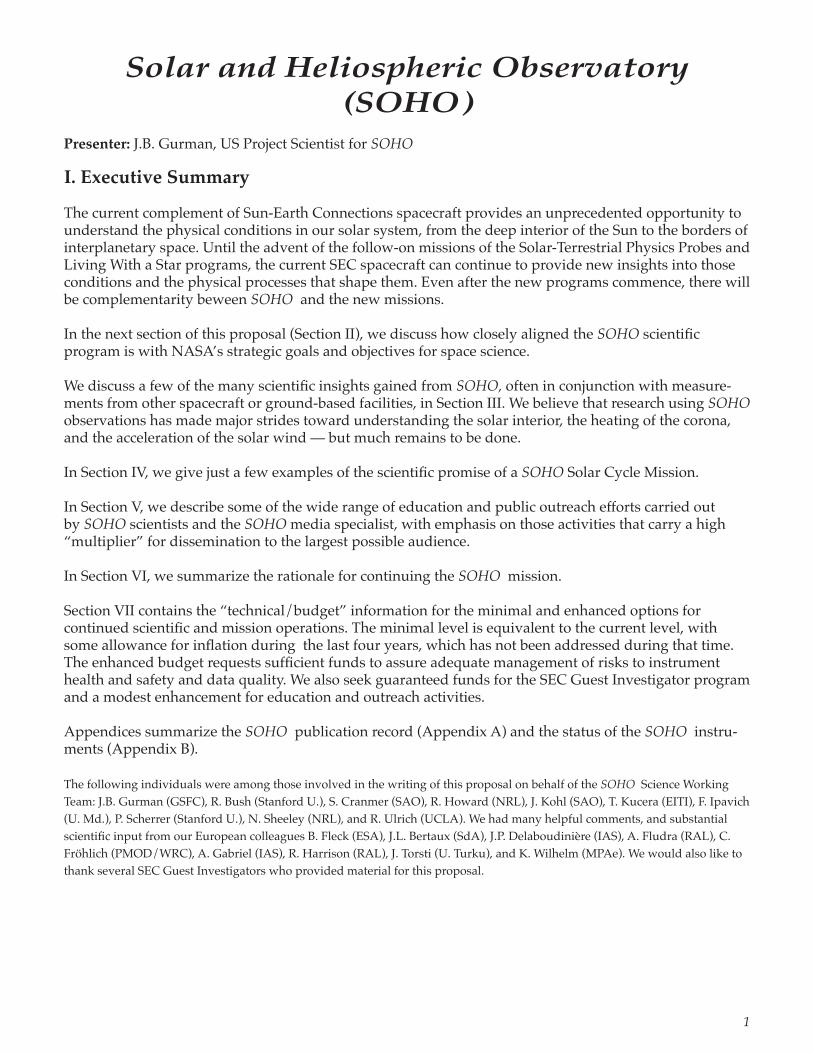
I. Executive Summary
The current complement of Sun-Earth Connections spacecraft provides an unprecedented opportunity to understand the physical conditions in our solar system, from the deep interior of the Sun to the borders of interplanetary space. Until the advent of the follow-on missions of the Solar-Terrestrial Physics Probes and Living With a Star programs, the current SEC spacecraft can continue to provide new insights into those conditions and the physical processes that shape them. Even after the new programs commence, there will be complementarity beween SOHO and the new missions.
In the next section of this proposal (Section II), we discuss how closely aligned the SOHO scientific program is with NASA’s strategic goals and objectives for space science.
We discuss a few of the many scientific insights gained from SOHO, often in conjunction with measure-ments from other spacecraft or ground-based facilities, in Section III. We believe that research using SOHO observations has made major strides toward understanding the solar interior, the heating of the corona, and the acceleration of the solar wind — but much remains to be done.
In Section IV, we give just a few examples of the scientific promise of a SOHO Solar Cycle Mission.
In Section V, we describe some of the wide range of education and public outreach efforts carried out by SOHO scientists and the SOHO media specialist, with emphasis on those activities that carry a high “multiplier” for dissemination to the largest possible audience.
In Section VI, we summarize the rationale for continuing the SOHO mission.
Section VII contains the “technical/budget” information for the minimal and enhanced options for continued scientific and mission operations. The minimal level is equivalent to the current level, with some allowance for inflation during the last four years, which has not been addressed during that time. The enhanced budget requests sufficient funds to assure adequate management of risks to instrument health and safety and data quality. We also seek guaranteed funds for the SEC Guest Investigator program and a modest enhancement for education and outreach activities.
Appendices summarize the SOHO publication record (Appendix A) and the status of the SOHO instru-ments (Appendix B).
The following individuals were among those involved in the writing of this proposal on behalf of the SOHO Science Working Team: J.B. Gurman (GSFC), R. Bush (Stanford U.), S. Cranmer (SAO), R. Howard (NRL), J. Kohl (SAO), T. Kucera (EITI), F. Ipavich (U. Md.), P. Scherrer (Stanford U.), N. Sheeley (NRL), and R. Ulrich (UCLA). We had many helpful comments, and substantial scientific input from our European colleagues B. Fleck (ESA), J.L. Bertaux (SdA), J.P. Delaboudinière (IAS), A. Fludra (RAL), C. Fröhlich (PMOD/WRC), A. Gabriel (IAS), R. Harrison (RAL), J. Torsti (U. Turku), and K. Wilhelm (MPAe). We would also like to thank several SEC Guest Investigators who provided material for this proposal.

2
II. Goals: SOHO and NASA
SOHO’s Goals As stated in our 1997 Senior Review proposal, “The SOHO mission has three principal goals: to gain an understanding of the mechanisms responsible for the heating of the Sun’s outer atmosphere; to determine where the solar wind originates and how it is accelerated; and to measure the properties of, and flows in, the solar interior.” In the last four years, the community of scientists using SOHO data has made remarkable strides toward all three of these goals — but much remains to be done. We therefore propose (in Section VI, below) a “SOHO Solar Cycle Mission” to take advantage of the unique capabilities of SOHO through the next four years. This phase of the solar cycle sees the most geoeffective disturbances propagate through the inner heliosphere, a radical redistribution of the large-scale solar magnetic field and heliospheric current sheet, and the stirrings of a new magnetic cycle at high latitudes.
SOHO and Strategic Goals The charter for this review refers to the goals and objectives in NASA’s Space Science 2000 Strategic Plan. In Goal 1 (“Science”), SOHO’s mission maps directly to the Objective, “Understand our changing Sun and its effects throughout the solar system.” The “Near-Term” (2000 – 2005) plan to achieve this objective, “Study the dynamics of the Sun’s atmosphere and interior, research the interactions between the solar wind and earth’s magnetosphere, and view solar coronal mass ejections in 3-D,” is precisely what SOHO has been doing for the last five years, and what we here propose to continue for another four — with the exception of 3-D viewing, which must await the STEREO mission. Beyond 2005, SOHO’s vantage point will provide an earth-Sun line view with coronagraphs and full-disk, EUV imaging that complement many STEREO science objectives.
Goal 2 (“Support Human Space Flight”) has as its second, immediate objective, “Develop the knowledge to improve space weather forecasting.” As will be shown in Section III and IV, not only has SOHO revolutionized our ability to predict earthward-directed disturbances by giving up to three days’ advance notice, but methods are being tested that would predict those disturbances’ geoffectiveness by providing predictions of the amount of Bz-southward magnetic flux carried in them. The Near-Term plan to “[a]nalyze the dynamics of the Sun’s atmosphere and interior” is what SOHO has been doing, and can continue to do throughout the 2002 – 2005 period, with unique and original insights. No proposed follow-on has the broad array of spectrographs, imagers, coronagraphs, and in situ experiments carried by SOHO.
Goal 4 (“Education and Public Outreach”) is one of SOHO’s most outstanding — and most cost-effective — contributions to the NASA program and, indeed, its most obvious return to the taxpayers who pay for NASA’s share in the mission. We have met, both working on our own and through the SEC Education Forum, the objective of sharing “the excitement of space science discoveries with the public” through six Space Science Updates, a major, traveling museum exhibit, numerous press releases, hyperactive Web sites, teacher curriculum development workshops, public talks, and the ubiquitous adoption of time-lapse movies of SOHO images by broadcast and narrowcast providers of video. The contributions of SOHO, Yohkoh, TRACE, and POLAR to the awesome vision of the IMAX film SOLARMAX both showcase images of astounding aesthetic value and make large numbers of the public aware of the origins and effects of space weather in a way no other medium could.
We have also addressed the goal of enhancing “the quality of science, mathematics, and technology education, particularly at the precollege level,” not just by producing effective educational media (CD-ROM’s, lithograph sets, posters, and Web sites), but more directly by the teacher workshops, teacher involvement in course materials preparation, partnering with historically underserved institutions, and representation at NSTA and regional teachers’ conferences — activities with proven multiplier effects. Finally, to meet the third objective, “[helping] create our 21st century scientific and technical workforce,” we have not only provided the motivation and supervision for 40 Ph.D. theses, but have hired high-school and undergraduate as well as graduate students to work with the SOHO PI teams and at the SOHO operations and analysis facilities.

3
In all cases, we intend to meet the Near-Term plan by continuing to “[i]ntegrate education and public understanding of science into our missions and research programs, establish strong and lasting partner-ships between the space science and education communities, and provide ready access to the products of space science education and outreach programs.” In Section V, we highlight a few current SOHO education and outreach activities; in Section VII, we propose to expand our marginally-funded efforts in order to reach a wider community with educationally meaningful materials.
III. Scientific Insights from SOHO, 1998 – 2001
Ubiquity SOHO enjoys a remarkable “market share” in the worldwide solar physics community: over 800 papers in refereed journals in the last four years (not counting refereed conference proceedings, which generally duplicate journal articles), representing the work of some one thousand scientists. Even accounting for the number of heliospheric papers and authors in those numbers, it is not too much of an exaggeration to say that virtually every living solar physicist has had access to SOHO data. (See Appendix A.)
We can assert that with confidence because so many of the SOHO experiments make all their data available, online, on the Web, through the SOHO archive and PI sites. In addition to professional access, amateurs routinely download LASCO FITS files and GIF images to search for new comets. As a result, 300 of the 1210 comets for which orbital elements have been determined (since 1761) were discovered by SOHO, and more than half of those by amateurs accessing LASCO data via the Web. Similarly, 300,000 people across the world routinely download LASCO, EIT, and MDI images up to 48 times daily as their SOHO screensavers update themselves.
The following, brief descriptions of scientific insights gained from SOHO have been gleaned from papers published in, or recently submitted to, refereed journals. Scientific insights from the prime phase of the mission (FY1996 – FY1997) were covered in the proposal to the 1997 Senior Review.
The Solar Interior and Total Irradiance
Total solar irradiance variations The VIRGO instrument measures both total solar irradiance (TSI) and spectral irradiance, the latter in three bands (centered at 402, 500 and 862 nm). The TSI measurements are made with two separate radiometers; this allows for precise correction for long-term drifts in response due to exposure to solar UV (Figure 1, see cover, middle). Fligge, Solanki, and Unruh (2000) have used MDI magnetogram data, rather than chromospheric proxies, to model VIRGO spectral irradiance variations on a time scale of days and less with great success. This reinforces the view that most solar irradiance variations are associated with magnetic features.
Still no g-modes Appourchaux et al. (2000) have combined VIRGO, MDI, and ground-based low-l measurements to place an upper limit of 10 mm s-1 on the amplitude of solar g-modes. The GOLF team have identified candidate “modes” of insufficient significance at the 7 mm s-1 level. The search continues.
The deep interior The deduction of properties of the nuclear energy generating regions of the solar core depends on the combination of high precision, low-l mode frequencies. Due to their long lifetimes the lowest frequency modes contribute the highest quality of information per measurement. For this reason and due to the differing eigenmode structure, the identification of even a few modes in the low frequency range has a large impact on the quality of the deduced solar structure. Bertello et al. (2000) and Garcia et al, (2001) have recently identified and measured the frequencies of several new, low frequency modes in GOLF data, using the asymmetric fitting methods pioneered by Toutain et al. (1998) to match MDI and VIRGO LOI measurements. These mode frequencies have been combined with results from higher l modes and higher frequency modes (measured by MDI) to yield a new “Seismic Solar Model” which is shown in Figure 2.

4
In this model, the abundances and the cross-section for the proton-proton reaction have been modified within their acceptable error range to adjust the model toward best agreement between the deduced frequencies and those observed from MDI and GOLF. Because the solar model is now con-strained by the helioseismic data, the errors mostly reflect the comparison of two different sets of measurements (helioseismic frequencies and neu-trino counting rates) instead of errors in the input physics. This result indi-cates that the discrepancy must be resolved by means of modified neu-trino physics.
The tachocline and convection zone Schou et al. (1998), using seven differ-ent inversion methods to assure confi-
dence in results from long-term MDI measurements, were able to detect alternating bands, 10 – 15° of latitude in width, of slightly faster and slower rotational speed below the visible surface (Figure 3). This is in agreement with groundbased Doppler measurements of simi-lar effects at the visible surface.
Howe et al. (2000b) also used global p-modes to detect the zonal flows of the torsional oscillation, and found that these penetrate to a depth of at least 56 Mm. This work led to the detection of a variation in the rotation rate near the bottom of the convection zone with a 1.3 year period (Howe et al. 2000a).
The extended solar cycle The work of Howe et al. (2000b) and Giles (1999) shows the equator-ward migration of the torsional oscillation bands (zonal flows), and the overlapping beginning of a new cycle of bands, in agreement with groundbased observations of magnetic field and coronal morphology evolution (e.g. Altrock 1997, Solar. Phys., 170, 411). Each new, 19 – 20 year cycle can be detected in magnetic polarity at high latitude just after solar maximum, both in ephemeral regions and in large scale measures of toroidal field.
Helioseismic imaging of the solar farside Lindsey and Braun (2000) were able to obtain the first images of the far (invisible) hemisphere of the Sun using a holographic reconstruction of information from p-modes observed on the visible hemisphere with MDI. The features in such images (Figure 4) represent areas of differing sound speed; the sound speed is modified by the presence of magnetic fields, so the features generally correspond to active regions.
–0.010
0.010
0.005
0.000
–0.005
(c2 e
xp–
c2 th
) /c
2 th
0.0 0.2 0.4 0.6 0.8 1.0r/R
Saclay Reference Solar Model, Brun, Turck-Chièze, Zahn(1999).
Saclay Model with enhanced diffusion in the tachocline
Seismic Solar Model
Figure 2. A recent model of the solar interior (Turck-Chièze et al, 2001) is able to resolve sound speed discrepancies with earlier models in the deep
interior — but still predicts 2 – 3 times the electron neutrino fluxes observed by various detection methods.
Figure 3. Near-surface zonal flow patterns from MDI. The figure show the differ-ence of the rotation inferences, from a smooth latitudinal variation, in nHz at 0.99
solar radii.

5
Helioseismic response to surface events Kosovichev and Zharkova (1998) used MDI “hi-rate” data (obtainable only during realtime contact with SOHO) to obtain the first obser-vations of a helioseismic response to an X9 flare: a series of concentric, expanding wavefronts reflected several tens of Mm below the surface (Figure 5). Such observations, if repeatable, could be used both as a probe of immediate sub-surface structure and a test of flare momentum deposition models. This observing mode is available only inter-mittently, and the Sun does not always cooperate by producing X flares during those times. The expected fre-quency of X flares in the first 2 – 3 years of the decline from solar maximum, however, gives promise of fur-ther observations of this kind.
The Solar Atmosphere
The “magnetic carpet” Just after the last Senior Review in 1997, Schrijver et al. (1997) showed that MDI photospheric magnetic field observations supported the model of a shallow, turbulent dynamo that replaces the ubiquitous, small-scale magnetic fields in the photosphere every 1.5 – 3 days. Coupled with the observation that small dipoles migrate toward the magnetic network, and therein to the intersections of network cells, where they disappear, this finding gives promise of establishing magnetic reconnection at the network vertices as the source of coronal heating.
Pres and Phillips (1999) then studied quiet Sun coronal bright points, using EIT Fe XII (1.5 MK) images, and found the bright points to have a time evolution from birth to decay that is extremely well correlated with the ~2-day lifetime of magnetic flux determined from photospheric magnetograms obtained with MDI. They found that radiative losses from the bright points are much less than conductive losses, but the sum of the two is comparable with the available energy of the associated magnetic field, with the radiative losses ~ 3 – 10% of the field energy. Since bright points occur over vertices in the magnetic network, and the energy in the field of such features, summed over the solar surface, is of order 103 times that necessary to heat the corona, we may at last be nearing a solution to that long-standing problem in solar physics.
Coronal heating: nanoflares Klimchuk and Cargill (2001) have simulated observations of model coronal loops that are heated randomly and impulsively by nanoflares. They find that the emission measures, densities, and filling factors (Es, ns, and φs, respectively) that are inferred from spectral line intensities are generally an excellent representation of the properties of a nanoflare-heated plasma. To better than 25% in most cases, Es indicates the amount of material present in the temperature interval centered on the peak of the line contribution function, ns indicates the average density of this material, and φs reflects the
Figure 5. Waves reflected from subsurface layers after the deposition low in the atmo-sphere of energy associated with an X2 flare
Figure 4. Holographic helioseismic imaging of sound speed variations, caused by concentrations
of magnetic field, as imaged on the visible (“Earth-side”) and invisible hemispheres of the Sun using
MDI. The solar equator is the horizontal line at the center of each image; half a solar rotation separates
each pair of images, from top to bottom.

6
fraction of the total volume that the material occupies. In addition to supporting the nanoflare model, this work offers improved diagnostics for CDS, SUMER, and future EUV spectrograph measurements.
Coronal dimmings Thompson et al. (1998) found areas of rapid dimming in the EUV corona near, but much larger than, the active region where the CME origi-nates. (The issue of causality between flares and CME’s is not one that can be addressed with the time and spa-tial coverage of the SOHO coronal instruments, but we note that some cases of coronal mass ejections without flares have been observed.) These dimmings, apparent at all temperatures observed by EIT, represent real loss of column mass. Harrison and Lyons (2000) used CDS measurements to show that the dimming in a small CME represents on the order of half of the total mass ejected.
Flows in EUV lines For some time, it has been known that “transition region” lines (i.e., those formed at elec-tron temperatures of 0.01 to some 0.1’s of MK) show a net downflow over the disk. Peter and Judge (1999), using precise SUMER determinations of rest wavelengths, have extended this work to lines formed at the transition to coronal temperatures (Te > 0.6MK) and found blueshifts for the hotter lines (Figure 6).
The coronal temperature in coronal holes Using the CDS and SUMER spectrographs, David et al. (1998) determined that the electron temperature in a coronal hole peaks (Figure 7) at a value of < 1 MK at 0.16 solar radii (111 Mm) above the solar surface, and falls off above that to only 0.4 MK at 0.35 solar radii (245 Mm). David and his coauthors conclude from these measure-ments that an solar wind dominated by electron conduction alone cannot explain the observed solar wind velocities, which are therefore likely to be due to the direct transfer of momentum from MHD waves to the ambient plasma — as seen in broad line profiles measured by UVCS higher in the corona.
The source of the solar wind in coronal holes Using SUMER, Hassler et al. (1999) found that outflow measured in a coro-nal line of Ne VIII (formed at 0.63 MK) was concentrated over the vertices of the
underlying chromospheric magnetic network, as defined by Si II brightness, in the low-latitude extension of a polar coronal hole (Fig. 8, see cover, top). Since only downflows are observed over the network in cooler lines (e.g. of O V, formed at 0.25 MK, observed by Banerjee, O’Shea, and Doyle (2000)) in similar holes, the solar wind in holes apparently becomes visible at temperatures of ~ 0.6 MK.
Low-latitude coronal holes Miralles et al. (2001) used UVCS to compare trans-equatorial coronal hole plasma properties to those measured in polar holes, and found that outflow speeds and perpendicular
Figure 6. The average flow speed for “transition region” and coronal lines. Above about 0.5MK,
the flow is outward.
Figure 7. SUMER measurements of Te in a coronal hole and in the quiet corona

7
most-probable speeds in O5+ were ~ 3 times lower at a given height than in large polar holes at solar minimum. Since ACE measurements at 1 AU in the same low-latitude holes show wind speeds of 600 – 700 km s-1, one must conclude that most of the wind acceleration in the low-latitude holes is occurring above 3 solar radii, while in the polar holes, it occurs below that height.
The helium abundance in the corona Laming and Feldman (2001) used SUMER to obtain two independent values for the He/H abundance ratio. From comparison of He and O lines, and an adjustment of the electron collision rates for He II (to include more levels, cascades, and radiative recombination), they obtain a ratio [He/H] = 0.038 ± 0.006. From comparison of line strengths of He and the H I Balmer series, they arrive at a value of 0.052 ± 0.005, similar to He abundances determined in the slow solar wind. The lower value from the first method is likely due to gravitational settling of O in the solar atmosphere.
Abundances in streamers UVCS observations published in the prime mission phase show that at solar minimum, O abundance was 0.1 of the photospheric value in the core of streamers and 0.33 along streamer “legs.” Raymond (1999) showed that the abundances of low first ionization potential (FIP) elements such as Si and Fe were enhanced by a factor of 3, relative to high-FIP elements. While the core abundances give evidence of heavy element gravitational settling in closed structures, the abundances in the streamer “legs” are consistent with those measured in the slow solar wind. At least tentatively, therefore, we may identify the source of the slow wind with the legs of streamers.
Plasma β in coronal streamers Li et al. (1998) used densities derived from UVCS spectra and YohkohSXT filtergrams, and a potential field extrapolation from groundbased magnetograms, to show that the plasma β in streamers is of order unity at 0.5 solar radii above the surface. This finding is consistent with the models of Suess et al. (1999, SolWind IX, ) that indicate that stable streamers can exist with such values of β.
Coronal mass ejections (CMEs) Ciaravella et al. (2001), using UVCS, have observed an unusually narrow, bright, hot (visible in [Fe XVIII], for example) feature between a CME observed in LASCO C2 and the post-CME aracade observed in EIT — precisely where numerous models of rising flux ropes predict reconnection to occur (Figure 9).
Using LASCO data, Dere et al. (1999) found evi-dence for helical structures in CMEs.. About one third of all CMEs seem to show this sig-nature (St Cyr et al. 2000), which Chen et al. (1999) identify with magnetic flux ropes. This property matches that of the canonical, inter-planetary magnetic cloud.
Akmal et al. (2001) used UVCS to obtain the first observations of C III, O V, and O VI lines at 2.5 solar radii above the surface in a CME. Their measurements show that the heating necessary to continue producing these lines so far from the surface is of the same order as the total kinetic energy of the CME.
Coronal plumes Deforest and Gurman (1998) found intensity oscillations in polar coronal plumes using EIT observations of 1.5MK plasma, but those authors could only speculate on whether the oscillations represented wave motions. Using the CDS normal-incidence spec-
Figure 9. A combined view (top) of an EIT image of post-CME loops, a LASCO C2 image of the CME, and the intensity of a forbidden spectral line of Fe XVIII, formed at 6 MK, along the UVCS slit. This view may match the Forbes (2000, JGR, 105,
2375) cartoon (bottom) showing the current sheet where reconnec-tion takes place in such events.

8
trograph, Bannerjee, O’Shea, and Doyle (2000) have found oscillations in polar plumes with periods of 11 – 25 minutes. The velocity-intensity phase relation in these oscillations indicates compressive waves, which may help heat the lower corona.
Infalling coronal mass Wang et al. (1999) found evidence of inflowing mass in LASCO C2 observations; Sheeley et al. (2001) have recently found that these inflows in the 2-5R
§ field of view of C2 persist for
months at a time at specific longitudes where the gradient of the coronal magnetic field is large. Sheeley et al. believe the inflows represent collapsing magnetic fields and flatten distortions of the streamer belt; that is, of the heliospheric magnetic field. The inflows are thus linked to the evolution of the Sun’s large-scale field, and, in particular, their occurrence can be deduced from synoptic observations of the photospheric field, and thus extrapolated back to times before the SOHO mission.
EUV spectral irradiance Brekke et al. (2000) used full-disk CDS spectra, calibrated by means of a rocket underflight, to produce “Sun as a star” EUV irradiance measurements in the band 30.7-38.0 nm and 51.5-63.2 nm with 0.03 to 0.06 nm resolution. These measurements, continued through the SOHO mission, represent the only total solar EUV spectral irradiance measurements available until the launch of TIMED with the SEE instrument later this year.
Solar Flares With the increase in solar activity, more flare observations have become possible. Cza-ykowska et al. (1999) found from observations of spectral lines formed between 0.25 and 8 MK that while transition region and coronal line-of-sight velocity gradients were largest in the vicinity of Hα flare ribbons, areas immediately outside the flare ribbons continued to show upflows throughout the gradual phase of the flare. They interpret this as evidence for chromospheric evaporation driven by continuing magnetic reconnection that continues for hours in such events.
Yokoyama et al. (2000) observed a flare-related plasmoid ejection with Yohkoh SXT and EIT; they inter-preted the EUV observations of inflow toward an apparent X-type neutral point as evidence for reconnec-tion. If this interpretation is correct, the reconnection rate is between 0.001 and 0.03 of the Mach number of the flow.
The Heliosphere
Energetic particles Torsti et al.(1999) found the initial acceleration of > 10 MeV particles in an SEP event occurred when the “EIT” (coronal Moreton) wave propagated to the Earth-connected interplanetary magnetic field line. A second stage of acceleration, from CME-driven shock interactions, was observed as well, with a softer spectrum.
Kocharov et al. (2001) have found that the population of ~10 MeV protons accelerated by a CME is correlated with the acceleration of the CME.
Solar wind: origins The high ion temperatures and relatively low freeze-in heights for O5+ observed by UVCS in polar coronal holes at solar minimum have led to a model of high-speed wind acceleration requiring high frequency (10 Hz – 10 kHz) waves high in the corona and not near the solar surface (Cranmer 2000).
Using UVCS, Kohl et al. (1999) have shown that polar plumes have significantly lower ion kinetic temperatures than the lower density, interplume regions, while Giordano et al. (2000) similarly found lower outflow speeds in the plumes than between them. These findings put on a solid footing earlier inferences that the wind in coronal holes originates not in the plumes but primarily in the hotter, less dense, interplume regions.
Using CELIAS CTOF, EIT, and WIND data, Hefti et al. (2000) found the O7+/O6+ ionization freeze-in temperature to be 1.6 MK, with variability on time scales of 5 minutes implying source scales ~ 1 Mm at the Sun. Esser and Edgar (2000) explain the discrepancy between such in situ measurements of electron temperature and those determined spectroscopically (e.g. Figure A-3) with electron distribution functions

9
that are Maxwellian or nearly so at the base of the corona, but become non-Maxwellian rapidly with height. Even so, ions of different elements must have significantly different flow speeds to separate their ``freezing-in’’ distances sufficiently so that they can encounter different distribution functions.
Solar wind: composition Bochsler et al. (2000) used CELIAS MTOF to determine the abundance of Al, a low first ionization potential (FIP) and ultra-low first ionization time (FIT) element, in interstream (low wind speed) and low-latitude coronal hole (high-speed stream) solar wind. They found that the ratio of Al and Mg (both low-FIP, refractory elements) abundances was the same in both wind speed environments, to within the experimental error, and consistent with meteoritic (“solar system”) values. While there is a FIT effect for fractionation that distinguishes short (< a few seconds) and long first ionization time elements, this result rules out further FIT-dependent differences between elements with FITs on the order of 1 s (e.g. Mg) and one (Al) with a FIT an order of magnitude shorter.
Solar wind: propagation effects A paper submitted by Coplan et al. to JGR in December of 2000 examines correlations between solar wind proton observations from SOHO and WIND. Time delays between the two satellites in excess of the advection time are explained in terms of disturbance fronts, propagating radially but inclined at a preferred angle to the radial direction. These fronts’ azimuth angles are in the same quadrant as the Parker spiral angle on the average.
Solar wind: anisotropies Most hydrogen atoms in the interstellar flow are destroyed by charge-exchange reactions with solar wind protons. During solar minimum (1996-1997), the Lyman α sky pattern recorded by SWAN revealed a strong deficit of H atoms near the equatorial plane of the sun, showing that the slow solar wind, concentrated near this plane (± 20°), had a mass flux 40 % larger than the flux of fast solar wind emitted at higher solar latitudes (Kyrölä et al. 1998, Quémerais et al. 1999). At solar maximum (2000 – 2001), however, the solar wind mass flux appears constant with latitude (isotropy), at least when averaged over 1-2 solar rotations.
A related effect has been observed by UVCS: the intensity of He I 58.4 nm scattered from the helium focusing cone has decreased by a factor of three since solar minimum.
Comets Neugebauer et al. (2000) compared the solar wind oxygen density from CELIAS/MTOF and OmniWeb solar wind proton data with the variable X-ray emission from Comet Hyakutake observed by ROSAT and EUVE. A good correlation was found between the X-rays and O ion fluxes but a poorer correlation with proton flux. This is in accord with models which explain cometary X-ray emission via charge exchange between solar wind heavy ions and cometary neutrals species.
When approaching the Sun, an icy comet nucleus will sublimate, producing a cloud of H2O. These water molecules are photodissociated by solar UV radiation, producing a large cloud of H atoms around the comet, reemitting the solar Lα photons in all directions. A simple model of this effect allows the retrieval of the water production rate QH2O of the comet as a function of orbital position from SWAN Lα intensity maps of the hydrogen comet cloud. This quantity is usually impossible to determine from the ground based observations.
SWAN has been used to measure the water production of some 25 comets. Of particular interest are:• Comet B2 Hyakutake in 1996, which passed very near from earth (at 0.11 AU), and for which was
seen for the first time the development of the cloud of hydrogen consecutive to a fragmentation (Bertaux et al., 1998);
• Comet Hale-Bopp in 1997, which produced 300 tons per second of water; the hydrogen cloud extended over 100 million km, making it the largest object in the solar system;
• Three short period comets that are the targets of three space missions: Comet Wirtanen (ESA/Rosetta; Bertaux et al. 1999), Comet Encke (NASA/Contour), and Comet Wild 2 (NASA/ Stardust); and
• SWAN discovered a comet (C/1997 K2) by its Lα signature that was not observed by any other means (Mäkinen et al. 2000)

10
In addition, SWAN measured the total amount of water ice contained in the nucleus of C/1999 S4 (LINEAR) before it disintegrated completely just before perihelion. When combined with HST observa-tions of some nucleus fragments, these results indicate that the ice density may have been of the order of 15 kg/m3, a parameter largely unknown prior to SWAN measurements.
Biesecker et al. (2001) studied sungrazing comets in LASCO images (all members of the Kreutz group), and found that the number of Kreutz family members discovered each year has remained approximately constant. None of the comets have been detected post-perihelion. The individual comets can be related to one of two “standard candles,” which they call Universal Curves. The comets all reach a peak brightness at one of two characteristic distances (both near 12 solar radii). In addition, the comets fragment at another characteristic distance (about 6 solar radii), due to thermal or gravitational stress (or both). The study also found evidence for line emission which varies with heliocentric distance.
The interstellar connection Costa et al. (1999) have found from SWAN measurements a deceleration in the interstellar H flow of 2.5 to 4.5 km s-1 at the heliopause, and shown a minimum in H temperature between the upwind and crosswind directions; this may indicate the existence of two distinct populations at different velocities (primary and secondary IS atoms), as predicted by heliosphere-interstellar gas interface models.
Space WeatherCoronal waves Perhaps the most striking discovery with the combination of the LASCO C2 and C3 coronagraphs and EIT was the ubiquity of waves propagating in the low corona (Thompson et al. 1998), as observed in the EUV, coincident with the onset of “halo” CME’s directed toward the earth. This finding makes possible the simple, visual (from images and movies posted on the worldwide Web) prediction of space weather events likely to affect geospace. Near-realtime LASCO and EIT movies are now used reg-ularly by NOAA Space Envi-ronment Center forecasters.
CME frequency St. Cyr et al. (2000) examined LASCO CME statistics through the inter-ruption in the SOHO mission (1998 June), and found that the CME rate for the current cycle was within the obser-vational uncertainty of mea-surements in previous solar cycles. An updated study (St. Cyr 2001, private commu-nication), however, shows a significantly larger range in CME rate (Figure 10) than in the previous cycle, perhaps because of the greater dynamic range of the SOHO coronagraphs that that of ear-lier instrumentation.
Shockspotters The CELIAS MTOF group at the University of Maryland recently implemented a “Shockspotter” program (developed to identify interplanetary shocks in near-real time using proton monitor data) to analyze the temporal distribution of shocks. The Shockspotter program is now part of the proton monitor realtime data page at http://umtof.umd.edu/pm . The Maryland CELIAS group has also developed Web pages that show the solar energetic particle flux deduced from proton monitor background levels (http://umtof.umd.edu/pm/are) and the solar soft X-ray flux from SEM measure-ments (http://umtof.umd.edu/sem/).
Figure 10. The CME rate continued to grow into late 2000.
11
IV. The Promise of a SOHO Solar Cycle Mission, 2002 – 2005
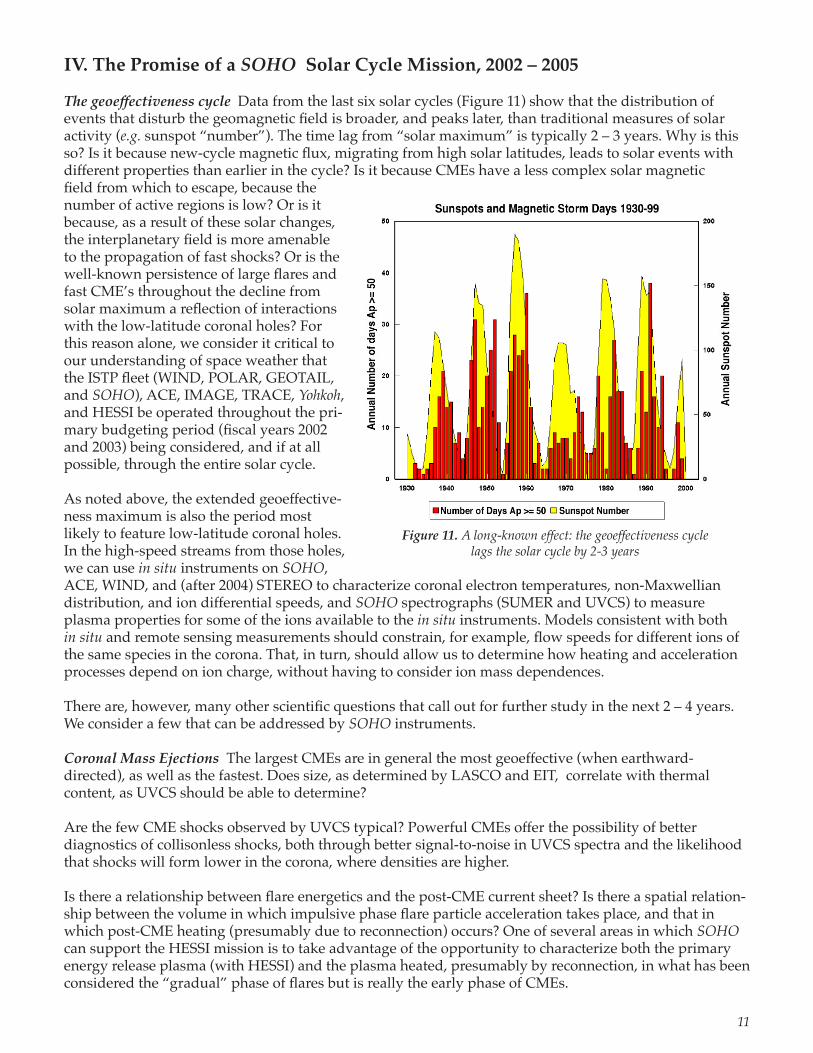
The geoeffectiveness cycle Data from the last six solar cycles (Figure 11) show that the distribution of events that disturb the geomagnetic field is broader, and peaks later, than traditional measures of solar activity (e.g. sunspot “number”). The time lag from “solar maximum” is typically 2 – 3 years. Why is this so? Is it because new-cycle magnetic flux, migrating from high solar latitudes, leads to solar events with different properties than earlier in the cycle? Is it because CMEs have a less complex solar magnetic field from which to escape, because the number of active regions is low? Or is it because, as a result of these solar changes, the interplanetary field is more amenable to the propagation of fast shocks? Or is the well-known persistence of large flares and fast CME’s throughout the decline from solar maximum a reflection of interactions with the low-latitude coronal holes? For this reason alone, we consider it critical to our understanding of space weather that the ISTP fleet (WIND, POLAR, GEOTAIL, and SOHO), ACE, IMAGE, TRACE, Yohkoh, and HESSI be operated throughout the pri-mary budgeting period (fiscal years 2002 and 2003) being considered, and if at all possible, through the entire solar cycle.
As noted above, the extended geoeffective-ness maximum is also the period most likely to feature low-latitude coronal holes. In the high-speed streams from those holes, we can use in situ instruments on SOHO, ACE, WIND, and (after 2004) STEREO to characterize coronal electron temperatures, non-Maxwellian distribution, and ion differential speeds, and SOHO spectrographs (SUMER and UVCS) to measure plasma properties for some of the ions available to the in situ instruments. Models consistent with both in situ and remote sensing measurements should constrain, for example, flow speeds for different ions of the same species in the corona. That, in turn, should allow us to determine how heating and acceleration processes depend on ion charge, without having to consider ion mass dependences.
There are, however, many other scientific questions that call out for further study in the next 2 – 4 years. We consider a few that can be addressed by SOHO instruments.
Coronal Mass Ejections The largest CMEs are in general the most geoeffective (when earthward-directed), as well as the fastest. Does size, as determined by LASCO and EIT, correlate with thermal content, as UVCS should be able to determine?
Are the few CME shocks observed by UVCS typical? Powerful CMEs offer the possibility of better diagnostics of collisonless shocks, both through better signal-to-noise in UVCS spectra and the likelihood that shocks will form lower in the corona, where densities are higher.
Is there a relationship between flare energetics and the post-CME current sheet? Is there a spatial relation-ship between the volume in which impulsive phase flare particle acceleration takes place, and that in which post-CME heating (presumably due to reconnection) occurs? One of several areas in which SOHO can support the HESSI mission is to take advantage of the opportunity to characterize both the primary energy release plasma (with HESSI) and the plasma heated, presumably by reconnection, in what has been considered the “gradual” phase of flares but is really the early phase of CMEs.
Figure 11. A long-known effect: the geoeffectiveness cycle lags the solar cycle by 2-3 years

12
Will the latitude of origin of CMEs evolve gradually back to the dipole streamer belt, or will it shift abruptly from its current, broad distribution in latitude?
What is the temperature structure of CMEs? This is an area that is only now beginning to be treated with UVCS. We should be able to distinguish among contributions from wave heating (which should heat ions preferentially), thermal conduction (electrons), and reconnection (which may leave a filamentary signature of heated and unheated volumes).
Acceleration of the solar wind Polar coronal holes are enlarged by episodic surges of alternating-polarity magnetic flux bundles moving poleward from mid-latitudes. The UVCS predecessor rocket flights gave some evidence that fast wind flow from the polar holes may reach solar minimum values even before the holes reach their solar minimum extent. UVCS measurements of high-latitude holes in the last year have shown O5+ line profiles broadening again — similar to their appearance at solar minimum. A solar-cycle-long SOHO mission would thus give us the opportunity to understand the full life cycle of polar coronal holes, the source of much of the solar wind flow for a significant part of the solar cycle.
UVCS measurements of density and ion kinetic temperature perpendicular to the magnetic field show an apparent anticorrelation. Is this because higher density regions are collision-dominated, or is there a density dependence of ion cyclotron wave generation and dissipation? Spectroscopic observations at the solar cycle phase when polar holes and the dipole streamer belt are growing rapidly will provide new insights.
The heliospheric magnetic field, and its origin, the solar magnetic field will be “relaxing” over the next few years to their simpler, solar minimum configurations. Do coronal streamer properties change smoothly or abruptly during this period? Do the same physical processes heat streamers and accelerate the slow solar wind? If not, can we distinguish which processes are responsible for each?
Helioseismology We have evidence of large scale, organized subsurface (near surface) flows toward active regions in MDI data (special, “continuous contact” runs of 2 – 3 months each spring-summer) from 1997 – 1999. The Sun was too quiet in 1996, and MDI obtained too little data of this kind in 2000 to allow a definitive conclusion. Each of those samples represents only two solar rotations, so we do not yet know how these flows evolve and relate to the growth/decay phases of activity. Do such flows drive the emergence and decay processes for solar active regions? It is important to obtain additional samples in the declining phase of the solar cycle — the next opportunity will not come until after 2012.
That sound wave speed is enhanced beneath magnetic fields is now well established (e.g. Braun and Lindsey 1999) for sunspots (Figure 12, see cover, bottom), plage, and even pores. Similarly, Zhao, Kosovichev, and Duvall (2001) have shown that there is an ordered flow beneath large sunspots. Can we derive space weather predictive information from such diagnostics?
How does the velocity shear at the tachocline vary? The tachocline (shear layer at the base of the convection zone) near the equator shows variations in the strength of the shear with about a 1.3 year period (Figure 13). This variation is not yet understood and its implica-tions are not yet understood. It has withstood a number of tests of real-ity and the result remains intact. We anticipate the opportunity of seeing what happens in the declining phase of the solar cycle.Figure 13. Zonal flows as a function of depth and latitude, separated
by only six months. How do they vary over a solar activity cycle?

13
How does the poleward flow vary with depth, latitude, and phase of the solar cycle? The existence of a poleward flow of 10-20 m/s at the surface has been known for two cycles but only with MDI observations has it been well characterized and observed to extend into at least the first 10% of the convection zone, by depth. There is at best a suggestion in the noisy, groundbased data that the poleward flow extends only to lower latitudes in the years nearer to maximum. This possible variation with the cycle is a topic of current investigation with SOHO.
Geoeffectiveness of CMEs CMEs are only geoeffective when they contain or drive several hours of southward Bz when they arrive at Earth. It has been shown that field extrapolations based on the photospheric magnetic field underlying the areas where CMEs erupt yield good estimates of the Bz. Recent developments in processing of MDI magnetograms has led to the concept of “synoptic frame” in which synoptic, whole-Sun Carrington grids of magnetic field (Figure 14) are supplemented by rapidly updated magnetic information for the visible disk. Initial analyses of these data are promising and may lead to better estimates of the sign and strength of the Bz component of the field carried by CMEs. Tools to use these data are presently being developed by Luhmann and Li.
The extended solar cycle As noted in II, above, there are several solar parameters that vary with a cycle time longer than 11 years. There are at least three aspects to the extended cycle that can be examined with continued MDI observations into the declining and minimum phases of the cycle.• There is evidence that the toroidal component of the field can be detected in MDI magnetograms. We
can watch the emergence of high latitude new cycle fields, measure their torroidal component, and detect the interractions of cycle 24 fields with cycle 23 fields.
• MDI magnetograms, obtained every 96 minutes, can be used to study the emergence of ephemeral regions at high latitude. We can thus study, in greater detail than possible from the ground, the life-cycle of the new cycle, emerging regions in order to compare them to cycle 23 ephemeral region: are there significant differences? This study will also lead to better understanding of the connections between cycle 23 and cycle 24 fields.
• We can continue to study the zonal flows in the convection zone. Historical data predicts that we will shortly be able to detect the shear zone which will later be associated with the centerline of cycle-24 activity. By watching this process unfold within the convection zone we should gain insight into the operation of the cycle dynamo, or at least further constrain models.
Figure 14. Can synoptic magnetic maps such as this, updated in near realtime, be used to predict the geoeffectiveness of CME’s?

14
V. Education and Public Outreach
Ostensibly, E&PO is not “scientific,” at least not for members of our community. The SOHO PI teams, however, are motivated to make as much of our data and our discoveries, as well as the knowledge gleaned from them, accessible by the public at large — in SOHO’s case, the worldwide public.
We believe that the only effective ways to use SOHO data and scientists in pre-college education are those that have large multiplier values; i.e., that reach out to far more people than a single scientist can see at one time. Scientist visits (which many SOHO scientists do) to classrooms are effective for one classroom at a time, and energizing for the scientists, but there are simply not enough SEC scientists to visit every science classroom in America (and Europe).
Multiplier activities in education In addition to numerous classroom visits (little multiplier effect, but very energizing), the SOHO PI team scientists and the SOHO media specialist have have:• helped produce the Secrets of the Sun Turnstone Explorer Textbook; provided interviews, images, and
text for this 8th grade science textbook with an associated teachers guide, CD-ROM, and videotape (these teaching materials are being used in middle schools across the country),
• developed and distributed informative and educational posters including a constructible spectrom-eter, more than 12,000 requests for which, the majority coming from educators, have been received,
• developed short videos to accompany the spectrometer poster; one of these has been adopted by NASA as part of its core program materials for distribution to schools,
• participated in the SOHO 5th Year Anniversary and Sun-Earth Days 2001: dozens of PI team members and colleagues gave talks in public venues across the US and Europe, some of them televised,
• had extensive interactions with the Passport to Knowledge series of three educational TV programs (Live from the Sun), with teacher’s kits and a related web site,
• developed and produced live webcasts in cooperation with the Learning Technologies Channel program at NASA Ames Research Center, NASA TV, and the Chabot Center,
• produced four versions of the educational CD-ROM, The Dynamic Sun (over 100,000 distributed to date),
• produced and distributed 100,000 educational posters (one series in both English and Spanish),• created and updated artwork and educational text for the widely used SOHO lithograph portfolio
(over 30,000 sets distributed), and• partnered with Southern University at Baton Rouge (SUBR), an historically minority institution, for
visiting lectures, Web-based tutorials, summer research projects, and mentoring of students.
Public outreach: the ultimate multiplier Not even through Eclipse ’99 or Sun-Earth Day activities can we hope to reach as many taxpayers — the ultimate stakeholders in the scientific enterprise — as we can through narrowcast (Web), broadcast, film, and museums. In the last four years, the SOHO media specialist and SOHO scientists have:• had a critical involvement in the development and design of the $200,000, traveling Space Weather
Exhibit now visiting museums around the US (developed by SSI),• produced video of solar events and released them to news media via professional tape and Web site
within hours, on dozens of occasions,• processed, filtered, and reprocessed SOHO MDI, LASCO, and EIT video featured as the centerpiece
of the SOLARMAX IMAX film,• participated in over 20 teacher workshops (these train teachers to use SOHO and other ISTP resources,
and to train other teachers),• produced SOHO video displays for the (New York) American Museum of Natural History’s new
Rose Center, where the video and a new image and caption each week, are shown on 13 foot video display
15
• represented SOHO and/or Space Science at over 15 major education and outreach conferences (e.g. NSTA),
• provided images to over 75 magazine/book publishers, video or images to at least 12 museums or large display sites, and video to over 25 production companies (e.g. National Geographic Films, Australian Broadcast Corp., BBC, NHK, &c.), and
• supported six NASA Space Science Updates with video and still graphics
SOHO and the popular imagination SOHO has become ingrained in the public perception of the Sun and space weather to a remarkable degree, largely thanks to the efforts of the NASA Goddard Public Affairs Office, the NASA Headquarters Public Affairs Office, and NASA’s Office of Space Science. All have cooperated with researchers from various SOHO experimenters with compelling, new scientific results to showcase them for the media via Space Science Updates (SSUs) and traditional press releases. SSUs reach print, broadcast, and digital media and create a “feeding frenzy” effect that demands the media cover the next SOHO event, and the next. This is a startling effect for a mission that can afford only a single (but multitalented) media specialist, whose video and still image work have been an integral part of every SOHO SSU since 1997. He produces multiple images and movies every week for news media, the NASA PAOs, planetariums, museums, magazines, and other users worldwide.
Similarly, the SOHO Web site, largely maintained by the able ESA SOHO Project Scientist’s office, regularly produces “Hot Shots” on new solar events or science stories. In the first week of 2001 April, for instance, with multiple, large solar flares, CMEs, solar energetic particle events, and aurorae, the SOHO and SDAC Web sites served over 240 Gbyte of movies, images, and information — or an average of 3 Mbps.
The images and digital movies regularly find their way to CNN.com, Space.com, and other heavily trafficked Web sites, which provide yet another method of public exposure to the concept of space weather.
Thanks to the quality of SOHO imagery, and the dynamic nature of the features visible in time-lapse animations from those images in a videophilic age, SOHO has become part of the popular imagination in a way the science community did not anticipate. SOHO movies are used in skin cancer awareness messages; SOHO images are used as stock file photos, labeled only, “The Sun,” on news Websites; SOHO images are used in free giveaways at fast-food chains. When coupled with the diagnostic capabilities of ACE and SOHO’s sister ISTP spacecraft, SOHO imagery has made space weather a household term. Postdocs working on SOHO have been featured in numerous television documentaries and “live shot” interviews, and the experience in dealing with the media they have gained at an early stage in their career has enabled them to become public explicators of Sun-Earth Connections science. Such activities can only benefit public support for SEC programs in the future.
VI. Why Keep SOHO Going?
We are entering the phase of maximum geoeffectiveness in the solar cycle, and the combination of SOHO and other, unique SEC assets now operating can give us new and deeper insights into the subjects as diverse as the physics of coronal mass ejections, the acceleration of the solar wind in a variety of coronal conditions, the evolution of the solar and heliospheric magnetic field, the heliopause, the solar tachocline and zonal flows, and comets.
NASA is in a unique position of attempting to deploy a broad series of follow-on missions to the ISTP missions WIND, POLAR, and SOHO. We believe that the scientific usefulness of the Solar-Terrestrial Probes and LWS missions will be severely compromised if we do not avail ourselves of the opportunity to extend unique observing capabilities through an entire solar cycle.
As we learned inadvertently when SOHO was lost during the summer of 1998, there is a recognition

16
within NASA and other US agencies that SOHO ‘s space weather predictive capabilities are national and international resources that should continue uninterrupted. Until at least the launch of the STEREO spacecraft in early 2005, there are no similar capabilities planned.
The combination of SOHO, Yohkoh, and TRACE is likewise unique in characterizing solar activity, and when joined soon by HESSI, will have the once-in-a-lifetime ability to cover all temporal scales of solar activity from milliseconds to a solar cycle. The interactions of processes on different spatial and temporal scales may never again be accessible in this much detail.
We should also point out that some measurements, such as the search for solar g-modes, the evolution of zonal flows in the convection zone, and the spatial distribution of solar irradiance variations in the EUV, simply require more years of observing before conclusive results can be obtained.
The best reason to continue SOHO science and operations, however, is that while we have made consider-able progress, we have still not realized the full potential of SOHO to explore the diverse parameter space offered by the solar cycle:
We have learned many new things about the solar interior, but still do not understand the time evolution of zonal flows, whether the convergence zones for active region flows drive the latitudinal distribution of the regions over the cycle, or whether there are g-modes in the deep interior.
We have been able for the first time to see the effect of coronal mass ejections on the lowest layers of the corona, to study the Doppler motions and heating characteristics of CME ejecta, and to detect systematic inflows in the corona, but we still do not know what causes CMEs to erupt, nor how they are accelerated, nor whether the variation in the rate is the same from cycle to cycle.
We have made significant progress in understanding the origin and acceleration of solar wind plasma in polar coronal holes, and in extending that understanding to low-latitude holes, but we still need to understand the origins of the slower, low-latitude wind and how the spatial distribution of the wind varies over the solar cycle.
In short, we propose that NASA continue to contribute the costs of operating SOHO and the US-funded PI and lead Co-I science operations tasks throughout the period FY2002 – FY2005 to fulfill the scientific promise of SOHO to answer fundamental questions about the Sun and heliosphere.
Appendix A. SOHO Publication Record, 1997 – 2001Q1
SOHO publication rates through the first quarter of calendar year 2001, can be found in Table A-1.
Calendar Year Total Ref. Journals Only1997 366 1301998 399 1601999 496 3012000 338 2642001Q1 43 31Total 1642 886
Table A-1. SOHO refereed papers
Here, a “SOHO paper” is taken to mean any paper using SOHO data, or concerning models of theoretical interpreta-tions of SOHO measurements. “Total” includes refereed conference proceedings, as well as “refereed journals only,” so the figures in the rightmost column are a subset of those in the middle column.
The first-quarter CY2001 figures can be assumed to be lagging well behind actual numbers, since we are still

17
receiving input on CY2000 papers. Based on past reporting rates and time lag, we can forecast a CY2001 publication rate roughly equal to that in CY2000.
“Market share” In the years since the launch of SOHO, there were 1,057 authors and co-authors of SOHO papers in refereed journals (1,386 for all refereed papers). Since SOHO carries both in situ and remote sensing instruments, there is a large potential pool of authors. Considering just the remote sensing instruments, there are roughly 600 members of the AAS Solar Physics Division and a roughly equal number of active solar physicists in Europe and Asia (combined). Past experience indicates that approximately 75% of those are “active,” in the sense of publishing at least one refereed paper per year. If this is an accurate model of the solar physics community, we can compare that with the figure of 1,068 authors of solar-remote-sensing-only (i.e., no particles or SWAN) papers to determine that SOHO has reached a good approximation to serving 100% of the active solar physics community.
For the in situ community, we have not done nearly as well. This may in part be due to the recent proliferation of in situ measurements of high quality, but given the desire for as many locations of measurement as possible, we find this argument unconvincing. More likely, the relative unavailability of all but key parameter data until recently is the underlying reason for this situation. It should be noted that seven of the eight solar, remote sensing instruments have a completely open data policy that makes their data available nearly as soon as they “hit the ground,” as does TRACE. (The only exception is GOLF, whose data are released in annual increments.)We are convinced that only such a completely open data policy is likely to draw in the widest possible scientific community — including amateurs — to the enterprise of mining SEC data for their maximum scientific return.
Appendix B. Instrument Status as of 2001 April 23
GOLF• Operating nominally• Progressive, expected fall-off in throughput not worrying, and will not prevent GOLF from observing an entire
solar cycle• Continuous observations in red wing of Na D line since SOHO recovery
o Noise in red and blue wings similaro Avoid risk of operation to move to blue wing
• Reserve: redundant data channel validated but unused
VIRGOAll instruments within VIRGO are fully operational and work fine.The degradation of sensitivity is still well within the margins set for operation within specifications and much less than expected from other missions; the main reason being the high degree of cleanliness of instruments and spacecraft.
The only failure we encountered were the PMO6V shutters and the bouncing LOI cover in early 1996. Both problems have been circumvented, the first by using the protective covers and the second by opening the LOI cover with a special procedure in the spacecraft CPU. Since then no further failures occurred and there is no reason to believe that the instruments would not operate for at least another 5 years.
MDIAfter 5 years of operation, MDI is basically working very well. MDI has made about 50 million images. After onboard computations, it has delivered about 8 million raw data images to the ground.• There is an expected degradation in total light throughput likely due to changes in the front window. The
reduction in transmission to March 2001 was about 10%, or about 2.3% per year. Plot of cal-mode brightness. Plot of front window temp.
• There is a reduction in shutter exposure time uniformity from a part in 12000 to a part in 4000. This corresponds to jitter of 40 microsec for a 165 ms exposure. The pre-launch specification was 50 microseconds. So, while still within the pre-launch requirement we will watch for changes. There are is a low impact change to the observing sequence that could reduce shutter usage by about 30%. This will be evaluated if there are further changes. The change occurred in 2000 March.
• There is no detected change in the CCD flat field except for variations with focus change.• The drift in central wavelength of the Michelson interferometer has nearly stopped.
18
• The drift in best focus position has moved the nominal focus setting back almost to the design point. Shortly after launch it was at the limit of the adjustment range.
• The change in image scale is due to the focus change and window temperature. The vertical lines in the plot show times of commanded focus change.
In summary, with the possible exception of the recently detected shutter jitter, there is no known limit to MDI’s useful life within the SOHO expected fuel life.
SUMERLast year we continued to operate SUMER in several campaigns in order to reduce the total counts collected by the detectors as much as possible. In particular, the flare watch campaign in off-limb positions was quite successful in this context, while providing interesting datasets. Most of the observations were obtained with detector A. Detector B, although still fully operational, has reached its highest gain level and is only available for specific tasks that can only performed in the short-wavelength first-order range of this detector. The east-west drive of the telescope mirror - working in high-current mode - caused no difficulties in any of the pointing operations, but cannot be used for raster scans anymore.
It is also important to keep in mind that the next time this mechanism gets stuck, we might not be able to operate it again. This requires careful consideration on the use of this mechanism.
CDSThe detector systems show no signs of degradation above what is expected. The CDS NIS detectors see progressive burn-in. This is a degradation of sensitivity at the locations of the bright emission lines. It is expected and is approaching an asymptotic level for the brighter lines. This gives no cause for concern. The burn-in is carefully monitored and is readily corrected.
The NIS calibration is well understood for data taken prior to the loss of SOHO in 1998. A post-recovery change in sensitivity and its long-term variation is currently being quantified by comparing with the SEM, SERTS and quiet Sun data.
Three of the four CDS GIS detectors are operating nominally. GIS 2 (225-340 Å) is currently turned off due to voltage tripping caused by outgassing from the electronics. The scientific impact is small and we believe this to be recoverable with time. Tests will be resumed this month.
The GIS High voltage is set to 4.8 kV, 1 percent (40 V) below the starting value to maintain the best calibration. No need for further reduction is foreseen. The usable HV range is 4.3-5 kV.
CDS makes an increasing number of flare observations, and there is no sign yet of any impact due to individual flare incidents.
All voltage levels & currents remain stable and well within tolerances.
All critical instrument temperatures remain stable. Some temperature monitors close to thermal blankets show increases due to expected deterioration of the blankets, this causes no major concerns.
All Mechanisms continue to operate satisfactorily.
The Ground system is fully functional and was recently upgraded.
EIT• EIT is nominal• Instrument throughput is decreasing
o Two components: absorption of EUV by a CCD surface contaminant (no longer a problem since uninten-tional bakeout during the SOHO “vacation”), reduction in charge collection efficiency (CCE) in the CCD due to EUV-induced damage (continues)
o CCE loss can be tracked accurately with calibration lamp imageso Degradation now well understood and modeledo Present exposure times range from 12 s (195 Å) to 2 m (284 Å): lots of latitude lefto S/N still very high

19
UVCS• UVCS is expected to continue performing at full scientific capability for many more years.• O VI Detector:
o No significant decrease in efficiency in O VI portion of this detector.o Ly-α portion showed 5 to 10% loss of efficiency on parts of detector at a high voltage of 200 EUo Voltage increase from 200 to 205 EU in January 2000 restored full efficiencyo Max of 250 EU allows nine additional increases of 5 EU.o Voltage increase of 5 EU every 1.2 years is expected to keep the efficiency loss at < 5%.
• Ly-α Detector:o Has been turned off since November 1998 because it draws about 50% of the maximum current and has
regions of elevated background. o This behavior is not related to the mission interruption.o Still operational and treated as a back-up detector for Ly-α observations.
LASCOThe LASCO/C2 and C3 coronagraphs continue to operate with no degradation. Photometric sensitivity is unchanged since launch. The Fabry Pérot interferometer in the LASCO/C1 coronagraph did not survive the extreme cold the instrument experienced (-80C) during the SOHO offpointing.
CELIAS• MTOF/PM, STOF/HSTOF, SEM nominal• CTOF impaired since 1996 October (HV power supply hardware failure)
COSTEP• EPHIN nominal• LION: front detectors noisy since launch
o Partially operational for higher flux at increasing solar activityo Separation of electrons and protons possible during solar SEP events
ERNE• LED nominal• HED: anomaly on 2000 November 21
o After long exposure to high-energy particleso one detector part, not recoveredo sudden jump in current of detector biasing circuit, leading to excessive noise in one amplifier channelo preceded by increasing bias currento worst-case: loss of half of LED effective area
• Persistent ESU data request error cause still under investigation, but software patched to reduce data loss to < 4 minutes per anomaly
SWAN• Two detectors (+Z, -Z) cover whole sky• Periscope motors nominal• +Z sensor degraded by mission interruption in 1998, but –Z sensor unaffected• UV contamination of +Z sensor has decreased by more than a factor of two since 1998• H absorption cells (one per sensor head) decreasing in absorptivity (+Z: 15% decrement, -Z: 75%); calibration
continues
20
References
Aklmal, A., Raymond, J.C., Vourlidas, A., Thompson, B.J., Ciaravella, A., Ko, Y.-K., Uzzo, M., and Wu, R. 2001, Ap.J., in pressAppourchaux, T., Fröhlich, C., Andersen, B., Berthomieu, G., Chaplin, W. J., Elsworth, Y., Finsterle, W., Gough, D. O., Hoeksema, J. T., Isaak, G. R., Kosovichev, A. G., Provost, J., Scherrer, P. H., Sekii, T., Toutain, T. 2000, Ap.J., 538, 401Banerjee, D., O’Shea, E., Doyle, J. G. 2000, Solar Phys., 196, 63Bertaux, J.-L, Costa, J., Quemerais, E., Lallement, R., Berthe, M., Kyrola, E., Schmidt, W., Summanen, T., Makkinen, T., Goukenleuque , C. 1998, Planet. Space Sci., 46, 5, 555Bertaux, J.L., Costa, J., Makinen, T., Quemerais, E., Lallement, R., Kyrola, E., Schmidt, W.: 1999, Planet. Space Sci., 47, 6-7, 725Bertello, L., Varadi, F., Ulrich, R. K., Henney, C. J., Kosovichev, A. G., García, R. A., Turck-Chièze, S. 2000, Ap.J., 537, L143Biesecker, D., Lamy,P., St. Cyr, O.C., Lllebaria, A., and Howard, R. 2001, Icarus, submittedBochsler, Peter, Ipavich, Fred M., Paquette, John A., Weygand, James M., Wurz, Peter 2000, JGR, 105, 12659Braun, D. C. & C. Lindsey 1999,Ap.J., 513, L79Brekke, P., Thompson, W. T., Woods, T. N., Eparvier, F. G. 2000, Ap.J., 536, 959Chen, J., Santoro, R. A., Krall, J., Howard, R. A., Duffin, R., Moses, J. D., Brueckner, G. E., Darnell, J. A., Burkepile, J. T. 2000, Ap.J., 533, 481Ciaravella, A. et al. 2001, Ap.J., submittedCoplan et al. 2001, JGR, submittedCosta, J, Lallement, R., Quemerais, E., Bertaux, J. L. Kyrola, E., Schmidt, W. 1999, A&A, 349, 660Cranmer, S.R. 2000, Ap.J., 532, 1197Czaykowska, A., de Pontieu, B., Alexander, D., Rank, G. 1999, Ap.J., 521, L75David, C., Gabriel, A. H., Bely-Dubau, F., Fludra, A., Lemaire, P., Wilhelm, K. 1998, A&A, 336, L90DeForest C. E., and Gurman J.B. 1998, Ap.J. 501, L217Dere, K. P.,Brueckner, G. E.,Howard, R. A.,Michels, D. J.,Delaboudiniere, J. P. 1999, Ap.J., 516, 465Esser, R. and Edgar, R.J. 2000, Ap.J., 532, L71Fligge, M., Solanki, S. K., Unruh, Y. C. 2000, Space Sci. Rev., 94, 129Garcìa, R. et al. 2001, Solar Physics, in pressGiles, P. 1999, “Time-Distance Measurements of Large-Scale Flows in the Solar Convection Zone,” Ph.D. Dissertation, Stanford UniversityGiordano, S., Antonucci, E., Noci, G., Romoli, M., and Kohl, J. L. 2000, Ap.J., 531, L79Harrison, R. A., Lyons, M. 2000, Astron Ap., 358, 1097Hassler, D.M., Dammasch, I.E., Lemaire, P., Brekke, P., Curdt, W., Mason, H.E., Vial, J.-C., Wilhelm, K. 1999 Science, 283, 810Hefti, S., Grünwaldt, H., Bochsler, P., Aellig, M. R. 1999, JGR, 105, 10527Howe, R., J. Christensen-Dalsgaard, F. Hill, R. W. Komm, R. M. Larsen, J. Schou, M. J. Thompson, and J. Toomre: 2000a, Science, 287, 2456Howe, R., Christensen-Dalsgaard, J., Hill, F., Komm, R. W., Larsen, R. M., Schou, J., Thompson, M. J., Toomre, J. 2000b, Ap.J., 533, L163Klimchuk, J. A., and Cargill, P. A. 2001, Ap.J., in pressKocharov, L., Torsti, J., St.Cyr, O. C., Huhtanen, T. 2001, Astron.Ap., in pressKohl, J. L., Esser, R., Cranmer, S. R., Fineschi, S., Gardner, L. D., Panasyuk, A. V., Strachan, L., Suleiman, R. M., Frazin, R. A., and Noci, G. 1999, Ap.J., 510, L59Kosovichev, A.G. and Zharkova, V.V. 1998, Nature, 393, 318 (correspondence)

21
Kyrölä, E., Summanen, T., Schmidt, W., Mäkinen, T., Quemerais, E., Bertaux, J.-L., Lallement, R., Costa, J. 1998, JGR, 103, 14523Laming, J. M. and Feldman, U. 2001, Ap.J., 546, 552Li, J., Raymond, J. C., Acton, L. W., Kohl, J. L., Romoli, M., Noci, G., Naletto, G. 1998, Ap.J., 506, 431Lindsey, C. and Braun, D. C. 2000, Science, 287, 1799Mäkinen, T., J.L. Bertaux, H.Laakso, T. Pulkkinen, T. Summanen, E. Kyrölä, W.Schmidt, E. Quémerais, R. Lallement: 2000, Nature, 405, 321Miralles, M.P., Cranmer, S.R., Panasyuk, A.V., Romoli, M., and Kohl, J.L. 2001, Ap.J., 549, L257Neugebauer, M., Cravens, T.E., Lisse, C.M., Ipavich, F.M., Christian, D., von Steiger, R., Bochsler, P., Shah, P.D., and Armstrong, T.P. 2000, JGR 2000, 105, 20949Peter, H. and Judge, P.G. 1999, Ap.J., 522, 1148Pres, P. and K.J.H.Phillips 1999 Ap.J., 510, L73Quémerais E., J.L. Bertaux, R. Lallement, M. Berthé, E. Kyrölä and W. Schmidt 1999, JGR, 104, 12585St. Cyr, O.C., R.A. Howard, N.A. Sheeley, Jr., S.P. Plunkett, D.J. Michaels, S.E. Paswaters, M.J. Koomen, G.M. Simnett, B.J. Thompson, J.B. Gurman, R. .Schwenn, D.F. Webb, E. Hildner, and P.L. Lamy 2000, JGR, 105, 18169}Schou, J., H. M. Antia, S. Basu, R. S. Bogart, R. I. Bush, S. M. Chitre, J. Christensen-Dalsgaard, M. P. DiMauro, W. A. Dziembowski, A. Eff-Darwich, D. O. Gough, D. A. Haber, J. T. Hoeksema, R. Howe, S. G. Korzennik, A. G. Kosovichev, R. M. Larsen, F. P. Pijpers, P. H. Scherrer, T. Sekii, T. D. Tarbell, Title, A. M., M. J. Thompson & J. Toomre 1998, Ap.J., 505, 390Schrijver, C.J., Title, Alan M., van Ballegooijen, Adriaan A., Hagenaar, Hermance J., Shine, Richard A. 1997, Ap.J., 487, 424Sheeley, N.R. Jr., Knudson, T.N., & Wang, Y.-M. 2001, Ap.J., 546, L131Thompson, B.J., S. P. Plunkett, J. B. Gurman, J. S. Newmark, O. C. St. Cyr, D. J. Michels 1998, GRL, 25, 2465Torsti, J., Kocharov, L. G., Teittinen, M., Thompson, B. J. 1999, Ap. J., 510, 460Toutain, T., T. Appourchaux, C. Fröhlich, A. Kosovichev, R. Nigam, and P.H. Scherrer 1998, Ap.J., 506, L147Turck-Chièze, S., Couvidat, S., Kosovichev, A. G., Gabriel, A., Berthomieu, G., Brun, A.S., Chistensen-Dalsgaard, J., Garcia, R., Gough, D., Provost, J., Roca-Cortès, Roxburgh, I., and Ulrich, R.K. 2001, Ap. J. (Lett.), submittedWang, Y.-M., Sheeley, N.R., Jr., Howard, R.A., St. Cyr, O.C., and Simnett, G.M. 1999, GRL, 26, 1203Yokoyama, T., Akita, K., Morimoto, T., Inoue, K., Newmark, J. 2000, Ap.J., 546, L69Zhao, J., A. G. Kosovichev & T. L. Duvall, Jr. 2001, Ap.J, in press