proposal to include minimum accessibility standards for
TRANSCRIPT

Proposal to include minimum accessibility
standards for housing in the National
Construction Code Decision Regulation Impact Statement
Prepared for
The Australian Building Codes Board
February 2021
THE CENTRE FOR INTERNATIONAL ECONOMICS
www.TheCIE.com.au

www.TheCIE.com.au
ii Proposal to include minimum accessibility standards for housing in the National Construction Code
The Centre for International Economics is a private economic research agency that
provides professional, independent and timely analysis of international and domestic
events and policies.
The CIE’s professional staff arrange, undertake and publish commissioned economic
research and analysis for industry, corporations, governments, international agencies
and individuals.
© Centre for International Economics 2021
This work is copyright. Individuals, agencies and corporations wishing to reproduce
this material should contact the Centre for International Economics at one of the
following addresses.
C A N B E R R A
Centre for International Economics
Ground Floor, 11 Lancaster Place
Canberra Airport ACT 2609
Telephone +61 2 6245 7800
Facsimile +61 2 6245 7888
Email [email protected]
S Y D N E Y
Centre for International Economics
Level 7, 8 Spring Street
Sydney NSW 2000
Telephone +61 2 9250 0800
Email [email protected]
Website www.TheCIE.com.au
Website www.TheCIE.com.au
DISCLAIMER
While the CIE endeavours to provide reliable analysis and believes the material
it presents is accurate, it will not be liable for any party acting on such information.

www.TheCIE.com.au
Proposal to include minimum accessibility standards for housing in the National Construction Code iii
Contents
Abbreviations 1
Glossary 3
Executive summary 7
Background 9
Statement of the problem 10
Options 13
Consultation 14
Estimated impacts – costs and benefits 15
Conclusions 19
1 Background and introduction 21
Background 21
The RIS process 25
Terminology 29
This report 29
2 Feedback on the Consultation RIS 30
Key issues raised in consultation 30
Overall approach to economic analysis and CBA 39
Specific methodological issues 43
3 Statement of the problem 57
Summary 57
The need for accessible housing 60
Policy context 69
Housing outcomes under current policy settings 74
Quantifying the problem 79
Qualitative assessment 113
Projections of future size of the problem 118
Underlying causes 119
4 Objectives and options 124
Objectives 124
Options 126
Summary of options to be considered 132
Stakeholder feedback on options 133
5 Impacts 140
www.TheCIE.com.au
iv Proposal to include minimum accessibility standards for housing in the National Construction Code
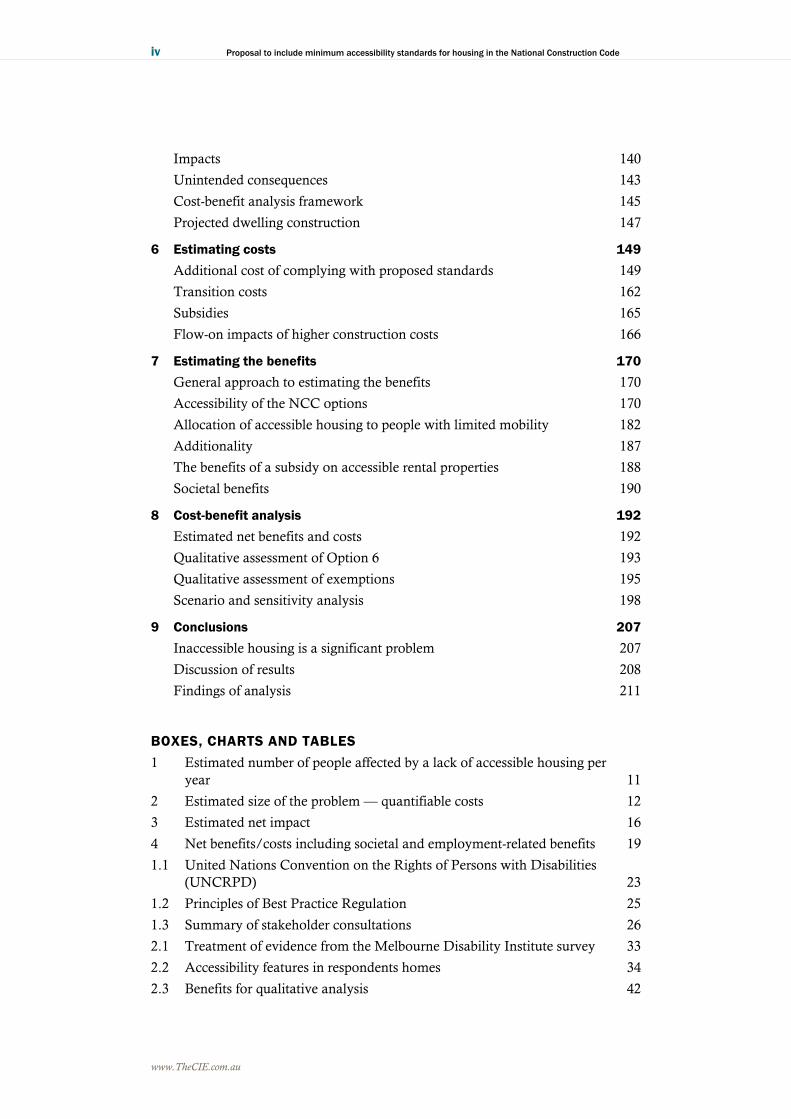
Impacts 140
Unintended consequences 143
Cost-benefit analysis framework 145
Projected dwelling construction 147
6 Estimating costs 149
Additional cost of complying with proposed standards 149
Transition costs 162
Subsidies 165
Flow-on impacts of higher construction costs 166
7 Estimating the benefits 170
General approach to estimating the benefits 170
Accessibility of the NCC options 170
Allocation of accessible housing to people with limited mobility 182
Additionality 187
The benefits of a subsidy on accessible rental properties 188
Societal benefits 190
8 Cost-benefit analysis 192
Estimated net benefits and costs 192
Qualitative assessment of Option 6 193
Qualitative assessment of exemptions 195
Scenario and sensitivity analysis 198
9 Conclusions 207
Inaccessible housing is a significant problem 207
Discussion of results 208
Findings of analysis 211
BOXES, CHARTS AND TABLES
1 Estimated number of people affected by a lack of accessible housing per
year 11
2 Estimated size of the problem — quantifiable costs 12
3 Estimated net impact 16
4 Net benefits/costs including societal and employment-related benefits 19
1.1 United Nations Convention on the Rights of Persons with Disabilities
(UNCRPD) 23
1.2 Principles of Best Practice Regulation 25
1.3 Summary of stakeholder consultations 26
2.1 Treatment of evidence from the Melbourne Disability Institute survey 33
2.2 Accessibility features in respondents homes 34
2.3 Benefits for qualitative analysis 42

www.TheCIE.com.au
Proposal to include minimum accessibility standards for housing in the National Construction Code v
2.4 Stakeholders responses: are additional excavation costs likely to be
required 46
2.5 List of lived experiences 48
3.1 Number of people affected by a lack of accessible housing per year 58
3.2 Estimated size of the problem — quantifiable costs 59
3.3 Lived experience – lack of supply of accessible housing 61
3.4 Mobility limitation by disability type 64
3.5 Number of people with mobility limitation and/or self-care limitation 65
3.6 Types of mobility aids 66
3.7 Population projections 67
3.8 Mobility limitations and wheelchair users by age — share of population 68
3.9 Number of people with mobility limitations — projection 68
3.10 Number of wheelchair users — projections 69
3.11 Summary of state and territory government policies that aim to increase the
supply of accessible housing 70
3.12 Summary of state and territory government social housing accessibility
requirements 71
3.13 Summary of other services 74
3.14 Type of dwelling 75
3.15 Retirement village dwelling and resident numbers — 2014 76
3.16 Share of people with a mobility limitation living in modified dwellings 77
3.17 Types of home modifications — share of total home modifications 77
3.18 Moved house because of condition or age 78
3.19 Number of people with a mobility-related disability in social housing 78
3.20 Summary of sub-optimal outcomes from a shortage of accessible housing 80
3.21 Lived experience – safety 82
3.22 Estimated annual safety costs from inaccessible housing 84
3.23 Share of respondents with increasing need for paid disability support 85
3.24 Share of respondents with increasing need for informal care 85
3.25 Lived experience — additional care 86
3.26 Annual additional cost of care due to inaccessible housing 87
3.27 Lived experience – quality of life impacts 89
3.28 Share of respondents indicating that the accessibility of their current home
had worsened their mental health and wellbeing 91
3.29 Willingness to pay for accessible housing 92
3.30 Lived experience – home modification 95
3.31 Expectations of ability to afford future modifications to make home
accessible/liveable 96
3.32 Weighted average cost of avoided modifications per dwelling 96
3.33 Lived experience – moving home due to inaccessibility 97
3.34 Estimated cost of additional moves due to inaccessible housing 99
3.35 Lived experience – delayed discharge due to inaccessible home 100

www.TheCIE.com.au
vi Proposal to include minimum accessibility standards for housing in the National Construction Code
3.36 Estimated cost of delayed discharge from hospital or transition care 100
3.37 Inability to visit friends and relatives whose homes are inaccessible 101
3.38 Lived experience – inability to visit family and friends 102
3.39 Ageing in place and inappropriate entry into residential aged care 104
3.40 Survey respondents concerned about being forced into residential aged
care 105
3.41 Lived experience — inappropriate entry into residential aged care 105
3.42 Estimate costs of inappropriate or premature entry into aged care 107
3.43 Lived experience – short term injury 108
3.44 Hospitalisation injuries impacted by inaccessible housing 109
3.45 Time period over which short term injuries impacted by inaccessible
housing 110
3.46 Estimated cost for people with short-term hospitalised injuries due to
inaccessible housing 111
3.47 Estimated cost for people with short term injuries due to inaccessible
housing 111
3.48 Lived experience – families with young dependants 112
3.49 Key labour force indicators 116
3.50 Lived experience – potential effects of inaccessible housing on
employment 116
3.51 Size of the problem — projections 118
3.52 Proportion of people with a mobility impairment with home
modifications 121
3.53 Equivalised income distribution 122
3.54 Other factors contributing to the lack of accessible housing 123
4.1 Key requirements to be added to NCC under different stringency under
consideration 127
4.2 Cases where step-free access would not be required, or where exclusions
apply 128
4.3 Responses by number of feasible options 134
4.4 Feasible option counts 134
4.5 Other feasible options 135
4.6 Feasible options versus options meeting the objective 137
4.7 Preferred option identified through Consultation Hub questionnaire 138
4.8 Preferred option in all submissions including multiple choices 138
4.9 Preferred options in all responses 139
5.1 Assumed number of subsidised rental properties compared with the number
of people living in inaccessible private rental accommodation 142
5.2 Projections for dwelling completions in Australia 147
5.3 Share of the dwelling stock (by type) constructed under the new Code 148
6.1 Estimated additional compliance costs 150
6.2 Cost adjustment 151

www.TheCIE.com.au
Proposal to include minimum accessibility standards for housing in the National Construction Code vii
6.3 Comparison of estimated additional construction cost to achieve relevant
standard in new build 151
6.4 Median lot size 154
6.5 Estimated space impacts of complying with proposed changes to NCC 155
6.6 Estimated marginal cost of land 156
6.7 Average price per square metre - apartments 157
6.8 Net opportunity cost of space impacts 160
6.9 Additional compliance verification cost 161
6.10 Transitional costs to government 163
6.11 Estimated number of individuals to be retrained and retraining costs 163
6.12 Construction managers 164
6.13 Assumptions for hourly earnings in relevant occupations 165
6.14 Estimated subsidy 166
6.15 Additional construction cost as percentage of average housing price 166
6.16 Illustration: price impact of increased supply cost 167
7.1 Prevalence of modifications, by selected mobility aids 172
7.2 Key points 176
7.3 Adjusted size of the problem 179
7.4 Share of new apartments in buildings 3-storeys or less 180
7.5 Accessible dwellings as a share of the dwelling stock 181
7.6 New accessible dwellings by tenure 182
7.7 Share of the problem addressed through a subsidy scheme 189
8.1 Estimated net benefits/costs 192
8.2 Net benefits/costs including societal benefits 199
8.3 Net benefits/costs including employment-related benefits 199
8.4 Net benefits/costs including societal and employment-related benefits 200
8.5 Sensitivity and break-even analysis — benefit-cost ratio under alternative
assumptions 204
8.6 Sensitivity and break-even analysis with societal and employment benefits
being included in the central case — benefit-cost ratio under alternative
assumptions 204
9.1 Number of people affected by lack of accessible housing per year 207
A.1 Problem established and the extent of the problem 214
A.2 Main contributor to a lack of uptake of universal design principles in new
dwellings 229
A.3 Other factors contributing to the lack of accessible housing 229
A.4 Responses by number of feasible options 236
A.5 Feasible option counts 236
A.6 Other feasible options 237
A.7 Feasible options versus options meeting the objective 239
A.8 Effectiveness of non-regulatory option 240
A.9 Preferred option (feedback through Consultation Hub) 243

www.TheCIE.com.au
viii Proposal to include minimum accessibility standards for housing in the National Construction Code
A.10 Preferred option in all submissions including multiple choices 244
A.11 Preferred options in all submissions 244
A.12 Views on the costing scenarios and approach 248
A.13 Do you agree with the approach of valuing the opportunity cost of additional
space requirement 249
A.14 Likelihood of additional excavation costs 252
A.15 Count of responses to Q24 breakdown by answer to Q23 253
A.16 Reasons for disagreeing with the excavation cost estimates in Consultation
RIS 254
A.17 Cost estimates provided by one submission 259
A.18 Cost estimates by MBA to achieve accessibility standards 261
A.19 Views on the assumptions and approaches to estimate benefits 264
B.1 Assistance required moving around residence 275
B.2 Key results of randomised controlled trials that establish that home
modifications and other factors reduce falls 279
B.3 Hospitalisation rates from falls for older Australians 281
B.4 Additional deaths from falls due to inaccessible housing 282
B.5 Valuing human health outcomes 283
B.6 Estimated value of a statistical life for Australians by age group 284
B.7 Estimate cost to the community from additional fall-related deaths 284
B.8 Estimated number of additional hospital admissions due to inaccessible
housing 286
B.9 Estimated cost of additional hospital admissions due to inaccessible
housing 287
B.10 Estimated number of additional emergency department attendances due to
inaccessible housing 288
B.11 Estimated cost of additional emergency department attendances due to
inaccessible housing 290
B.12 Estimated number of additional non-hospital treatments due to inaccessible
housing 291
B.13 Estimated cost of additional non-hospital treatments due to inaccessible
housing 293
B.14 Morbidity costs for fall-related injuries 294
B.15 Estimated lifetime morbidity cost by age cohort 295
B.16 Estimated lifetime morbidity cost from falls 296
C.1 Type of modifications 299
C.2 Additional formal care needs due to inaccessible housing 299
C.3 Additional informal care needs due to inaccessible housing 302
C.4 Estimating the number of people affected 303
C.5 Number of people receiving care 304
D.1 Avoidable modifications 305
D.2 Number of dwellings modified 306

www.TheCIE.com.au
Proposal to include minimum accessibility standards for housing in the National Construction Code ix
D.3 Weighted average cost of modifications for Class 1a dwellings 307
D.4 Weighted average cost of modifications for Class 2 dwellings 307
E.1 Cost of each additional move 309
E.2 Weighted average price 310
E.3 Main reasons for moving 311
E.4 Number of years since accident happened or main condition occurred 312
E.5 Estimated number of additional moves per year — lower bound estimate 313
E.6 Estimated number of additional moves per year — upper bound estimate 313
F.1 Summary of Australian literature on the causes of delayed discharge 314
F.2 Relevant types of care 316
G.1 Frequency of contact with family or friends 319
G.2 Share of identified population who would like to see family and friends
more often 319
G.3 Share of people with a mobility limitation that want more contact with
family/friends 320
G.4 Estimated cost of loneliness due to a lack of accessible housing 320
H.1 Additional people in residential aged care due to a lack of accessible
housing 322
H.2 Recommended long-term living arrangement from aged care assessments 324
H.3 Operational number of residential aged care places, Australia-wide 324
H.4 Logistic model of probability of being in aged care — 2012 325
H.5 Probability/odds of being in residential aged care — 2018 326
H.6 Estimated number of people in residential aged care due to needing help with
mobility 327
H.7 Number of people under the age of 65 in residential aged care 329
H.8 Royal Commission into Aged Care Quality and Safety 330
H.9 Estimated additional financial cost of residential aged care per person 333
H.10 Efficient costs of residential aged care by level of quality 334
H.11 Estimated annual expenses 335
I.1 Average WTP for accessibility features 337
I.2 Estimated number of people experiencing reduced quality of life 338
I.3 Willingness to pay for accessible housing 338
I.4 Private cost due to inaccessibility 339
I.5 Estimated number of people experiencing reduced quality of life 342
I.6 Mental health and wellbeing impacts of accessibility 342
1.7 Annual mental health cost for different conditions 345
I.8 Estimated mental health impact of accessible housing 346
J.1 Potential increase in employment 347
J.2 Net cost of lost employment opportunities for people with mobility
limitations 348
J.3 Indicative benefits 348

www.TheCIE.com.au
x Proposal to include minimum accessibility standards for housing in the National Construction Code
J.4 Share of respondents indicating design of home limits ability to study and
work 350
J.5 Accessible housing and employment outcomes 350
J.6 Extent to which housing design limits ability to work from home 351
J.7 Lived experiences — ability to work from home 352
J.8 Lived experiences — accessible housing close to work 353
J.9 Impact of unmet needs 354
J.10 Upper bound estimate of the loss of employment opportunities due to a
lack of accessible housing close to employment opportunities 356
J.11 Lived experiences — limitations on ability to work from inaccessible
housing 357
J.12 Additional people that could potentially work full-time 359
J.13 Indicative estimate of the impact of a 10 per cent productivity
improvement 361
K.1 Attribute levels used in discrete choice experiment 366
K.2 Example of choice question 368
K.3 Example of contingent valuation question 369
K.4 Characteristics of sample, reweighted sample and target population 370
K.5 Mobility limitation characteristics 372
K.6 Attitudes towards accessible housing 373
K.7 Preference for accessibility features by current mobility limitation status 374
K.8 Accessibility features in the existing housing stock 375
K.9 Models for predicting respondent reference prices 376
K.10 Renter model of housing choice 378
K.11 Buyer model of housing choice 378
K.12 Average willingness to pay as a proportion of reference price 379
K.13 Estimates of average willingness to pay by tenure type and mobility status 381
K.14 Responses to contingent valuation question 381
K.15 Increased likelihood of accessibility features in homes occupied by at least
one person with a mobility limitation 382
K.16 Average share of accessible features provided in the baseline 383
K.17 Average WTP for accessible features 384
K.18 Reasons for not voting for the policy to increase accessible housing 385
K.19 Consequentiality of the survey 385
K.20 Expert statement from Professor Riccardo Scarpa 386

www.TheCIE.com.au
Proposal to include minimum accessibility standards for housing in the National Construction Code 1
Abbreviations
ABCB Australian Building Codes Board
ABS Australian Bureau of Statistics
ACSA Aged and Community Services Australia
ADACAS ACT Disability, Aged and Carer Advocacy Service
AHRC Australian Human Rights Commission
AHURI Australian Housing and Urban Research Institute
AIHW Australian Institute of Health and Welfare
ANUHD Australian Network for Universal Housing Design
AQoL Assessment of Quality of Life
ARATA Australian Rehabilitation and Assistive Technology Association
BCR Benefit-cost ratio
BMF Building Ministers' Forum
CASE Centre for Analysis of Social Exclusion
CBA Cost-benefit analysis
CEA Cost-effective analysis
CIE The Centre for International Economics
COAG Council of Australian Governments
COTA Council on the Ageing
CRPD The UN Convention on the Rights of Persons with Disabilities
CUDA Centre for Universal Design Australia
CV Contingent valuation
DCE Discrete choice experiment
DCWC Donald Cant Watts Corke
HIA Housing Industry Association
HMinfo Home Modification Information Clearinghouse
HRQoL health-related quality of life

www.TheCIE.com.au
2 Proposal to include minimum accessibility standards for housing in the National Construction Code
LHA Livable Housing Australia
LHD Livable Housing Design
LHDG Livable Housing Design Guidelines
LSE London School of Economics and Political Science
MDI Melbourne Disability Institute, University of Melbourne
NCC National Construction Code
NDIA National Disability Insurance Agency
NDIS National Disability Insurance Scheme
NPV net present value
OBPR Office of Best Practice Regulation
PCA Property Council of Australia
PPV Post-Polio Victoria
QALY quality-adjusted life year
RANZCP Royal Australian and New Zealand College of Psychiatrists
RIS Regulation Impact Statement
SDA Specialist Disability Accommodation
SDAC Survey of Disability, Ageing and Carers
VSL value of a statistical life
VLY value of a life year
WTP willingness to pay
YPINH Young People in Nursing Homes National Alliance

www.TheCIE.com.au
Proposal to include minimum accessibility standards for housing in the National Construction Code 3
Glossary
Accessible housing
Accessible housing is housing providing features that are being proposed in the NCC,
which are based on the LHDG (see below). Accessible is similar but not necessarily equal
to terms like adaptable, visitable (see below).
Adaptable housing
Adaptable housing is housing designed to cater for people of all ages and abilities. It
provides greater housing choices.
Additionality
Additionality refers to the impacts of a policy change over and above the situation under
the business as usual case (i.e. without the policy change).
Allocation
In this RIS, allocation refers to the market process and mechanism that determine who
purchases or rents the newly constructed accessible dwelling.
Assessment of Quality of Life (AQoL)
AQoL is a system developed by the Centre for Health Economics at Monash University
(https://www.monash.edu/business/che/research-areas/measurement-of-health-and-
quality-of-life) to measure the quality of life (see below). It is derived from questionnaires
designed to measure an individual’s independence, mental health, social participation
and senses.
Baseline
Baseline, or baseline case, refers to the business as usual situation without proposed
changes. It provides a base against which the proposed changes are assessed.
Benefit-cost ratio (BCR)
A quotient that total benefit is divided by total cost. A BCR of one means benefit equals
to cost. A BCR greater than one means benefits are larger than costs. A BCR less than
one means benefits are less than costs.
Break even
A case where the value of benefits equals to the value of costs, that is, a BCR of one.
Class 1a building
A Class 1a building is a single dwelling being a detached house, or one of a group of
attached dwellings being a town house, row house or the like.
Class 2 building
Class 2 buildings are apartment buildings. They are typically multi-unit residential
buildings where people live above and below each other.

www.TheCIE.com.au
4 Proposal to include minimum accessibility standards for housing in the National Construction Code
Contingent Valuation (CV)
Contingent Valuation is a method of estimating the value that a person places on a
product or service. It asks people to directly report their willingness to pay to obtain a
specific good or service, or willingness to accept to give up a good or service, rather than
inferring them from observed behaviours in regular market places.
Cost-benefit analysis (CBA)
Cost-benefit analysis (CBA), sometimes also called benefit-cost analysis, is a systematic
approach to estimating the strengths and weaknesses of alternatives or options to achieve
targets or objectives.
Central case
A central case in CBA is the analysis assuming most likely, or mid-point estimates of
benefits and costs, and the commonly adopted parameters such as discount rate (see
below).
Discount rate
A rate to convert the future benefits and costs into a value at the present so that they can
be compared.
Discrete choice experiment (DCE)
Discrete choice experiment is a method in economics to describe, explain and predict
choices between two or more discrete alternatives, such as choosing a set of accessible
features, or choosing between modes of transport.
Distributional impact
Distributional impact is the effect of the distribution of the final gains and costs within a
community (e.g. who gains and who pays) derived from a project or program.
Elasticity
Elasticity measures the change of one economic variable (the outcome variable, for
example demand for a good or service) in response to a change in another (the cause
variable, for example the price of the good or service or consumer’s income). It is
calculated by dividing the percentage change in the outcome variable by the percentage
change in the cause variable. An elastic variable (with an absolute elasticity value greater
than 1) is one which responds more than proportionally to the change in the cause
variable. By contrast, an inelastic variable (with an absolute elasticity value less than 1) is
one which responds less than proportionally to the change in the cause variable.
Livable Housing Design Guidelines (LHDG)
Livable Housing Design Guidelines (LHDG) are developed by Livable Housing
Australia. They provide a nationally consistent set of guidelines to make homes safer,
more comfortable and easier to access for people of all ages and abilities. Three levels of
performance are provided in LHDG along with 15 livable housing design elements.
Silver Level requires 7 core elements, Gold Level has enhanced requirements for most of
the core elements plus additional elements, and Platinum Level requires all 15 elements.
Loneliness
Loneliness is the subjective state of negative feelings about having a lower level of social

www.TheCIE.com.au
Proposal to include minimum accessibility standards for housing in the National Construction Code 5
contact than desired, according to Australian Institute of Health and Welfare (AIHW)
(https://www.aihw.gov.au/reports/australias-welfare/social-isolation-and-loneliness).
Present value
The current equivalent value of a future value of benefit or cost. It is calculated by the
discount rate (see above).
Quality adjusted life year (QALY)
Quality adjusted life year is a generic measure of disease burden including both the
quality and the quantity of life lived in health economics. It is used to assess the value of
medical interventions. One QALY equates to one year in perfect health based on a scale
from 1 (perfect health) to 0 (death).
Quality of life
Quality of life generally includes factors such as independence, dignity, mental health,
social isolation and loneliness. This analysis draws on studies based on the Assessment of
Quality of Life (AQoL) developed by the Centre for Health Economics at Monash
University (see above).
Revealed preference
Revealed preference is the preference (e.g. how much to pay for one unit of a product or
service) derived from observations and data on actual choices made by people.
Scenario
A scenario is a specific case where certain assumptions about benefits and costs are
applied as a special form of sensitivity analysis (see below).
Sensitivity analysis
An analysis undertaken to test how sensitive the results are by changing the assumptions
and parameters.
Social isolation
Social isolation refers to a situation where an individual has minimal contact with others.
According to AIHW, there is a subtle distinction between social isolation and loneliness
(see above).
Stated preference
Stated preference is the preference (e.g. how much to pay for one unit of a product or
service) derived from respondents’ choices over hypothetical scenarios.
Uncertainty
The state of being uncertain, arising from factors such as limited data and information,
under researched topic, complexity and unknown future.
Universal design
Universal design is the design and composition of a built environment so that it can be
accessed, understood and used to the greatest extent possible people regardless of their
age, size, ability or disability.
Value of a life year (VLY)
Value of a life year (VLY) is the notional value that an individual places on each
additional year of life. It is related to the concept of value of a statistical life (see below).

www.TheCIE.com.au
6 Proposal to include minimum accessibility standards for housing in the National Construction Code
Value of a statistical life (VSL)
Value of a statistical life (VSL) is a notional value that individuals place on reducing the
risk of death. A related concept is the value of a life year (see above).
Visitability
Visitability is the design approach for housing such that anyone with mobility needs (for
example using a wheelchair or other mobility aids) should be able to visit, which requires
the ability to enter into the house, to pass through interior doorways and to enter a
bathroom to use the toilet.
Willingness to pay (WTP)
Willingness to pay (WTP) is the maximum price at which a consumer will definitely buy
one unit of a product or service.

www.TheCIE.com.au
Proposal to include minimum accessibility standards for housing in the National Construction Code 7
Executive summary
This Regulation Impact Statement (RIS) examines the costs and benefits of including
accessibility standards in the National Construction Code (NCC), based on the Livable
Housing Design Guidelines (LHDG) which could apply to the construction of new
residential housing.
Accessible housing is based on the principles of universal design and is housing that
includes features which enable safe and comfortable use by people with disability and
those transitioning through life stages. In 2009 governments, industry and advocates
agreed through a National Dialogue to pursue an aspirational target that all new homes
would be of an agreed Universal Housing Design standard by 2020.
Housing is integral to people’s wellbeing.
“A person is more disabled when their built environment is inaccessible”.1
More than 3 million Australians have a mobility limitation and/or a self-care limitation
due to disability, with more than 90 per cent living within the community.2 This is
estimated to increase to around 4.5 million people by 2040.
Inaccessible housing can directly and adversely affect the daily lives of Australians who
have mobility limitation, use a wheelchair or use mobility aids or who require care from
others for self-care tasks, such as showering or toileting, which is provided either formally
or informally. Inaccessible housing can impact economic participation and also have a
negative impact on family members or friends providing informal care to their loved ones
by imposing restrictions on their ability to provide this care.
Older Australians who strongly prefer to age in place may also be negatively affected by
inaccessible housing, which may limit their ability to age in their own home, and instead
enter residential aged care earlier than they wanted to, if home modifications are not
possible.
In trying to find a place to live that meets their needs, people, sometimes hospitalised
with disability and older Australians, may face multiple moves which creates significant
financial and emotional stress. This was the experience of older Australians Angie and
John, presented in the submission by Australian Rehabilitation and Assistive Technology
Association (ARATA).
1 Anonymous Submission 90458024, accessed 11 November 2020,
https://consultation.abcb.gov.au/engagement/consult-ris-accessible-
housing/consultation/view_respondent?uuId=90458024
2 Based on data from the 2018 Survey of Disabilities, Ageing and Carers.

www.TheCIE.com.au
8 Proposal to include minimum accessibility standards for housing in the National Construction Code
Angie (88 years old) and John (90 years old) are a married couple who exemplify
through their story how housing journeys could be improved as our population
ages.
“Angie and John were forced to relocate homes many times to try to meet their
changing needs over later adulthood, during their married life. With each relocation,
growing financial and emotional stress was encountered and living environments
became more restricted, negatively impacting participation.” 3
The effects of inaccessible housing on people with mobility or self-care limitation or who
are older can extend beyond coping with daily tasks to impacts on mental health and
social inclusion. The lived experience of one person living in an inaccessible house who
was able to move to an accessible house demonstrates the different effects of these homes
on their well-being.
Effects of living in an accessible home versus an inaccessible home
“... I have lived in both an inaccessible house and a fully purpose built home. In my
accessible home – I am happy, productive, social and my best person (to myself, my
friends and family). I am an excellent employee … - and this is partly related to my
physical health and my mental health being on track. Without access in my home – I
was clinically depressed, suicidal, unemployed and single. I now have a great career, I
am a wife, a mother, a friend and I am studying at uni.”4
Other members of the community without mobility limitation may also find inaccessible
housing creates challenges in their daily lives too; for example, people with temporary
injuries and families with young dependants.
Some of the other personal stories received during consultation related to:
■ The inability to stay in or return to the family home after a major health change.
■ Extensive and unsuccessful searches for an appropriate home.
■ The need for ongoing government funding for a carer that would otherwise not be
needed if an appropriate home was available.
■ Premature entry into residential aged care including for young people.
■ Limitations of home modifications and the significant financial costs associated with
retrofitting accessibility features, such as grab rails, which are cheaper in a house built
to universal design standards.
3 Submission by Associate Professor Libby Callaway for ARATA, p.10-12, accessed 1 December
2020, https://consultation.abcb.gov.au/engagement/consult-ris-accessible-
housing/consultation/view_respondent?show_all_questions=0&sort=submitted&order=ascending&_q__t
ext=callaway&uuId=522000197
4 Anonymous Submission 90458024, accessed 11 November 2020,
https://consultation.abcb.gov.au/engagement/consult-ris-accessible-
housing/consultation/view_respondent?uuId=90458024
www.TheCIE.com.au
Proposal to include minimum accessibility standards for housing in the National Construction Code 9
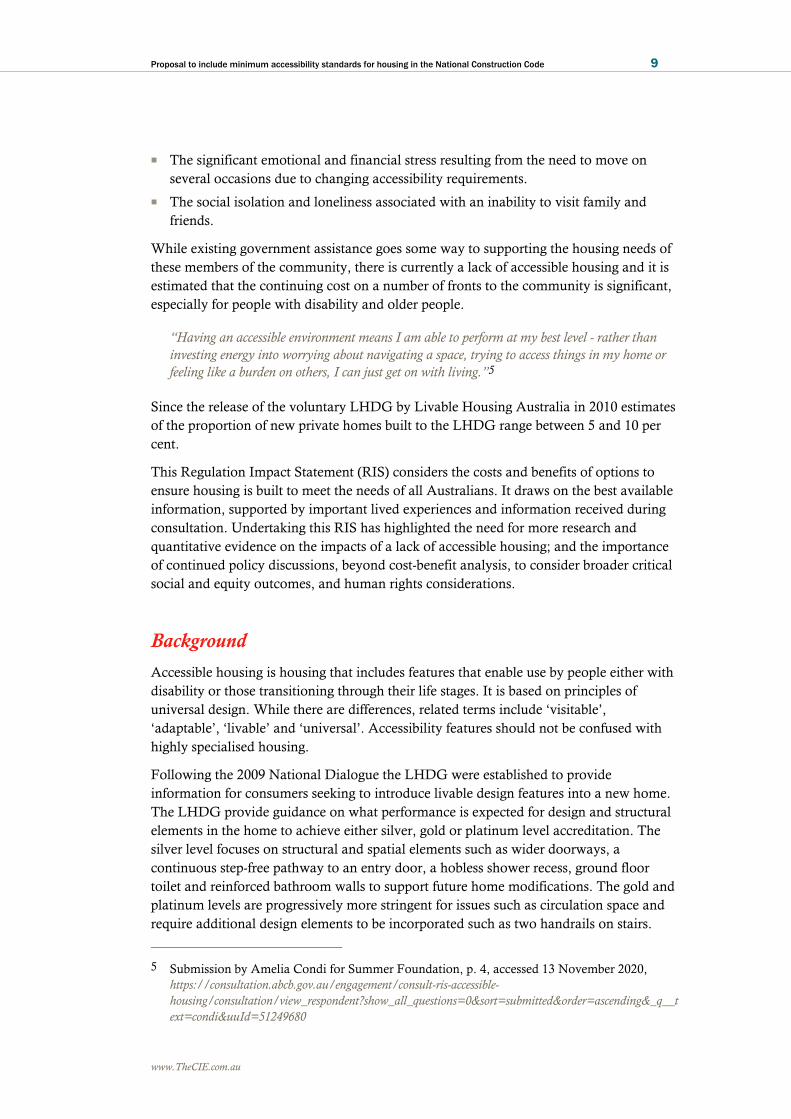
■ The significant emotional and financial stress resulting from the need to move on
several occasions due to changing accessibility requirements.
■ The social isolation and loneliness associated with an inability to visit family and
friends.
While existing government assistance goes some way to supporting the housing needs of
these members of the community, there is currently a lack of accessible housing and it is
estimated that the continuing cost on a number of fronts to the community is significant,
especially for people with disability and older people.
“Having an accessible environment means I am able to perform at my best level - rather than
investing energy into worrying about navigating a space, trying to access things in my home or
feeling like a burden on others, I can just get on with living.”5
Since the release of the voluntary LHDG by Livable Housing Australia in 2010 estimates
of the proportion of new private homes built to the LHDG range between 5 and 10 per
cent.
This Regulation Impact Statement (RIS) considers the costs and benefits of options to
ensure housing is built to meet the needs of all Australians. It draws on the best available
information, supported by important lived experiences and information received during
consultation. Undertaking this RIS has highlighted the need for more research and
quantitative evidence on the impacts of a lack of accessible housing; and the importance
of continued policy discussions, beyond cost-benefit analysis, to consider broader critical
social and equity outcomes, and human rights considerations.
Background
Accessible housing is housing that includes features that enable use by people either with
disability or those transitioning through their life stages. It is based on principles of
universal design. While there are differences, related terms include ‘visitable’,
‘adaptable’, ‘livable’ and ‘universal’. Accessibility features should not be confused with
highly specialised housing.
Following the 2009 National Dialogue the LHDG were established to provide
information for consumers seeking to introduce livable design features into a new home.
The LHDG provide guidance on what performance is expected for design and structural
elements in the home to achieve either silver, gold or platinum level accreditation. The
silver level focuses on structural and spatial elements such as wider doorways, a
continuous step-free pathway to an entry door, a hobless shower recess, ground floor
toilet and reinforced bathroom walls to support future home modifications. The gold and
platinum levels are progressively more stringent for issues such as circulation space and
require additional design elements to be incorporated such as two handrails on stairs.
5 Submission by Amelia Condi for Summer Foundation, p. 4, accessed 13 November 2020,
https://consultation.abcb.gov.au/engagement/consult-ris-accessible-
housing/consultation/view_respondent?show_all_questions=0&sort=submitted&order=ascending&_q__t
ext=condi&uuId=51249680

www.TheCIE.com.au
10 Proposal to include minimum accessibility standards for housing in the National Construction Code
In 2017, the then Building Ministers’ Forum (BMF), supported by the then Council of
Australian Governments (COAG), directed the Australian Building Codes Board
(ABCB) to undertake a Regulatory Impact Analysis on the possible inclusion of
accessibility requirements for residential housing Class 1a buildings (houses, townhouses
and the like) and Class 2 buildings (apartments) into the National Construction Code
(NCC).6 The direction required options to be assessed based on the Silver and Gold
specifications set out in the LHDG, along with other options as appropriate.
The Centre for International Economics (CIE) was engaged by the ABCB to undertake
this Regulation Impact Statement (RIS). In this RIS, the term ‘accessible’ has been
adopted to describe the proposed housing features that are based on universal design
principles.7
This RIS has been prepared in accordance with the COAG Best Practice Regulation, A
Guide for Ministerial Councils and National Standard Setting Bodies. This RIS
acknowledges and responds to feedback received from stakeholders in response to the
Consultation RIS. Feedback has influenced aspects of the size of the problem particularly
information on lived experiences, as well as the potential effectiveness and associated
costs of the options considered.
Statement of the problem
Finding suitable accommodation is important to all Australians and is a prerequisite for a
happy, stable and dignified life.8 There is evidence that a significant number of people
with disability and older people have trouble finding housing that meets their needs. As
demonstrated by one submission:
“In several weeks of searching [for a rental property] … not one of the properties we saw was
suitable for someone with a power chair and no walking ability at all …”9
There are a number of factors that lead to a lack of accessible housing. Australia’s
housing market does not encourage people to consider incorporating accessibility features
unless there is an immediate need for an individual or a family. People with disability
often live in low income households meaning they are more likely to rent or may not be
able to afford to modify their homes. The nature of the new housing market can make it
difficult for some homebuyers to deviate from standard designs to incorporate
accessibility features. Landlords are reluctant to allow modifications for private renters,
so that home modification is often not an option for renters with accessibility needs.
6 Building Ministers’ Forum 2017, Communique, 21 April 2017.
7 Other similar (but not identical) terms include ‘visitable’, ‘adaptable’ and ‘livable’.
8 Commonwealth of Australia 2011, National Disability Strategy 2010-2020: An initiative of the
Council of Australian Governments, p. 32.
9 Submission by Hayley Stone for Physical Disability Council of NSW, p. 6, accessed 13
November 2020, https://consultation.abcb.gov.au/engagement/consult-ris-accessible-
housing/consultation/view_respondent?show_all_questions=0&sort=submitted&order=ascending&_q__t
ext=hayley+stone&uuId=686843897

www.TheCIE.com.au
Proposal to include minimum accessibility standards for housing in the National Construction Code 11
These factors result in homes that are not suitable for many in our community,
particularly those with mobility impairment who require features such as step free
entrances, wider doors and corridors and increased circulation space in sanitary facilities,
kitchen, laundry, location specific requirements for bedroom spaces, and window and
door hardware.
A lack of accessible housing can impose various costs:
■ Where people with disability and older people live in homes that do not meet their
needs, costs related to safety from a higher risk of falls, additional care needs and
reduced quality of life (including less independence, mental health impacts and limits
on social participation).
■ Other costs could include unnecessarily high costs of home modification, extended
hospital and transition care stays, avoidable relocation costs, inability to visit family
and friends, early entry to residential aged care and inconvenience for families with
young children or those with short-term injuries.
To measure the costs and benefits of the options to ensure housing is designed to be
accessible, it is important to understand the number of people impacted and the level of
that impact.
The lack of accessible housing mainly impacts people with disability and older people
and their carers. Accessible design features may also benefit for example, people dealing
with temporary injuries and families with young dependants, although the benefits to
those households are likely to be smaller. The desire to age in place is also acknowledged
and people may develop a disability in the course of their life even if the features are not
specifically needed now.
This is a complex issue of which some aspects are not extensively studied by the
literature. A scarcity of quantitative information and other gaps in information on the
impact of inaccessible housing has presented some challenges and limitations to the
analysis. In preparing this RIS information has been drawn from a range of sources,
including available literature, data collected for other purposes, older data where still
relevant, and information provided by stakeholders, such as lived experiences.
While it is difficult to precisely determine the number of people impacted by a lack of
accessible housing (noting people with mobility limitation or self-care limitation may
already live in housing that meets their needs), by drawing on the available data and
input from targeted consultations and public submissions, the estimates in table 1 have
been developed. It should be noted that people affected by multiple problems are listed in
the numbers more than once and therefore the numbers cannot be added together to
represent total populations affected.
1 Estimated number of people affected by a lack of accessible housing per year
Problem Estimated number of people affected per year
Safety-risks 325 100
Additional care needs 453 400
Quality of life 554 400

www.TheCIE.com.au
12 Proposal to include minimum accessibility standards for housing in the National Construction Code
Problem Estimated number of people affected per year
Additional time in hospital/transition care 159 900
Home modifications per annum a 21 790
Additional home moves Range of 6 400 – 17 300
Premature/inappropriate entry into residential aged care Range of 2 767 – 6 199
Inability to visit family and friends (visitability) 85 800
Families with young dependants Up to 16 000
Short-term injuries 17 551
a Assumes 1 person per relevant modification per year
Note: the number of people affected is not additive across each type of problem.
Source: CIE – population is estimated on the basis of analysis in appendices B-J.
Table 1 shows the approximate number of people per year impacted by different types of
problems associated with a lack of accessible housing, based on analysis in appendix B-J.
This information is a key part of calculating the estimated cost of not providing accessible
housing to people with disability and older people. The number of people impacted will
increase over time.
■ The number of people with mobility limitation is projected to increase by around
52 per cent (an average annual growth rate of around 1.9 per cent) over the period
2018 to 2040.
■ To a significant extent, this is driven by growth in the number of people over the age
of 65. The number of people over the age of 65 with mobility limitation is projected to
increase by around 76 per cent (an average annual growth rate of around 2.6 per cent)
over the period 2018 to 2040.
■ The number of wheelchair users is projected to increase by around 79 per cent (an
average annual growth rate of 2.7 per cent per year) over the period 2018 to 2040.
The cost to the community of a lack of accessible housing is estimated to be between
$3.0 billion and $6.7 billion per annum, as shown in table 2. This is based on the data in
table 1, and feedback from public consultation. It is estimated that these costs could
increase to between $4.6 billion and $10.2 billion per annum by 2040 due to population
growth and an ageing population.
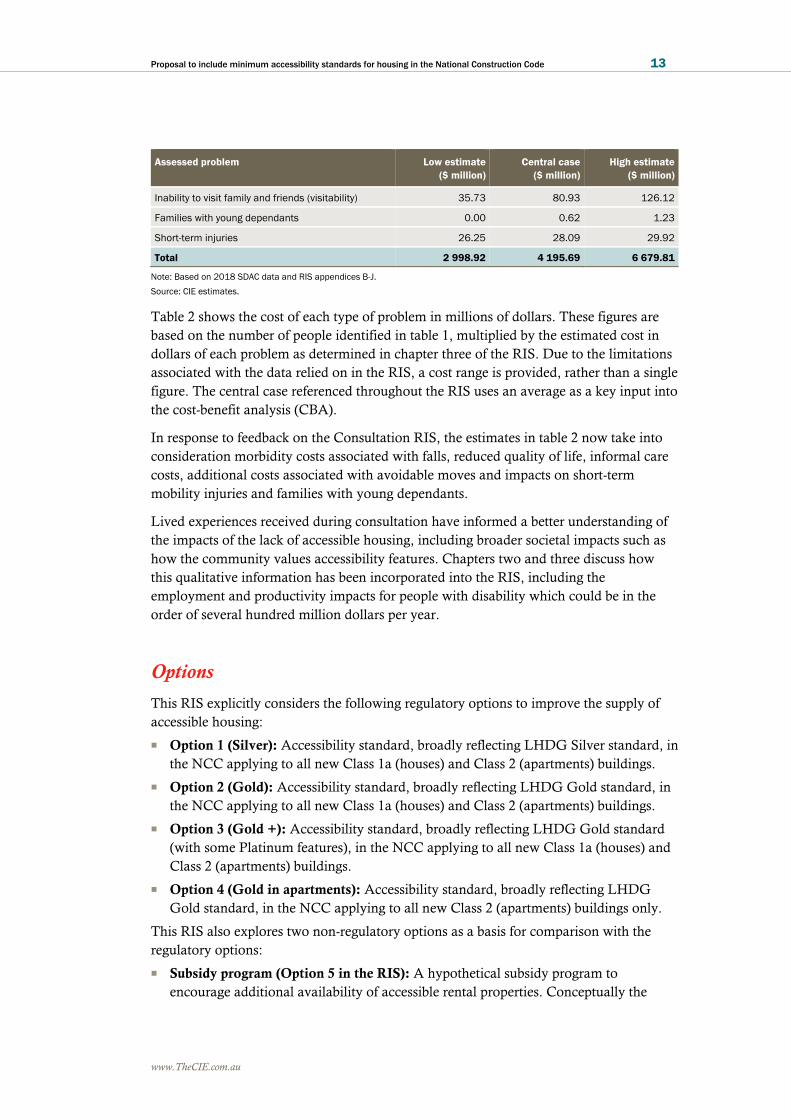
2 Estimated size of the problem — quantifiable costs
Assessed problem Low estimate
($ million)
Central case
($ million)
High estimate
($ million)
Safety-risks 0.00 154.14 570.30
Additional care needs 938.52 938.52 938.52
Quality of life 1 063.89 1 913.23 3 770.10
Additional time in hospital/transition care 234.59 234.59 234.59
Home modifications per annum 498.86 498.86 498.86
Additional home moves 81.51 161.91 242.31
Premature/inappropriate entry into residential aged
care 119.56 184.81 267.86
www.TheCIE.com.au
Proposal to include minimum accessibility standards for housing in the National Construction Code 13
Assessed problem Low estimate
($ million)
Central case
($ million)
High estimate
($ million)
Inability to visit family and friends (visitability) 35.73 80.93 126.12
Families with young dependants 0.00 0.62 1.23
Short-term injuries 26.25 28.09 29.92
Total 2 998.92 4 195.69 6 679.81
Note: Based on 2018 SDAC data and RIS appendices B-J.
Source: CIE estimates.
Table 2 shows the cost of each type of problem in millions of dollars. These figures are
based on the number of people identified in table 1, multiplied by the estimated cost in
dollars of each problem as determined in chapter three of the RIS. Due to the limitations
associated with the data relied on in the RIS, a cost range is provided, rather than a single
figure. The central case referenced throughout the RIS uses an average as a key input into
the cost-benefit analysis (CBA).
In response to feedback on the Consultation RIS, the estimates in table 2 now take into
consideration morbidity costs associated with falls, reduced quality of life, informal care
costs, additional costs associated with avoidable moves and impacts on short-term
mobility injuries and families with young dependants.
Lived experiences received during consultation have informed a better understanding of
the impacts of the lack of accessible housing, including broader societal impacts such as
how the community values accessibility features. Chapters two and three discuss how
this qualitative information has been incorporated into the RIS, including the
employment and productivity impacts for people with disability which could be in the
order of several hundred million dollars per year.
Options
This RIS explicitly considers the following regulatory options to improve the supply of
accessible housing:
■ Option 1 (Silver): Accessibility standard, broadly reflecting LHDG Silver standard, in
the NCC applying to all new Class 1a (houses) and Class 2 (apartments) buildings.
■ Option 2 (Gold): Accessibility standard, broadly reflecting LHDG Gold standard, in
the NCC applying to all new Class 1a (houses) and Class 2 (apartments) buildings.
■ Option 3 (Gold +): Accessibility standard, broadly reflecting LHDG Gold standard
(with some Platinum features), in the NCC applying to all new Class 1a (houses) and
Class 2 (apartments) buildings.
■ Option 4 (Gold in apartments): Accessibility standard, broadly reflecting LHDG
Gold standard, in the NCC applying to all new Class 2 (apartments) buildings only.
This RIS also explores two non-regulatory options as a basis for comparison with the
regulatory options:
■ Subsidy program (Option 5 in the RIS): A hypothetical subsidy program to
encourage additional availability of accessible rental properties. Conceptually the

www.TheCIE.com.au
14 Proposal to include minimum accessibility standards for housing in the National Construction Code
subsidy would be paid to landlords who provide accessible rental accommodation to
people with accessibility needs.
■ Voluntary guidance (Option 6 in the RIS): An enhanced approach to voluntary
guidance, which includes turning the current proposals into a non-regulatory ABCB
handbook and other measures to encourage additional uptake of universal design
principles, including: a search engine for dwellings certified as complying with the
LHDGs and provision of information to home purchasers.
Consultation
Consultation with key stakeholders formed an important part of finalising this Decision
RIS. This consultation was undertaken in two major stages:
■ Targeted stakeholder consultation program informed the development of the
Consultation RIS between November 2019 and May 2020
■ Public consultation for the Consultation RIS during July and August 2020.
Feedback was provided in the form of considered opinion, survey information and lived
experiences. It reflected the diversity of interests of people and communities interested in
the provision of accessible housing.
While all feedback was taken into account, comments on the Consultation RIS and
information received in the following areas resulted in revisions to some aspects of this
Decision RIS, including:
■ the importance of symmetry in reporting costs and benefits;
■ employment and productivity impacts;
■ the need for more qualitative analysis, including analysis of quality of life impacts;
■ social justice considerations;
■ impacts on, and of, other government programs;
■ alternative methodological approaches; and
■ technical suggestions and interpretation of the proposal.
The following significant adjustments were made to the CBA estimates.
■ The main adjustments to the benefit estimates were:
– A significant upward revision to the size of the problem, due mainly to the
inclusion of quality of life impacts. Other adjustments included morbidity costs
associated with falls; potential impacts on people with self-care limitation who
could benefit from the toilet and shower features; a broader range of costs
associated with moving to a more accessible dwelling; and some impacts for
households that do not have specific accessibility needs.
– This was partly offset by revised assumptions relating to the extent to which the
proposed options would meet the needs of people with disability. In particular,
some dwellings (including double-storey houses and townhouses without
bedrooms and showers on the entry level, and apartments above the ground floor
in blocks without lifts) built to comply with the proposed requirements

www.TheCIE.com.au
Proposal to include minimum accessibility standards for housing in the National Construction Code 15
(particularly under Option 1 - Silver) are assumed not suitable for people with
limited mobility as built as they are likely to require the use of internal stairs.
– Societal benefits have been excluded from the CBA results presented in table 3
below to clearly separate the efficiency impacts from the equity impacts (consistent
with OBPR guidelines). Estimates of the societal benefits have been retained in a
separate scenario reflected in table 4 to provide additional information for
decision-makers.
■ The costs were also adjusted. As the costs apply to all new dwellings, the CBA
outcomes are particularly sensitive to changes in costs. The main adjustments were:
– Made due to changes to the NCC proposal under each option. In particular,
estimates in the Consultation RIS were based on one-step access rather than
step-free access as reflected in this RIS. Further adjustments were also made to
corridor and door widths, bathroom elements and internal thresholds.
– Other adjustments reflect a re-assessment of how the market would respond to the
above proposed requirements.
– An adjustment was made to reflect the additional value of the extra space provided
by the proposed accessibility standard which offset to some extent the opportunity
cost of space.
– Additional costs associated with verifying compliance with the proposed NCC
standards were also included in this RIS.
Estimated impacts – costs and benefits
This RIS adopts a CBA to assess and compare each of the options. The status quo – that
is no changes to existing policy settings – has been used as a baseline against which the
costs and benefits of options are assessed.
Table 3 presents the results of the CBA, in which:
■ The costs reflect the additional construction (and other) costs associated with building
accessible dwellings over the 10-year regulatory period from 2022.
■ The benefits are estimated based on how much each option would address the
accessibility problems for people with disability and older people as described in
tables 1 and 2. Benefits are estimated over an assumed 40 year life of each dwelling
constructed over the 10 year regulatory period to include benefit to people who
acquire a disability in the future, including younger people as they age.
■ Costs and benefits are estimated in Net Present Value (NPV) terms, meaning future
costs and benefits are discounted to reflect their value today, to allow them to be
compared.
The non-regulatory options (a subsidy program and enhanced voluntary guidance) are
largely outside the ABCB’s responsibility and therefore not the primary focus of this RIS.
Further discussion of these options can be found in chapters four through eight in the
RIS.

www.TheCIE.com.au
16 Proposal to include minimum accessibility standards for housing in the National Construction Code
The Silver, Gold and Gold + Options (Options 1–3) are estimated to affect around
1.9 million new dwellings over the 10 year period, while the Gold in apartments Option
(Option 4) is estimated to affect around 0.6 million new dwellings. As this would be a
modest share of the overall dwelling stock, a change to the NCC would attend to only a
proportion of the total problem associated with a lack of accessible housing (between
3 per cent and 9 per cent by the end of the regulatory period.
Table 3 details the results of the CBA, which are estimated in NPV terms, and shows that
implementing the regulatory options result in a significant net cost to the community.
3 Estimated net impact
Impact Silver -
Option 1
($ million)
Gold - Option
2
($ million)
Gold+ Option
3
($ million)
Gold for
apartments
Option 4
($ million)
Benefits
Avoided safety costs 99.16 164.05 164.64 64.35
Avoided carer-related costs 590.80 998.90 1 002.47 391.79
Quality of life improvements 1 173.43 2 036.32 2 043.59 798.70
Avoided time in hospital/transition care 151.13 249.68 250.57 97.93
Avoided home modifications 341.89 530.95 532.85 208.25
Avoided moving costs 95.43 172.33 172.94 67.59
Avoided entry into residential aged care 75.85 218.25 219.02 85.57
Visitability benefits 112.79 147.48 148.01 33.78
Benefits for families with young dependants 0.86 1.13 1.13 0.26
Benefits for short-term injuries 39.15 51.19 51.37 11.73
Total benefits 2 680.50 4 570.28 4 586.61 1 759.95
Costs
Construction costs -5 243.10 -17 906.95 -23 591.51 -4 699.84
Opportunity cost of space -1 255.38 -7 709.42 -9 393.51 -7 596.93
Compliance verification costs - 290.49 - 290.49 - 290.49 - 83.82
Industry re-training costs - 28.47 - 28.47 - 28.47 - 28.47
Subsidy 0.00 0.00 0.00 0.00
Total costs -6 817.44 -25 935.33 -33 303.98 -12 409.06
Net benefit/costs -4 136.94 -21 365.05 -28 717.37 -10 649.11
Benefit-cost ratio 0.39 0.18 0.14 0.14
Note: Costs and benefits are presented in net present value terms covering a 10-year regulatory period from 2022 to 2031, using a
discount rate of 7 per cent. Benefits are extended out an additional 30 years, reflecting the flow of benefits over the life of dwellings
constructed during the regulatory period.
The CBA analysis within the RIS includes preliminary analysis of Option 5. As this has been done for comparison purposes it has not
been included in the summary above.
Source: CIE estimates based on estimates in appendix B-J.
The benefits are calculated based on how well each option addresses the problems
associated with accessibility through avoided and/or reduced costs as outlined in tables 1
and 2 (safety benefits such as prevented falls, carer-related costs, improved quality of life,
less time in hospital and transition care, avoided home modification or moving home,

www.TheCIE.com.au
Proposal to include minimum accessibility standards for housing in the National Construction Code 17
avoided premature entry into aged care, improved visitability and more convenience and
benefits to families with young dependants and people with short term injuries).
The costs primarily comprise those associated with construction (material, labour and
space) estimated by the quantity surveyor Donald Cant Watts Corke (DCWC). Adjusted
nationally, and taking account of the net opportunity cost of space, estimated additional
costs per dwelling range between $3 874 (Silver separate house) to $37 742 (Gold +
apartment). This is equivalent to approximately 0.5-1.9 per cent for Silver, 1.4-9.0 per
cent for Gold and 1.9-11.6 per cent for Gold +, of the average dwelling price depending
on type and the location.
By subtracting the costs from the benefits, a net benefit/cost figure is reached – a negative
figure shows that costs exceed benefits. A benefit cost ratio of more than 1 means the
benefits are greater than the cost. Table 3 shows that all regulatory options have greater
costs than benefits. Noting that the societal benefits are not captured in this table and
there are other benefits that could not be reliably quantified.
Effectiveness
To a large extent, the benefits depend on the extent to which people with accessibility
needs occupy the new accessible houses that would be built under amendments to the
code. The proportion of people already living in accessible housing when they acquire a
disability will increase as the share of accessible dwellings in the dwelling stock increase.
This will benefit people who may acquire a disability in the future, and for those young
people now, would allow the opportunity to age in place as they grow older. Others
would need to move to a newly built accessible dwelling which would be allocated
through the market rather than an administrative process to receive any significant
benefits from the proposal.
The associated costs of moving are relatively low for renters, suggesting a significant
proportion of these renters could move to an accessible rental property built under the
revised code.
However, there are barriers to owner-occupiers moving to newly built accessible
dwellings, including both financial barriers (such as real estate agent fees, conveyancing
costs and stamp duty) and non-financial barriers such as new dwellings not being in a
preferred location and preferences to remain in existing dwellings. These factors make it
less likely that new accessible dwellings built under an amended code will be occupied by
those most likely to benefit in the short to medium term. The CBA therefore assumes that
the NCC proposal would not increase the proportion of owner-occupiers who move
home as a result of acquiring a disability (although alternative assumptions were also
considered as part of sensitivity testing).
Other factors
The Consultation RIS had considered the Silver Option would provide suitable accessible
housing for the majority of those with accessibility needs. However, following
consultation, it is apparent the Silver Option would be less inclusive, particularly in
www.TheCIE.com.au
18 Proposal to include minimum accessibility standards for housing in the National Construction Code
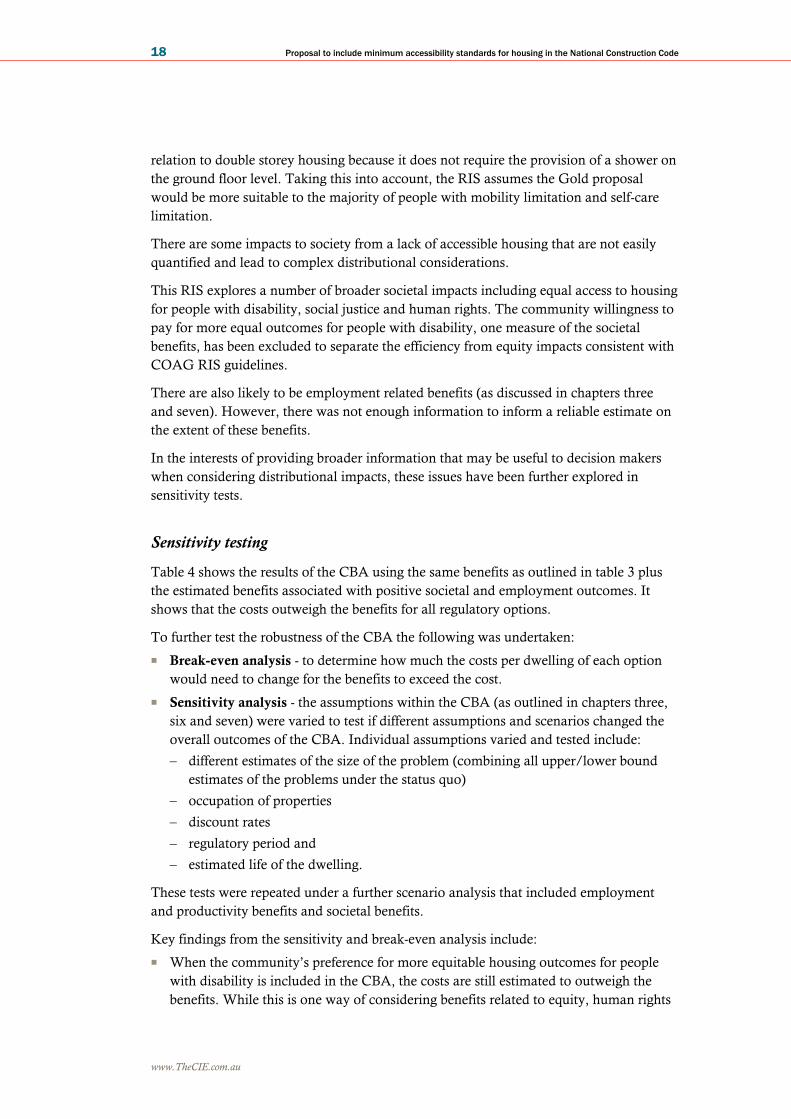
relation to double storey housing because it does not require the provision of a shower on
the ground floor level. Taking this into account, the RIS assumes the Gold proposal
would be more suitable to the majority of people with mobility limitation and self-care
limitation.
There are some impacts to society from a lack of accessible housing that are not easily
quantified and lead to complex distributional considerations.
This RIS explores a number of broader societal impacts including equal access to housing
for people with disability, social justice and human rights. The community willingness to
pay for more equal outcomes for people with disability, one measure of the societal
benefits, has been excluded to separate the efficiency from equity impacts consistent with
COAG RIS guidelines.
There are also likely to be employment related benefits (as discussed in chapters three
and seven). However, there was not enough information to inform a reliable estimate on
the extent of these benefits.
In the interests of providing broader information that may be useful to decision makers
when considering distributional impacts, these issues have been further explored in
sensitivity tests.
Sensitivity testing
Table 4 shows the results of the CBA using the same benefits as outlined in table 3 plus
the estimated benefits associated with positive societal and employment outcomes. It
shows that the costs outweigh the benefits for all regulatory options.
To further test the robustness of the CBA the following was undertaken:
■ Break-even analysis - to determine how much the costs per dwelling of each option
would need to change for the benefits to exceed the cost.
■ Sensitivity analysis - the assumptions within the CBA (as outlined in chapters three,
six and seven) were varied to test if different assumptions and scenarios changed the
overall outcomes of the CBA. Individual assumptions varied and tested include:
– different estimates of the size of the problem (combining all upper/lower bound
estimates of the problems under the status quo)
– occupation of properties
– discount rates
– regulatory period and
– estimated life of the dwelling.
These tests were repeated under a further scenario analysis that included employment
and productivity benefits and societal benefits.
Key findings from the sensitivity and break-even analysis include:
■ When the community’s preference for more equitable housing outcomes for people
with disability is included in the CBA, the costs are still estimated to outweigh the
benefits. While this is one way of considering benefits related to equity, human rights

www.TheCIE.com.au
Proposal to include minimum accessibility standards for housing in the National Construction Code 19
and social justice within a CBA, weighing up these benefits against the net costs
imposed on other members of the community is ultimately a matter for
decision-makers.
■ Where upper bound productivity and employment impacts are included as a
sensitivity test, the benefit-cost ratio improves, yet they aren’t sufficient to change the
outcome of the CBA.
4 Net benefits/costs including societal and employment-related benefits
Benefits Option 1
($ million)
Option 2
($ million)
Option 3
($ million)
Option 4
($ million)
Benefits included in central case 2 680.50 4 570.28 4 586.61 1 759.95
Societal benefits a 666.62 794.92 794.92 301.46
Employment benefits a 342.67 532.17 534.07 208.73
Total benefits (including both societal and
employment benefits) 3 689.79 5 897.37 5 915.59 2 270.14
Estimated costs -6 817.44 -25 935.33 -33 303.98 -12 409.06
Net benefits/costs -3 127.65 -20 037.96 -27 388.39 -10 138.92
Benefit-cost ratio 0.54 0.23 0.18 0.18
a As with other benefits, the estimates of the societal and employment benefits differ across options because each option provides
different levels of accessibility.
The net benefits/costs analysis within the RIS includes preliminary analysis of Option 5. As this has been done for comparison
purposes it has not been included in this summary table for the Executive Summary.
Note: The cost-benefit analysis includes the lifetime costs and benefits of all dwellings constructed over a 10-year regulatory period
from 2022 to 2031 (including the lifetime benefits of these dwellings over 40 years), using a discount rate of 7 per cent.
Source: CIE estimates.
Other key findings include:
■ Under all scenarios tested, the costs associated with all of the regulatory options
(Options 1-4) are estimated to outweigh the benefits, suggesting the findings are
reasonably robust.
– The CBA results are relatively sensitive to assumptions around the allocation of
housing.
– Extending the period over which the proposed regulatory changes are analysed
tends to result in a modest improvement in the CBA results. This reflects two
factors: the size of the problem is estimated to increase over time; and changes to
the NCC become more effective in addressing the problem as the share of
accessible dwellings in the stock increases.
■ For a proposal to break-even, the cost of the proposals would need to be significantly
lower, or the benefits significantly higher (more than $3000 per dwelling on average
for Silver). This is considered to be unlikely.
Conclusions
This RIS has investigated the inclusion of minimum accessibility housing standards in
the NCC. It considers the costs and benefits of options to ensure housing is built to meet

www.TheCIE.com.au
20 Proposal to include minimum accessibility standards for housing in the National Construction Code
the needs of all Australians, drawing on the best available information, supported by
important lived experiences and information received during consultation.
Although a lack of accessible housing imposes a significant and growing cost on the
community (incurred mostly by people with disability and older people), this RIS
concludes that regulatory options to amend the NCC for all new houses and apartments
based on Silver, Gold and Gold + impose costs that outweigh the benefits.
The CBA provides quantitative information to inform policy decisions. In an effort to
provide further information, the RIS also discusses broader impacts to society including
employment and productivity benefits and the community’s preference for more
equitable outcomes in housing.
Finally, the CBA is not the only input to decision making. Decision-makers are best
placed to weigh up factors, such as social justice for people with disability supporting
more inclusive communities and ageing in place, as well as Australia’s future progress
towards international human rights treaties, against the net cost imposed on other
members of the community.

www.TheCIE.com.au
Proposal to include minimum accessibility standards for housing in the National Construction Code 21
1 Background and introduction
Background
In late 2009, the National Dialogue on Universal Housing Design brought together key
stakeholders from the residential building and property industry, the ageing, disability
and community support sector and all levels of government to discuss how housing could
be designed and built to better respond to the changing needs and abilities of people over
their lifetime. Members of the Dialogue were:
■ Australian Human Rights Commission (AHRC)
■ Australian Institute of Architects
■ Australian Local Government Association
■ Australian Network for Universal Housing Design (ANUHD)
■ Building Commission Victoria
■ COTA Australia
■ Grocon
■ Housing Industry Association
■ Lend Lease
■ Master Builders Australia
■ National People with Disabilities and Carers Council
■ Office of the Disability Council of NSW
■ Property Council of Australia
■ Real Estate Institute of Australia
■ Stockland.
National Dialogue members:
■ recognised that traditionally most homes have not been designed or built in a way that
can easily accommodate the changing needs of households over their lifetime
■ agreed that there is a need to develop a national approach to the issue of Universal
Housing Design. Such an approach would resolve the confusion of definitions and
approaches to improving access in and around homes making them easier and safer to
live in for all people, regardless of age or ability
■ believed it is important that the community at large is informed and educated about
the benefits of Universal Housing Design
■ agreed to work together to explain to the Australian community the benefits of
Universal Housing Design – that it is about making homes easier and safer for young

www.TheCIE.com.au
22 Proposal to include minimum accessibility standards for housing in the National Construction Code
families, people who have short or long-term injuries or illnesses, as well as senior
Australians and people with disability.10
The National Dialogue members also agreed to pursue an aspirational target that all new
homes will be of an agreed Universal Housing Design standard by 2020 with interim
targets to be set within that 10-year period. A strategic plan was released in 2010 to
support the achievement of the aspirational targets — a key milestone in that plan was
the release of the LHDG and the National Dialogue on Universal Housing Design 2010,
Strategic Plan.
These aspirations have not been met, with estimates of new homes built to the LHDG
ranging between 5 and 10 per cent.
During the Australian Building Code Board’s (ABCB) consultation process, some
stakeholders noted the role of the United Nations Convention on the Rights of Persons
with Disabilities (UNCRPD) (see box 1.1), in the context of considering a minimum
accessibility standard. Australia ratified the UNCRPD in 2008, reflecting the Australian
Government’s commitment to promoting and supporting the equal and active
participation by people with disability in all areas of public life. The obligations under
the UNCRPD with respect to accessible housing are progressively realisable and
Australian governments are obliged to take steps, to the maximum of available
resources, to realise these rights over time.
All Australian governments have a range of measures in place to support the provision
of housing for people with disability.
The National Disability Strategy 2010-2020, an initiative of the Council of Australian
Governments (COAG), provides a high-level policy framework for disability policy in
Australia and aligns to the international obligations of the UNCRPD. The National
Disability Strategy (NDS) has six outcomes, each with a number of Policy Directions
which governments should have regard to when developing programs. Accessible
housing falls under Outcome One and Policy Direction Three:
Outcome 1: Inclusive and accessible communities.
People with disability live in accessible and well-designed communities with opportunity for
full inclusion in social, economic, sporting and cultural life.
Policy Direction 3 — Improved provision of accessible and well-designed housing with choice
for people with disability about where they live.
The NDS discusses the importance of taking a universal design approach to programs,
services and facilities as an effective way to remove barriers that exclude people with
disability.
10 National Dialogue on Universal Housing Design 2010, Strategic Plan, July 2010, pp. 1-2.

www.TheCIE.com.au
Proposal to include minimum accessibility standards for housing in the National Construction Code 23
1.1 United Nations Convention on the Rights of Persons with Disabilities
(UNCRPD)
As set out in the AHRC submission to the ABCB’s Options Paper,11 the general
principles of the Convention on the Rights of Persons with Disabilities (set out in
Article 3) that are relevant to housing include:
■ full and effective participation and inclusion in society
■ respect for difference and acceptance of persons with disabilities as part of human
diversity and humanity
■ equality of opportunity
■ accessibility.
The AHRC also noted in its submission other relevant articles of the UNCPRD:12
■ State Parties (under Article 4(f)), undertake to:
– promote research and development of universally designed goods, services,
equipment and facilities which should require the minimum possible adaptation
and the least cost to meet the specific needs of a person with disabilities
– promote universal design in the development of standards and guidelines.
■ State Parties shall take appropriate measures to ensure persons with disabilities
have access to, on an equal basis with others, the physical environment, including
housing. These measures shall include the identification and elimination of
obstacles and barriers to accessibility (Article 9).
■ State Parties recognise the equal right of all persons with disabilities to live in the
community, with choices equal to others, and shall take effective and appropriate
measures to facilitate full enjoyment by persons with disabilities of this right and
their full inclusion and participation in the community. This will include by
ensuring that persons with disabilities have the opportunity to choose their place of
residence and where and with whom they live on an equal basis with others and are
not obliged to live in a particular living arrangement (Article 19).
In mid-2017, the Prime Minister, on behalf of the Building Ministers’ Forum (BMF),
proposed to the COAG that a national Regulation Impact Statement (RIS) be prepared to
consider applying a minimum accessibility standard for private new dwellings in
Australia through the National Construction Code (NCC).13 This was subsequently
agreed by COAG.
The BMF confirmed in October 2017 that the RIS would, in consultation with Disability
Ministers, examine the LHDG silver and gold performance levels as options for a
minimum accessible standard; use a sensitivity approach; and be informed by appropriate
case studies.
11 Australian Building Codes Board, Accessible Housing Options Paper, Consultation Report,
April 2019, pp. 16-17.
12 United Nations website, https://www.un.org/development/desa/disabilities/convention-on-the-rights-
of-persons-with-disabilities/article-9-accessibility.html, accessed 6 February 2020.
13 Building Ministers’ Forum 2017, Communique, 21 April 2017.

www.TheCIE.com.au
24 Proposal to include minimum accessibility standards for housing in the National Construction Code
The accessibility of housing in Australia was recently raised by the United Nations
Committee on the Rights of Persons with Disabilities (the Committee) in its Concluding
Observations on the combined second and third periodic reports of Australia
(Concluding Observations), following Australia’s appearance before the Committee in
September 2019. Concluding Observations are non-binding recommendations that do
not extend or amend Australia’s obligation under the UNCRPD. In its Concluding
Observations the Committee expressed concerns about the proportion of existing
inaccessible built environment and the lack of mandated national access requirements
for housing in the NCC. The Committee recommended that Australia amend its federal
law to include mandatory rules on access for all new and extensively modified housing.
The Australian Government considers all recommendations of the Committee, but notes
that the Committee’s recommendations (including those made as part of the
Committee’s Concluding Observations in October 2019) are not legally binding but
rather the committee’s views in regard to how Australia is progressing with
implementing treaty obligations.14
During consultation, some stakeholders advocated the view that Australia has a legal
obligation under the CRPD to implement the Committee’s recommendations. This view
is noted in the report to inform decision makers as they consider the outcomes of this
RIS.
Development of the proposal and stakeholder consultation
To guide the objectives, options and terminology to be considered in the RIS, the ABCB
released an Options Paper in September 2018, including a preliminary menu of options
and costings as the basis for receiving feedback from stakeholders. Stakeholders were
invited to provide feedback on the Options Paper through the following channels:
■ consultation forums — the ABCB held consultation forums in each capital city during
October and November 2018; and
■ written stakeholder submissions — the ABCB received 179 submissions from a wide
range of organisations and individuals between September 19 and 30 November 2018.
The ABCB released a Consultation Report summarising stakeholder feedback on the
Options Paper in April 2019.
The ABCB has subsequently developed a formal proposal featuring 3 regulatory options
for minimum accessibility standards for Class 1a (houses) and Class 2 (apartments)
dwellings that broadly align with the LHDG produced by Livable Housing Australia
(LHA). Other accommodation types are out of scope on the basis that they are covered
by current NCC accessibility requirements or are for specific purposes such as a
caretaker’s residences.
■ Option 1 is based on the LHDG silver standard
■ Option 2 is based on the LHDG gold standard
14 Based on the Commonwealth’s position found at https://www.ag.gov.au/rights-and-
protections/human-rights-and-anti-discrimination/united-nations-human-rights-reporting.
www.TheCIE.com.au
Proposal to include minimum accessibility standards for housing in the National Construction Code 25
■ Option 3 is based on the LHDG gold standard, plus some additional features from the
platinum standard.
This proposal was informed by feedback from the Options Paper and outcomes of a
technical review by a reference group comprised of the ABCB’s Building Codes
Committee members and other experts. Reference group membership included:
■ Australian Institute of Architects (AIA)
■ Australian Institute of Building Surveyors (AIBS)
■ Housing Industry Association (HIA)
■ Master Builders Australia (MBA)
■ New South Wales Building Administration
■ Two access consultants.
The RIS process
Before any decision is made with respect to this proposal to change the NCC, a
Regulation Impact Statement (RIS) is required. The RIS process is designed to ensure
that regulatory decisions are consistent with the Principles of Best Practice Regulation
agreed by COAG (box 1.2).
1.2 Principles of Best Practice Regulation15
COAG has agreed that all governments will ensure that regulatory processes in their
jurisdiction are consistent with the following principles:
1 establishing a case for action before addressing a problem
2 a range of feasible policy options must be considered, including self-regulatory, co-
regulatory and non-regulatory approaches, and their benefits and costs assessed
3 adopting the option that generates the greatest net benefit for the community
4 in accordance with the Competition Principles Agreement, legislation should not
restrict competition unless it can be demonstrated that:
a) the benefits of the restrictions to the community as a whole outweigh the costs,
and
b) the objectives of the regulation can only be achieved by restricting competition
5 providing effective guidance to relevant regulators and regulated parties in order to
ensure that the policy intent and expected compliance requirements of the
regulation are clear
6 ensuring that regulation remains relevant and effective over time
7 consulting effectively with affected key stakeholders at all stages of the regulatory
cycle, and
8 government action should be effective and proportional to the issue being
addressed.
15 Council of Australian Governments 2007, Best Practice Regulations: A Guide for Ministerial
Councils and National Standards Setting Bodies, October 2007, p. 4.

www.TheCIE.com.au
26 Proposal to include minimum accessibility standards for housing in the National Construction Code
The ABCB engaged the Centre for International Economics (CIE) to prepare a RIS (this
document).
As part of this process a Consultation RIS was released for public comment in July 2020.
Consultations
Consultation with stakeholders informed the preparation of this Decision RIS. This
consultation was undertaken in two stages:
■ A targeted stakeholder consultation informed the development of the Consultation
RIS between November 2019 and May 2020
■ Public consultation on the Consultation RIS extended from 6 July to 31 August 2020.
Targeted stakeholder consultation
To inform the development of the Consultation RIS, CIE undertook a targeted
consultation process between November 2019 and May 2020. Consultations were guided
by an Issues Paper setting out CIE’s preliminary views on the issues that need to be
addressed in the RIS. Table 1.3 summarises the consultations that informed the
preparation of the Consultation RIS. More details were provided in appendix M of the
Consultation RIS.
1.3 Summary of stakeholder consultations
Consultation format Stakeholder group Date of discussion
Costing workshop Housing Industry Association 29 November 2019
Costing workshop Master Builders Australia 29 November 2019
Costing workshop Galbraith Scott 29 November 2019
One-on-one discussions Australian Network of Universal Housing
Design (ANUHD)
26 November 2019
One-on-one discussions Galbraith Scott 29 November 2019
One-on-one discussions University of NSW 9 December 2019
One-on-one discussions Centre for Universal Design Australia 9 December 2019
One-on-one discussions ADACAS 17 December 2019
One-on-one discussions Department of Social Services 4 December 2019
One-on-one discussions Master Builders Australia 12 December 2019
One-on-one discussions Housing Industry Association 13 December 2019
One-on-one discussions Occupational Therapy Australia 13 December 2019
One-on-one discussions Australian Association of Gerontology 18 December 2019
One-on-one discussions University of Technology Sydney 18 December 2019
One-on-one discussions Australian Human Rights Commission 18 December 2019
14 May 2020
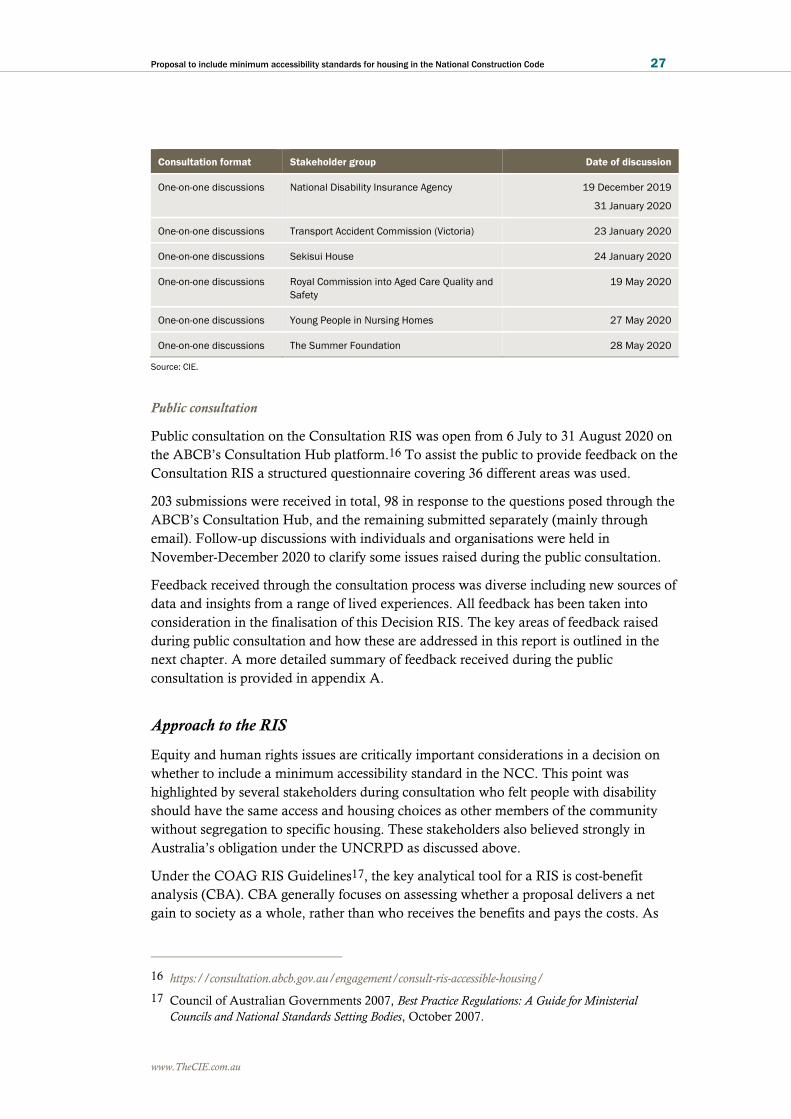
www.TheCIE.com.au
Proposal to include minimum accessibility standards for housing in the National Construction Code 27
Consultation format Stakeholder group Date of discussion
One-on-one discussions National Disability Insurance Agency 19 December 2019
31 January 2020
One-on-one discussions Transport Accident Commission (Victoria) 23 January 2020
One-on-one discussions Sekisui House 24 January 2020
One-on-one discussions Royal Commission into Aged Care Quality and
Safety
19 May 2020
One-on-one discussions Young People in Nursing Homes 27 May 2020
One-on-one discussions The Summer Foundation 28 May 2020
Source: CIE.
Public consultation
Public consultation on the Consultation RIS was open from 6 July to 31 August 2020 on
the ABCB’s Consultation Hub platform.16 To assist the public to provide feedback on the
Consultation RIS a structured questionnaire covering 36 different areas was used.
203 submissions were received in total, 98 in response to the questions posed through the
ABCB’s Consultation Hub, and the remaining submitted separately (mainly through
email). Follow-up discussions with individuals and organisations were held in
November-December 2020 to clarify some issues raised during the public consultation.
Feedback received through the consultation process was diverse including new sources of
data and insights from a range of lived experiences. All feedback has been taken into
consideration in the finalisation of this Decision RIS. The key areas of feedback raised
during public consultation and how these are addressed in this report is outlined in the
next chapter. A more detailed summary of feedback received during the public
consultation is provided in appendix A.
Approach to the RIS
Equity and human rights issues are critically important considerations in a decision on
whether to include a minimum accessibility standard in the NCC. This point was
highlighted by several stakeholders during consultation who felt people with disability
should have the same access and housing choices as other members of the community
without segregation to specific housing. These stakeholders also believed strongly in
Australia’s obligation under the UNCRPD as discussed above.
Under the COAG RIS Guidelines17, the key analytical tool for a RIS is cost-benefit
analysis (CBA). CBA generally focuses on assessing whether a proposal delivers a net
gain to society as a whole, rather than who receives the benefits and pays the costs. As
16 https://consultation.abcb.gov.au/engagement/consult-ris-accessible-housing/
17 Council of Australian Governments 2007, Best Practice Regulations: A Guide for Ministerial
Councils and National Standards Setting Bodies, October 2007.

www.TheCIE.com.au
28 Proposal to include minimum accessibility standards for housing in the National Construction Code
such, costs and benefits are added together without regard to equity considerations (i.e. ‘a
dollar is a dollar’).18
“Distributional judgements are properly made at the political level. In the interests of avoiding
subjective bias, analysts should, by and large, refrain from attaching distributional weights to
cost and benefit streams. Exceptions might be where there are unambiguous government policy
objectives to assist specific groups in the community, and where the justification for special
assistance to these groups relative to other groups is clearly established. However, for reasons
of transparency, decision-makers and the public should be made fully aware of the costs of
government action aimed at benefiting particular individuals or groups in the community.”19
In the Consultation RIS, CIE explicitly incorporated the community’s preference for
equal outcomes for disadvantaged members of the community into the CBA based on a
stated preference survey (although many stakeholders argued this did not adequately
capture the social justice aspects of the proposal). However, according to OBPR
Guidance material, equity issues should generally be separated from the CBA and left to
decision-makers.20
“Ultimately, it is up to decision makers to decide the trade-off between equity and
efficiency.”21
This is not to downplay the importance of equity and human rights issues in policy
decisions. Consistent with the view of many advocates, the OBPR material explicitly
notes that the distribution of benefits and costs across various groups is an important
consideration.22 However, how these equity considerations are weighed up against
efficiency considerations is best left to decision-makers.
Consistent with this guidance, estimates of the community’s preference for equal
outcomes for members of the community with disability and older Australians have been
excluded from the central case estimates of CBA in this report on the basis that equity
considerations are best left to decision-makers. However, these benefits are included in
the sensitivity analysis to provide some guidance to decision-makers.
18 Australian Government, Office of Best Practice Regulation, Guidance Note, Cost-Benefit
Analysis, February 2016, p. 12.
19 Council of Australian Governments 2007, Best Practice Regulations: A Guide for Ministerial
Councils and National Standards Setting Bodies, October 2007, p. 26.
20 See: Australian Government, Office of Best Practice Regulation, Guidance Note, Cost-Benefit
Analysis, February 2016, p. 12; and Council of Australian Governments 2007, Best Practice
Regulations: A Guide for Ministerial Councils and National Standards Setting Bodies, October 2007, p.
26.
21 Australian Government, Office of Best Practice Regulation, Guidance Note, Cost-Benefit
Analysis, February 2016, p. 13.
22 Australian Government, Office of Best Practice Regulation, Guidance Note, Cost-Benefit
Analysis, February 2016, p. 13.

www.TheCIE.com.au
Proposal to include minimum accessibility standards for housing in the National Construction Code 29
Terminology
In this RIS, the term ‘accessible’ is used to describe the housing features that are being
proposed, which are based on universal design principles.23 It is acknowledged that this
may not be the most appropriate term given that the changes being proposed are intended
for the mainstream housing market, rather than being in any way specialised or separated
from that market.
The term ‘accessible’ has been retained simply to provide for consistent terminology
between this RIS and earlier documents issued by the ABCB in relation to the proposal.
It is not intended that the term ‘accessible housing’ would be used in the text of any
change to the NCC.
This report
This report is a Decision RIS for the proposal to include minimum accessible housing
standards in the NCC. It supersedes the Consultation RIS based on feedback obtained
during consultation which provided further information and promoted additional
analysis.
The remainder of this report is structured as follows.
■ Chapter two discusses the feedback received during public consultation and the
methodology to respond to this feedback
■ Chapter three sets out the problem
■ Chapter four specifies the objectives and a range of options for achieving the
objectives
■ Chapter five identifies the impacts of the proposed options and sets out the CBA
framework used to assess them
■ Chapter six estimates the costs associated with each option
■ Chapter seven estimates the benefits associated with each option
■ Chapter eight brings together the costs and benefits in a CBA framework
■ Chapter nine concludes this RIS.
It may assist readers in navigating the analysis to understand that issues are discussed in
increasing detail from the:
■ Executive summary, which provides a higher level summary
■ The main body of the report (Chapters one-nine), which expands the discussion along
the elements of the RIS guidelines
■ The appendices, which provide detailed assumptions and discussion.
23 Other similar (but not identical) terms include 'visitable', 'adaptable' and 'livable'.

www.TheCIE.com.au
30 Proposal to include minimum accessibility standards for housing in the National Construction Code
2 Feedback on the Consultation RIS
As a key step in preparing the RIS for the proposal to include minimum accessibility
standards for housing in the National Construction Code (NCC) CIE prepared a
Consultation RIS.24
Public consultation on the Consultation RIS was open from 6 July to 31 August 2020
and conducted through the ABCB’s Consultation Hub platform.25 Consultation
particularly focussed around 36 structured questions to assist the public to provide
feedback on the Consultation RIS.
There are 203 submissions in total, with 98 being made through the Consultation Hub,
and another 105 being submitted separately (mainly through email). Non-confidential
submissions were published on the ABCB website www.abcb.gov.au. Confidential
submissions are not published and are not identified explicitly in this RIS. The phrase
‘a/one submission’ is used when referencing feedback from a confidential submission.
Feedback provided as part of the consultations was diverse and on a number of issues
opinion was polarised. Feedback included new data sources and insights from a range of
lived experiences. All feedback has been taken into consideration in preparing this
Decision RIS. Personal stories and industry insights provided during consultation have
been used as case studies to support the discussion of relevant issues in the Decision RIS.
After reviewing all of the submissions, CIE has identified key issues for the analysis,
considered the evidence and developed the rationale for the approach taken to address
them. The below chapter first engages with the key issues and then specific
methodological issues raised and their supporting evidence received through the
consultation process and further research.
A more detailed summary of the consultation submissions is provided in appendix A.
Key issues raised in consultation
In considering feedback received during consultation, CIE identified the following areas
of feedback that had the potential to significantly impact the Decision RIS:
■ the importance of symmetry in reporting costs and benefits
24 CIE 2020, Proposal to include minimum accessibility standards for housing in the National
Construction Code: Consultation Regulation Impact Statement, July 2020,
https://consultation.abcb.gov.au/engagement/consult-ris-accessible-
housing/supporting_documents/Consultation_RIS_Proposal_to_include_minimum_accessibility_standa
rds_for_housing_in_the_NCC.pdf
25 https://consultation.abcb.gov.au/engagement/consult-ris-accessible-housing/
www.TheCIE.com.au
Proposal to include minimum accessibility standards for housing in the National Construction Code 31
■ employment and productivity impacts
■ the need for more qualitative analysis
■ social justice considerations
■ impacts on and of other government programs
■ alternative methodological approaches, and
■ technical issues.
These matters are addressed in turn in this section.
Consultation feedback has also identified some other factors such as discount rate,
excavation cost and space cost which had been identified by the Consultation RIS
through sensitivity analysis. They will be discussed in the specific methodological issues
section of this chapter.
Symmetry in reporting costs and benefits
The importance of symmetry in reporting costs and benefits was raised by the submission
from Melbourne Disability Institute (MDI) and Summer Foundation. An accompanying
paper prepared by Associate Professor Andrew Dalton and Emeritus Professor Rob
Carter from Deakin Health Economics, Deakin University (Dalton and Carter 2020a)26,
noted that the costs and benefits should be reported in a symmetrical way to avoid bias or
confounding. Dalton and Carter (2020a) suggest that the symmetrical view of the benefits
and costs in the Consultation RIS is compromised as the ‘problem reduction approach’
over-counts the cost side while the ‘willingness to pay’ (WTP) approach under-counts the
benefit side. Their paper suggests that most items listed are different under the different
approaches and therefore benefits in these two approaches are additive with minimal
overlap. Dalton and Carter prefer the no overlap or 25 per cent overlap results.27
In the supplementary information provided later, they suggest that only private costs may
be entered into the WTP estimates, and at the maximum, reduced costs associated with
loneliness, home modification, carer related costs and incidence of moving28 in the
problem reduction approach overlap with the WTP approach.
26 Dalton, Andrew and Rob Carter 2020a, Economic advice prepared to assist with responses to the
Consultation Regulation Impact Statement on minimum accessibility standards for housing in the
National Construction Code, prepared for the Melbourne Disability Institute, University of
Melbourne and the Summer Foundation, 18 August 2020, as Appendix 1 of the submission by
Melbourne Disability Institute (MDI) and Summer Foundation to the public consultation.
27 ibid, p.6
28 Dalton, Andrew and Rob Carter 2020b, Economic advice prepared to assist with responses to the
Consultation Regulation Impact Statement on minimum accessibility standards for housing in the
National Construction Code, supplementary information prepared for The Melbourne Disability
Institute, University of Melbourne and the Summer Foundation, 6 October 2020. The
supplementary information does not provide specific overlapping ratios for the calculation. If
using the same calculation in the original submission in Dalton and Carter (2020a), these four
items of benefits in the problem reduction approach would be equivalent to 21.3 per cent, 9 per
cent, 9.4 per cent, 9.8 per cent and 12.6 per cent overlapping, respectively, for Options 1
through 5.

www.TheCIE.com.au
32 Proposal to include minimum accessibility standards for housing in the National Construction Code
The principle of symmetry is a key feature of estimating the benefits and costs associated
with regulatory impacts. In response to feedback, the application of this principle to this
RIS has been further reviewed. CIE has made some modifications with respect to the
problem reduction approach as it relates to the elements incorporated into the WTP
approach. Otherwise, the review concluded the analysis appropriately reflects the
principle of symmetry. A more detailed explanation of this analysis and revised
methodology is provided in the next two sections.
Employment and productivity impacts
Dalton and Carter (2020a) also highlight the impact on employment and productivity of
premature retirement, premature death and morbidity (section 1.7.3, p.10; section 3.5.3,
p.27) and the productivity impact for people not in the paid workforce (section 3.5.3,
p.27).
The submission from MDI and the Summer Foundation provides valuable insights into
how accessible housing can affect productivity and work opportunities. In particular, the
submission identifies four primary ways through which housing design features can
reduce productivity and work opportunities for people with mobility restrictions.
■ Housing design features can limit the ability of some people with disability to work
from home.
■ A lack of accessible housing can limit the ability of some people with disability to
move closer to employment opportunities.
■ Fatigue from living in an inaccessible home and the additional time and energy spent
on self-care and homecare reduces productivity, motivation, self-confidence and
capacity to work, study and volunteer.
■ Inaccessible housing increases reliance on paid and unpaid support with personal and
domestic activities, limiting ability to take on employment.
The above information is drawn from a survey undertaken by MDI and is an important
contribution to understanding the linkages between accessible housing and employment
outcomes. In recognition that survey respondents were identified on a self-select basis
and it is not clear to what extent one can extrapolate the survey findings across the
broader population with mobility limitation, the results have been used to inform a
qualitative discussion of the impact in the Decision RIS. The next subsection (Qualitative
analysis), the section (Employment and productivity impacts, page 115) in chapter three
and appendix J provide more discussion on this.

www.TheCIE.com.au
Proposal to include minimum accessibility standards for housing in the National Construction Code 33
2.1 Treatment of evidence from the Melbourne Disability Institute survey
The MDI survey is an important contribution to understanding the lived experiences
of individuals and the impacts of an accessible dwelling on their lives. However,
consistent with the treatment of a similar survey in a study by the London School of
Economics and Political Science (LSE) and Centre for Analysis of Social Exclusion
(CASE), the information from the MDI survey is treated as qualitative for the
following reasons.29
■ It is not clear to what extent the survey is representative of the experiences of all
people with disability. The online component of the survey was distributed via
email through disability services and advocacy networks. While this was a logical
approach to targeting people with disability (particularly within the timeframe for
submissions), it is possible that this could lead to a biased sample because:
– people who received the survey are more likely to be those that have
accessibility issues
– people with accessibility issues may have been more inclined to respond to the
survey.
■ The survey invites inferences on the benefits of ‘accessible housing’ to be drawn
based on a comparison between the experiences of those living in ‘accessible
housing’ and those living in ‘inaccessible housing’. However, houses are
categorised as accessible/inaccessible based on a self-assessment that is not
necessarily linked to the features that would be covered by the NCC proposal.
– It is self-evident that:
… those who have indicated that their house meets their accessibility needs
report having fewer issues relating to the accessibility of their house
… those who have indicated that their house does not fully meet their
accessibility needs are more likely to experience accessibility issues relating
to their house.
– It should be noted that houses assessed as ‘accessible’ were more likely to
include the sorts of features covered by the proposed changes to the NCC than
houses assessed as ‘inaccessible’ (chart 2.2). This suggests that features covered
by the NCC proposal (Options 1-3) are likely to make a home more accessible
for people with mobility limitation.
29 Provan, B. Buchardt, T and Suh, E. 2016, No Place Like an Accessible Home, Quality of life and
opportunity for disabled people with accessible housing needs, London School of Economics and
Political Science and Centre for Analysis of Social Exclusion, CASE report 109, July 2016, pp.
5-6.

www.TheCIE.com.au
34 Proposal to include minimum accessibility standards for housing in the National Construction Code
2.2 Accessibility features in respondents homes
Data source: Wiesel, I. Lived experience and social, health and economic impacts of inaccessible housing, prepared for the Melbourne
Disability Institute, University of Melbourne and the Summer Foundation, 18 August 2020, as Appendix 2 of the submission by
Melbourne Disability Institute (MDI) and Summer Foundation.
The survey results provided as part of the consultation response incorporated useful case
studies. The following points are noted with respect to the case studies.
■ While wheelchair users account for around 6 per cent of all people with a mobility
limitation due to disability, the majority of case studies (7 of 9) provided in the joint
submission by MDI and Summer Foundation, referred to the experiences of
wheelchair users.30 .
■ Some case studies refer to challenges experienced working from home. However, the
types of design features that the case studies indicate would assist are not necessarily
the features that would be provided under the NCC proposal. Examples of this
include a height adjustable table, multiple computer screens, a microphone for
dictation and adequate space for a wheelchair to enable work/studying from home
and adjustable kitchen shelves.
Qualitative analysis
A key theme presented during the consultation period, is the need for more qualitative
analysis to support the RIS. Australian Network for Universal Housing Design
(ANUHD) 31 stated:
30 Submission by Professor Bruce Bonyhady and Dr Di Winkler for MDI and Summer
Foundation, Appendix 2, case studies for wheelchair users (all or some of the time) on pages
19, 25, 27, 30, 35, 36 and 39, accessed 1 December 2020,
https://consultation.abcb.gov.au/engagement/consult-ris-accessible-
housing/consultation/published_select_respondent
31 Submission by Margret Ward for ANUHD, p.11, accessed 1 December 2020,
https://consultation.abcb.gov.au/engagement/consult-ris-accessible-
housing/consultation/published_select_respondent
0 10 20 30 40 50 60 70 80 90
Safe continuous step-free path from the street or…
At least one step-free entrance
Internal doors and corridors that faciliate comfortable…
A toilet on entry level that is easy to access
A bathroom that contains a hobless shower recess
Grabrails in the toilet, shower or bath
Re-inforced walls around toilet and shower
Stairways with handrails
Stairways without handrails
Share of dwellings (%)
Accessible
Inaccessible

www.TheCIE.com.au
Proposal to include minimum accessibility standards for housing in the National Construction Code 35
The consultation RIS repeatedly concedes that the available quantitative data are incomplete
and unreliable. We share this concern and add that the Consultation RIS does not provide any
qualitative analysis in these areas as required.
The MDI and Summer Foundation submission echoes this concern, ‘[i]t is notable,
however, that they make limited reference to equity considerations and that their analysis
does not include any qualitative analysis’.32
In response to this feedback, new information and suggestions to further improve the
qualitative analysis have been developed and are discussed in the next section which
discusses the Decision RIS approach to economic analysis and CBA (Qualitative analysis
on page 41).
Social justice
Several submissions highlighted the importance of social justice considerations. Dalton
and Carter (2020a) discuss social justice (maximising social welfare function through
distributive justice, that is, who receives the goods and services produced) as a reason for
government intervention, links this to the principle of solidarity, and points to the need
for social justice in housing in human rights frameworks and in other government
reports.33
The RIS is an opportunity to inform decision-makers through an assessment of the most
efficient way to achieve social justice and human rights objectives.
By quantifying, to the extent possible, the likely costs and benefits associated with each
proposed option the RIS will assist to inform informed decision making. In this RIS, the
estimates of costs and benefits are further supported by qualitative discussions on
unquantifiable non-financial social costs and benefits. This is discussed in more details in
the ‘Qualitative analysis’ subsection in the next section on page 41 and ‘Social justice,
equity and costs to the community’ subsection in chapter three on page 113.
The discussion on social justice is also related to the discussion of some potential
consequences of the proposed changes. One of these would be housing affordability,
which was a prominent theme of many (25 per cent) submissions. Higher construction
costs of new dwellings would increase the housing prices, especially for new housing in
non-metropolitan areas where the housing supply is relatively elastic, adversely affecting
housing affordability. chapter seven provides more detailed discussion on the housing
affordability impact within a supply-demand framework.
Other government programs
Feedback during the consultation period suggested that the RIS should provide more
analysis on the impacts of government programs.
32 Professor Bruce Bonyhady and Dr Di Winkler, op.cit., p.3
33 Section 2.2, p.14 and section 2.3.1, p.15

www.TheCIE.com.au
36 Proposal to include minimum accessibility standards for housing in the National Construction Code
The methodology in the Consultation RIS is based on outcomes with existing policies in
place, so implicitly takes current policies/programmes into account. Reviewing other
government programmes separately is beyond the scope of the RIS.
CIE notes that it is possible that where some government programs may not have yet had
their full effect (such as NDIS), the estimates may overstate the size of problem.
However, as the effectiveness of future policies are uncertain, this reinforces the approach
that CIE estimates be based on actual outcomes under current policy settings.
It was also noted during consultation that proposed changes to the NCC could lower the
cost of existing government policies and that this should be incorporated into the
analysis. CIE notes this but wishes to avoid any risk of double counting. For example,
accessibility features in new dwellings may lead to less need for funding home
modifications through the National Disability Insurance Scheme (NDIS). The
Consultation RIS has included home modification as a part of the problem, and in doing
so has inherently recognised the impact of reducing funding from the NDIS.
Alternative methodological approaches
Some submissions suggest alternative approaches to the CBA than those required by the
Council of Australian Governments. Best Practice Regulation Guidelines:34
■ SGS Economics and Planning (SGS) suggests a cost-effectiveness analysis (CEA)
■ One local council proposes a capability approach, and
■ Post-Polio Victoria (PPV) suggests a socio-ecological framework.
Under the CEA approach, ‘the desired outcome or end-state is defined. With this
outcome established, a range of implementation options can be compared based on their
relative costs and effects. This approach, unlike CBA, does not require the benefits to be
monetized.’35
This CEA approach is not practical and applicable for this RIS because the outcome is
not defined. More specifically it is because six options have been developed. At the least,
the Guidelines require two options to be considered – a regulatory option and a non-
regulatory option. Moreover, different levels of accessibility requirements have been
considered. These options have different outcomes and impacts. In order to compare
them, benefits as well as costs have to be estimated.
The ‘capability approach’, developed by Amartya Sen and others,36 extends the
traditional income based approach to welfare evaluation. Under this approach, the
34 Council of Australian Governments, Best Practice Regulation, A Guide for Ministerial
Councils and National Standard Setting Bodies, October 2007.
https://pmc.gov.au/sites/default/files/publications/COAG_best_practice_guide_2007.pdf
35 Submission by Emily Hobbs for SGS Economics and Planning, p.2, accessed 1 December
2020, https://consultation.abcb.gov.au/engagement/consult-ris-accessible-
housing/consultation/published_select_respondent
36 See Sen, A. 1992, Inequality Reexamined, Oxford University Press, Oxford; and Sen, A. 1999,
Development as Freedom, Oxford University Press, Oxford, for an outline

www.TheCIE.com.au
Proposal to include minimum accessibility standards for housing in the National Construction Code 37
measure of well-being is the capability (which is a practical opportunity) to achieve various
functionings (which are the actual achievements) that an individual may value. These
functionings are very broad and include things such as being well nourished, being
healthy, having productive and interesting work and so on. In this view, income is only
one of the constraints that affect an individual’s capability. Other market or non-market
constraints exist. For example, disability can be understood as a deprivation in terms of
capabilities or functionings that results from the interaction of an individual’s personal
characteristics (e.g. age, impairment), the basket of available resources (assets and
income) and environment (social, economic, political, cultural).37
The capability approach provides a valuable framework for measuring outcomes or well-
being in general for the development of social economic policies. For example, multi-
dimensional measures of health and non-health capabilities could be developed
compatible with the capability approach.38
While it is possible to view the implementation of a building code as an expansion of the
capability set for people with disability, this does not eliminate the need for CBA. Where
resources are limited and trade-offs need to be made, it is still important to compare the
value of the increased capability with the cost of providing that increase. This ensures the
best use of resources as to maximise the potential increase in capability.
The Consultation RIS has identified a wide range of impacts and benefits of accessible
housing, from reduced safety risks, reduced hospitalisation and health care costs, to
reduced loneliness. All of these effects, as identified, are consistent with the capability
approach. The list of benefit measurements have been further broadened with new
information revealed in the public consultation. Detailed discussions on these issues –
temporary injuries, families with young dependants, anxiety and mental health impacts,
social isolation, quality of life – are provided in the specific methodological issues section
on page 43.
Moreover, the needs based assessment for the demand for accessible housing as
suggested by the council submission has difficulties in practice. It is difficult to assess
those needs because the definition of need itself is value based and will vary depending
on who tries to define it.39
As for the usefulness of the capability approach in regard to the UNCRPD, a major issue
arises with the practical identification of capabilities. For example, Caroline Harnacke
argues that ‘the capabilities approach can be regarded as supporting the rights specified in
the UNCRPD, but that it proves unable to guide the implementation process due to an
37 Mitra, S. 2006, “The Capability Approach and Disability”, Journal of Disability Policy Studies,
16(4), p.236-247
38 Gandjour, A. 2014, “Cost-Effectiveness Analysis in Health Care Based on the Capability
Approach”, Gesundheitswensen (Healthcare) 2014: 76, p.39-43
39 Mitra (2006), p.245

www.TheCIE.com.au
38 Proposal to include minimum accessibility standards for housing in the National Construction Code
insufficient grounding of the capabilities. Employing the capabilities approach thus leads
to only limited results’.40
The PPV submission suggested a socio-ecological framework. The framework gives a
more balanced perspective on the needs of people with disability and older people in
terms of not only their needs, but also their families, friends, carers and social networks,
and the whole Australian society. It ‘accounts for the impact of an individual’s social and
environmental context on their health outcomes’. For example, inability to access their
friends’ homes can impact on ‘their commitment to continue to build a life full of
meaning’ and, due to their friends’ potential lack of understanding of their physical
limitations, to diminished social relationships or inclusion.41
The socio-ecological framework is therefore not a different approach to the CBA per se.
Instead, it provides a perspective to include broad impacts. This has been addressed in
the RIS by including additional benefits – see detailed discussions on temporary injuries,
families with young dependants (page 51), anxiety and mental health impacts (page 51),
social isolation (page 52), quality of life (page 53) in the specific methodological issues
section.
Technical change and interpretation of the proposal
Feedback was received during consultation with respect to the application of the LHDG
guidelines and associated universal designs.
Several submissions have raised the issue that the proposed changes to the NCC did not
accurately reflect the LHDG. In ANUHD’s words,42
The draft changes to the NCC has watered down the LHD guidelines. … The draft changes to
the NCC, as they stand, would render homes built under any of Options 1-4 inaccessible.
These comments were endorsed by the MDI and Summer Foundation43 and the
Australian Rehabilitation and Assistive Technology Association (ARATA).44
It was also noted that home modifications which tend to be specialised and tailored to an
individual’s needs are not substitutes for proposed accessible features. For example, the
submission from the Home Modification Information Clearinghouse (HMinfo) notes that
most modifications are bespoke to meeting special needs and not included in the
40 Harnacke, C. 2013, “Disability and capability: exploring the usefulness of Martha Nussbaum’s
capabilities approach for the UN disability rights convention”, Journal of Law, Medicine & Ethics,
41(4), p.768-80.
41 Submission by Barbary Clarke for Post-Polio Victoria, p.6, accessed 1 December 2020,
https://consultation.abcb.gov.au/engagement/consult-ris-accessible-
housing/consultation/published_select_respondent
42 Margret Ward, op.cit., p.6
43 Professor Bruce Bonyhady and Dr Di Winkler, op.cit., p.4
44 Submission by Associate Professor Libby Callaway for ARATA, p.3, accessed 1 December
2020, https://consultation.abcb.gov.au/engagement/consult-ris-accessible-
housing/consultation/published_select_respondent

www.TheCIE.com.au
Proposal to include minimum accessibility standards for housing in the National Construction Code 39
universal designs.45 This suggests that some components of the size of the problem may
be overstated, for example, the safety costs and care costs which were estimated
according to the difference before and after home modifications.
There were also a range of different technical interpretations of the proposal. The
following examples in particular could have a significant bearing on costs and benefits:
■ requiring only a certain proportion rather than all carpark spaces in apartment
buildings to be accessible
■ requirement for doorway width
■ entrance requirement – one-step as default (HIA)
■ exemptions, and
■ inclusion of access to outdoor areas under all specifications.
Feedback associated with the technical interpretation of the proposal was referred to the
ABCB. The ABCB, in response to comments from the public consultation and
discussions with advocates and governments, amended the proposed NCC draft standard
to reflect more closely the LHDG specifications in Options 1-3. A quantity surveyor was
engaged to provide their independent estimate of its impact on all relevant construction
and space costs which are discussed in more detail in chapter six of this report and a
separate costing report Accessible Housing: Estimating the Cost Impact of Proposed Changes to
NCC.46
Overall approach to economic analysis and CBA
Considering polarised views
As mentioned above, submissions have very different views on specific issues; for
example, some argue the benefits are overstated and costs understated and others argue
the opposite.
In most cases, both sides have good reasons for their argument, and their differences
reflect the complexity of the issues and the very nature of uncertainties around the
assumptions.
A key example is, Dalton and Carter (2020) argue for a higher value of statistical life
(VSL) in the RIS - $7 million (with a range between $4.5 million and $7.9 million) as
opposed to $4.5 million used in the Consultation RIS.47 CIE has discussed this issue with
45 Submission by Professor Catherine Bridge for Home Modification Information Clearinghouse,
p.5, accessed 1 December 2020, https://consultation.abcb.gov.au/engagement/consult-ris-accessible-
housing/consultation/published_select_respondent
46 DCWC 2020, Accessible housing: Estimated cost impact of proposed changes to NCC, Report Version
V2.0 – 14 December 2020, see Table 2.1 and appendices.
47 Dalton and Carter (2020a), p.10

www.TheCIE.com.au
40 Proposal to include minimum accessibility standards for housing in the National Construction Code
OBPR, which has reiterated that the RIS approach should follow best practice, based on
the guidance of OBPR which draws reference from international literature.48
The Decision RIS acknowledges these uncertainties (and therefore disparate views) in the
analysis by assigning a range of values for the relevant parameters. Sensitivity analysis is
conducted with these assumptions in order to establish how sensitive the net benefit is to
the assumed cost and benefit estimates (for more details see chapter eight).
Focusing on the problem reduction approach
In the Consultation RIS, two approaches were used to estimate the benefits of the
proposed accessibility requirements in the NCC:
■ The central approach, problem reduction approach, was based on CIE’s estimate of
the extent to which one would expect the proposed changes to the NCC (and other
options) to improve the accessibility of housing.
■ An alternative approach was based on estimates of household willingness to pay
(WTP) for various accessibility features when choosing a home to buy or rent. These
estimates were derived from a stated preference survey using ‘choice modelling’
questions that offered hypothetical choices between homes with differing accessibility
features and rents.
Taking into consideration feedback received on the Consultation RIS, the RIS continues
to apply the problem reduction approach, which is in keeping with OBPR guidance,49
As a general rule, estimates of individuals’ valuations of goods and services derived from
observing their behaviour in markets tend to be more creditable than those from survey
questionnaires (Boardman et al. 2010). Observing purchasing decisions directly reveals
preferences, whereas surveys elicit statements about preferences.
The RIS continues to draw on the WTP study to substantiate/estimate some elements for
the problem reduction approach, for issues such as benefits to households without
mobility limitations (see more detailed discussions in ‘Benefits to households without
mobility limitations’ subsection in the next section, page 43).
As supported by submissions during consultation the WTP approach captures some
additional benefits. CIE has to the extent feasible and appropriate combined these WTP
estimates under the problem reduction approach and updated analysis with new
information suggested by submissions and/or new research on temporary injuries,
families with young dependants, mental health impact, quality of life, informal care cost
and employment impacts. More details are provided in the next section under each
specific methodological issue.
48 OBPR 2014, Value of statistical life, Best Practice Regulation Guidance Note, Office of Best
Practice Regulation, Department of the Prime Minister and Cabinet, December 2014,
https://www.pmc.gov.au/sites/default/files/publications/Value_of_Statistical_Life_guidance_note.pdf
49 OBPR 2020, Cost-benefit analysis, Guidance Note, March 2020, Office of Best Practice
Regulation, Australian Government Department of the Prime Minister and Cabinet,
https://www.pmc.gov.au/resource-centre/regulation/cost-benefit-analysis-guidance-
note#:~:text=A%20CBA%20involves%20a%20systematic,or%20effects%20on%20one%20group., p10.

www.TheCIE.com.au
Proposal to include minimum accessibility standards for housing in the National Construction Code 41
Adding some benefits estimated through WTP to the central approach is conceptually
consistent with the suggestion by Dalton and Carter (2020a) that the benefits in the
problem reduction approach and the WTP may be additive.50 Moreover, it would avoid
the double counting problem.
Qualitative analysis
The importance of qualitative analysis was a key theme during consultation as identified
in the first section of this chapter. Qualitative analysis allows appropriate consideration
of costs and benefits that cannot be valued in dollar terms, as stated in the OBPR
guidance note of March 2020 – the qualitative analysis is under the section ‘Dealing with
costs and benefits that cannot be valued in dollar terms’.51 Qualitative analysis is part of
the overall analysis and is to be used when quantitative information is not available.
Based on feedback on the Consultation RIS, some areas of qualitative analysis have been
enhanced or added, for example the impacts of a lack of accessible housing on equity,
dignity and employment on people with disability and older people. The MDI survey of
people with disability and senior people provides useful inputs into the qualitative
analysis, for example, quality of life, ability to perform domestic activities, to study, work
or volunteer, impact on social and family relations. It is noted that some of these impacts
may be quantifiable.
Qualitative analysis provides a role in testing the appropriateness of quantitative analysis,
what factors could change the results of quantitative analysis, and how likely such
changes might be. For example, the Accessible Adult Change Facilities in Public
Buildings: Final Regulation Impact Statement prepared by Ernst & Young (2018) 52
included a separate section of qualitative analysis because:
■ some impacts are not quantifiable, and
■ in their judgement, the unquantifiable benefits were in that case deemed to be
potentially very substantial, and in fact in their view the qualitative benefits would
almost certainly outweigh the quantitative benefits.
Table 2.3 summarises the benefits that may be subject to qualitative analysis. Section
‘Qualitative assessment’ in chapter three (from page 113 on) provides more detailed
discussion and some indicative estimates.
50 Dalton, Andrew and Rob Carter 2020a, Economic advice prepared to assist with responses to the
Consultation Regulation Impact Statement on minimum accessibility standards for housing in the
National Construction Code, prepared for the Melbourne Disability Institute, University of
Melbourne and the Summer Foundation, 18 August 2020, as Appendix 1 of the submission by
Melbourne Disability Institute (MDI) and Summer Foundation to the public consultation.
51 OBPR (2020), p.12
52 Ernst & Young 2018, Accessible Adult Change Facilities in Public Buildings: Final Regulation Impact
Statement, September 2018, p.47

www.TheCIE.com.au
42 Proposal to include minimum accessibility standards for housing in the National Construction Code
2.3 Benefits for qualitative analysis
Benefits Quantifiable? Qualitative analysis
Improved community inclusion and
social participation
In the Decision RIS, ‘loneliness’ is
part of the quality of life assessment.
In addition, ‘visitability’ impact due to
inaccessible housing is separately
quantified and is further improved by
attributing the benefit of improved
ability to visit others to all new
housing – see the discussion in the
social isolation subsection for
details)
Loneliness due to accessibility of
housing for people with disability and
older Australians is included in the
quality of life assessment (page 88 in
chapter three)
Increased opportunities to engage
with the workforce
Indicative estimates made through
cross-checking the SDAC data and
the MDI survey results with a note
that some of the data may have
representativeness and self-selection
bias issues – see the discussion in
the Employment and productivity
impacts subsection
Given the issues noted in the left
column, the quantification is used in
the qualitative analysis as an
indication of the potential size of this
benefit
Reduced reliance on social welfare This is a consequence of increased
opportunities to engage with the
workforce, and thus is not treated as
a separate benefit to avoid double
counting
This is a consequence of increased
opportunities to engage with the
workforce, and thus is not treated as
a separate benefit to avoid double
counting
Greater personal freedom and
empowerment
This is part of the quality of life
benefits and thus is not treated as a
separate benefit to avoid double
counting
Included in the quality of life benefit
Improved mental health This is part of the quality of life
impact. Noting there are
representativeness issues,
quantification has been made
through using the MDI survey results
and the mental health costs
estimated by other studies – see the
discussion in Anxiety and mental
health impacts subsection
Included in the quality of life benefit
The quantification is used to cross
check whether the indicative
estimate of quality of life impact is in
the adequate scale
Improved quality of life, wellbeing
and mental health outcomes for
informal carers
The CBA includes the opportunity of
cost of time. This is included in the
costs of informal care
General qualitative discussion when
quantifying these impacts
Better awareness of diversity in
society
Difficult to quantify as it is not a
financial benefit, and mainly an
objective of a broader policy regime.
Quantification has been made
through WTP analysis (the whole
society’s willingness to pay for
improved accessible features)
This is mainly an objective of a
broader policy regime – the RIS is to
establish whether accessible housing
proposal in the NCC is the most
efficient way to achieve the objective
and includes qualitative discussion
The quantification is used in the
qualitative analysis as an indicative
estimate for this aspect of the
benefits
See the discussion in Social justice
subsection for details
Increased engagement in human-
rights and social impact
Difficult to quantify– see above
discussion on better awareness of
diversity in society
As above for better awareness of
diversity in society

www.TheCIE.com.au
Proposal to include minimum accessibility standards for housing in the National Construction Code 43
Benefits Quantifiable? Qualitative analysis
A more equitable society Difficult to quantify – see above
discussion on better awareness of
diversity in society
As above for better awareness of
diversity in society
Source: CIE.
Specific methodological issues
Benefits to households without mobility limitations
As discussed earlier in this chapter, consultation submissions raised concerns about the
application of the principle of symmetry in presenting costs and benefits.
Dalton and Carter (2020a) raise concerns in this regard with respect to benefits for
persons without limited mobility; specifically, that the ‘problem-reduction approach’
counted costs but not benefits for persons without limited mobility.
CIE agrees the problem-reduction approach may have omitted some benefits to persons
without limited mobility relating to ease of access and use (for example, manoeuvring
prams or moving furniture) and receiving visits from family and friends with limited
mobility. In response, the RIS now incorporates the stated preference survey results in an
additional qualitative discussion of quality of life impact and cost to community
assuming partial or no overlapping, which serves to illustrate the likely size of relevant
benefits (see section ‘Qualitative assessment’ in chapter three). This is considered a more
appropriate response than that proposed by Dalton Carter (2020a) which was to confine
cost estimates to buildings occupied by persons with limited mobility. As new dwellings
not occupied by people with accessibility needs would also have higher construction costs
it is felt this would result in an underestimation of the real cost impacts of the options.
Dalton and Carter (2020a) also suggest that some of the benefits estimated as part of the
WTP approach should be added to the benefits already estimated in the problem-
reduction approach. Their view is that only up to 25 per cent of the benefits measured
under the two approaches overlap and therefore at least 75 per cent of the benefits from
each approach should be added together to estimate total benefits. In their supplementary
information, Dalton and Carter suggest that only private costs be entered into the WTP
estimates, and at the maximum, reduced costs associated with loneliness, home
modification, carer related costs and incidence of moving in the problem reduction
approach overlap with the WTP approach.
CIE’s view is that the two approaches are primarily measuring the same benefits. For
example, benefits of moving around indoors in the WTP approach would include the
benefits of reduced falls, reduced time in hospital/transition care, reduced home
modification costs and carer-related costs, reduced incidence of moving and reduced
premature/inappropriate entry into aged care in the problem reduction approach.
A significant overlap of benefits is consistent with the finding that the two approaches
result in similar estimates of benefits for the subgroup of the population with limited
mobility. While the debriefing questions in the stated preference survey do not give full

www.TheCIE.com.au
44 Proposal to include minimum accessibility standards for housing in the National Construction Code
detail on the issues respondents took into consideration when expressing their WTP, the
most neutral assumption is that respondents took account of the costs they would bear
relating to falls, time in hospital, loneliness, home modification, moving and premature
aged care entry. While it is acknowledged that there are some public costs associated
with these problems, the economic costs are primarily borne by the affected
individual/household.
Based on feedback from stakeholders in relation to the benefits to persons without limited
mobility, the RIS incorporates a refined problem-reduction approach that utilises values
from the stated preference survey where appropriate. For example, the whole
community’s willingness to pay for accessible housing (sub-section ‘Social justice, equity
and costs to the community’ in chapter three on page 113), and additional research on
temporary injuries (page 107), families with young dependants (page 112), mental health
impact and quality of life (page 88 of chapter three and appendix I) are under this
approach additive to other problems.
Discount rate
Several submissions, including ANUHD, Summer Foundation and MDI, suggest that
the central case discount rate of 7 per cent used in the Consultation RIS is too high. They
propose a rate of 3 per cent.
The Consultation RIS was prepared following the OBPR guidelines issued in March
2020, which requires a central discount rate of 7 per cent with rates of 3 per cent to 10 per
cent used in a sensitivity analysis.53 Subsequent discussion with OBPR after the public
consultation period has endorsed the use of 7 per cent.
CIE also references detailed work on social discount rates prepared by CIE for clients
including Infrastructure Australia,54 based on the rate of return required in capital
markets for private investment with adjustment to account for the fact that project
resources may partly come at the expense of consumption rather than alternative
investments. Risk premium is a key factor to determine the social discount rate which is
especially true for long term investment and in an environment with significant
uncertainties.
The Decision RIS adopts a 7 per cent discount rate in the central case CBA.
53 OBPR 2020, Cost-benefit analysis, Guidance Note, March 2020, Office of Best Practice
Regulation, Australian Government Department of the Prime Minister and Cabinet,
https://www.pmc.gov.au/resource-centre/regulation/cost-benefit-analysis-guidance-
note#:~:text=A%20CBA%20involves%20a%20systematic,or%20effects%20on%20one%20group., p.7
54 CIE 2017, Real social discount rates for Australian infrastructure projects: Policy discussion paper, final
report for Infrastructure Australia, February 2017.

www.TheCIE.com.au
Proposal to include minimum accessibility standards for housing in the National Construction Code 45
Space cost
Capital value of space
Dalton and Carter (2020a) also express concern that the problem-reduction analysis
includes insufficient benefits from the additional space needed to meet the options. They
argue the analysis includes benefits of improved functionality but excludes the capital
value of the additional space. CIE does not support adding the capital value to
functionality benefits as capital value reflects the preferences of home purchasers, which
takes account of functionality benefits, at least in principle. Including both items would
therefore risk double counting benefits. No evidence has been provided that accessible
features add value to a property. One personal story in a submission noted,55
I have thrown so much of my savings [at]… making my current home accessible that should I
sell it I wouldn’t be making a large profit margin that could be used to add accessibility [at]…
new home. Modifications made didn’t add value to the property but have cost me over
$100,000.
It is acknowledged that the functionality benefits estimated in the Consultation RIS are
not the only benefits of a larger home and that more benefits may be included (see
separate discussions in later sub-sections – Temporary injuries, Families with young
dependants, Anxiety and mental health impacts, Quality of life, Employment and
productivity impacts).
The stated preference survey was used to place a value on the increased size of homes,
controlling for accessibility features. This value has been used to offset part of the
opportunity cost of additional space.
Required additional space
Stakeholder views on additional space requirements as a result of the proposed
accessibility standards in the NCC were diverse and at either end of the spectrum – some
suggested that the space requirement in the Consultation RIS was overstated while others
argue space sizes were too small.
In preparing this RIS this feedback was considered, and available evidence and data
further reviewed to inform the updated estimates. This included:
■ More scenarios to reflect the different space outcomes developed in the updated
quantity surveyor work.
■ A qualitative discussion on the impacts of exemptions for step free access.
Excavation cost
The Consultation RIS presented estimates of the additional excavation costs associated
with complying with the proposed accessibility standard. These estimates were based on
information provided by HIA and were not included in the central case estimates (they
were included as part of the sensitivity/scenario analysis).
55 p.17 of Appendix 2 of Summer Foundation and MDI submission

www.TheCIE.com.au
46 Proposal to include minimum accessibility standards for housing in the National Construction Code
During consultation, stakeholders were asked whether additional excavation costs are
likely to be required to comply with the proposed standard(s). Of the 75 responses to that
question, more than half indicated that additional excavation costs are likely or highly
likely (chart 2.4).
2.4 Stakeholders responses: are additional excavation costs likely to be required
Note: Answer to Question 23
Data source: Stakeholder feedback on the Consultation RIS.
Including the HIA estimates could add an additional $230 million per annum to the costs
of the proposal. The HIA submission notes that industry feedback on these costs suggests
that they are likely to be conservative and in most cases should be doubled.56 According
to the HIA submission:
■ The need for significant additional excavation work comes from the step free entrance
requirements challenging all sites and may require costly additional excavation work.
■ The alternative option of using the garage as the step-free entrance is also not easily
addressed in their view.
■ The step-free access requirements have a number of associated requirements
(including path widths, path structural loading requirements, cross fall, level landings
on the path, as well as 1 200 mm by 1 200 mm space on the arrival side of the door)
that had not been adequately taken into account.
■ Anecdotal evidence from one member that only around 20 per cent of sites are
suitable to provide Silver level housing (without significant excavation costs).
■ Examples of lots where providing step-free access would be challenging.
It should be noted that the submission does not provide data or evidence of the
proportion of blocks overall that would, in their view, not be able to comply. Though
costs were contended to be insufficient, alternative estimates were not provided in this
submission.
56 Submission by Simon Croft for HIA, p. 21, accessed 1 December 2020,
https://consultation.abcb.gov.au/engagement/consult-ris-accessible-
housing/consultation/published_select_respondent.
Highly likely22.7%
Likely33.3%
Unlikely37.3%
Highly unlikely6.7%

www.TheCIE.com.au
Proposal to include minimum accessibility standards for housing in the National Construction Code 47
However, as these costs could have a material impact on the CBA results, these issues
required more consideration. With respect to exemptions, CIE attempted to get
information including through a facilitated discussion with stakeholders on exemptions.
As no definitive data was available, CIE has assumed that up to 10 to 15 per cent of Class
1a buildings could be exempt from a step free access requirement based on the following
information:
■ NSW Government data on the topography suggests that around 12 per cent of sites in
future potential greenfield development have a total slope (across the whole site)
greater than 1:14.
■ About 11 per cent of separate houses and townhouse developments in Victoria
between 2005 and 2016 were built on lots less than 300 m2.57 This share is likely to
have grown significantly, as lot sizes in Victoria have fallen significantly over time.58
See the section ‘Qualitative assessment of exemptions’ in chapter eight (from page 195
on) for more details.
The quantity surveyor, Donald Cant Watts Corke (DCWC), were also engaged to
provide an independent review of the issues raised in submissions and their cost
implications. In their assessment of additional excavation costs in their updated costing
for the RIS, DCWC notes:
■ for Class 1a buildings if significant excavation works were required to provide access
from the kerb into the dwelling, access through a garage would be a more likely
design response and avoid excessive excavation cost;59
■ for Class 2 buildings, additional excavation costs are factored into the construction
cost rate of a basement carpark.60 However this is highly dependent on the extent to
which allocated resident parking is provided (the proposed NCC changes will not
mandate the provision of resident parking as this is considered to be a planning
matter).
Case studies
Personal stories and industry insights provided during consultation have been used as
case studies to support the discussion of relevant issues in the RIS. For example, stories
about home modification, temporary injuries, emotional stress and other issues illustrate
the problem in relevant sections of the RIS. Cost estimates from industry submissions
and personal stories have been compared to existing scenarios.
Table 2.5 lists some lived experiences discussed in the report.
57 SGS Economics and Planning 2019, Planning Schemes Research, Draft Report V2, June 2019,
Table 7, p.38
58 UDIA 2020, State of the Land 2020 National Residential Greenfield and Apartment Market Study, p.
46 See: https://udia.com.au/research/udia-state-of-the-land-2020/, accessed January 2021
59 DCWC (2020), Table 4, p.10; p.16
60 DCWC (2020), p.14

www.TheCIE.com.au
48 Proposal to include minimum accessibility standards for housing in the National Construction Code
2.5 List of lived experiences
Topic Submission Discussion in the report
Lack of supply Anonymous Submission 570905003;
Raelene West;
Hayley Stone, Physical Disability Council of
NSW
Box 3.3
Safety Jane Scott Box 3.21
Additional assistance Melbourne Disability Institute (MDI) of
University of Melbourne and Summer
Foundation Submission
Box 3.25
Home modification Amelia Condi for Summer Foundation;
Lee Jordan
Box 3.30
Moving home Associate Professor Libby Callaway for the
Australian Rehabilitation and Assistive
Technology Association (ARATA)
Submission
Box 3.33
Longer stay in hospital or transition
care
Anonymous Response 699935736 Box 3.35
Visitability Queensland Disability Network;
Anonymous Submission 656157319;
Submission No. ANON QUHT GNKK D;
University of Melbourne and Summer
Foundation Submission
Box 3.38, Box 3.39, Box 3.48
Ageing in place and premature or
inappropriate entry into residential
aged care or other institutional care
ANUHD;
Amelia Condi for Summer Foundation
Box 3.38, Box 3.39; Box 3.41
Young people with disability Amelia Condi for Summer Foundation Box 3.30, Box 3.38
Employment and productivity MDI and Summer Foundation;
Jane Scott
Box 3.50, Box J.7, Box J.8,
Box J.11
Short term injuries Anonymous Submission 184073852;
Lee Jordan
Box 3.43
Family with young dependants Wendy Lovelace;
MDI and Summer Foundation
Box 3.48
Better quality of life Anonymous Submission 90458024;
Anonymous Submission 722067220;
PDCN member and fulltime wheelchair
user in Physical Disability Council of NSW
Response (p.5);
Anonymous Submission 894045598;
Wendy Lovelace
Box 3.27
Source: CIE based on public submissions.
Home modifications and proposed accessible features
Some submissions noted that the proposed changes to the NCC do not reflect the
LHDG, and that some home modifications are not substitutable for accessible features.
This implies that the estimate for some components of the size of the problem, especially
the safety impacts, carer costs and home modification costs based on the difference
before and after home modifications, may be overstated.

www.TheCIE.com.au
Proposal to include minimum accessibility standards for housing in the National Construction Code 49
For example, in estimating the reduced care cost in the Consultation RIS, CIE used
evidence from a study by Carnemolla and Bridge (2019) on home modifications.61
Among 134 bathroom modifications, the proposed accessible features in the NCC may
be equivalent to only 55 major bathroom modifications. In other words, the
modifications in the study go further than the proposed changes, and thus for the impact
on care needs in the study to be used, they should be adjusted down to accurately reflect
the impact of proposed changes to the NCC.
This adjustment requires careful mapping of proposed accessible features to targeted
beneficiaries. chapter seven provides detailed discussion on proposed accessible features
and beneficiaries.
Temporary injuries
Several stakeholders suggested that the analysis in the Consultation RIS had not taken
into account the potential benefits of accessible housing to people with temporary
injuries.
Much of the analysis in the Consultation RIS is based on the ABS Survey of Disabilities,
Ageing and Carers (SDAC). For the purposes of SDAC, disability is defined as any
limitation, restriction or impairment which restricts everyday activity and has lasted, or is
likely to last, for at least six months.62 As such, the analysis based on SDAC data:
■ captures temporary disabilities that last (or are likely to last) for more than 6 months.
■ does not capture temporary disabilities that last (or are likely to last) for less than
6 months.
As not all of the analysis is based on SDAC data, the current methodology captures some
benefits for people with a temporary disability. In particular, the estimates of additional
time spent in hospital (longer stays in hospital) should capture the impacts on those with
disability that last for less than 6 months.
Furthermore, not all of the categories that make up the size of the problem are relevant
for people with disability that last for less than 6 months. For example, it is less likely that
people would move house or make a major home modification for a temporary disability.
Therefore, the major benefit for people with short-term injuries appears to be more
independence and convenience (or less inconvenience) as a result of accessible housing,
which could be measured by the reduction in care needs.
61 Carnemolla, P. and C. Bridge 2019, “Housing Design and Community Care: How Home
Modifications Reduce Care Needs of Older People and People with Disability”, International
Journal of Environmental Research and Public Health, 16(11), p.7-8
62 ABS website,
https://www.abs.gov.au/AUSSTATS/[email protected]/Latestproducts/4430.0Main%20Features52018?open
document&tabname=Summary&prodno=4430.0&issue=2018&num=&view=, accessed 7 September
2020
www.TheCIE.com.au
50 Proposal to include minimum accessibility standards for housing in the National Construction Code
Australian Institute of Health Welfare (AIHW) provides data on hospitalised injuries by
age groups, injury types, body region injured and causes.63
The number of hospitalised temporary injuries that could benefit from accessible housing
was estimated from the AIHW data for fracture, dislocation and soft-tissue injury in the
lower body, adjusted by the age group and for those already included in the current
estimates in the Consultation RIS (that is people with mobility disability and older
people).
For non-hospitalised temporary injuries, some proportion of emergency department
attendances and non-hospital treatments to hospital admissions from the SDAC was
applied to the estimated temporary hospitalised injuries to refine the estimates.
It takes around 6 to 8 weeks for a minor fracture to heal. For serious ones, such as a tibia-
fibula fracture, it takes about 3 to 6 months.64 Workers compensation statistics in
Australia suggest that workers are off-work for 8 weeks on average in the case of
fractures.65 For dislocation, the recovery is normally quicker. For example, it takes about
6 weeks to heal from a dislocated kneecap.66
For non-hospitalised temporary injuries, the length of required assistance would be much
shorter.
With the information mentioned above, the average length of assistance required for
temporary injuries was estimated.
This average length represents a fraction of the care needs, and thus a fraction of the
benefit from improved accessibility for people with long term needs. Moreover, people
with temporary injuries are likely to receive informal care rather than formal care. In
addition, they face inconvenience to visit others living in inaccessible housing.
An indication of the potential benefits of accessible housing to people with temporary
injuries was estimated by applying this fraction to the annual cost of additional informal
care and costs associated with inability to visit others for people with long term needs,
and multiplying by the number of people with temporary injuries who are likely to
benefit from accessible housing.
63 AIHW 2019, Trends in hospitalised injury, Australia, 2007-08 to 2016-17, Injury Research and
Statistics Series Number 124, https://www.aihw.gov.au/getmedia/6cef34e2-2422-4f11-a9f3-
06e336edac3f/aihw-injcat-204.pdf.aspx?inline=true
64 NHS 2020, Broken leg, https://www.nhs.uk/conditions/broken-
leg/#:~:text=It%20takes%20around%206%20to,weight%20on%20the%20leg%20again
65 Safe Work Australia 2020, Australian Workers Compensation Statistics 2017-18, 10 January 2020,
https://www.safeworkaustralia.gov.au/doc/australian-workers-compensation-statistics-2017-18, Table
37, p.48
66 NHS 2020, Dislocated kneecap, https://www.nhs.uk/conditions/dislocated-
kneecap/#:~:text=A%20dislocated%20kneecap%20is%20a,the%20front%20of%20the%20knee

www.TheCIE.com.au
Proposal to include minimum accessibility standards for housing in the National Construction Code 51
Families with young dependants
Several submissions suggest that the benefits to young families with children should be
included in the analysis. Some types of benefits are:
■ Young families seek accessibility so ageing grandparents (and their peers) can
participate in the lives of their children and contribute in supporting their family; and
■ Accessible housing may help the movement of prams.
The first type of benefit is included in the benefit associated with visitability (the ability
for a person with mobility needs to visit others) which is discussed separately in this
chapter in the social isolation sub-section.
For the second type of benefit, the most relevant accessible feature is level step free
access. As a pram is smaller and lighter than a wheelchair, the inaccessible entrance issue
could be solved by installing temporary ramps in most if not all cases. In fact, the
inconvenience of unlevel access is so small that not many families actually need to install
a ramp.
An indicative upper bound estimate of benefit of accessible housing to families with
young dependants was made by assuming a certain proportion of families purchasing a
ramp to overcome the inconvenience of unlevel access (for more details, see sub-section
‘Families with young dependants’ in chapter three on page 112).
Anxiety and mental health impacts
Housing accessibility or inaccessibility has significant impact on self-reported mental
health and wellbeing. For example, the MDI survey found that 60 per cent of people with
both low and high support needs living in accessible housing reported improved self-
reported mental health and wellbeing, thanks to the accessibility of their home. In
contrast, 71.7 per cent of people with high support needs, and 50.0 per cent of people
with low support needs, living in inaccessible housing reported worsened mental health
and wellbeing.
Mental health forms a component of the quality of life impacts. Using the information
from the MDI survey and other sources, CIE estimated the difference for people living in
inaccessible and accessible housing as a measurement of the mental health and stress
problem caused by inaccessibility.
The ABS National Survey of Mental Health and Wellbeing (Cate.No.4326.0) and
National Health Survey (Cate.No. 4364.0.55.001) provide data on the number of people
suffering from mental health issues, and the AIHW estimates that spending on mental
health-related services in Australia from all sources (government and non-government)
was around $9.9 billion, or $400 per person, in 2017-18.67
However, the actual costs related to mental health issues are much higher than the
amount spent by government and non-government sources in 2017-18. For example:
67 AIHW 2020, Expenditure on mental health-related services, https://www.aihw.gov.au/reports/mental-
health-services/mental-health-services-in-australia/report-contents/expenditure-on-mental-health-related-
services?request=smoothstate

www.TheCIE.com.au
52 Proposal to include minimum accessibility standards for housing in the National Construction Code
■ A report commissioned by the Royal Australian and New Zealand College of
Psychiatrists (RANZCP) and the Australian Health Policy Collaboration estimated in
2014 that the cost of severe mental illness in Australia was $56.7 billion per year,
including the direct economic costs of severe mental illness arising from the use of
health and other services, as well as indirect costs due to lost productivity because
people are unable to work.68
■ In December 2016, the National Mental Health Commission stated that the cost of
mental ill-health in Australia each year was around $4,000 per person, or $60 billion
in total.69
The 2018 KPMG and Mental Health Australia report, Investing to Save, estimated that,
mental ill-health in the workplace costs an average of $3,200 per employee with
mental illness, and up to $5,600 for employees with severe mental illness. Overall, it
was estimated that the cost of workplace mental ill-health in Australia was $12.8
billion in 2015–16.70
The above mentioned incidence of mental health impacts due to inaccessible housing
from the MDI survey results and the cost estimates for mental ill-health were used to
estimate the indicative mental health impact costs. For more details see section ‘Mental
health impacts’ in appendix I, page 342.
Social isolation
Several submissions suggest measuring the benefit of reduced social isolation in addition
to measuring the benefit of reduced loneliness.
There is a subtle distinction between social isolation, which is where an individual has
minimal contact with others, and loneliness, which is a subjective state of negative
feelings about having a lower level of social contact than desired, according to AIHW.71
The method used to estimate loneliness in the Consultation RIS is sufficient for a
measure of social isolation, especially because the estimates include both impacts on
individuals with mobility disability receiving visits from others and paying visits to
others.
That said, a further refinement can improve the estimates of realised benefits of reduced
social isolation/loneliness.
68 Victoria Institute of Strategic Economic Studies 2016, The economic cost of serious mental illness
and comorbidities in Australia and New Zealand, report prepared for the Royal Australian & New
Zealand College of Psychiatrists and the Australian Health Policy Collaboration,
https://www.ranzcp.org/files/resources/reports/ranzcp-serious-mental-illness.aspx
69 The National Mental Health Commission 2016, Economics of Mental Health in Australia, 08
December 2016, https://www.mentalhealthcommission.gov.au/news/2016/december/economics-of-
mental-health-in-australia
70 KPMG and Mental Health Australia 2018, Investing to Save: The economic benefits for Australia of
investment in mental health reform, 1 May 2018, https://mhaustralia.org/publication/investing-save-
kpmg-and-mental-health-australia-report-may-2018
71 Australian Institute for Health and Welfare, https://www.aihw.gov.au/reports/australias-
welfare/social-isolation-and-loneliness

www.TheCIE.com.au
Proposal to include minimum accessibility standards for housing in the National Construction Code 53
In the Consultation RIS, the realised benefit of reduced social isolation/loneliness is
grouped with other avoided costs and subject to the ‘allocation’ of new accessible
housing to people with accessible needs. This part of the benefits should not be subject to
the allocation of new accessible housing only to people with accessibility needs because it
would be applicable for all new accessible houses.
In this RIS, social isolation has been included as a part of the quality of life discussion
(see sub-section ‘Quality of life impacts’ in chapter three on page 88). In addition, the
cost associated with a lack of visitability (unable to visit family or friends living in
inaccessible housing) of people with mobility disability and older Australians were
updated (sub-section ‘Inability to visit family and friends in inaccessible housing’ in
chapter three on page 101).
The realised benefits from people with mobility disability and older people being able to
visit others is separately attributed to all new housing (not subject to allocation) in the
CBA.
Quality of life
A number of submissions suggest that the benefit of improved quality of life due to
accessible housing should be considered.
There is very limited data to support an accurate estimate of this type of benefit. The only
data located by CIE is the paper by Carnemolla and Bridge (2016) on the impact of home
modification on Assessment of Quality of Life (AQoL).72 The study found that home
modifications to improve accessibility increase the AQoL utility score by 0.12 (from 0.3
before modification to 0.42 after modification). The AQoL utility score consists of four
dimensions/components – independent living, relationships, mental health and senses.
As a part of the qualitative analysis, WTP survey results were used to estimate the
indicative size of quality of life impact, noting that there may exist double counting with
other quantified problems and/or other qualitative issues. For more details, see sub-
section ‘Quality of life impacts’ in chapter three on page 101 and appendix I.
Informal care cost
The Consultation RIS used the minimum wage rate in Australia of $19.49 per hour to
measure the cost of additional informal care due to inaccessibility. It was suggested in
some submissions that a higher rate should be used, for example, the formal care unit
cost of $65 per hour.
A recent report by Deloitte Access Economics on the value of informal care in Australia
found that the average hourly cost of employing a formal carer to replace an informal
72 Carnemolla, P. and C. Bridge 2016, “Accessible Housing and Health-Related Quality of Life:
Measurements of Wellbeing Outcomes Following Home Modifications”, International Journal
of Architectural Research 10(2), p.38-51

www.TheCIE.com.au
54 Proposal to include minimum accessibility standards for housing in the National Construction Code
carer, with all relevant loadings, was $36.12 in 2020.73 Hourly rate including overheads
in May 2019 was $33.12.74 The report does not provide an estimate of the proportion of
overheads in the hourly rate. As overheads are costs related to running a business they
should not be included in the informal care cost which is voluntarily provided.
A better measurement for the unit cost of informal care is the average hourly pay for aged
care workers because it is the compensation paid for providing similar care services. ly
rate is $22.85 in Sydney.75
Based on the above discussion, the RIS incorporates a unit cost for informal care above
the minimum wage rate to reflect the average hourly pay for aged care workers (see sub-
section ‘The cost of additional assistance’ in chapter three on page 84 and appendix C).
Person-based versus family-based approach
Several submissions suggest it would be more appropriate to base the analysis in the RIS
on the impacts on households rather than on the impacts on the person with a mobility
related disability.
There are several reasons why the analysis focuses mostly on people with disability,
rather than households.
■ To a significant extent, the analysis relies on detailed cross-tabulations of data from
the ABS SDAC using TableBuilder. There is some SDAC data available at both the
person and household level. However, the data is much more detailed at the person
level. Much of the detailed cross-tabulations to identify those affected by a lack of
accessible housing is not possible at the household level.
■ For many of the categories that make up the problem that the regulatory proposal is
seeking to address, the personal level statistics are a more relevant indicator. For
example, it is the person with the disability who:
– is at risk of falls
– may have longer stays in hospital
– may be prematurely admitted to residential aged care
– is unable to visit family/friends, etc.
It is acknowledged that other members of the household may also be affected by a lack of
accessible housing in various ways. The analysis in the Consultation RIS took into
account the broader impacts on family and friends in the following ways:
■ A lack of accessible housing may affect other members of the household through
additional caring responsibilities. The analysis has already sought to measure the
opportunity cost of the additional time spent caring for the household member with a
73 Deloitte Access Economics and Cares Australia 2020, The value of informal care in 2020, May
2020, p.iii
74 ibid, Table 2.3, p.18
75 Payscale 2020, Average Aged Care Worker Hourly Pay in Sydney, New South Wales,
https://www.payscale.com/research/AU/Job=Aged_Care_Worker/Hourly_Rate/999a3db7/Sydney

www.TheCIE.com.au
Proposal to include minimum accessibility standards for housing in the National Construction Code 55
disability (i.e. informal care), as well as care provided by friends/family living outside
the household.
■ The WTP approach was based on the household’s willingness to pay for accessible
housing, which would incorporate the preferences of other members of the household.
The proposed approach below will accommodate household’s WTP in the problem
reduction approach.
■ The analysis has also sought to measure the broader impacts on the community (i.e.
the community’s preference for people with disability to live in housing that meets
their needs). These impacts to some extent take into account the preferences of family
and friends of people with disability with disability.
It is possible that the current methodology does not capture some impacts on other
members of the household, such as stress (and possibly travel time to visit) associated
with:
■ a family member spending longer than necessary in hospital;
■ a family member prematurely entering into aged care; and
■ providing care.
Health economics studies relating to the burden of disease generally do not take into
account impacts on people beyond the individual directly affected. Impacts on the
individual’s family and friends are generally considered to be reflected in the estimated
WTP to avoid disease. The WTP results used for estimating the indicative size of quality
of life impacts were household based (see sub-section ‘The willingness to pay approach’
in chapter three on page 91 and appendix I). In this sense, the current approach is
consistent with a family-based approach.
Estimation of the impacts of existing policies
Several stakeholders noted that the Consultation RIS did not attempt to estimate the
impacts of existing policies aimed at ensuring that older Australians and people with
disability have access to housing that meets their needs.
This issue has direct relevance to the RIS, and the impacts of existing policies have been
implicitly included in the status quo. Separately estimating the impacts of these policies
would be significant and is beyond the scope of the RIS.
The estimates in the Consultation RIS are mostly based on recent survey evidence of the
outcomes delivered under current policy settings (i.e. the ABS 2018 Survey of
Disabilities, Ageing and Carers). This survey evidence implicitly includes the impact of
existing policies, to the extent that these policies contribute to the outcomes delivered.
That said, to the extent that policies are changing and these changes will have a material
impact on the baseline, it is unlikely that this has been fully taken into account.
■ In particular, some aspects of the NDIS are still in the ‘ramp up’ phase and could be
expected to deliver improved outcomes for eligible participants in the period ahead
(diminishing both costs and benefits). But some aspects of the further evolution of the
program are currently unknown, making it difficult to take them into account in the
RIS.

www.TheCIE.com.au
56 Proposal to include minimum accessibility standards for housing in the National Construction Code
■ There may also be policy changes arising from the Royal Commissions. However, as
these are currently unknown, it is not possible to take them into account in this
current analysis.
In response to stakeholder feedback, the baseline assumptions in the RIS have been
reviewed to ensure that estimates are based on actual outcomes under current policy
settings.
Employment and productivity impacts
In the Consultation RIS, CIE concluded that there was insufficient evidence of the
impacts that accessible housing has employment and productivity outcomes.
The submission from the MDI and the Summer Foundation provided evidence from a
survey of 1 187 people with disability and older people and in-depth interviews with 45
respondents on the mechanisms through which inaccessible housing reduces productivity
and work opportunities as follows:
■ Limitations or enablers to allow work or study from home influenced both
employment opportunities and work productivity.
■ Difficulties finding accessible homes close to employment opportunities.
■ Fatigue from living in inaccessible homes and the additional time and energy spent on
self-care and home care activities reduces productivity, motivation, self-confidence
and the capacity to work, study or volunteer.
■ Inaccessible housing increases reliance on paid/unpaid support with personal and
domestic activities, limiting ability to take on employment.
This work adds to the evidence base on the impact of accessible housing on employment
opportunities and productivity and its application in the development of this RIS is
outlined in box 2.1 (page 33).
However, there is a concern around the representativeness of the sample. The survey was
circulated via email through disability services and advocacy networks. Although this
approach is effective in identifying the target audience, it could also potentially skew the
sample towards those who have experienced the biggest issues (self-selection bias).
CIE has investigated the extent to which the outcomes reported in the sample can be
cross-checked/stratified against data from SDAC to produce an indicative quantitative
estimate and included it in the qualitative analysis in this RIS (see sub-section
‘Employment and productivity impacts’ in chapter three on page 115 and appendix J).

www.TheCIE.com.au
Proposal to include minimum accessibility standards for housing in the National Construction Code 57
3 Statement of the problem
Summary
A key element of a RIS is understanding the nature and size of the problem (or issue) that
government intervention would address through a regulatory proposal.
■ Based on 2018 ABS data, there are around 3 million Australians with a mobility
limitation and/or a self-care limitation due to disability, which includes people with
the greatest need for help or who are unable to do an activity; people who sometimes
need help and/or have difficulty; people who need no help but have difficulty, and
people who need no help and have no difficulty but use aids or have limitations.76
■ It is estimated that this will increase to around 5.75 million people over the next 40
years, due to population growth and the effects of an ageing population.
Finding suitable accommodation is important to all Australians and is a prerequisite for a
happy, stable and dignified life.77 The right to accommodation and social participation is
recognised in international treaties. Under the status quo without intervention it will
continue to be contended that international treaty obligations are not being met. There is
evidence that people with disability and older Australians have trouble finding housing
that meets their needs. Housing that is inaccessible for people with mobility limitation
can impose various costs on those people, their families, those with temporary injuries,
those with young children, carers and the community more broadly. These costs include
the following.
■ Where people with mobility limitation remain living in housing that does not meet
their needs, the costs include:
– safety related costs where people may be at higher risk of falls
– costs associated with additional care needs
– reduced ‘quality of life’
■ Other costs could include those associated with:
– unnecessarily expensive home modifications to make the dwelling more accessible
– longer stays in hospital and transition care, where discharge is delayed due to their
home lacking accessibility features
– avoidable moves to more suitable accommodation
– people with limited mobility being unable to visit friends and relatives (people
without accessibility needs may also be impacted if family and friends with
accessibility needs are unable to visit them)
76 https://www.aihw.gov.au/reports-data/health-conditions-disability-deaths/disability/glossary
77 Commonwealth of Australia 2011, National Disability Strategy 2010-2020: An initiative of the
Council of Australian Governments, p. 32.

www.TheCIE.com.au
58 Proposal to include minimum accessibility standards for housing in the National Construction Code
– inappropriate or premature entry into residential aged care (or other institutional
care) due to dwellings lacking accessibility features
– inconvenience for families with young children (who may use a pram)
– inconvenience for people with short-term injuries.
There are a significant number of government policies in place to either subsidise,
directly provide or encourage private provision of housing that meets the needs of people
with disability and older people. Key policies to ensure that people with disability and
older people have access to housing that meets their needs include:
■ funding home modifications and other support services (through the NDIS and
various aged care policies) to support people with mobility limitations to stay in their
own home
■ funding for residential aged care places
■ state and local government planning policies that encourage private provision of
accessible housing, and
■ provision of accessible social and community housing.
Despite these policies and other services available, there are limitations and a range of costs
that could potentially be avoided through increased provision of accessible housing. These
are complex matters and the indicators used to identify the number of people affected and
other information relied onto to quantify the benefits are imperfect. As such there is
significant uncertainty around the number of people affected by each of the problems outline
above.
Based on the evidence available, the number of people per year that could be affected by a
lack of accessible housing is summarised in table 3.1. Note that these estimates are not
additive across each of the problems as many people may be affected by multiple problems.
3.1 Number of people affected by a lack of accessible housing per year
Assessed problem Estimated number of people affected per year
Safety-risks 325 100
Additional care needs 453 400
Quality of life 554 400
Additional time in hospital/transition care 159 900
Home modifications per annum a 21 790
Additional home moves Range of 6 400 – 17 300
Premature/inappropriate entry into residential aged care Range of 2 767 – 6 199
Inability to visit family and friends (visitability) 85 800
Families with young dependants Up to 16 000
Short-term injuries 17 551
a Assumes 1 person per relevant modification per year
Note: the number of people affected is not additive across each type of problem.
Source: CIE (details are provided in chapter three and appendices B - I).

www.TheCIE.com.au
Proposal to include minimum accessibility standards for housing in the National Construction Code 59
While the number of people affected by inaccessible housing appears to be a small
proportion of the total population, the costs to the community for those whose needs are
not met (or have incurred significant cost in having their needs met) are estimated to be
significant. The costs to the community are assessed and estimated around each type of
problem.
The size of the problem has also been estimated in dollar terms. As there is significant
uncertainty around some costs, a range has been estimated in some cases.
■ Based on the information available it is estimated that the costs associated with a lack
of accessible housing could be in a range between around $3.0 billion and $6.7 billion
per year, with a central case estimate of around $4.2 billion (based on 2018 SDAC
data) (table 3.2). In response to public submissions to the Consultation RIS, the
following updates/adjustment have been made:
– morbidity costs associated with falls have been included in the estimate
– reduced ‘quality of life’ due to inaccessible housing has been estimated (albeit
based on limited evidence)
– informal care costs are updated to reflect the replacement cost of providing similar
care
– the estimated cost of additional moves due to inaccessible housing has been
updated to reflect a broader range of costs, and
– impacts on short-term mobility injuries and on families with young dependants
have been added.
■ If these costs increase in proportion to the number of people with accessibility needs,
it is estimated that these costs could increase to between around $4.6 billion and
$10.2 billion per annum by 2040, with a central case estimate of $6.4 billion.
■ In addition, CIE has tried to provide some indicative estimates or an order of
magnitude for the unquantifiable costs of the problem in appendices J and K,
including:
– employment and productivity impacts more on people with disability and older
Australians of inaccessible housing, which could be in the order of several hundred
million dollars per year, although CIE is unable to estimate it with any certainty;
and
– social justice and equity (that is cost to the broader community) could be around
$390 million dollars per year.
3.2 Estimated size of the problem — quantifiable costs
Assessed problem Low estimate
($ million)
Central case
($ million)
High estimate
($ million)
Safety-risks 0.00 154.14 570.30
Additional care needs 938.52 938.52 938.52
Quality of life 1 063.89 1 913.23 3 770.10
Additional time in hospital/transition care 234.59 234.59 234.59
Home modifications per annum 498.86 498.86 498.86
Additional home moves 81.51 161.91 242.31

www.TheCIE.com.au
60 Proposal to include minimum accessibility standards for housing in the National Construction Code
Assessed problem Low estimate
($ million)
Central case
($ million)
High estimate
($ million)
Premature/inappropriate entry into residential aged
care 119.56 184.81 267.86
Inability to visit family and friends (visitability) 35.73 80.93 126.12
Families with young dependants 0 0.62 1.23
Short-term injuries 26.25 28.09 29.92
Total 2 998.92 4 195.69 6 679.81
Note: Based on 2018 SDAC data and RIS appendices B-J.
Source: CIE estimates.
By definition, unquantifiable costs are difficult to estimate. The figures provided above
are highly uncertain and may exist with other areas of unquantifiable costs or may result
in double counting with quantifiable costs. For these reasons, these estimates are not
directly additive to each other or to the quantifiable costs. Nevertheless, the indicative
estimates suggest these costs could be significant.
Underlying causes of these issues include the following.
■ There appear to be a range of market imperfections, including:
– some homebuyers (particularly younger homebuyers) are failing to foresee future
accessibility needs when they make design choices
– the characteristics of the housing delivery chain, which can make it difficult for
some homebuyers to deviate from standard designs to incorporate accessibility
features
– as many apartments are built to be purchased off the plan, they are designed to
appeal to the buyers’ current average demand, rather than the specific needs of an
individual buyer.
■ Landlords are reluctant to allow modifications for private renters, which means that
home modifications are often not an option for renters with accessibility needs.
■ Many households containing people with disability have low incomes.
The need for accessible housing
The ABCB define ‘accessible housing’ as ‘any housing that includes features that enable
use by people either with a disability or transitioning through life stages’.78 Based on
findings from the literature on accessible housing and consultation with stakeholders,
accessible housing can potentially:
■ reduce the incidence of falls for people with mobility limitations
■ reduce care needs
■ improve the quality of life of people with limited mobility
■ reduce costs associated with home modifications
■ avoid the need for people who acquire a mobility-related disability to move to more
suitable accommodation
78 ABCB 2018, Accessible Housing: Options Paper, September 2018, p.4

www.TheCIE.com.au
Proposal to include minimum accessibility standards for housing in the National Construction Code 61
■ reduce the length of hospital stays
■ increase the ability of people with disability and the elderly to participate in and be
included in society
■ reduce the inappropriate or premature entry into aged care or other institutional care.
Despite these benefits, many new dwellings are not built to meet the current and future
accessibility needs of all members of the community, including people with mobility
limitation, such as older people and people with disability, as well as those with
temporary mobility limitation.
Submissions provided qualitative evidence of a lack of accessible housing (box 3.3)
outlines some lived experiences finding accessible housing provided in submissions).
3.3 Lived experience – lack of supply of accessible housing
Lack of supply and ageing in place (MND sufferer and ageing parents)
I became interested in accessible housing three years ago, after my 38 year old
husband was diagnosed with Motor Neurone Disease.
As it happens, our family home is single storey, with a level entry. We were already
planning a minor renovation so we altered the plans to include a wheelchair accessible
bathroom. At the time, we measured the main corridor and the doorways to ensure
that they were wide enough for a wheelchair. Luckily they are - just!
So we have been able to remain in our beloved home, and my husband has been able
to remain with us despite his deteriorating condition.
However, we live in regional Victoria and our families live in Melbourne. We used to
visit them regularly, and stay overnight. It quickly became apparent that this would
no longer be feasible as my husband's mobility deteriorated, because of the poor
accessibility of their homes. My parents were planning to buy an investment property
so they suggested that they would look for an accessible property, which would
provide us with a base to stay overnight when we came to visit. We looked for over 12
months.
There was… NOTHING.
It brought home to us how fortunate we are to be in our current home, and how dire
the housing market is for those with “special needs”.
It also brought home how difficult remaining at home will be for my parents as they
age and we are actively discussing whether they will modify their house in order to
'future proof' it, or whether they will move out now into some other home.
But perhaps what was most dispiriting was that of the many, many new buildings that
we looked at, none of them were suitable. There was clearly no regulation that
imposed an accessible or universal design on these new developments. In particular,
although some townhouses had been built with internal lifts, the placement of the lifts
- and the general design of the home around them - had clearly not been properly
considered, for example the lift that opened out onto the top of a flight of stairs!

www.TheCIE.com.au
62 Proposal to include minimum accessibility standards for housing in the National Construction Code
3.3 Lived experience – lack of supply of accessible housing
I had never heard of accessible design until my husband's diagnosis sent us into a
tailspin. But we are not the only family to whom something unexpected will happen.
And everyone faces the prospect of aging and the associated deterioration in physical
mobility. It makes sense to ensure that housing stock is created to cater for all needs
and abilities; that all new homes are built with accessibility as a baseline
consideration. No-one should have to move out of their home because they can no
longer safely move around in it.
Source: Anonymous response 57090500379
Lack of accessible rental property
After a number of years I moved into private rental – it was very difficult to find a unit
with accessibility in the private rental market, and it was only a fluke that an old
residential aged care facility had sold off its accommodation units and these were in
the private rental market that there was a unit available that had level entry an
accessible bathroom and that it was available at an affordable price and was close to
public transport.
Source: Raelene West Response80
In several weeks of searching [for a rental property] …. not one of the properties we
saw was suitable for someone with a power chair and no walking ability at all, in that
we didn't see any [properties] that were ground floor with flat access. In the price
range we looked at, first floor with a lift and good stairs was the best we found. Only
one listing mentioned disability access - to say there was none.
Source: Physical Disability Council of NSW 81
As each individual with a disability (including ageing members of the community) will
have specific accessibility needs, it is not possible to design houses that will meet the
needs (including accessibility needs) of all members of the community. However, under
universal design principles houses are designed for the greatest number of people.82
79 Anonymous Submission 570905003, accessed 13 November 2020,
https://consultation.abcb.gov.au/engagement/consult-ris-accessible-
housing/consultation/published_select_respondent
80 Submission by Raelene West, accessed 13 November 2020,
https://consultation.abcb.gov.au/engagement/consult-ris-accessible-
housing/consultation/published_select_respondent
81 Submission by Hayley Stone for Physical Disability Council of NSW, p. 6, accessed 13
November 2020, https://consultation.abcb.gov.au/engagement/consult-ris-accessible-
housing/consultation/published_select_respondent
82 Bringolf, J. 2011, Barriers to Universal Design in Housing, A thesis submitted for the degree of
Doctor of Philosophy, Urban Research Centre, College of Health and Science, University of
Western Sydney, September 2011, p.54

www.TheCIE.com.au
Proposal to include minimum accessibility standards for housing in the National Construction Code 63
To meet the needs of members of the community with mobility limitation, housing
should be:83
■ easy to enter (and leave)
■ easy to navigate in and around
■ be capable of easy and cost-effective adaptation
■ be responsive to the changing needs of home occupants.
In addition to accessibility needs, people with mobility limitation also have needs and
preferences beyond accessibility, including preferences relating to the type of housing
they live in, location and other factors.
According to the NDS, finding suitable accommodation is important to all Australians
and is a prerequisite for a happy and stable life. However, there is evidence that many
people with accessibility needs are not able to secure suitable housing.
■ The current NDS notes there is evidence that people with disability experience
substantial barriers in finding a place to live, especially in the private market. Housing
designs that do not allow the building structure of the home to change to meet the
needs of a person who is ageing or with disability without significant expense is
identified as a key barrier.84
■ A survey conducted by the ANUHD, found that 68 per cent of respondents had
experienced difficulty in finding accessible housing.
■ During CIE’s targeted consultation for the preparation of the Consultation RIS,
multiple stakeholders provided qualitative evidence of people with disability
experiencing difficulties in finding suitable accommodation.
Number of people that potentially have accessibility needs
The Consultation RIS reported that based on the ABS’s 2018 Survey of Disabilities,
Ageing and Carers (SDAC), there were around 2.98 million people who could potentially
benefit from more accessible housing. This estimate was based on the number of people
with mobility limitations due to disability. Some stakeholders were concerned that the
Consultation RIS may have under-estimated the number of members of the community
that could benefit from more accessible housing for the following reasons:
■ The SDAC survey does not capture people with temporary accessibility needs, such as
those with temporary injuries.
■ Some stakeholders argued that people with long-term health conditions with
accessibility needs may have been excluded from the estimates because many do not
identify as having a disability.
■ Some stakeholders argued that the Consultation RIS focused only on people with
mobility limitations and therefore did not capture those with a range of other
83 These features are consistent with the Livable Housing Design Guidelines definition of ‘livable’
housing.
84 Commonwealth of Australia 2011, National Disability Strategy 2010-2020: An initiative of the
Council of Australian Governments, p.32

www.TheCIE.com.au
64 Proposal to include minimum accessibility standards for housing in the National Construction Code
disabilities, including those with low vision and those that may require assistance with
daily living tasks (e.g. cognitive or intellectual disability or a person with no arm or
hand function) that could also benefit from some accessible design features.85
In relation to the first point, the SDAC survey includes people with health conditions that
have lasted, or are likely to last, for 6 months or more. As such, it would include people
with temporary disabilities that last for 6 months or more, but would exclude people with
shorter term conditions. That said, where the ‘size of the problem’ has been quantified
(see below), CIE has not relied on SDAC to estimate all aspects of the problem. As such,
some costs associated with temporary injuries would be included in the estimates; for
example, the costs associated with delayed discharge from hospital does not rely on
SDAC data and would therefore include people with shorter-term functional limitations,
where relevant.
In relation to the other points relating to whether the measure used in the SDAC captures
all relevant people that would potentially benefit from accessible housing, it is important
to be clear about what the SDAC is measuring. In the SDAC survey, people are
categorised as having core limitations due to disability (mobility, self-care or
communication) based on questions about their functional abilities.
■ The estimate from SDAC does not rely on people self-identifying as having a
disability and does not distinguish between disability and long-term health conditions,
unlike some other surveys, such as the Census. This measure should therefore capture
those with ‘long-term health conditions’ that affect their mobility. SDAC generally
produces lower estimates of the prevalence of disability and long-term health
conditions than some other surveys because it excludes those with conditions that do
not restrict everyday activities.86 The extent to which people are restricted in their
ability to do everyday activities is a more relevant indicator of their accessibility needs
in relation to housing.
■ The number of people with a core mobility limitation will include many people with
the types of disabilities mentioned in submissions if their disability means they have a
mobility limitation. Table 3.4 shows the number of people with mobility limitation
(i.e. that would be included in the estimate reported in the Consultation RIS). As
above, functional limitations are the most relevant indicator of their accessibility
needs in relation to housing.
3.4 Mobility limitation by disability type
Disability type Mobility limitation
(‘000)
No mobility
limitation (‘000)
Total (‘000)
Loss of sight 205.7 47.5 253.8
Loss of hearing 558.0 513.8 1 072.4
85 See for example, anonymous submission 284174932.
86 ABS website,
https://www.abs.gov.au/ausstats/[email protected]/Latestproducts/4431.0.55.002Main%20Features72012%20
-%202016?opendocument&tabname=Summary&prodno=4431.0.55.002&issue=2012%20-
%202016&num=&view=, accessed 28 October 2020.
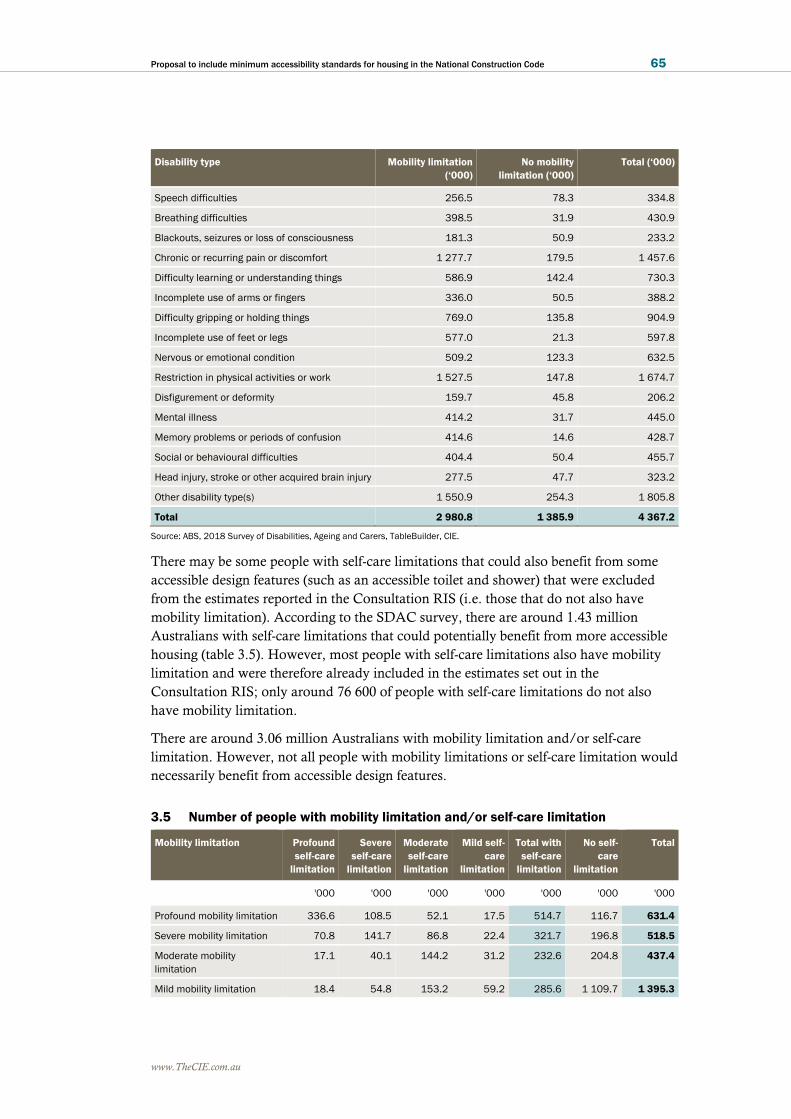
www.TheCIE.com.au
Proposal to include minimum accessibility standards for housing in the National Construction Code 65
Disability type Mobility limitation
(‘000)
No mobility
limitation (‘000)
Total (‘000)
Speech difficulties 256.5 78.3 334.8
Breathing difficulties 398.5 31.9 430.9
Blackouts, seizures or loss of consciousness 181.3 50.9 233.2
Chronic or recurring pain or discomfort 1 277.7 179.5 1 457.6
Difficulty learning or understanding things 586.9 142.4 730.3
Incomplete use of arms or fingers 336.0 50.5 388.2
Difficulty gripping or holding things 769.0 135.8 904.9
Incomplete use of feet or legs 577.0 21.3 597.8
Nervous or emotional condition 509.2 123.3 632.5
Restriction in physical activities or work 1 527.5 147.8 1 674.7
Disfigurement or deformity 159.7 45.8 206.2
Mental illness 414.2 31.7 445.0
Memory problems or periods of confusion 414.6 14.6 428.7
Social or behavioural difficulties 404.4 50.4 455.7
Head injury, stroke or other acquired brain injury 277.5 47.7 323.2
Other disability type(s) 1 550.9 254.3 1 805.8
Total 2 980.8 1 385.9 4 367.2
Source: ABS, 2018 Survey of Disabilities, Ageing and Carers, TableBuilder, CIE.
There may be some people with self-care limitations that could also benefit from some
accessible design features (such as an accessible toilet and shower) that were excluded
from the estimates reported in the Consultation RIS (i.e. those that do not also have
mobility limitation). According to the SDAC survey, there are around 1.43 million
Australians with self-care limitations that could potentially benefit from more accessible
housing (table 3.5). However, most people with self-care limitations also have mobility
limitation and were therefore already included in the estimates set out in the
Consultation RIS; only around 76 600 of people with self-care limitations do not also
have mobility limitation.
There are around 3.06 million Australians with mobility limitation and/or self-care
limitation. However, not all people with mobility limitations or self-care limitation would
necessarily benefit from accessible design features.
3.5 Number of people with mobility limitation and/or self-care limitation
Mobility limitation Profound
self-care
limitation
Severe
self-care
limitation
Moderate
self-care
limitation
Mild self-
care
limitation
Total with
self-care
limitation
No self-
care
limitation
Total
'000 '000 '000 '000 '000 '000 '000
Profound mobility limitation 336.6 108.5 52.1 17.5 514.7 116.7 631.4
Severe mobility limitation 70.8 141.7 86.8 22.4 321.7 196.8 518.5
Moderate mobility
limitation
17.1 40.1 144.2 31.2 232.6 204.8 437.4
Mild mobility limitation 18.4 54.8 153.2 59.2 285.6 1 109.7 1 395.3

www.TheCIE.com.au
66 Proposal to include minimum accessibility standards for housing in the National Construction Code
Mobility limitation Profound
self-care
limitation
Severe
self-care
limitation
Moderate
self-care
limitation
Mild self-
care
limitation
Total with
self-care
limitation
No self-
care
limitation
Total
'000 '000 '000 '000 '000 '000 '000
Total with mobility
limitation
442.9 345.1 436.3 130.3 1 354.6 1 628.0 2 982.6
No mobility limitation 10.4 15.3 43.4 7.5 76.6 0.0 76.6
Total 453.3 360.4 479.7 137.8 1 431.2 1 628.0 3 059.2
Note: TableBuilder randomly adjusts cells to minimise the risk of identifying individuals in aggregate statistics. This means that table
totals do not always add exactly and the totals are not exactly consistent across tables.
Source: ABS. 2018 Survey of Disabilities, Ageing and Carers, TableBuilder.
Users of mobility aids
Although the needs of every individual will vary, the types of mobility aids used may be
an indicator of the need for specific accessibility features in the home. In particular,
wheelchair users (and to some extent users of other mobility aids with wheels, such as
scooters/gophers or walking frames) have specific accessibility requirements in relation
to:
■ level access
■ the need for bedroom and bathrooms on the ground floor
■ wider doorways and hallways, and
■ space requirements in bathrooms, bedrooms etc.
Dwellings that do not meet these accessibility requirements are unlikely to be suitable for
a wheelchair user (i.e. a wheelchair user could not practically live in a dwelling that does
not meet these requirements).
According to SDAC data there were around 185 300 wheelchair users in 2018 and
around 570 100 users of mobility aids with wheels including wheelchairs (table 3.6).
3.6 Types of mobility aids
Type of mobility aid 0 to 14 years 15 - 64 years 65+ years Total
'000 '000 '000 '000
Wheelchairs 4.20 50.40 130.70 185.30
Scooter/gopher 0.00 13.50 40.20 54.00
Walking frame 0.00 46.30 284.00 330.80
Total aids with wheels 4.20 110.20 454.90 570.10
Other aids 3.00 69.60 36.70 107.60
Do not use aids 222.20 1 162.30 919.50 2 304.60
Total 229.40 1 342.10 1 411.10 2 982.30
Note: TableBuilder randomly adjusts cells to minimise the risk of identifying individuals in aggregate statistics. This means that table
totals do not always add exactly and the totals are not exactly consistent across tables.
Source: ABS, Survey of Disabilities, Ageing and Carers, 2018, TableBuilder.

www.TheCIE.com.au
Proposal to include minimum accessibility standards for housing in the National Construction Code 67
Projections of future needs
The number of people with mobility limitation is expected to increase over time. This
will be driven by both population growth as well as an ageing population.
The old-age dependency ratio is one indicator of population ageing. The old-age
dependency ratio is currently increasing rapidly as the ‘baby boomer’ generation (those
who were born in the years following the end of World War II through to the early to
mid-1960s) reach retirement age. Based on ABS Projections (chart 3.7), the old-age
dependency ratio is expected to increase from the current level of around 24-25 per cent
to around 30 per cent over the next 15 years.
3.7 Population projections
Data source: ABS, Population Projections, Australia, 2017-2066, Catalogue No. 3222.0, Series B.
As the proportion of the population with accessibility needs tends to increase with age
(chart 3.8), the ageing population will mean that the proportion of people with
accessibility needs (including those with a mobility limitation and those using
wheelchairs) will increase at a rate that exceeds population growth.
0
5
10
15
20
25
30
35
40
45
2018 2023 2028 2033 2038 2043 2048 2053 2058 2063
Millio
n
0 to 14 years 15-64 years 65+ years

www.TheCIE.com.au
68 Proposal to include minimum accessibility standards for housing in the National Construction Code
3.8 Mobility limitations and wheelchair users by age — share of population
Data source: ABS, Survey of Disabilities, Ageing and Carers, 2018, TableBuilder; CIE.
It is projected that the number of people with mobility limitation will increase from
around 3 million to around 5.75 million over the next 40 years (chart 3.9). This
assumes that the proportion of the population with mobility limitations within each age
bracket remains constant over time. These proportions are then applied to the population
projections.
3.9 Number of people with mobility limitations — projection
Data source: ABS, Population Projections, Australia, 2017-2066, Catalogue No. 3222.0, Series B; ABS, Survey of Disabilities, Ageing
and Carers, 2018, TableBuilder, CIE.
Using the same approach, it is estimated that the number of wheelchair users will
increase from around 185 000 to around 370 000 by 2060 (chart 3.10).
0%
10%
20%
30%
40%
50%
60%
70%
80%
90%
100%
0 to 4 years 15 to 19
years
30 to 34
years
45 to 49
years
60 to 64
years
75 to 79
years
90 to 94
years
Per
cen
t
Mobility limitation
Wheelchair users
0.0
1.0
2.0
3.0
4.0
5.0
6.0
7.0
2018 2023 2028 2033 2038 2043 2048 2053 2058 2063
million
0-14 years
15-64 years
65+ years

www.TheCIE.com.au
Proposal to include minimum accessibility standards for housing in the National Construction Code 69
3.10 Number of wheelchair users — projections
Data source: ABS, Population Projections, Australia, 2017-2066, Catalogue No. 3222.0, Series B; ABS, Survey of Disabilities, Ageing
and Carers, 2018, TableBuilder, CIE.
Policy context
Under COAG Best Practice Regulation Guidelines, it is important to take account of
evidence of the impact of existing policies and services when considering the impacts of
including minimum accessible housing standards in the NCC.
There are a range of services (both government and non-government) aimed at meeting
the housing (and other) needs of those with disability and older people. Some
submissions argued that the Consultation RIS should have provided more analysis of the
impact of the various policies and services already available.
Providing a detailed analysis of the impacts of these policies is a complex exercise and
beyond the scope of the RIS. As estimates of the ‘size of the problem’ in the RIS are
based on data reflecting the outcomes for people with disability and older people with
existing policies and services in place, they implicitly take into account the impact of
existing policies and services. Where policies (for example, the NDIS) have not yet been
fully implemented, it is noted that these may become more effective over time.
A basic description of the policies already in place is provided below. Where relevant,
basic information on the number of recipients of various services is also provided.
Increasing the private supply of accessible housing
Various (mostly state) governments have policies in place to increase the supply of
private accessible dwellings, either through planning regulation or through state-based
variations to the NCC. Table 3.11 summarises existing state planning policies and
variations to the NCC that aim to increase the supply of accessible dwellings.
0
50
100
150
200
250
300
350
400
450
500
2018 2023 2028 2033 2038 2043 2048 2053 2058 2063
'00
0
0-14 years
15-64 years
65+ years

www.TheCIE.com.au
70 Proposal to include minimum accessibility standards for housing in the National Construction Code
3.11 Summary of state and territory government policies that aim to increase the
supply of accessible housing
State Planning policies aimed at increasing the supply of accessible housing
NSW In NSW, there are 2 State Environment Planning Policies (SEPPs) relevant to the supply of
accessible housing.
■ SEPP No. 65 — Design Quality of Residential Apartment Development has an objective (4Q-1)
that universal design features are included in apartment design to promote flexible housing
for all community members. The design guidance under this objective is that: developments
achieve a benchmark of 20% of the total apartments incorporating LHDG’s silver level
universal design features.
■ The Housing for Seniors or People with a Disability SEPP aims to increase the supply and
diversity of residences that meet the needs of seniors or people with a disability by relaxing
some local planning controls for developments that meet relevant design principles.
Victoria Planning Scheme Clause 58 (Better Apartment Design Standards) requires that 50 per cent of
apartments in a building of more than 5 storeys are designed and built with LHDG Platinum for
path of entry, LHDG gold for main bedroom entry and toilet, and LHGD silver for shower.
Queensland ■ Accessible housing requirements will apply in locations designated as Priority Development
Areas (PDAs) (but will vary across PDAs)
– It will be mandatory for 10 per cent of all multiple residential dwellings to be accessible
– In some PDAs 20 per cent of accessible dwellings should be provided.
■ Preference for accessible dwellings to be spread across different house types.
Western
Australia
■ Residential Design Codes for Apartments (under State Planning Policy 7.3) require that:
– 20 per cent of all dwellings across a range of dwelling sizes, meet Silver Level requirements
as defined in the LHDG; or
– 5 per cent of dwellings are designed to Platinum Level as defined in the LHDG.
■ Compliance with AS4299 is required for aged and dependent persons’ dwellings. The relevant
decision maker has discretion over where AS4299 applies for other types of housing. All single
houses, grouped dwellings and multiple dwellings in areas within activity centres must provide
wheelchair accessible connections between buildings and public footpaths and carparking
areas.
South Australia In developments consisting of 20 or more residential sole-occupancy units or dwellings, 5 per
cent of the total number of sole-occupancy units or dwellings must meet additional accessibility
requirements
ACT ■ Under the ACT Territory Plan:
– Multi-unit developments of 10 or more dwellings in RZ2 zone are permitted to increase
density where dwellings have accessibility features (such as door handles and hardware to
AS1428.1) and meets AS4299
– In multi-unit developments of 10 or more dwellings, 10 per cent comply with AS4299
housing class C
– Granny flats are required to meet AS4299 Class C (on land >500 m2).
Source: SGS 2019 Planning Schemes Research July; Western Australian Planning Commission, Residential Design Codes: Volume 2 —
Apartments, State Planning Policy 7.3.
In addition, some local governments in NSW, Victoria and Queensland have also
introduced policies that aim to boost the supply of accessible housing.
There is not enough publicly available data to judge the effectiveness of these policies,
and the extent to which they solve the problem of inaccessible housing. It was the view of

www.TheCIE.com.au
Proposal to include minimum accessibility standards for housing in the National Construction Code 71
many stakeholders during consultation that these state-based planning policies have been
‘tardy’ in addressing the lack of accessible housing.87
CIE has adopted an approach that indirectly considers these local government policies
through nation-level assumptions on the extent to which each element of LHDG
standards is already being incorporated into the design of new homes. These assumptions
are based on the professional advice of quantity surveyors (see report by DCWC88).
Social housing
State and territory governments are also direct providers of housing to people in need,
including some with mobility-related disability. Some governments also have accessibility
requirements/targets for social housing. These accessibility requirements for social
housing are summarised in table 3.12.
3.12 Summary of state and territory government social housing accessibility
requirements
State Policies aimed at increasing the supply of accessible housing
NSW NSW Government has a policy that 10 per cent of all new public housing must be ‘adaptable’.
That is the dwelling must be easily converted at minimal cost to be suitable for people who use
wheelchairs.
Victoria The design of new dwellings must, where practical, achieve the standard of Gold level of the
Liveable Housing Design Guidelines or AS4299 Adaptable Housing (except for car spaces)
Queensland ■ 50 per cent of all new Class 1 social housing will be built to LHDG Gold standard
■ For Class 2 dwellings:
– Ground floor apartments will be built to LHDG Platinum standard
– All lift serviced apartments will be built to LHDG Gold standard
South Australia The South Australian Housing Trust is committed to providing a minimum of 75 per cent of all
new houses to meet Universal Design Criteria.
Tasmania All new social housing properties will be universally designed and suitably diverse for a range of
tenants including the elderly, those living with disability, families or singles (a total of 1155 new
home by June 2023).
ACT 10 per cent of new social housing meets AS4299 (124 over 2 years)
Northern
Territory
Urban Public Housing Design Guidelines require all new urban public housing meets silver level
(128 units in 2016)
Source: Information provided by ABCB; NSW FACS website, https://www.facs.nsw.gov.au/housing/policies/acquiring-new-public-
housing-policy, accessed October 2019.
87 Submission by Margret Ward for ANUHD, p.14, accessed 1 December 2020,
https://consultation.abcb.gov.au/engagement/consult-ris-accessible-
housing/consultation/published_select_respondent
88 DCWC 2020, Accessible Housing: Estimated Cost Impact of Proposed Changes to NCC, Report
Revision V2.2 to ABCB, 23 December 2020.

www.TheCIE.com.au
72 Proposal to include minimum accessibility standards for housing in the National Construction Code
Government assistance for under 65s
The NDIS provides funding to assist eligible people under the age of 65 to meet their
housing needs. The program currently has around 400 000 participants.
Specialist Disability Accommodation
Some NDIS participants receive Specialist Disability Accommodation (SDA) as part of
their NDIS package. SDA refers to accommodation for people who require specialist
housing solutions, including to assist with the delivery of support that caters for their
extreme functional impairment or very high support needs. Under SDA, the National
Disability Insurance Agency (NDIA) funds private organisations that provide
accommodation that meets specified design standards to an eligible participant.
Funding is provided only to a small proportion of NDIS participants with extreme
functional impairment or very high support needs who meet specific eligibility criteria.89
SDA funding will not be available to many people with mobility limitation.
In 2018, NDIA estimated that only 6 per cent of NDIS recipients would qualify for SDA
funding.90 This suggests that only around 24 000 people could be funded through SDA,
accounting for less than 1 per cent of the 2.8 million people who live in a household and
have mobility limitation.
Home modifications
Home modifications are also funded through the NDIS in two main ways:
■ Participants can choose to fund minor home modifications (up to $1 500) from their
core support budget.
■ Higher cost home modifications can be funded through the capital support budget.
Government assistance for over 65s
People over the age of 65 are generally not eligible for NDIS funding. However, they are
eligible for government funding through various aged care programs.
Funding for aged care places
Residential aged care, which is partly funded by the Australian Government, is one
mechanism through which some older Australians (and some younger Australians)
receive accommodation suitable for people with mobility (and other) impairments. This
type of accommodation is generally only suitable for those who need care as well as
accessible accommodation.
89 NDIS website, https://www.ndis.gov.au/providers/essentials-providers-working-ndia/specialist-
disability-accommodation, accessed 11 October 2019
90 National Disability Insurance Agency (NDIA) 2018, Specialist Disability Accommodation Provider
and Investor Brief, April 2018, p. 8, https://www.ndis.gov.au/providers/housing-and-living-supports-
and-services/housing/specialist-disability-accommodation, accessed 3 December 2020

www.TheCIE.com.au
Proposal to include minimum accessibility standards for housing in the National Construction Code 73
Given that residential aged care typically goes beyond the provision of suitable
accommodation, designing more houses consistent with universal design principles will
not replace the need for aged care. However, more accessible housing may reduce or
delay the need for residential aged care to serve the needs of older Australians who may
otherwise be able to stay in their own homes for longer (i.e. ageing in place) – about 95
per cent of older people currently live in residential housing.
Funding for home modifications
For older Australians, government funding is provided for home modifications through
the following programs:91
■ The Commonwealth Home Support Program — this program helps senior
Australians access entry-level support to live independently and safely at home. Home
modifications to improve safety and access (such as ramps and rails) are among the
services offered.
■ Home Care Packages — are designed for those with more complex care needs. These
packages can include home modifications.
There is increasing demand for these services. The Grattan Institute estimates that the
Federal Government needs to spend 35 per cent more than the current level – an extra $7
billion a year – and even more in coming decades as Australian’s population continues to
age.92
No fault motor accident insurance
Most states have compulsory no-fault accident insurance. This is a funding mechanism to
ensure that the needs of people who acquire disability through a motor accident are met.
In many cases, these insurance schemes will fund home modifications, or find suitable
alternative accommodation for people who have acquired disability through a motor
accident.
Other government assistance with accommodation related expenses
Another way that governments assist people with mobility-related disability to access
housing (including accessible housing) is through direct financial assistance. For
example, people with mobility-related disability may be eligible for Commonwealth Rent
Assistance, which is an income supplement payable to eligible people who rent in the
private rental market or community housing.93
91 Australian Government My Aged Care website, https://www.myagedcare.gov.au/help-at-
home/commonwealth-home-support-programme, accessed 13 January 2020
92 Duckett, Stephen, Anika Stobart and Hal Swerissen 2020, Reforming aged care: a practical plan for
a rights-based system, Grattan Institute, 29 November 2020,
https://grattan.edu.au/report/reforming-aged-care-a-practical-plan-for-a-rights-based-system/
93 Department of Social Security website, https://www.dss.gov.au/housing-support/programmes-
services/commonwealth-rent-assistance, accessed 11 October 2019

www.TheCIE.com.au
74 Proposal to include minimum accessibility standards for housing in the National Construction Code
Voluntary certification scheme
Livable Housing Australia (LHA) administers a voluntary certification scheme whereby
homes can be certified as being compliant with LHDG silver, gold or platinum standard.
Other services
There are a range of other services available to people seeking accessible housing
provided by private organisations, including community groups, some of which may
receive some government funding (table 3.13).
3.13 Summary of other services
Organisation States Summary of services
Disability Housing All States Listings of rental housing, houses for
sale and disability housing projects
The Housing Hub All States Lists SDA and supported
accommodation.
Also lists some private rentals.
Nest All States Matches people with disability with
houses that suit their funding,
support and personal needs.
Housing Choices Australia Victoria
Tasmania
South Australia
Not for profit group that houses
people with disability in city and
country areas.
The Endeavour Foundation Queensland
Victoria
New South Wales
A range of housing options where
people get help to live on their own.
Freedom Housing All States Makes it possible for people with
disability to live in a house or
apartment with their partner,
children, extended family, friends,
housemates, or on their own with
around the clock support as required.
Accessible Housing South Australia Not for profit group that helps people
with disability find affordable
housing.
E-bility All States Advertises wheelchair accessible
properties
Home Hunters Relocation All States Can assist to find accessible housing
Source: Spinal Cord Injuries Australia website, https://scia.org.au/accessible-housing/, accessed 14 October 2019.
Housing outcomes under current policy settings
The type of dwellings people identified as having mobility-related disability are currently
residing in is shown in table 3.14. According to the 2018 SDAC, around 92 per cent of

www.TheCIE.com.au
Proposal to include minimum accessibility standards for housing in the National Construction Code 75
people with mobility limitation are living in private dwellings, including around 75 per
cent in separate houses.
3.14 Type of dwelling
Type of dwelling 0 to 14
years
15 to 64
years
65+ years Total Share of
total
‘000 ‘000 ‘000 ‘000 Per cent
Establishments
Hospital (general) 0.0 0.5 2.6 3.2 0.1
Hospital (other) 0.0 0.6 0.1 0.7 0.0
Home for the aged 0.0 3.0 75.2 78.2 2.6
Home (other) 0.0 3.0 1.2 4.0 0.1
Retired/aged accommodation (cared) 0.0 4.6 93.5 98.1 3.2
Retired/aged accommodation (self-
care)
0.0 4.7 43.9 49.0 1.6
Total establishment 0.0 16.4 216.5 233.2 7.7
Private dwelling
Separate house 205.6 1 087.5 984.3 2 278.8 75.1
Townhouse 16.0 149.6 170.6 336.4 11.1
Flat/apartment 8.3 87.6 78.0 178.7 5.9
Other 0.0 5.6 2.7 6.3 0.2
Total private dwelling 229.9 1 330.3 1 235.6 2 800.2 92.3
Total 229.9 1 346.7 1 452.1 3 033.4 100.0
Note: TableBuilder randomly adjusts cells to minimise the risk of identifying individuals in aggregate statistics. This means that table
totals do not always add exactly.
Source: ABS, Survey of Disabilities, Ageing and Carers, 2018, TableBuilder.
Private market
While there is some evidence that the market is partly responding to the need for
accessible housing, it does not meet the needs of many members of the community.
As shown above, most Australians with mobility-related disability live in private
residences. The proportion of new private dwellings that are accessible is not known. The
ABCB Options Paper reported one estimate from 2014 that only around 5 per cent of
newly constructed homes met LHDG silver standard.94 This estimate appears to have
been based on the number of dwellings certified under the LHA certification scheme.
Industry stakeholders reported that many more homes are built to LHDG standards that
are not certified; this is therefore likely to be an underestimate. Other stakeholders noted
that although relatively few new dwellings include all of the accessibility features set out
in the LHDG standards, most new dwellings incorporate at least some of these features.
94 ABCB 2018, Accessible Housing: Options Paper, September 2018

www.TheCIE.com.au
76 Proposal to include minimum accessibility standards for housing in the National Construction Code
Retirement villages
A subset of the private market response to the growing need for accessible housing for
older Australians is through retirement villages. The number of dwellings and residents in
retirement villages (in 2014) is shown in table 3.15. Recent data also suggests a strong
supply pipeline over coming years.95
3.15 Retirement village dwelling and resident numbers — 2014
State or territory Penetration rate of over
65s in retirement villages
Number of residents in
retirement villages
Number of dwellings
Per cent No. No.
NSW and ACT 4.9 55 413 42 625
Victoria 5.3 43 107 33 159
Queensland 6.4 38 842 29 878
South Australia 8.6 23 236 17 874
Western Australia 6.9 20 599 15 846
Tasmania 3.4 2 883 2 218
Australia 5.7 184 080 141 600
Source: Property Council of Australia, National overview of the retirement village sector, October 2014, p.5.
Some stakeholders noted that not all retirement villages meet accessibility standards,
particularly older retirement villages or retirement villages that have been re-purposed
from other buildings.
Moving into a retirement village is often considered a lifestyle choice. However, current
or future accessibility needs may be an important factor for some residents.
It was suggested by stakeholders during consultation that some older people who moved
to a retirement village would have preferred to remain in their previous homes had those
homes met their accessibility needs.
Home modifications
Another way the market (often supported by policy assistance) responds to the need for
accessible housing is through home modifications. According to SDAC data, around
477 800 Australians with mobility limitation live in dwellings that have been modified
because of their condition or age (around 16 per cent of the total) (table 3.16). This
proportion was around 25 per cent for people with profound or severe mobility
limitation.
95 PwC and Property Council 2018, 2018 PwC/Property Council Retirement Census, November 2018,
p.6.

www.TheCIE.com.au
Proposal to include minimum accessibility standards for housing in the National Construction Code 77
3.16 Share of people with a mobility limitation living in modified dwellings
Mobile limitation Dwelling modified Total Share
'000 '000 Per cent
Profound 161.7 632.2 25.6
Severe 123.7 518.9 23.8
Moderate 77.4 434.9 17.8
Mild 117.8 1 394.8 8.4
Total 477.8 2 982.3 16.0
Source: ABS, Survey of Disabilities, Ageing and Carers, 2018, TableBuilder, CIE.
The types of home modifications that have been made (as a share of total home
modifications) is shown in table 3.17.
3.17 Types of home modifications — share of total home modifications
Type of modification Profound Severe Moderate Mild Total
Per cent Per cent Per cent Per cent Per cent
Structural changes 15.3 12.9 11.5 5.7 11.5
Ramps 30.7 20.9 20.3 13.8 22.3
Toilet, bath or laundry modifications 57.1 50.5 44.3 39.0 49.2
Kitchen modifications 7.4 4.4 2.6 3.1 4.6
Doors widened 9.1 3.6 3.6 1.1 4.7
Handrails or grab rails 66.1 65.6 70.9 63.4 66.5
Remote controls 1.9 2.3 2.3 0.0 1.5
New or changed heating or air-conditioning 11.8 4.8 3.4 3.1 6.0
Installed home automation/smart home or
environmental control system 2.4 0.0 0.0 0.0 0.9
Telemonitoring system 3.0 2.3 0.0 1.7 2.0
Other change to dwelling 11.3 14.6 9.4 13.0 12.0
Note: Refers to the percentage of total home modifications.
Source: ABS, Survey of Disabilities, Ageing and Carers, 2018, TableBuilder.
In 2018-19, the Australian Government funded 48 842 home modifications for people
over the age of 65 through the Commonwealth Home Support Program at a total cost of
around $35.3 million.96 This implies an average cost of around $723 per modification,
although this Program covers only relatively minor modifications. The cost of home
modification that are funded privately or through other government programs is not
known.
96 Australian Institute of Health and Welfare website, https://www.gen-
agedcaredata.gov.au/Resources/Access-data/2019/September/Aged-care-data-
snapshot%E2%80%942019, accessed 22 December 2019.

www.TheCIE.com.au
78 Proposal to include minimum accessibility standards for housing in the National Construction Code
Moving to a more accessible dwelling
Where their current residence no longer meets their needs, one option that may be
available to people with mobility-related disability is to move to a dwelling that better
meets their accessibility needs (if available). SDAC data suggests that around 10 per cent
of people with mobility-related disability have had to move house at least once as a result
of their condition or age (table 3.18). This affects all members of the household, not just
the person with accessibility needs.
3.18 Moved house because of condition or age
Has had to move
house once
Has had to move
house more
than once
Total moved
house
Total Share moved
'000 '000 '000 '000 Per cent
Profound 63.3 22.8 86.1 632.2 13.6
Severe 61.0 18.2 79.2 518.9 15.3
Moderate 35.3 11.0 46.3 434.9 10.6
Mild 78.8 16.2 95.0 1 394.8 6.8
Total 240.0 67.1 307.1 2 982.3 10.3
Source: ABS, Survey of Disabilities, Ageing and Carers, 2018, TableBuilder.
Social housing
The AIHW reports that around 393 912 households were supported through social
housing programs as at 30 June 2017. Of these, 153 422 households (39 per cent)
contained a person with a disability. However, no information is provided on:
■ the severity of the disabilities
■ the proportion that had mobility-related disability.
According to data from the SDAC, there were around 221 800 people with
mobility-related disability in social housing in 2018 (table 3.19).
3.19 Number of people with a mobility-related disability in social housing
Type of social housing Profound Severe Moderate Mild Total
'000 '000 '000 '000 '000
State or Territory Housing Authority 29.7 28.9 27.4 77.5 166.6
Housing co-operative, community or church group 16.7 7.8 7.7 26.4 55.1
Total 46.3 37.9 35.1 103.7 221.8
Source: ABS, Survey of Disabilities, Ageing and Carers, 2018, TableBuilder.
Aged care
According to SDAC data, there were around 176 300 people with mobility limitation in
residential aged care in 2018 (including accommodation for the retired or aged).

www.TheCIE.com.au
Proposal to include minimum accessibility standards for housing in the National Construction Code 79
The AIHW reports there were 182 705 permanent aged care places funded by the
Australian Government in 2019.97
Specialist Disability Accommodation
The NDIS Quarterly Report to the COAG Disability Reform Council reported that as at
31 December 2020:
■ there were 15 667 participants with SDA funding in an active NDIS plan (the NDIA
has estimated that the number of participants eligible for SDA funding will increase to
28 000 over time).
■ there were 4 921 enrolled dwellings, including:98
– 2 005 Basic dwellings
– 1 032 Improved Liveability dwellings (broadly aligning with the LHDG silver
standard)
– 1 007 High Physical Support dwellings (housing that has been designed to
incorporate a high level of physical access provision for people with significant
physical impairment and requiring very high levels of physical support).
– 242 Robust dwellings (broadly aligning with LHDG silver standard)
– 635 ‘Fully Accessible’ dwellings (broadly consistent with LHDG platinum
standard dwellings)
Quantifying the problem
The outcomes (including those described above) under current arrangements and policy
settings are not necessarily optimal from various perspectives. In particular, housing
designs that are not based on universal design principles may not be optimal where:
■ the needs of members of the community with mobility-related disability are not met;
and/or
■ the cost of meeting the needs of members of the community with mobility-related
disability is unnecessarily high (including both costs incurred by affected individuals
and the government).
These sub-optimal outcomes are effectively the problem that the proposed changes to the
NCC are trying to solve (i.e. the problem that is not already being solved through existing
mechanisms).
Table 3.20 identifies some sub-optimal outcomes that could arise from a shortage of
accessible housing.
97 Australian Institute of Health and Welfare website, https://www.gen-
agedcaredata.gov.au/Resources/Access-data/2019/September/Aged-care-data-
snapshot%E2%80%942019, accessed 22 December 2019.
98 NDIS Quarterly Report to disability ministers, 31 December 2020, pp. 526-550.
https://www.ndis.gov.au/about-us/publications/quarterly-reports
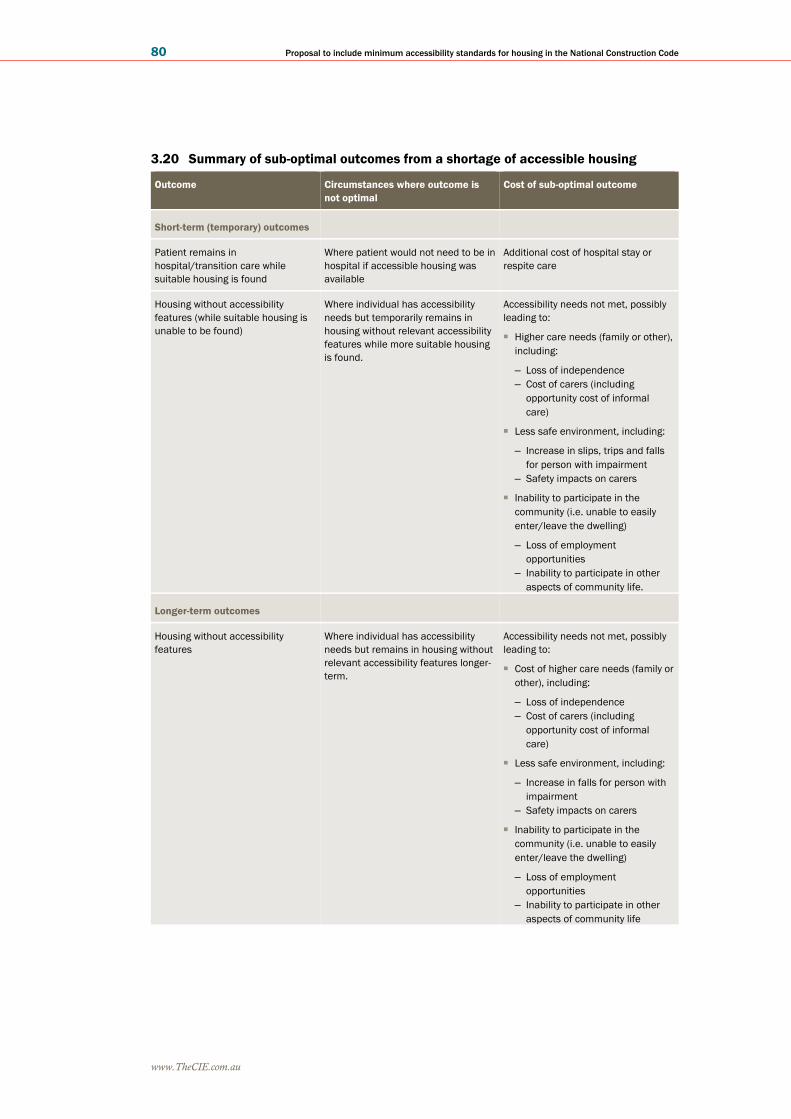
www.TheCIE.com.au
80 Proposal to include minimum accessibility standards for housing in the National Construction Code
3.20 Summary of sub-optimal outcomes from a shortage of accessible housing
Outcome Circumstances where outcome is
not optimal
Cost of sub-optimal outcome
Short-term (temporary) outcomes
Patient remains in
hospital/transition care while
suitable housing is found
Where patient would not need to be in
hospital if accessible housing was
available
Additional cost of hospital stay or
respite care
Housing without accessibility
features (while suitable housing is
unable to be found)
Where individual has accessibility
needs but temporarily remains in
housing without relevant accessibility
features while more suitable housing
is found.
Accessibility needs not met, possibly
leading to:
■ Higher care needs (family or other),
including:
– Loss of independence
– Cost of carers (including
opportunity cost of informal
care)
■ Less safe environment, including:
– Increase in slips, trips and falls
for person with impairment
– Safety impacts on carers
■ Inability to participate in the
community (i.e. unable to easily
enter/leave the dwelling)
– Loss of employment
opportunities
– Inability to participate in other
aspects of community life.
Longer-term outcomes
Housing without accessibility
features
Where individual has accessibility
needs but remains in housing without
relevant accessibility features longer-
term.
Accessibility needs not met, possibly
leading to:
■ Cost of higher care needs (family or
other), including:
– Loss of independence
– Cost of carers (including
opportunity cost of informal
care)
■ Less safe environment, including:
– Increase in falls for person with
impairment
– Safety impacts on carers
■ Inability to participate in the
community (i.e. unable to easily
enter/leave the dwelling)
– Loss of employment
opportunities
– Inability to participate in other
aspects of community life

www.TheCIE.com.au
Proposal to include minimum accessibility standards for housing in the National Construction Code 81
Outcome Circumstances where outcome is
not optimal
Cost of sub-optimal outcome
Residential aged care a ■ Where the person does not require
specialist housing or the level of
care that is provided in aged care
(i.e. their only requirement is
housing that is physically
accessible, and they can only get
this by moving into aged care)
■ Less preferred environment,
potentially leading to:
– social isolation
– loneliness
■ Higher financial cost to the
government than home-based care.
Institutional care for younger people
with a disability
■ This outcome is sub-optimal in all
instances.
■ Less preferred environment,
potentially leading to:
– social isolation
– depression
– inability to participate in the
community (including
employment)
■ Possibly higher cost than home-
based care.
■ People in institutional care may be
more vulnerable to abuse.
Accessible private/social housing in
non-preferred location
A person may have accessible
private/social housing, but the
location does not suit their needs (in
terms of proximity to family/friends,
schools and employment
opportunities)
■ Social isolation/loneliness
■ Lack of employment opportunities
■ Disruption for families (such as
school-aged children moving
schools)
Home modifications Home modifications may not be an
optimal option where:
■ Home modifications only partially
meet accessibility needs
■ Home modifications are
prohibitively costly.
■ High cost of home modification.
People with disability unable to visit
family and friends
■ Social isolation/loneliness
Source: CIE.
In summary, the problem that the proposed changes to the NCC are trying to solve
includes:
■ safety-related costs such as where people with accessibility needs remain living in
housing that does not meet their accessibility needs and are therefore at higher risk of
falls
■ costs associated with additional care needs, where people with accessibility needs
remain living in housing that does not meet their needs
■ unnecessarily high costs (i.e. higher than if the initial design of the residence had been
consistent with universal design principles) associated with home modifications
■ costs associated with moving house to obtain accessibility features
■ costs associated with longer stays in hospital and transition care, where discharge is
delayed due to their home lacking accessibility features

www.TheCIE.com.au
82 Proposal to include minimum accessibility standards for housing in the National Construction Code
■ costs associated with loneliness, where people with accessibility needs are unable to
leave their own house as frequently as they would like or are unable to visit friends
and relatives (there may also be costs for people without accessibility needs, where
family members and friends with accessibility needs are unable to visit them)
■ additional costs associated with inappropriate or premature entry into aged care due
to dwellings lacking relevant accessibility features.
Some stakeholders argued that a lack of accessible housing may also be contributing to
poorer employment outcomes for some people with mobility-related disability. There is
related literature that provides relevant qualitative insights into this issue; however, CIE
was not able to identify any direct quantifiable evidence. Some findings of the MDI
survey have been used to provide an indicative estimate subject to the qualifications
mentioned above.
To understand the size of the problem, the following factors need to be understood:
■ the number of people affected, and
■ the costs imposed on those affected as a result of a shortage of accessible housing.
The estimates of the approximate size of each of these problems based on the available
information are presented below.
Safety-related costs
Many people with accessibility needs have trouble finding accessible housing that meets
their needs.99 When accessibility needs are not met, there may be an increased risk of
falls. In some cases, falls result in serious injury or even death. Box 3.21 presents a case
from the public submissions where a person using a power wheelchair and living in a
third floor apartment faces safety and other issues when the lift does not work.
While it is not clear that the NCC proposal would directly address this issue, the
increased availability of accessible dwellings could provide people in this situation greater
choice of suitable dwellings and it provides a good example of the safety-related costs.
3.21 Lived experience – safety
I use a power wheelchair and live in a private rental in a third floor apartment. Since
truly accessible affordable properties are hard to find, this was the best we could get.
When the lift breaks down (which it does), or there is a fire alarm, I am unable to get
in and out of the building on crutches without assistance. My safety is significantly
more at risk as a result. When the lift breaks down, if I am not at home then I am
stuck outside my apartment until someone is able to help me get inside. On one
occasion, I was not fit to climb the stairs even with assistance, so I stayed in a hotel
overnight when the lift was out. That was a significant expense for which I was
entitled to no compensation. If I am at home when the lift breaks down, I am unable
99 Australian Network for Universal Housing Design 2018, Report on the Survey on the provision of
Livable housing design: the costs and benefits to Australian Society, May 2018, p. 19

www.TheCIE.com.au
Proposal to include minimum accessibility standards for housing in the National Construction Code 83
3.21 Lived experience – safety
to use my power chair to leave the building until it is fixed so my ability to get out into
the community is greatly reduced.
Source: Jane Scott Response100
The main safety-related costs are likely to relate to additional falls. The evidence on the
impact of environmental factors on the incidence of falls in homes is mixed.101
■ The World Health Organisation (WHO) assessed that the strength of evidence that
people with functional impairments have reduced fall and injury rates in homes that
have been modified is moderate based on a review of the literature.102
■ An older (2006) review of the evidence for the (then) Australian Government
Department of Health and Ageing by the National Ageing Research Institute
concluded that:
“There is growing evidence that home hazard assessment and modification programs may be
effective in reducing falls, particularly when undertaken by trained health professionals such as
occupational therapists, and when targeting those at increased risk of falls. These approaches
are more likely to be effective when combined with strategies to modify risky behaviours, and
maximise adherence with recommended hazard modifications. To date there is no strong
evidence that modifications to reduce environmental fall hazards within the home or public
areas in isolation are effective in reducing fall rates [emphasis added].”103
The implication is that there is limited evidence to suggest that the universal design
features would significantly reduce falls.
■ For the purposes of the CBA, the following assumptions are made:
– As a significant number of studies suggest that environmental factors have a
minimal impact on falls, a reasonable lower bound would be to assume that the
universal design features on their own could have no impact on falls.
– As an upper bound estimate, CIE uses the same impact estimated for the
Consultation RIS (i.e. lack of universal design features increases falls by around
37 per cent).
– For the central case, it is assumed that the lack of universal design features
increase falls by around 10 per cent. CIE considers that the impact of the NCC
100 Submission by Jane Scott, accessed 13 November 2020,
https://consultation.abcb.gov.au/engagement/consult-ris-accessible-
housing/consultation/published_select_respondent
101 Pynoos, J. Steinman, B.A. and Nguyen, A.Q.D. 2010, ‘Environmental Assessment and
Modification as Falls Prevention Strategies for Older Adults’, Clinical Geriatric Medicine,
November 26(4), pp.633-644.
102 World Health Organization 2018, WHO Housing and health guidelines, chapter seven. Emphasis
is in the WHO report (p.71).
103 Hill, K. Vrantsidis, F., Haralambous, B. Fearn, M. Smith, R. Murray, K. Sims, J. Dorevitch,
M. 2004, An analysis of research on preventing falls and falls injury in older people: Community
residential care and hospital settings, Report to the Australian Government Department of Health
and Ageing, Injury Prevention Section by the National Ageing Research Institute, National
Falls Prevention for Older People Initiative, p.26.
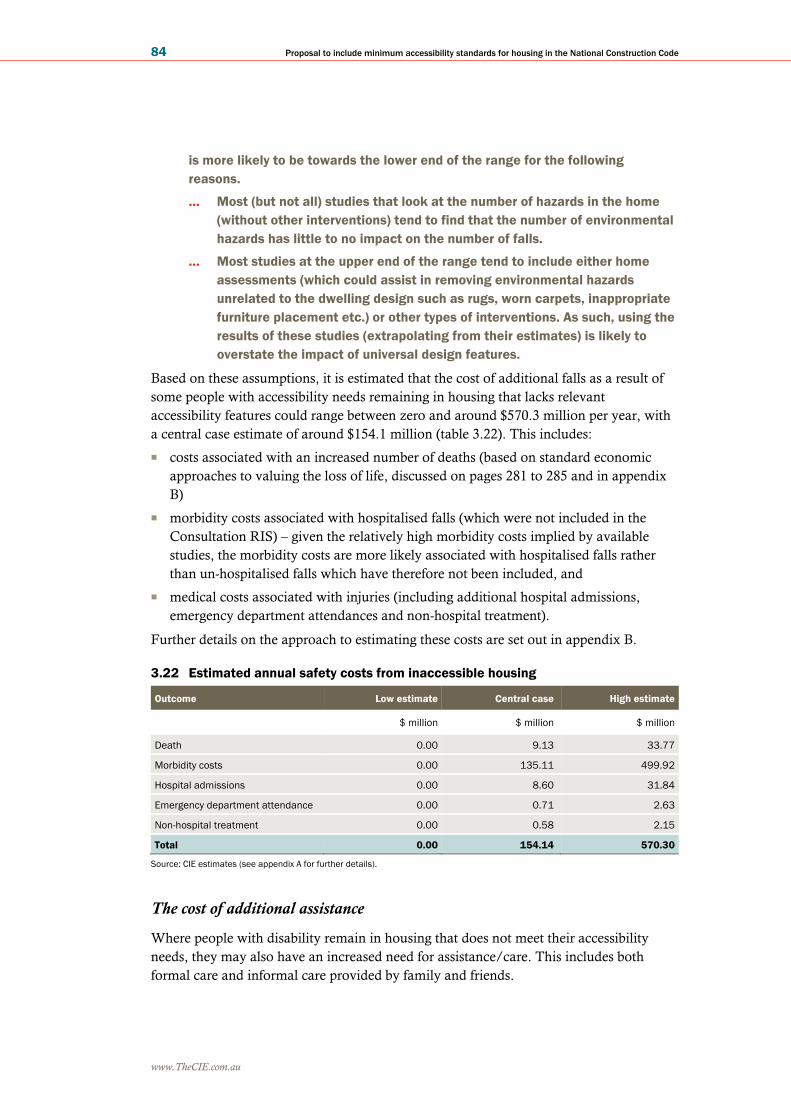
www.TheCIE.com.au
84 Proposal to include minimum accessibility standards for housing in the National Construction Code
is more likely to be towards the lower end of the range for the following
reasons.
… Most (but not all) studies that look at the number of hazards in the home
(without other interventions) tend to find that the number of environmental
hazards has little to no impact on the number of falls.
… Most studies at the upper end of the range tend to include either home
assessments (which could assist in removing environmental hazards
unrelated to the dwelling design such as rugs, worn carpets, inappropriate
furniture placement etc.) or other types of interventions. As such, using the
results of these studies (extrapolating from their estimates) is likely to
overstate the impact of universal design features.
Based on these assumptions, it is estimated that the cost of additional falls as a result of
some people with accessibility needs remaining in housing that lacks relevant
accessibility features could range between zero and around $570.3 million per year, with
a central case estimate of around $154.1 million (table 3.22). This includes:
■ costs associated with an increased number of deaths (based on standard economic
approaches to valuing the loss of life, discussed on pages 281 to 285 and in appendix
B)
■ morbidity costs associated with hospitalised falls (which were not included in the
Consultation RIS) – given the relatively high morbidity costs implied by available
studies, the morbidity costs are more likely associated with hospitalised falls rather
than un-hospitalised falls which have therefore not been included, and
■ medical costs associated with injuries (including additional hospital admissions,
emergency department attendances and non-hospital treatment).
Further details on the approach to estimating these costs are set out in appendix B.
3.22 Estimated annual safety costs from inaccessible housing
Outcome Low estimate Central case High estimate
$ million $ million $ million
Death 0.00 9.13 33.77
Morbidity costs 0.00 135.11 499.92
Hospital admissions 0.00 8.60 31.84
Emergency department attendance 0.00 0.71 2.63
Non-hospital treatment 0.00 0.58 2.15
Total 0.00 154.14 570.30
Source: CIE estimates (see appendix A for further details).
The cost of additional assistance
Where people with disability remain in housing that does not meet their accessibility
needs, they may also have an increased need for assistance/care. This includes both
formal care and informal care provided by family and friends.

www.TheCIE.com.au
Proposal to include minimum accessibility standards for housing in the National Construction Code 85
A higher share of respondents to the MDI survey that were living in an inaccessible home
indicated that their need for paid disability support had increased due to the design of
their current home compared to those living in accessible homes (chart 3.23).
3.23 Share of respondents with increasing need for paid disability support
Data source: Wiesel, I. Lived experience and social, health and economic impacts of inaccessible housing, prepared for the Melbourne
Disability Institute, University of Melbourne and the Summer Foundation, 18 August 2020, as Appendix 2 of the submission by
Melbourne Disability Institute (MDI) and Summer Foundation.
Similarly, a higher share of respondents living in inaccessible homes indicated that their
need for informal care had increased due to the design of their current home compared to
those living in accessible homes (chart 3.24).
3.24 Share of respondents with increasing need for informal care
Data source: Wiesel, I. Lived experience and social, health and economic impacts of inaccessible housing, prepared for the Melbourne
Disability Institute, University of Melbourne and the Summer Foundation, 18 August 2020, as Appendix 2 of the submission by
Melbourne Disability Institute (MDI) and Summer Foundation.
0
10
20
30
40
50
60
70
Low support needs High support needs
Pe
r ce
nt
Accessible home Inaccessible home
0
10
20
30
40
50
60
70
80
Low support needs High support needs
Pe
r ce
nt
Accessible home Inaccessible home

www.TheCIE.com.au
86 Proposal to include minimum accessibility standards for housing in the National Construction Code
Evidence of additional care needs as a direct result of inaccessible housing was also
presented in submissions (see box 3.25).
3.25 Lived experience — additional care
One of the case studies in the submission from the Summer Foundation and the
Melbourne Disability Institute — Miriam’s story — provides direct evidence of
inaccessible housing significantly increasing the need for paid support. Miriam has
cerebral palsy and lives in social housing unit. The shower is over a bathtub and
Miriam cannot use it safely without support. As a result, Miriam requires paid support
to supervise her showering (funded through the NDIS). This equates to an additional
cost of around $25 000 per year that would be avoided through an accessible
shower.104
This section focuses on estimating the cost of the additional time spent caring for people
with mobility and self-care limitations as a result of inaccessible housing (i.e. the
opportunity cost of the carer’s time). In some cases, the need for additional care also
reduces independence and quality of life of the recipient. These costs are estimated in the
section on ‘quality of life’.
In the Consultation RIS, the estimated costs associated with additional care was based on
the number of people with mobility limitations only. However, several stakeholders
(including ANUHD), suggested this excluded people requiring assistance with bathing
and showering, and toileting that would benefit from more accessible showers and
toilets.105 Some stakeholders also argued that the time spent by family and friends caring
for people with disability (i.e. informal care) had been undervalued at the minimum
wage.106
To address these issues the following adjustments have been made.
■ The number of people requiring assistance with bathing and showering and toileting
have now been included.
■ Informal care is valued based on current wage rates of aged care workers, which is
around $22.85 per hour (based on Sydney hourly rates).
Under these revised assumptions, it is estimated that the additional cost of carers —
including both formal and informal carers — that can be attributable to inaccessible
housing could be around $938.5 million per year (table 3.26).
104 Wiesel, I. Lived experience and social, health and economic impacts of inaccessible housing, prepared
for the Melbourne Disability Institute, University of Melbourne and the Summer Foundation,
18 August 2020, as Appendix 2 of the submission by Melbourne Disability Institute (MDI) and
Summer Foundation. p. 27
105 See for example: anonymous submissions 284174932 and submission by Margret Ward for the
Australian Network for Universal Housing Design, pp. 9-10.
106 See for example: Margret Ward, op.cit., pp. 18-19; and Anonymous Submission 284174932
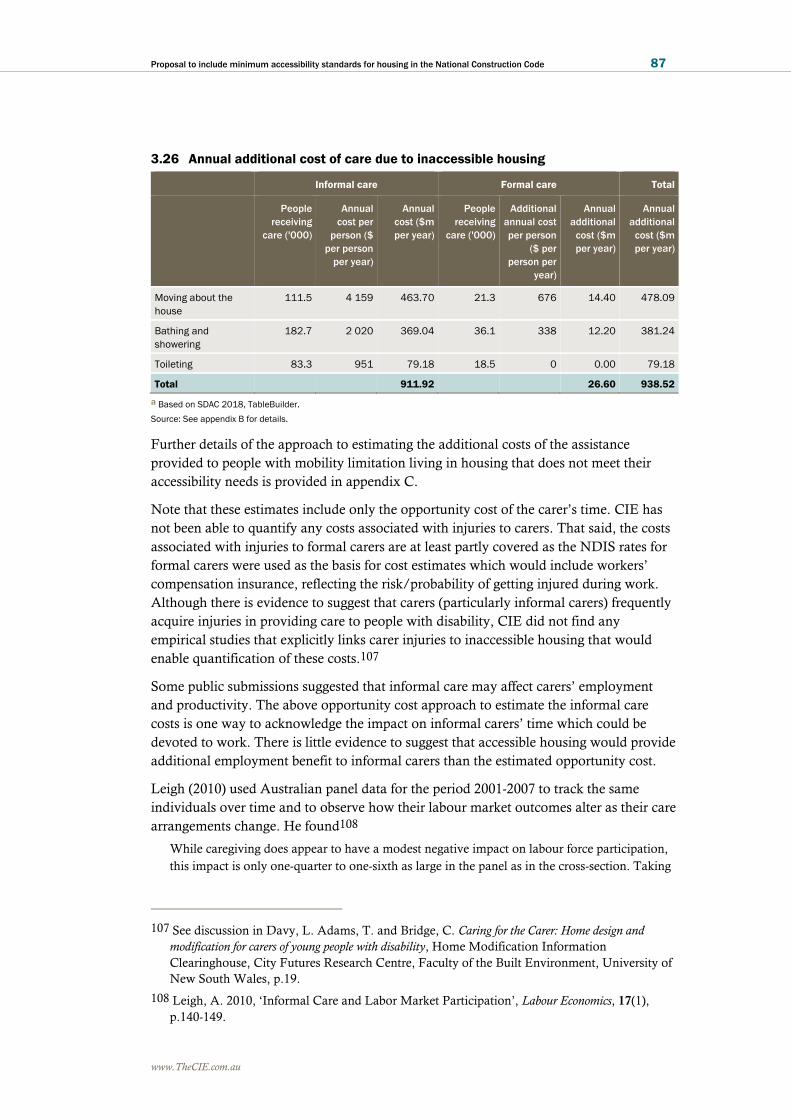
www.TheCIE.com.au
Proposal to include minimum accessibility standards for housing in the National Construction Code 87
3.26 Annual additional cost of care due to inaccessible housing
Informal care Formal care Total
People
receiving
care ('000)
Annual
cost per
person ($
per person
per year)
Annual
cost ($m
per year)
People
receiving
care ('000)
Additional
annual cost
per person
($ per
person per
year)
Annual
additional
cost ($m
per year)
Annual
additional
cost ($m
per year)
Moving about the
house
111.5 4 159 463.70 21.3 676 14.40 478.09
Bathing and
showering
182.7 2 020 369.04 36.1 338 12.20 381.24
Toileting 83.3 951 79.18 18.5 0 0.00 79.18
Total 911.92 26.60 938.52
a Based on SDAC 2018, TableBuilder.
Source: See appendix B for details.
Further details of the approach to estimating the additional costs of the assistance
provided to people with mobility limitation living in housing that does not meet their
accessibility needs is provided in appendix C.
Note that these estimates include only the opportunity cost of the carer’s time. CIE has
not been able to quantify any costs associated with injuries to carers. That said, the costs
associated with injuries to formal carers are at least partly covered as the NDIS rates for
formal carers were used as the basis for cost estimates which would include workers’
compensation insurance, reflecting the risk/probability of getting injured during work.
Although there is evidence to suggest that carers (particularly informal carers) frequently
acquire injuries in providing care to people with disability, CIE did not find any
empirical studies that explicitly links carer injuries to inaccessible housing that would
enable quantification of these costs.107
Some public submissions suggested that informal care may affect carers’ employment
and productivity. The above opportunity cost approach to estimate the informal care
costs is one way to acknowledge the impact on informal carers’ time which could be
devoted to work. There is little evidence to suggest that accessible housing would provide
additional employment benefit to informal carers than the estimated opportunity cost.
Leigh (2010) used Australian panel data for the period 2001-2007 to track the same
individuals over time and to observe how their labour market outcomes alter as their care
arrangements change. He found108
While caregiving does appear to have a modest negative impact on labour force participation,
this impact is only one-quarter to one-sixth as large in the panel as in the cross-section. Taking
107 See discussion in Davy, L. Adams, T. and Bridge, C. Caring for the Carer: Home design and
modification for carers of young people with disability, Home Modification Information
Clearinghouse, City Futures Research Centre, Faculty of the Built Environment, University of
New South Wales, p.19.
108 Leigh, A. 2010, ‘Informal Care and Labor Market Participation’, Labour Economics, 17(1),
p.140-149.

www.TheCIE.com.au
88 Proposal to include minimum accessibility standards for housing in the National Construction Code
account of individual heterogeneity, the impact of caregiving on other labour force outcomes
(and on life satisfaction) seems to be small or non-existent.
Inaccessible housing is only one of many factors affecting informal caregivers’ labour
market outcomes. If the impact of caregiving status on employment is ‘small or non-
existent’, the impact of inaccessible housing would be even smaller.
For this reason, any additional employment impact or productivity impacts have not
been included in the quantifiable size of the problem.
Quality of life impacts
A number of submissions suggested that inaccessible housing reduces the quality of life of
people with accessibility needs which should be included in the estimates of the size of
the problem. Quality of life covers a wide spectrum of impacts, including reduced
independence, loss of dignity, poor mental health, social isolation and loneliness.
There is a range of qualitative evidence to support this proposition.
■ A study from the London Schools of Economics and Political Science109 (LSE)
emphasised the wider quality of life impacts where housing accessibility needs are met
(compared to those with unmet needs). Based on a survey and in-depth interviews, the
LSE study identified the importance of retaining dignity, independence and social
contact.
■ Multiple submissions also identified issues that could broadly be termed as reduced
quality of life from inaccessible housing (or quality of life improvements associated
with accessible housing) (see box 3.27 for a case study of lived experience of quality of
life impacts of inaccessible housing).
109 Provan, B. Burchardt, T. and Suh, E. No Place Like Home, Quality of life and opportunity for
disabled people with accessible housing needs, London School of Economics and Political
Science and Centre for Analysis of Social Exclusion, CASE Report 109, pp.15-16.

www.TheCIE.com.au
Proposal to include minimum accessibility standards for housing in the National Construction Code 89
3.27 Lived experience – quality of life impacts
Better quality of life with accessible housing
A person is more disabled when their built environment is inaccessible. I have lived in
both an inaccessible house and a fully purpose built home. In my accessible home – I
am happy, productive, social and my best person (to myself, my friends and family). I
am an excellent employee … - and this is partly related to my physical health and my
mental health being on track. Without access in my home – I was clinically depressed,
suicidal, unemployed and single. I now have a great career, I am a wife, a mother, a
friend and I am studying at uni.110
Social isolation due to inaccessible housing
I lead a very social life, we have barbeques and such, but we [my wife and I] never get
invited anywhere because our friend’s houses aren’t accessible for me. It’s not just
affecting me, it affects [my wife’s] socialising too.
PDCN member & fulltime wheelchair user (his wife does not have a physical disability)
Source: Physical Disability Council of NSW (p5)111
While I do not personally experience any of the physical disabilities included in the
form (so didn't submit it) the difficulty of finding accessible housing impacts me in
many ways. I also know several people who are directly impacted due to their
physical disabilities - some of whom will not have the capacity to fill out the form
(due to mental health situations).
The ways that I am impacted include having been unable to live with people I would
have if we were able to find a house that was accessible (and affordable) for them -
they ended up moving back into their parents at 38. Even were I not wanting to live
with someone with accessible housing needs, I would still prioritise finding a home
where I can invite all of my friends to visit - including those who have physical
disabilities.
Source: Anonymous Response 722067220112
110 Anonymous Submission 90458024, accessed 11 November 2020,
https://consultation.abcb.gov.au/engagement/consult-ris-accessible-
housing/consultation/published_select_respondent
111 Submission by Hayley Stone for Physical Disability Council of NSW, p.5, accessed 13
November 2020, https://consultation.abcb.gov.au/engagement/consult-ris-accessible-
housing/consultation/published_select_respondent
112 Anonymous Submission 722067220, accessed 13 November 2020,
https://consultation.abcb.gov.au/engagement/consult-ris-accessible-
housing/consultation/published_select_respondent

www.TheCIE.com.au
90 Proposal to include minimum accessibility standards for housing in the National Construction Code
3.27 Lived experience – quality of life impacts
Improved visitability and social participation with accessibility features
Based on my own experience of 24 years being a paraplegic in rental housing and
trying to visit friends/family in a wheelchair, the most critical features to provide for a
basic level of accessibility are STEP FREE, accessible gradient paths of travel from
parking area to inside, wider doorways (Gold level provisions), minimum 1m
clearance on one side of the bed and accessible bathroom facilities (Gold level
provisions). If those things are provided, I can tolerate all the other difficulties with
practically accessing kitchens, parking, other rooms in the house but would
recommend they were also addressed with additional provisions to make a more
wholistic [sic] solution.
Source: Anonymous (Q30) Response 894045598113
I have been a member of a Book Club for almost fifteen years. We have evolved into
a tight knit and supportive group who have together navigated births, marriages,
separation, illness, renovations and meet regularly to share wine, cheese and stories.
Originally established in a bookshop, on its closure a new venue was sought.
Eventually, cafes and restaurants becoming too expensive or too constrained we
discussed visiting each other’s homes, a different member hosting each month. With
one of our group in a wheelchair an accessibility review of each person’s home
resulting in only one person from the seven having a home that was equally accessible
to all, predictably that of the person in the wheelchair, although two others had homes
that were accessible through the garage. Imagine our delight when one evening on
arrival there was a handcrafted plywood ramp enabling access with the proud
pronouncement that “Everybody should be able to come in through our front door!”.
And now we all do just that on a regular basis.
Source: Wendy Lovelace Response114
According to the survey by MDI, a significantly higher share of respondents living in
inaccessible housing indicated worsened mental health and wellbeing, compared with
those living in accessible homes (chart 3.28).115 Conversely, a high share of people living
in accessible homes reported improved mental health and wellbeing.
113 Anonymous Submission 894045598 Accessed 13 November 2020,
https://consultation.abcb.gov.au/engagement/consult-ris-accessible-
housing/consultation/published_select_respondent
114 Wendy Lovelace, op. cit.
115 Wiesel, I. op. cit., p.31.

www.TheCIE.com.au
Proposal to include minimum accessibility standards for housing in the National Construction Code 91
3.28 Share of respondents indicating that the accessibility of their current home had
worsened their mental health and wellbeing
Note: Q: To what extent has the accessibility standard of your current home — and ability to get in and around the home — affected
your mental health and wellbeing?
Data source: Wiesel, I. Lived experience and social, health and economic impacts of inaccessible housing, prepared for the Melbourne
Disability Institute, University of Melbourne and the Summer Foundation, 18 August 2020, as Appendix 2 of the submission by
Melbourne Disability Institute (MDI) and Summer Foundation.
Although there is significant qualitative evidence demonstrating reduced quality of life,
including loss of independence, loss of dignity and poorer mental health outcomes
associated with inaccessible housing (relative to accessible housing), quantitative
evidence is limited. Based on the limited information available, CIE considered various
approaches to quantifying the quality of life impacts (see below).
■ The estimates of the quality of life costs associated with inaccessible housing
based on these various approaches varied significantly (reflecting high levels of
uncertainty). The CBA assumes:
– A lower bound estimate of around $1 billion per year, based on the lower bound
estimate using the WTP approach.
– A central case estimate of around $1.9 billion per year, based on the upper
bound estimate using the WTP approach.
– An upper bound estimate of around $3.8 billion per year, based on the estimate
using the reduction in quality-adjusted life years (QALYs).
The willingness to pay approach
Anticipated quality of life improvements should be reflected in household’s willingness to
pay for accessibility features. The stated preference survey conducted for the
Consultation RIS was therefore used as one approach for estimating the WTP for
accessible features proposed in the NCC. It is estimated that the WTP for Silver and
Gold is $1 919 per year and $3 451 per year per household with at least one family
member having mobility disability, respectively.
0
10
20
30
40
50
60
70
80
Low support needs High support needs
Pe
r ce
nt
Accessible home Inaccessible home

www.TheCIE.com.au
92 Proposal to include minimum accessibility standards for housing in the National Construction Code
SDAC data suggests that there are about 554 400 people who live in an unmodified home
who have difficulties with moving about the house, toileting or showering. Assuming
that each household has only one person with difficulties with these activities, it is
estimated that the total benefit of making their homes accessible could be between $1.1
billion and $1.9 billion per year (table 3.29).
3.29 Willingness to pay for accessible housing
Willingness to pay Silver Gold
WTP ($ per year per household) 1,919.0 3,451.0
Number of households impacted ('000) a 554.4 554.4
Total impact ($ million) 1,063.9 1,913.2
a Assuming each household has only one family member having difficulty in moving about home, toileting or showering.
Source: CIE estimates based on WTP survey and SDAC data.
It should be noted that this estimate of WTP for accessible housing includes a range of
impacts which have been identified and quantified separately to avoid overlapping. For
example, as suggested by Dalton and Carter in their supplementary report, privately
borne costs and inconvenience (or disutility) such as cost associated with loneliness, care
related costs, home modifications and moving may be overlapping with the WTP
estimates.116 These items amount to $1.6 billion and $1.9 billion per year (see table 3.2).
This implies no additional quality of life impact over and above that which was estimated
under other problems.
Dalton and Carter (2020a, b) also argue that there is possibly no overlap between WTP
and the problem reduction approach. If no overlap is assumed, the above WTP estimate
could be viewed as a maximum upper bound measurement of the quality of life impact.
■ Based on the limited evidence available, quality of life costs as a result of
inaccessible housing could be between zero and a couple of billion dollars per year.
It should be emphasised that the upper bound of the estimate includes a wide spectrum of
impacts. It does not only include the impacts on independent living, mental health, social
isolation and loneliness for people with mobility difficulties, but also includes the impact
on their family members because the WTP estimate is household based.
As a component of the quality of life impacts, an estimate of the mental health impact is
also provided in appendix I. It is estimated that the mental health impact of inaccessible
housing is around $420 million to $440 million which, as discussed in the appendix, is
116 Dalton, A. and R. Carter 2020b, Economic advice prepared to assist with responses to the Consultation
Regulation Impact Statement on minimum accessibility standards for housing in the National
Construction Code: Supplementary information prepared for the Melbourne Disability Institute,
University of Melbourne and the Summer Foundation, p.4, in Melbourne Disability Institute and
Summer Foundation, Accessible Housing the Way Forward: Supplementary information provided to
the Australian Building Codes Board Consultation RIS.

www.TheCIE.com.au
Proposal to include minimum accessibility standards for housing in the National Construction Code 93
likely an overestimate and suggests the upper bound WTP estimate of $1.9 billion for the
quality of life impacts is also an overestimate.117
Estimating quality of life impacts through QALYs
Another approach to incorporating quality of life changes into economic analysis is
through estimating changes in quality-adjusted life years (QALYs). QALYs are
calculated by multiplying life years by an index of utility, also referred to as health-related
quality of life (HRQoL) or multi-attribute utility (MAU) instrument. Utility represents
the strength of a person’s preference for a health state on a scale from 0 (representing
death) to 1 (representing good health).118
CIE identified only one study that estimated the HRQoL associated with accessible
housing, although the relevance of that study to the NCC proposal is questionable (see
discussion in appendix J for more details). Nevertheless, Carnemolla (2015)119 estimate
that home modifications to make homes more accessible increased the HRQoL by 0.12.
Applying OBPR’s preferred estimate of the value of a life year of $213 000 implies that
the HRQoL costs associated with inaccessible housing would be around $25 560 per
person. Note that this estimate is likely to exceed the capacity of many affected
individuals to pay for improved accessibility. This is one reason why some health
economists prefer not to monetise QALYs.120
There is no definitive data on the number of people experiencing significant lower
HRQoL due to inaccessible housing. However, there is some evidence to suggest that the
main factor contributing to lower HRQoL is the loss of independence.121 The focus is
therefore on people who live in unmodified dwellings who always need assistance with:
mobility around the place of residence, showering/bathing and toileting. Based on 2018
SDAC data, this is around 147 500 people.
117 As indicated earlier, quality of life utility index includes four components – independence,
mental health, relationships and senses. Accessible housing has little impact on the senses
component (vision and hearing changes), as pointed by Carnemolla (2015). It is therefore
expected that the total size of quality of life impact is roughly three to four times the size of
mental health impact, that is, around $1.6 billion.
118 Assessment of Quality of Life website, https://www.aqol.com.au/index.php/allfaqs, accessed 1
November 2020.
119 See Carnemolla, P. 2015, Measuring non-shelter effects of housing design, A mixed-methods
exploration of home modifications, care-giving and health-related quality of life, A thesis in fulfilment of
the requirements for the degree of Doctor of Philosophy, University of NSW, Faculty of Built
Environment, pp. 116-119 and 127.
120 See Assessment of Quality of Life website, https://www.aqol.com.au/index.php/allfaqs, accessed
23 December 2020.
121 See for example: Carnemolla, P. and C. Bridge 2016, “Accessible Housing and Health-Related
Quality of Life: Measurements of Wellbeing Outccomes Following Home Modifications”,
International Journal of Architectural Research 10(2), pp.38-51; and Andrich, R., M. Ferrario and
M. Moi 1998, “A model of cost-outcome analysis for assistive technology”, Disability and
Rehabilitation, 20(1), pp.1-24.

www.TheCIE.com.au
94 Proposal to include minimum accessibility standards for housing in the National Construction Code
Together this information suggests that the quality of life impacts of inaccessible housing
could be around $3.77 billion per year.
As discussed above, some of these benefits could potentially overlap with other benefits
estimated separately.
Home modifications
As noted previously, around 16 per cent of people with mobility-related disability reside
in dwellings that have been modified as a result of their condition or age, including
around 25 per cent of people with a profound or severe mobility-related disability.
Although the evidence suggests that home modifications can improve accessibility and lead to
better safety outcomes and fewer care needs (see above), it is not always an optimal outcome.
■ The cost of modifications can be high — of the homes that are modified, the data
available to CIE imply that up to a third require modifications that are relatively
substantial (including full bathroom renovations and/or structural renovations), while two
thirds of homes only require minor modifications like grabrails.122 Homes that are
designed to be consistent with universal design principles, would already have accessible
bathrooms, ramps, wider doorways, etc. This implies that only minor modifications would
be required.
■ Some modifications take time — for the third of homes that require substantial
modifications, these modifications take up to 3 months to complete.123 However, if the
dwelling design incorporated universal design principles, this delay in the modifications
should reduce significantly because only minor modifications are required.
Box 3.30 presents lived experiences of the cost, time and limitations of retrofitting home
modifications.
122 Carnemolla and Bridge (2019) report survey data of 157 individuals (average age 72) who have
had modifications installed in the last 6 months. In the data set, bathroom modifications are
the most significant modifications. There are 55 ‘full bathroom renovations’, which CIE uses to
estimate that around one third of homes require substantial modification, while around two
thirds require only minor modifications.
123 Substantial modifications can involve full bathroom renovations. Internet commentary
suggests bathroom renovations can take up to 7 weeks, including delays (see:
https://www.service.com.au/articles/bathroom/how-long-does-a-bathroom-renovation-take). Bathroom renovations involving modifications for accessibility are likely to be more
complicated than ‘normal’ renovations.

www.TheCIE.com.au
Proposal to include minimum accessibility standards for housing in the National Construction Code 95
3.30 Lived experience – home modification
Potential high retrofitting cost
Our builders estimate that the cost of added accessible features would be about $900
which would include battens for grab bars and the grab bars themselves (the shower
rail is a grab bar as are all towel rails) They also estimate that the cost of retrofitting
these features would be about $19,000.
Source: Lee Jordan Response124
Limitations of home modification
Michelle was just 19 when she had a severe asthma attack that resulted in an
Acquired Brain Injury.
Doctors did not hold much hope for her recovery or her ability to regain the skills she
needed to live independently. When her time in rehab expired, with nowhere else to
go, she was admitted to Residential Aged Care (RAC) where she stayed for 16
months – fighting to retain relearnt capabilities, like walking and talking, and to
maintain her social connections.
However, the determination of Michelle and her parents finally saw her return to the
family home just before her 21st birthday.
Although modifications had been made, everyone had to work around the limitations
of the family home that made wheelchair access difficult, and presented risks for
carers working in cramped spaces.
Source: Michelle’s personal story in Amelia Condi for Summer Foundation Response125
Furthermore, accessibility needs cannot always be met through home modifications.
Related to the high cost of some home modifications, some homes cannot practically be
modified to meet accessibility needs within a reasonable budget.
Australian Housing and Urban Research Institute (AHURI) has published the results of a
survey on whether people thought they would be able to afford future modifications to
make their home accessible/liveable (table 3.31). This survey suggested that only 10 per
cent expected not to be able to afford future modifications. That said, around 35 per cent
were unsure, suggesting an upper bound of around 45 per cent of homes expect not to be
able to afford future home modifications.
In responding to the survey, it is not clear whether respondents were aware of the
government assistance available for home modifications. Furthermore, many
124 Submission by Lee Jordan, accessed 13 November 2020,
https://consultation.abcb.gov.au/engagement/consult-ris-accessible-
housing/consultation/published_select_respondent
125 Submission by Amelia Condi for Summer Foundation, p. 3, accessed 13 November 2020,
https://consultation.abcb.gov.au/engagement/consult-ris-accessible-
housing/consultation/published_select_respondent

www.TheCIE.com.au
96 Proposal to include minimum accessibility standards for housing in the National Construction Code
respondents may not be aware of what making a home accessible entails and therefore
the associated cost.
3.31 Expectations of ability to afford future modifications to make home
accessible/liveable
Expectations Share
Per cent
Expect to be able to afford to fund modifications 54.2
Unsure 35.3
Expect not to be able to afford modifications 10.5
Source: Judd et al 2010 (for AHURI), p.142.
On the other hand, not all home modification costs can be avoided through designing
dwellings that are consistent with universal design principles. Modifications such as the
installation of grab rails, home automation and telemonitoring systems may still be
required for people who acquire disability while living in a dwelling that complies with
LHDG standards.
It is estimated that the weighted-average cost of modifications that could be avoided if
dwelling designs were consistent with universal design principles is around $22 899 per
dwelling (table 3.32). This is based on the estimated cost of retro-fitting accessible design
features in line with requirements for Options 1 (Silver standard) and 2 (Gold standard)
for both Class 1a (separate houses and townhouses) and Class 2 dwellings (apartments)
prepared by quantity surveyors DCWC;126 and information from the SDAC on the types
of modifications that people with disability have made to their homes (see appendix C for
further information). The estimate for Option 1 (Silver) aligns with the estimated
retrofitting cost of $19 400 as reported in Young People In Nursing Homes National
Alliance’s housing policy discussion paper.127
3.32 Weighted average cost of avoided modifications per dwelling
Building type Weighting Cost
Per cent $
Class 1a - Silver level 83.5 18 821
Class 1a - Gold level 12.6 49 706
Class 2 - Silver level 3.0 20 260
Class 2 - Gold level 0.9 36 292
Weighted average 22 899
Source: CIE based on estimates prepared by DCWC, ABS Survey of Disabilities, Ageing and Carers, 2018, TableBuilder (see appendix D
for details).
126 DCWC 2021, NCC Accessible Housing Sundry Cost Advice, , 5 January 2021 and associated
spreadsheets
127 Young People In Nursing Homes National Alliance and Monash University Department of
Architecture 2015, Shaping the Future Today: Transforming Housing Policy for Australians with
Disability, a housing policy discussion paper, Melbourne, p.20

www.TheCIE.com.au
Proposal to include minimum accessibility standards for housing in the National Construction Code 97
Comparing the number of modified dwellings reported in the 2018 and 2015 SDAC (and
adjusting for deaths) suggests that around 22 000 dwellings are modified to meet the
needs of people with disability per year (see appendix D for further details).
■ Based on the above information, it is estimated that the annual cost of home
modifications that could be avoided if dwelling designs were consistent with
universal design principles could be around $500 million (i.e. around 22 000
additional home modifications at a weighted average cost of around $22 899 per
dwelling).
Moving house
Qualitative evidence suggests that accessible housing can be difficult to find, due to a lack
of availability. Moving house may not be an optimal outcome for many.
■ Moving house can be costly and stressful, particularly for older people.
■ Many people may have preferred to stay in their previous residence if it had met their
changing accessibility needs.
■ A lack of accessible housing may have forced some people with a mobility-related
disability (and in many cases their families) to move to a less-preferred location, away
from family, friends, schools and employment opportunities.
Box 3.33 provides the lived experience of an elderly couple who had to move house
multiple times due to accessibility considerations.
3.33 Lived experience – moving home due to inaccessibility
Angie (88 years old) and John (90 years old) are a married couple who exemplify
through their story how housing journeys could be improved if Option 2 of the RIS is
adopted and options for increased accessible housing are available in Australia.
Without such options, Angie and John were forced to relocate homes many times to
try to meet their changing needs over later adulthood, during their married life. With
each relocation, growing financial and emotional stress was encountered and living
environments became more restricted, negatively impacting participation.
Third relocation
Things changed when Angie had a fall and fractured her hip after 6 years of living in
their townhouse, and this led to further medical complications. John wanted to stay in
their house in Mornington, but after Angie’s fall, her care needs increased and Angie
needed a fully accessible home environment with stepless shower and grab rails for
toilet transfers.
Therefore, they moved to a retirement village in the area. At this stage, John was 82
years old and Angie was 80 years old. John and Angie bought a self-contained unit in
the retirement village, which had two bedrooms. In this retirement village, they had
access to a fully accessible home environment with stepless entry point and shower
recess. There was a small patch of garden at the back. The decision to move to the

www.TheCIE.com.au
98 Proposal to include minimum accessibility standards for housing in the National Construction Code
3.33 Lived experience – moving home due to inaccessibility
retirement village was because of the accessible housing offered, the support available
on site and the opportunity in their later years to be offered the option to age in place.
Fourth relocation
After a couple of years, Angie started deteriorating. She was diagnosed with
dementia, was requiring hoist transferring and her equipment and care needs became
too much for John to manage. Angie then moved into the on-site nursing home
approximately four years ago, and John moved into the same facility two months ago.
Every relocation is a stressful event
John and Angie were still quite young and fit when they retired. However, due to both
acute health events as well as aging over time, multiple relocations have had a
significant financial and emotional toll on both them and their family. Each relocation
was stressful in terms of having to make important design decisions, deal with real
estate agents and plan the delivery of support and access to assistive technology
required. Each relocation also involved grieving the loss of a familiar home and
community, with its associated emotional connections.
Source: Associate Professor Libby Callaway for ARATA Submission (p.10-12)128
■ It is estimated that the annual cost of additional moves due to a lack of accessible
housing could range between around $81.5 million and $242.3 million per year.
■ The midpoint of this range – $161.9 million per year – is used as the central case
estimate.
The lower bound estimate is based on the number of people with limited mobility that
moved as a result of their condition or age for reasons directly related to the accessibility
of their previous dwelling (‘safer environment’ or ‘to a dwelling more suitable for
condition’ (top of table 3.34).
■ To estimate the number of additional moves per year as a result of inaccessible
housing:
– people who were reported as having moved more than once as a result of their age
or condition are assumed to have moved on average 2.5 times
– an annual estimate was obtained by dividing the total number of additional moves
by the average length of time since the accident happened or their main condition
occurred, around 16.6 years.
■ The cost of each additional move is estimated at:
– around $28 449 for owner-occupiers, where moving home is likely to involve
selling the previous house and buying a new one, which incurs significant costs
(the estimates include agent’s fees, marketing, conveyancing, auctioneers’ fees and
the cost of removalists).
128 Associated Professor Libby Callaway, op. cit., p.10-12

www.TheCIE.com.au
Proposal to include minimum accessibility standards for housing in the National Construction Code 99
– around $2 500 for renters based on the cost of removalists (renters would avoid the
costs associated with buying and selling a home). 129
The upper bound estimate is based on the same assumption and also includes people
with limited mobility that moved as a result of their condition or age for reasons possibly
related to the accessibility of their previous dwelling (‘due to own age or condition’, ‘to
improve own health’ and ‘to live with family or friends’) (bottom of table 3.34).
3.34 Estimated cost of additional moves due to inaccessible housing
People Number of
additional moves
Cost per move Annual cost
'000 per year $ $ million
Owner occupier - lower bound 2.5 28 449 71.84
Renter- lower bound 3.9 2 500 9.67
Total – lower bound 6.4 81.51
Owner occupier - upper bound 7.7 28 449 218.36
Renter - upper bound 9.6 2 500 23.95
Total – upper bound 17.3 242.31
Source: CIE estimates (see appendix D for further details).
Further details on the basis for these assumptions is provided in appendix E.
This estimate includes only the financial costs associated with moving home. Due to a
lack of available information that would allow quantification, this estimate does not
include:
■ search costs
■ the stress and anxiety associated with moving home
■ the possibility that some people are forced to move to a less preferred address.
Longer stays in hospital or transition care
In addition to potentially increasing hospital admissions (through increased falls), a large
share of the housing stock without accessibility features could increase the length of stays
in hospitals or transition care. In some cases, it is not possible to discharge someone from
hospital unless they are discharged to a safe environment (see box 3.35) for lived
experiences).
129 See for example: https://www.openagent.com.au/blog/how-much-moving-
cost?at=v5&utm_expid=.6ZprDALXQh2rpM05ZARdBA.1&utm_referrer=https%3A%2F%2Fwww.goo
gle.com%2F, accessed 23 January 2020.
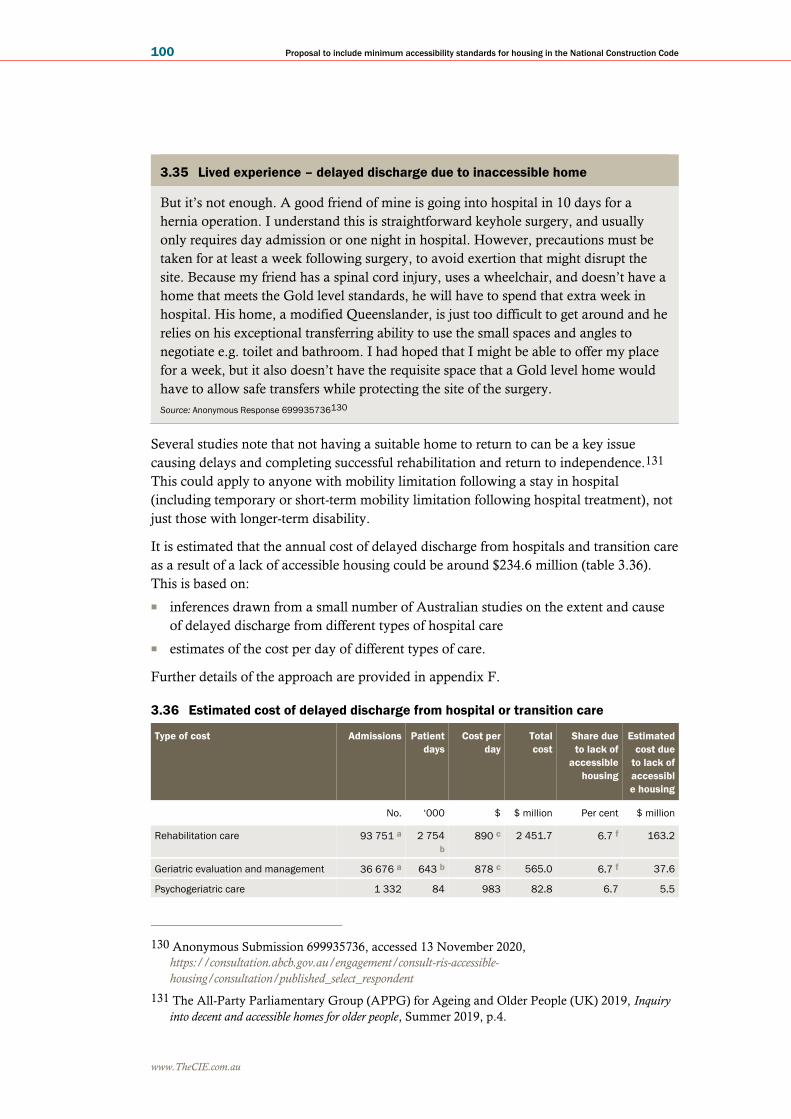
www.TheCIE.com.au
100 Proposal to include minimum accessibility standards for housing in the National Construction Code
3.35 Lived experience – delayed discharge due to inaccessible home
But it’s not enough. A good friend of mine is going into hospital in 10 days for a
hernia operation. I understand this is straightforward keyhole surgery, and usually
only requires day admission or one night in hospital. However, precautions must be
taken for at least a week following surgery, to avoid exertion that might disrupt the
site. Because my friend has a spinal cord injury, uses a wheelchair, and doesn’t have a
home that meets the Gold level standards, he will have to spend that extra week in
hospital. His home, a modified Queenslander, is just too difficult to get around and he
relies on his exceptional transferring ability to use the small spaces and angles to
negotiate e.g. toilet and bathroom. I had hoped that I might be able to offer my place
for a week, but it also doesn’t have the requisite space that a Gold level home would
have to allow safe transfers while protecting the site of the surgery.
Source: Anonymous Response 699935736130
Several studies note that not having a suitable home to return to can be a key issue
causing delays and completing successful rehabilitation and return to independence.131
This could apply to anyone with mobility limitation following a stay in hospital
(including temporary or short-term mobility limitation following hospital treatment), not
just those with longer-term disability.
It is estimated that the annual cost of delayed discharge from hospitals and transition care
as a result of a lack of accessible housing could be around $234.6 million (table 3.36).
This is based on:
■ inferences drawn from a small number of Australian studies on the extent and cause
of delayed discharge from different types of hospital care
■ estimates of the cost per day of different types of care.
Further details of the approach are provided in appendix F.
3.36 Estimated cost of delayed discharge from hospital or transition care
Type of cost Admissions Patient
days
Cost per
day
Total
cost
Share due
to lack of
accessible
housing
Estimated
cost due
to lack of
accessibl
e housing
No. ‘000 $ $ million Per cent $ million
Rehabilitation care 93 751 a 2 754
b
890 c 2 451.7 6.7 f 163.2
Geriatric evaluation and management 36 676 a 643 b 878 c 565.0 6.7 f 37.6
Psychogeriatric care 1 332 84 983 82.8 6.7 5.5
130 Anonymous Submission 699935736, accessed 13 November 2020,
https://consultation.abcb.gov.au/engagement/consult-ris-accessible-
housing/consultation/published_select_respondent
131 The All-Party Parliamentary Group (APPG) for Ageing and Older People (UK) 2019, Inquiry
into decent and accessible homes for older people, Summer 2019, p.4.

www.TheCIE.com.au
Proposal to include minimum accessibility standards for housing in the National Construction Code 101
Type of cost Admissions Patient
days
Cost per
day
Total
cost
Share due
to lack of
accessible
housing
Estimated
cost due
to lack of
accessibl
e housing
No. ‘000 $ $ million Per cent $ million
Maintenance care 28 108 a 553 b 1 055 c 583.2 1.8 g 10.5
Transition care 24 028 d 1 302
d
205 e 266.7 6.7 f 17.8
Total 159 867 5 337 3 949.5 234.6
a AIHW, Australian Hospital Statistics, 2017-18, Table 4.5. b AIHW, Australian Hospital Statistics, 2017-18, Table S4.3. c Centre for
Health Service Development, Development of the National Subacute and Non-acute Patient Classification Version 4, Final Report, April
2015, pp. 39-49. Data was inflated to 2019 dollars using the national CPI. d AIHW Aged Care Data Snapshot. e Calculated as the total
expenditure on Transition Care divided by the number of patient days. f Based on New et. al. (2013). g Based on Salonga-Reyes and
Scott (2017).
Source: Australian Institute of Health and Welfare, Australian Hospital Statistics, 2017-18; Australian Institute of Health and Welfare,
Aged Care Data Snapshot 2018-19; Centre for Health Service Development, Development of the National Subacute and Non-acute
Patient Classification Version 4, Final Report, April 2015; New, P.W. Jolley, D.J. Cameron, P.A. Olver, J.H. and Stoelwinder, J.U. 2013, A
prospective multicenter study to discharge from inpatient rehabilitations, Medical Journal of Australia, 198 (2), pp. 104-108;
Salonga-Reyes, A. Scott, I.A. 2017, Stranded: causes and effects of discharge delays involving non-acute in-patients requiring
maintenance care in a tertiary hospital general medicine service, Australian Health Review, 41, CSIRO Publishing, pp. 54-62; CIE.
Inability to visit family and friends in inaccessible housing
Inaccessible housing does not just affect the people who live in the dwelling, it also
affects the ability of family members and friends with limited mobility to visit.
Around two-thirds of respondents to the MDI survey with low support needs agreed that
they cannot visit friends and relatives whose homes are inaccessible.
■ Around 80 per cent of respondents with high support needs also agreed that they
cannot visit friends and relatives whose homes are inaccessible (table 3.37).
3.37 Inability to visit friends and relatives whose homes are inaccessible
Note: Q: To what extent do you agree or disagree with the statement “I can’t visit friends and relatives whose homes are inaccessible.
Data source: Wiesel, I. Lived experience and social, health and economic impacts of inaccessible housing, prepared for the Melbourne
Disability Institute, University of Melbourne and the Summer Foundation, 18 August 2020, as Appendix 2 of the submission by
Melbourne Disability Institute (MDI) and Summer Foundation. p. 28.
0%
10%
20%
30%
40%
50%
60%
70%
80%
90%
100%
Low support needs High support needs
Pe
r ce
nt
Strongly
disagree
Somewhat
disagree
Neither
agree or
disagree
Somewhat
agree
Strongly
agree

www.TheCIE.com.au
102 Proposal to include minimum accessibility standards for housing in the National Construction Code
Submissions provided extensive qualitative evidence of people with limited mobility
being unable to visit friends and family (box 3.38). In many cases this led to social
exclusion, with flow-on impacts on mental health and general quality of life.
3.38 Lived experience – inability to visit family and friends
■ The submission from the Queensland Disability Network included a personal story
from a member, Wendy.132
– Wendy is a wheelchair user who has limited capacity to visit her family because
their homes do not have the accessibility features to support a visit from a
wheelchair user. She is unable to access the house and is restricted to the garden
and the veranda. She is unable to access the bathroom, limiting the duration of
visits.
– Wendy is also a member of a book club, but has trouble accessing the homes of
many of the members.
■ Another submission reported:133
– being unable to visit newborn nieces and nephews due to difficulties negotiating
stairs.
– missing invites from friends because she is unable to access their homes.
■ Several of the personal stories highlighted in the Summer Foundation and MDI
submission also highlight being unable to visit the homes of family and friends as
an issue.
– ‘Kelly’ was born with spina bifida and has severe scoliosis. She uses a manual
wheelchair as she is unable to stand or walk. Access barriers significantly
restrict her from spending time with family and friends. She is unable to visit
her friends at their inaccessible homes without assistance to be able to move
around and use the toilet.134
– ‘Edna’ has muscular dystrophy, which has progressed to the point where she is
unable to stand and walk. Edna reports not being able to go to her friends’ place
because she could not use the toilet or get in the door.135
132 Submission by Paige Armstrong for Queenslanders with Disability Network, accessed 1
December, https://consultation.abcb.gov.au/engagement/consult-ris-accessible-
housing/consultation/published_select_respondent
133 Anonymous Submission 656157319, accessed 1 December,
https://consultation.abcb.gov.au/engagement/consult-ris-accessible-
housing/consultation/published_select_respondent
134 Wiesel, I. Lived experience and social, health and economic impacts of inaccessible housing, prepared
for the Melbourne Disability Institute, University of Melbourne and the Summer Foundation, 18
August 2020, as Appendix 2 of the submission by Melbourne Disability Institute (MDI) and
Summer Foundation. p.30.
135 Wiesel, I., op. cit., p.35.

www.TheCIE.com.au
Proposal to include minimum accessibility standards for housing in the National Construction Code 103
3.38 Lived experience – inability to visit family and friends
■ Other selected comments in relation to difficulties experienced in visiting friends
and relatives included the following.136
“I’m unable to enter any of the homes of friends or families. The only way I can engage
with my 92 year-old mother is either by phone or by meeting her at a café somewhere”
“Very simple: the only people I can visit are other physically disabled people who live in
accessible homes. This means I can’t visit family and friends who stop inviting me to their
homes (pre COVID) and often ends up in lack of inclusion in most activities outside the
home. If I’m out of sight, I’m out of mind.”
“I cannot visit anyone that is in an inaccessible house. I miss out on being with family and
friends and they meet without me or we all do not get together. My social and family life is
significantly impaired by lack of accessible buildings every day.”
“It has a profound effect on friendships in particular as my family make the effort to see me
despite their homes being inaccessible. I have lost touch with friends due to their houses
being inaccessible — I have had to turn down invitations due to inaccessibility, and the
embarrassment of their houses not being accessible means I do not get invited any more.”
There is a growing body of evidence showing that social isolation and loneliness can
have tangible impacts on both mental and physical health. According to AIHW, social
isolation and loneliness are distinctly different but related concepts.
■ Social isolation is where an individual has minimal contact with others.
■ Loneliness is a subjective state of negative feelings about having a lower level of social
contact than desired.137
According to a 2018 survey by the Australian Psychological Society and Swinburne
University of Technology, around 25 per cent of Australians are lonely.138 Loneliness is
a growing concern globally, because of its reported impact on health and wellbeing.
Various international studies have estimated that loneliness can impose significant
health-related costs on the community. Although social isolation can lead to loneliness,
the AIHW notes that the two concepts do not necessarily co-exist.139
Inaccessible housing may be contributing to social isolation and loneliness among people
with limited mobility by preventing them from participating in family gatherings or other
social occasions. Based on the evidence provided in submissions, access issues at the
homes of family and friends include an inability to access the dwelling or use the toilet
with dignity.
136 Wiesel, I., op. cit., p.28.
137 Australian Institute for Health and Welfare, https://www.aihw.gov.au/reports/australias-
welfare/social-isolation-and-loneliness, accessed 22 January 2020.
138 Australian Psychological Society and Swinburne University of Technology, 2018, Australian
Loneliness Report: A survey exploring the loneliness levels of Australians and the impact on
their health and wellbeing, p.5.
139 Australian Institute for Health and Welfare, https://www.aihw.gov.au/reports/australias-
welfare/social-isolation-and-loneliness, accessed 22 January 2020.

www.TheCIE.com.au
104 Proposal to include minimum accessibility standards for housing in the National Construction Code
■ Based on the limited information available, it is estimated that an additional
85 800 people with limited mobility may be experiencing loneliness as a result of
an inability to visit family and friends due to access issues.
■ Estimates of the health-related costs of loneliness range from around $417 to
around $1 471 per year (with a midpoint of around $944 per year).
■ This suggests the cost to the community of loneliness related to an inability to visit
family and friends due to inaccessible housing could range between $35.73 million
per year and $126.12 million per year, with a midpoint of around $80.93 million
per year.
Details on the approach used to estimate these costs are outlined in appendix G.
Premature or inappropriate entry into residential aged care or other
institutional care
Housing lacking key accessibility features can contribute to premature or inappropriate
entry into residential aged care (also referred to as a nursing home) or other institutional
care. Although residential aged care is an appropriate form of care for many older
Australians (particularly those with high care needs), inappropriate or premature entry
into residential aged care would be a sub-optimal outcome from multiple perspectives.
■ Residential aged care is costly, relative to home-based care.
■ As emphasised in a number of submissions, most Australians would prefer to remain
at home for as long as possible, rather than enter residential aged care140 (i.e. ‘ageing
in place’ — see box 3.39 for details). This is supported by research by the AHURI,
which found that between 78 and 81 per cent of older Australians aged over 55 want
to live in their own home as they age.141
3.39 Ageing in place and inappropriate entry into residential aged care
According to the Australian Housing and Urban Research Institute (AHURI),142
ageing in place means that as people get older they can remain living in their home
rather than entering residential aged care, even when the impacts of old age (e.g. the
increasing risk of illness or disability) affect their mobility and mental ability.
Under AHURI’s definition, the key element of ageing in place is avoiding living in
residential aged care. It does not necessarily mean that older people will continue
living in the same dwelling throughout their retirement.
140 See for example: Submission by Kylie Miskovski for Dementia Australia, submission by
Margret Ward for Australian Network for Universal Housing Design.
141 AHURI Brief, What’s needed to make ‘ageing in place’ work for older Australians, 10
December 2019, https://www.ahuri.edu.au/research/ahuri-briefs/whats-needed-to-make-ageing-in-
place-work-for-older-australians, accessed 13 November 2020.
142 ibid.

www.TheCIE.com.au
Proposal to include minimum accessibility standards for housing in the National Construction Code 105
3.39 Ageing in place and inappropriate entry into residential aged care
Ageing in place requires a degree of independent living ability for the older person
(including both adequate levels of mental and physical ability). However, remaining
in the community has the advantage of giving older people control over their living
space and how they live, as well as ongoing connection to the community that they
are used to.
Evidence from the MDI survey suggests that being forced into a nursing home is a
concern of many people with disability (chart 3.40). A significantly greater proportion of
people living in inaccessible housing are concerned about being forced into a nursing
home, compared with those living in accessible housing. Box 3.41 provides the lived
experience of Michelle’s entry into residential aged care.
3.40 Survey respondents concerned about being forced into residential aged care
Note: Q: How concerned are you about being forced to move to a nursing home because of difficulty getting around your home?
Data source: Wiesel, I. Lived experience and social, health and economic impacts of inaccessible housing, prepared for the Melbourne
Disability Institute, University of Melbourne and the Summer Foundation, 18 August 2020, as Appendix 2 of the submission by
Melbourne Disability Institute (MDI) and Summer Foundation. p.37.
3.41 Lived experience — inappropriate entry into residential aged care
Michelle was just 19 when she had a severe asthma attack that resulted in an
Acquired Brain Injury.
Ann said Michelle had learnt to walk when she was in rehab but had lost the ability in
RAC (Residential Aged Care). “A shorter stay in RAC would have helped Michelle’s
recovery because the main progress she made was when she got home.”
0
10
20
30
40
50
60
70
Low support needs High support needs
Pe
r ce
nt
Accessible home Inaccessible home

www.TheCIE.com.au
106 Proposal to include minimum accessibility standards for housing in the National Construction Code
3.41 Lived experience — inappropriate entry into residential aged care
“Having Michelle home earlier would have had a big impact on her life,” Michelle’s
mother Ann said.
“Sixteen months was wasted on an environment [RAC] that didn’t speak to Michelle.
She should have been in rehab longer and then home. We were always going to bring
her home no matter what, we just didn’t know it would take 2 years.”
Source: Michelle’s personal story in Amelia Condi for Summer Foundation Response143
Recent trends in aged care include the following:
■ All entrants into government-funded aged care places undergo an assessment of the
most appropriate long-term care option before entry into residential aged care.
■ There has been a policy shift towards supporting older Australians to remain at home,
rather than entering residential aged care.
■ This is reflected in a declining share of people over the age of 70 in residential aged
care.
These developments suggest it is becoming less likely that someone would be
inappropriately or prematurely admitted to residential aged care.
Nevertheless, it is estimated that the costs associated with inappropriate or premature
entry into residential aged care could range between around $120 million and
$268 million per year, with a central case estimate of around $185 million per year
(table 3.42). This is based on the following assumptions.
■ Based on SDAC data and modelling of the extent to which various factors affect the
probability of being in residential aged care,144 it is estimated that there may be
between 2 660 and 6 023 additional people in residential aged care due to a lack of
accessible housing, with a central case estimate of 4 140.
■ It is estimated that the additional cost of aged care (relative to remaining in the home)
could be around $33 645 per year.
■ The Royal Commission into Aged Care Quality and Safety recently released a report
suggesting that the average willingness to pay to avoid entering residential aged care
was around $184 per week or around $9 568 per year.145 This is a more direct
measure of the loss of wellbeing associated with inappropriate or premature entry into
residential aged care than the approach used in the Consultation RIS.
143 Amelia Condi, op. cit., p.3
144 See Jukic, M. 2017, Modelling Residential Aged Care in Australia: Entry and Exit, A thesis
submitted for the degree of Doctor of Philosophy of the University of Melbourne.
145 Redcliffe, J., G. Chen, J. Cleland, B. Kaambwa, J. Khadka, C. Hutchison and R. Milte 2020,
Australia’s aged care system: assessing the views and preferences of the general public for quality of care
and future funding: A research study for the Royal Commission into Aged Care Quality and Safety,
Research Paper 6, July 2020, p.3.

www.TheCIE.com.au
Proposal to include minimum accessibility standards for housing in the National Construction Code 107
Details on the approach to estimating these costs are provided in the appendix H.
3.42 Estimate costs of inappropriate or premature entry into aged care
Cost Low estimate Central case High estimate
$ million $ million $ million
Additional resource costs 93.09 143.89 208.55
Loss of individual's welfare 26.47 40.92 59.31
Total cost 119.56 184.81 267.86
Source: CIE estimates (see appendix H for details).
Short-term injuries
Some available evidence suggests that no-step dwelling access and wider spaces, which
are offered by accessible homes, are likely to create benefits for some people with short-
term injuries, for example:
■ Level access is preferred for people with a temporary mobility limitation such as a
broken leg as recommended techniques for walking up stairs are very inconvenient.146
■ The width of the toilet that is required broadly aligns with the width of ambulatory
toilet specifications.147
Personal examples related to temporary injuries from public submissions are presented in
box 3.43.
146 See: https://www.verywellhealth.com/stair-climbing-basics-2696293, accessed October 2020
147 See: https://www.access-board.gov/guidelines-and-standards/buildings-and-sites/about-the-ada-
standards/background/ada-aba-accessibility-guidelines-2004/chapter-six-plumbing-elements-and-
facilities#:~:text=The%20rear%20wall%20grab%20bar,minimum%20on%20the%20other%20side,
accessed October 2020
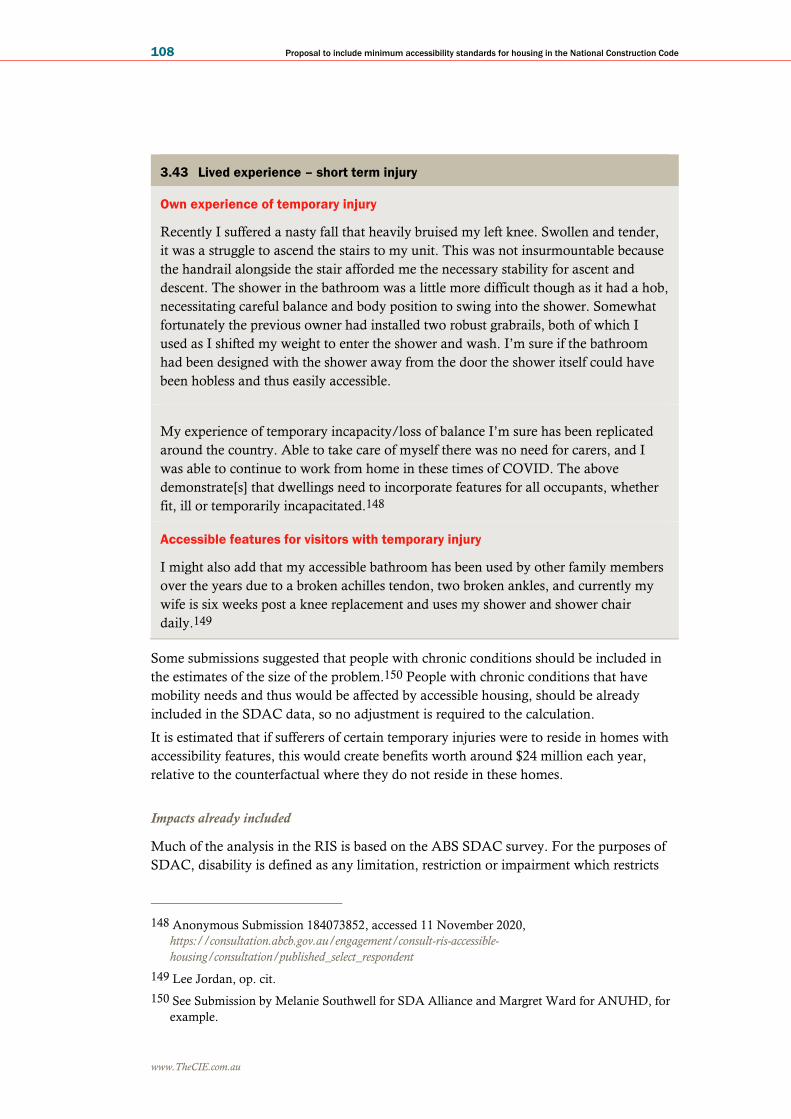
www.TheCIE.com.au
108 Proposal to include minimum accessibility standards for housing in the National Construction Code
3.43 Lived experience – short term injury
Own experience of temporary injury
Recently I suffered a nasty fall that heavily bruised my left knee. Swollen and tender,
it was a struggle to ascend the stairs to my unit. This was not insurmountable because
the handrail alongside the stair afforded me the necessary stability for ascent and
descent. The shower in the bathroom was a little more difficult though as it had a hob,
necessitating careful balance and body position to swing into the shower. Somewhat
fortunately the previous owner had installed two robust grabrails, both of which I
used as I shifted my weight to enter the shower and wash. I’m sure if the bathroom
had been designed with the shower away from the door the shower itself could have
been hobless and thus easily accessible.
My experience of temporary incapacity/loss of balance I’m sure has been replicated
around the country. Able to take care of myself there was no need for carers, and I
was able to continue to work from home in these times of COVID. The above
demonstrate[s] that dwellings need to incorporate features for all occupants, whether
fit, ill or temporarily incapacitated.148
Accessible features for visitors with temporary injury
I might also add that my accessible bathroom has been used by other family members
over the years due to a broken achilles tendon, two broken ankles, and currently my
wife is six weeks post a knee replacement and uses my shower and shower chair
daily.149
Some submissions suggested that people with chronic conditions should be included in
the estimates of the size of the problem.150 People with chronic conditions that have
mobility needs and thus would be affected by accessible housing, should be already
included in the SDAC data, so no adjustment is required to the calculation.
It is estimated that if sufferers of certain temporary injuries were to reside in homes with
accessibility features, this would create benefits worth around $24 million each year,
relative to the counterfactual where they do not reside in these homes.
Impacts already included
Much of the analysis in the RIS is based on the ABS SDAC survey. For the purposes of
SDAC, disability is defined as any limitation, restriction or impairment which restricts
148 Anonymous Submission 184073852, accessed 11 November 2020,
https://consultation.abcb.gov.au/engagement/consult-ris-accessible-
housing/consultation/published_select_respondent
149 Lee Jordan, op. cit.
150 See Submission by Melanie Southwell for SDA Alliance and Margret Ward for ANUHD, for
example.

www.TheCIE.com.au
Proposal to include minimum accessibility standards for housing in the National Construction Code 109
everyday activity and has lasted, or is likely to last, for at least six months.151 As such,
the analysis based on SDAC data:
■ captures temporary disabilities that last (or are likely to last) for more than 6 months
■ does not capture temporary disabilities that last (or are likely to last) for less than
6 months.
Because not all of the analysis is based on SDAC data, the current methodology will
capture some benefits for people with temporary disability. In particular, the estimates of
additional time spent in hospital (longer stays in hospital) should already capture the
impacts on those with disability that last for less than 6 months.
Furthermore, not all of the categories that make up the size of the problem are relevant
for people with disability that last for less than 6 months. For example, it is less likely that
people would move house or make a major home modification for temporary disability.
Therefore, the major benefit for people with short-term injuries would relate to more
independence and convenience (or less inconvenience) during recovery as a result of
accessible housing, which could be measured by a reduction in care needs and loneliness.
Given the short-term nature, other costs such as those associated with moving house and
modifying a home would not be applicable.
Quantifying costs to short-term injury sufferers during their recovery
AIHW provides data on hospitalised injuries by age groups, injury types, body region
injured and causes.152 People with short term injuries to the hip, leg, ankle or foot which
are fractures, dislocations or soft-tissue injuries are most likely to benefit from accessible
housing. It is estimated that there are around 73 043 people with short term injuries
requiring hospitalisation each year (see table 3.44).
3.44 Hospitalisation injuries impacted by inaccessible housing
Cause of injury Injuries to hip, leg, ankle or foot, which are… Total injuries
which may
benefit
Fracture Dislocations Soft-tissue
injuries
Falls (excluding falls already included under
safety benefits)
35 041 1 382 2 829 39 252
Other a 19 986 1 963 11 842 33 791
Total 55 027 3 344 14 672 73 043
151 ABS website,
https://www.abs.gov.au/AUSSTATS/[email protected]/Latestproducts/4430.0Main%20Features52018?opend
ocument&tabname=Summary&prodno=4430.0&issue=2018&num=&view=, accessed 7 September
2020.
152 AIHW 2019, Trends in hospitalised injury, Australia, 2007-08 to 2016-17, Injury Research and
Statistics Series Number 124, https://www.aihw.gov.au/getmedia/6cef34e2-2422-4f11-a9f3-
06e336edac3f/aihw-injcat-204.pdf.aspx?inline=true

www.TheCIE.com.au
110 Proposal to include minimum accessibility standards for housing in the National Construction Code
a Other injuries included are: transport, exposure to inanimate mechanical forces (e.g. a work injury), exposure to animate mechanical
forces (e.g. a dog bite), other unintentional injuries, intentional injuries, assault injuries, undetermined and other injuries. Excluded
injury classes are: accidental drowning, accidental poisoning and thermal injuries, where not enough information is provided to
estimate how many of these are relevant lower body injuries. However, the nature of these excluded injuries suggests that very few of
them would result in injuries to the hip, leg, ankle or foot that are fractures, dislocations and soft-tissue injury.
Note: To estimate falls and other injuries that are injuries to hip, leg, ankle and foot, which are fractures, dislocations or soft-tissue
injuries CIE takes total reported injuries in each category and multiply by ratio of hip, leg, ankle injuries to the total, and then by the
ratio of fracture, dislocation and soft-tissue injuries to the total, respectively.
Source: CIE estimates based on: AIHW 2019, Trends in hospitalised injury, Australia, 2007-08 to 2016-17, Injury Research and
Statistics Series Number 124, https://www.aihw.gov.au/getmedia/6cef34e2-2422-4f11-a9f3-06e336edac3f/aihw-injcat-
204.pdf.aspx?inline=true
According to the SDAC survey, only 24 per cent of people who use crutches, who live in
unmodified homes, require assistance moving around their place of residence. Applying
this percentage, it is estimated that there are 17 551 hospitalisation short-term injuries
each year where the sufferers would benefit from accessible housing.
Further, the benefits created by accessible homes for people with short term injuries will
only last for a finite period. Based on relevant data presented in table 3.45, it is assumed
that sufferers of fractures, dislocations and soft-tissue injuries would realise benefits over
10.5, 6 and 2.5 weeks respectively.
3.45 Time period over which short term injuries impacted by inaccessible housing
Injury Relevant data Final assumption
Fracture ■ NHS discussion: It takes around 6 to 8 weeks for a
minor fracture to heal. For serious ones, such as a
tibia-fibula fracture, it takes about 3 to 6 months
■ Workers Compensation statistics: workers are off
work for 8 weeks on average after a fracture
10.5 weeks (average of 8 weeks and
3 months), or 0.2 years
Dislocation NHS discussion: it takes about 6 weeks to heal from a
dislocated kneecap
6 weeks, or 0.12 years
Soft-tissue injury NHS discussion: it takes 2 to 3 weeks to recover from a
soft-tissue injury
2.5 weeks, or 0.05 years
Source: NHS 2020, Broken leg, https://www.nhs.uk/conditions/broken-
leg/#:~:text=It%20takes%20around%206%20to,weight%20on%20the%20leg%20again; Safe Work Australia 2020, Australian
Workers Compensation Statistics 2017-18, 10 January 2020, https://www.safeworkaustralia.gov.au/doc/australian-workers-
compensation-statistics-2017-18, Table 37, p.48; NHS 2020, Dislocated kneecap, https://www.nhs.uk/conditions/dislocated-
kneecap/#:~:text=A%20dislocated%20kneecap%20is%20a,the%20front%20of%20the%20knee; NHS 2014, Soft tissue injuries
https://www.ouh.nhs.uk/patient-guide/leaflets/files/10879Psofttissue.pdf
As outlined above, the impacts of inaccessible housing on people with short term injuries
during recovery relate to additional informal care hours and inability to visit family and
friends in inaccessible housing. As outlined in appendices C and G, the estimated cost for
additional informal care is $7 129 per year per person and between $417 and $1 471 per
year for inability to visit. These suggest that the annualised cost for short term injury
sufferers is between $7 546 and $8 600 per injury with the midpoint of $8 073 per injury.
Altogether, these assumptions imply that the cost of inaccessible housing for people with
short-term hospitalisation injuries would be between $22.13 million and $25.22 million
per year with the midpoint of $23.67 million per year (table 3.46).

www.TheCIE.com.au
Proposal to include minimum accessibility standards for housing in the National Construction Code 111
3.46 Estimated cost for people with short-term hospitalised injuries due to
inaccessible housing
Fracture Dislocation Soft-tissue
injury
Total
Injuries that impacted (no.) 13 222 804 3 525 17 551
Average impact time period (year) 0.2 0.12 0.05 -
Annualised cost - low ($/person/year) 7 546 7 546 7 546 7 546
Annualised cost - central ($/person/year) 8 073 8 073 8 073 8 073
Annualised cost - high ($/person/year) 8 600 8 600 8 600 8 600
Total cost – low ($m) 20.15 0.70 1.28 22.13
Total cost – central ($m) 21.55 0.75 1.37 23.67
Total cost - high ($m) 22.96 0.80 1.46 25.22
Source: CIE estimates based on: AIHW 2019, Trends in hospitalised injury, Australia, 2007-08 to 2016-17, Injury Research and
Statistics Series Number 124, https://www.aihw.gov.au/getmedia/6cef34e2-2422-4f11-a9f3-06e336edac3f/aihw-injcat-
204.pdf.aspx?inline=true
In additional to hospitalisation, some short term injuries may only require attending
emergency room or non-hospital treatment. These short-term injuries should be included
in the estimate for completeness. However, there is no data available to identify the
number of short term injuries attending emergency rooms or receiving non-hospital
treatment. As a result, the relative cost ratios of emergency room attendance and non-
hospital treatment to the additional cost of hospitalisation as discussed in appendix B are
assumed to be the same on the implicit assumption that accessible housing affects long-
term and short-term injuries in the same proportion although the lengths of impacts are
different.
The additional costs of emergency room attendance and non-hospital treatment are about
10.3 per cent and 8.4 per cent respectively, of the additional cost of hospitalisation for
people with long-term conditions due to inaccessible housing. Applying these ratios
suggests between $2.27 million and $2.59 million of additional costs associated with
emergency room attendance and between $1.86 million and $2.12 million additional
costs associated with non-hospital treatment for people with short-term injuries each year
(table 3.47).
Overall, it is estimated that the total cost for people with short term injuries due to
inaccessible housing is between $26.25 million and $29.92 million each year (table 3.47).
3.47 Estimated cost for people with short term injuries due to inaccessible housing
Injury Cost ratio Low($m) Central ($m) High ($m)
Short-term injuries requiring hospitalisation 1.000 22.13 23.67 25.22
Short-term injuries requiring emergency attendance 0.103 2.27 2.43 2.59
Short-term injuries requiring other non-hospital treatment 0.084 1.86 1.99 2.12
Total ($m) 26.25 28.09 29.92
Source: CIE esimates

www.TheCIE.com.au
112 Proposal to include minimum accessibility standards for housing in the National Construction Code
Families with young dependants
Several submissions to the Consultation RIS suggested including in the analysis benefits
to families with children from accessible housing. Some of these benefits relate to:
■ Families who seek accessibility in order that ageing grandparents (and their peers) can
participate in the lives of their children and contribute in supporting their family (see
box 3.48 for some lived experiences); and
■ Accessible housing may help the movement of prams.
The first type of benefit is included in the benefit associated with visitability (the ability
for a person with mobility needs to visit others) which is discussed separately in the
subsection ‘Inability to visit family and friends in inaccessible housing’ on page 101.
3.48 Lived experience – families with young dependants
Difficulty or inability for family members and relatives to visit
Although we live in the same city, I am virtually a stranger to my niece and nephews.
They have lived in a series of ordinary family homes, moving in response to growing
family needs or nearer to school or work. Never over their lifetimes has there been the
possibility of my bounding in to scoop them up in a hug, share cooking, creating and
homework, bath time or any of the many activities of ordinary daily family life. Why?
Because in all cases their ordinary home has not had the accessibility features to
support a visit from their aunt in a wheelchair and all that entails. Visiting, if it occurs
at all, has been limited to the garden or the veranda, as the only accessible place
where parties and other family gatherings can be held. However, as I’m unable to
enter the house I’m also not able to access the bathroom, limiting visits in time and
spontaneity. The outcome is feelings of awkwardness and isolation.153
I have one child, who is married with a child... to see my granddaughter… far less
often than I wish… causes me great pain and misery, envying friends and neighbours
who spend a lot of time with their grandchildren, and can choose to drop in on them,
offer to babysit, take them out, etc I feel that my later years of life will remain
emotionally barren and both my grandchild and I will miss out on so much.154
On the second type of benefit, it is important to emphasise that the question to consider is
what is the benefit of ‘level access’ against the status quo.155 It is acknowledged that
153 Submission by Wendy Lovelace, accessed 12 November 2020,
https://consultation.abcb.gov.au/engagement/consult-ris-accessible-
housing/consultation/published_select_respondent
154 Professor Bruce Bonyhady and Dr Di Winkler, op. cit, Appendix 2, Table 16, accessed 12
November 2020, https://consultation.abcb.gov.au/engagement/consult-ris-accessible-
housing/consultation/published_select_respondent
155 The scenario to consider is the benefit to a young family of a newly built home under the
proposed changes (which includes level access) vs. the benefit of new a newly built home under
the status quo (which generally includes one-step, according to DCWC Quantity Surveyor
analysis prepared for the Consultation RIS).

www.TheCIE.com.au
Proposal to include minimum accessibility standards for housing in the National Construction Code 113
pushing a pram along a flat surface is more convenient than negotiating a single step.
However, CIE has not found any evidence that suggests this benefit is so material to be
included in the analysis. Available online discussions of parenting groups suggest that
parents are adaptable when it comes to negotiating stairs with prams (including going
backwards),156 which is consistent with the idea that a single step does not pose a
significant barrier to a significant number of new parents.
Therefore, on the basis of a lack of evidence, it is assumed no additional costs imposed
on families with young dependants due to inaccessible housing.
To reflect the small amount of convenience that may be generated by replacing single
step with step free entry, it is assumed that 5 per cent of families with young dependants
may purchase a plastic ramp to overcome the single step difficulty. Such a ramp costs
around $77 each.157 The ramp could be used again when a family use the pram for
another baby. This implies that about 16 000 families may purchase ramps for this
purpose each year, and costing about $1.39 million each year.158 This could be seen as
an upper bound estimate for this component of the size of the problem.
Qualitative assessment
In addition to the above quantifiable costs of the problem associated with inaccessible
housing, some qualitative assessment of unquantifiable (or highly difficult to quantify
and highly uncertain) aspects of the problem are presented.
Social justice, equity and costs to the community
As noted by the (then) Chair of the Royal Commission into the Safety and Quality of
Age Care:
“The hallmark of a civilised society is how it treats its most vulnerable people…”159
Although this quote specifically referred to older Australians, it could equally apply to
younger people with disability.
156 See, for example: https://www.babycenter.com.au/thread/3637820/adding-a-ramp-to-stairs-for-
pram, accessed October 2020
157 See: https://www.safetyxpress.com.au/other-products/ramps/plastic-kerb-
ramp/?gclid=CjwKCAjw_Y_8BRBiEiwA5MCBJrLjTEhIXAwrVDJEt8JP0a453n2NRR2x8nSAqYq5
HlJ8MpdKIsyt9BoCXE4QAvD_BwE,a access October 2020. One ramp costs $38.5. Two are
required for the width of a stroller, costing $77.
158 There were 315 147 registered births in Australia in 2018 and the total fertility rate was 1.74
births per woman for all Australian women, according to ABS
(https://www.abs.gov.au/statistics/people/population/births-australia/latest-release). Assuming
prams are needed for children up to the age of 2 suggests about 630 294 prams are in use each
year. Assuming 5 per cent of families may purchase a ramp and that ramp could be used by
again when having another child, it is estimated that about 18 112 ramps (=630294*5%/1.74)
are purchased each year, costing about $1.39 million (=18,112*$77) each year.
159 Royal Commission into Aged Care Quality and Safety 2019, Interim Report: Neglect, Volume 1,
October 2019, p.20.

www.TheCIE.com.au
114 Proposal to include minimum accessibility standards for housing in the National Construction Code
Dalton and Carter (2020a) discuss social justice as a reason for government intervention,
links this to the principle of solidarity, and points to the need for social justice in housing
in the human rights frameworks.160
Ensuring minimum accessibility standards in the NCC is consistent with Australia’s
human rights obligations, according to QLD Human Rights Commission. Physical
Disability Council of NSW argued that international and domestic reputational gains
should be included as a benefit.
Equity was also mentioned in the public consultation as an important factor to consider,
as demonstrated by the following examples from submissions:
People with injuries or other mobility issues (short-term or long-term) will not have equal
opportunities, principally because they will be confined to institutions of one sort or
another.161
Disabled people are unable to live equal lives to non-disabled people due to the built
environment - this in turn hampers their dignity and ability to perform and secure
employment.162
Equity refers to fair and equal access to housing. A lack of accessible housing means there is an
absence of choice and control for individuals seeking to explore their housing options. The
individual may have to either pay more or have less options regarding where they can live.
There may also be issues with the time it takes for changes to be made to ensure that housing is
suitable relative to others.163
In response to consultation feedback it is recognised that equity, and more broadly,
human rights and social justice, should be discussed from the perspective that people
with disability and older Australians are denied equal opportunity due to inaccessible
housing. Lack of equal opportunity in turn affects their daily life, their employment
opportunity, their independence, dignity and self-esteem. Some of these impacts have
already been quantified, and some will be discussed separately in the following sections.
In the collective sense, there is a cost to the community where people with disability are
unable to secure housing that meets their needs, and thus the community is willing to pay
to avoid this unequal, unjust outcome.
160 Dalton, A. and R. Carter 2020a, Economic advice prepared to assist with responses to the Consultation
Regulation Impact Statement on minimum accessibility standards for housing in the National
Construction Code, prepared for the Melbourne Disability Institute, University of Melbourne and
Summer Foundation, 18 August 2020, as Appendix 1 of the submission by Melbourne
Disability Institute (MDI) and Summer Foundation to the public consultation, section 2.2, p.14
and section 2.3.1, p.15
161 Anonymous Submission 420083325, answer to Question 10, accessible 15 November 2020,
https://consultation.abcb.gov.au/engagement/consult-ris-accessible-
housing/consultation/published_select_respondent
162 Anonymous Submission 249869896, answer to Question 10, accessible 15 November 2020,
https://consultation.abcb.gov.au/engagement/consult-ris-accessible-
housing/consultation/published_select_respondent
163 Anonymous Submission 284174932, answer to Question 10, accessible 15 November 2020,
https://consultation.abcb.gov.au/engagement/consult-ris-accessible-
housing/consultation/published_select_respondent

www.TheCIE.com.au
Proposal to include minimum accessibility standards for housing in the National Construction Code 115
■ It is estimated that the community values these costs at around $389 million per
year.
This estimate is based on the following.
■ A stated preference survey was completed to estimate the community’s WTP for all
Australians with a mobility limitation to have access to housing that meets their
needs. This survey found that the average WTP was around $40 per household per
year (see appendix K for further details).
■ This estimate is applied across around 9.9 million households.
Employment and productivity impacts
There is evidence of poorer employment outcomes for working age (15-64 years) people
with mobility-related disability, relative to the broader economy (chart 3.49).
■ According to 2018 SDAC data, the unemployment rate for people with
mobility-related disability was around 11.3 per cent, more than double the rate in the
broader economy (based on 2018 data). The unemployment rate is the number of
people unemployed (i.e. those who are not employed, but are actively looking for
work) as a proportion of the total labour force (i.e. the total number of people who are
either employed or unemployed).
■ Perhaps more strikingly, the participation rate for people with mobility-related
disability was 42 per cent, compared with 65.6 per cent for the broader economy
(based on 2018 data). The participation rate is the number of people either employed
or actively looking for work (i.e. unemployed) as a proportion of the total number of
people aged 15-64.
Stakeholders also provided evidence that a lack of accessible housing has affected
employment opportunities and productivity at work.
■ Close to one-third of respondents to the MDI survey that formed part of the MDI and
Summer Foundation submission reported that a lack of accessible housing has
resulted in job loss, missed job opportunities, reduced work hours or reduced
productivity at work.164
■ Between 16 and 30 per cent of members of Spinal Life Australia report that a lack of
accessible housing has impacted their employment.165
164 Wiesel, I. Lived experience and social, health and economic impacts of inaccessible housing, prepared
for the Melbourne Disability Institute, University of Melbourne and the Summer Foundation,
18 August 2020, as Appendix 2 of the submission by Melbourne Disability Institute (MDI) and
Summer Foundation. p.21.
165 Submission by John Mayo for Spinal Life Australia, accessed 15 November 2020,
https://consultation.abcb.gov.au/engagement/consult-ris-accessible-
housing/consultation/published_select_respondent

www.TheCIE.com.au
116 Proposal to include minimum accessibility standards for housing in the National Construction Code
3.49 Key labour force indicators
Source: ABS, Labour Force, Australia, Catalogue No. 6202.0; ABS, 2018 Survey of Disabilities, Ageing and Carers, TableBuilder.
Submissions identified several ways that a lack of accessible housing could be leading to
relatively poor employment outcomes among working age people with mobility-related
disability, as well as reducing productivity.166 Some of those lived experiences reported
in submissions are provided in Box 3.50 below. Additional lived experiences are
provided in appendix J.
3.50 Lived experience – potential effects of inaccessible housing on employment
■ A case study from the Summer Foundation and Melbourne Disability Institute —
Jack’s story — provides evidence of housing features restricting the ability to work
from home. Jack lives in a group home that has been purpose built for people with
spinal injuries and is therefore fully accessible. Jack needs a high, adjustable table,
multiple computer screens, a microphone for dictation and adequate space for his
wheelchair to enable him to work from home. As his bedroom is too small, this is
set up in a shared space. Jack worries about the impact on his flatmates and is
looking at options to live on his own. However, he has not been able to find a SDA
home close to his workplace.167
■ Respondents to the Melbourne Disability Institute survey identified a lack of
accessible housing close to employment opportunities as an issue affecting some
people with a disability. Reported comments included the following.168
“I chose a house that was accessible but when work relocated the drive was quite far.
Expensive by taxi but to find another accessible housing precluded a desire to move closer
to work”
166 Amelia Condi, op. cit.
167 Wiesel, I. Lived experience and social, health and economic impacts of inaccessible housing,
Report submitted to the Australian Building Codes Board, University of Melbourne, 31 August
2020, p.25.
168 Wiesel, I., op. cit., p.24.
0
10
20
30
40
50
60
70
Unemployment rate Participation rate
Pe
r ce
nt
People with a mobility limitation
Broader economy

www.TheCIE.com.au
Proposal to include minimum accessibility standards for housing in the National Construction Code 117
3.50 Lived experience – potential effects of inaccessible housing on employment
“Due to a lack of even minimal accessible housing I have to spend all my disposable
income travelling to work in a taxi because no accommodation was closer.”
■ A case study from the Summer Foundation and Melbourne Disability Institute —
Rowena’s story — provides evidence of housing features contributing to fatigue
and limiting her ability to work.169 Rowena suffers from chronic fatigue syndrome
and various features of her home sap her energy and limit her ability to work.
Although submissions provided qualitative evidence that a lack of accessible housing
may reduce employment opportunities and productivity for some working aged people
with limited mobility, the impact of accessible housing appears to be under-researched
and there is little specific quantitative evidence on the potential magnitude of these
impacts. As such, it is not possible to estimate the cost of potential employment and
productivity impacts.
■ Based on examples provided in submissions and other qualitative evidence discussed
in appendix J, people with mobility limitation appeared to face significant challenges
working from home due mostly to limited space. CIE was not convinced that the
NCC proposal would materially address this issue because employment outcomes are
more likely affected by other factors such as personal heterogeneity (education,
experience, age etc).
■ Qualitative evidence from submissions also suggested a lack of accessible housing
close to employment opportunities is another way inaccessible housing reduces
employment. However, the available economic or quantitative evidence suggests that
these impacts are likely to be relatively modest.
■ Finally, qualitative evidence provided in submissions suggests that fatigue and
additional care needs as a result of inaccessible housing features is reducing
productivity for some people with limited mobility. It is not possible to quantify this
impact.
While lack of accessible housing is likely making some contribution to poorer
employment among people with mobility limitation through the mobility constraint, it
should be noted that people looking for work (i.e. the unemployed) make up a relatively
small share of those with mobility-related disability that are not employed (around
7.6 per cent). A much larger share does not participate in the labour market at all.
Although it is not possible to estimate the potential employment and productivity
impacts based on quantitative evidence, as a qualitative assessment, these
employment-related impacts could be quite significant, possibly in the order of several
hundred million dollars per year (see appendix J for further discussion on this issue),
suggesting a similar magnitude to some of the other cost categories.
169 Wiesel, I., op. cit., p.25.

www.TheCIE.com.au
118 Proposal to include minimum accessibility standards for housing in the National Construction Code
Projections of future size of the problem
As noted above, the number of people with a mobility-related disability is expected to
increase over time due to:
■ population growth
■ the ageing population.
The size of the problem is likely to be related to the number of people with
mobility-related disability.
■ The size of the problem in most categories is estimated to grow in proportion to the
total number of people with mobility-related disability. Over the period to 2040, the
average annual growth rate is estimated at around 1.9 per cent per year.
■ However, some aspects of the problem are disproportionately concentrated in older
members of the community. In particular, mostly older people would be affected by
premature entry into aged care. As such, this aspect of the problem is estimated to
grow in proportion to the number of people with limited mobility over the age of 65.
Over the period to 2040, the average annual growth rate is estimated at around 2.6 per
cent per year.
Under these assumptions, it is estimated that the size of the problem could increase to
between around $4.6 billion and $10.2 billion with a central estimate of $6.4 billion over
the next 20 years (chart 3.51). The indicative estimates for qualitative assessment
(community WTP, employment and productivity impacts) are quantified for quantum
only and not included in the projection.
3.51 Size of the problem — projections
Data source: CIE; ABS.
0.0
2.0
4.0
6.0
8.0
10.0
12.0
2018 2020 2022 2024 2026 2028 2030 2032 2034 2036 2038 2040
$ b
illio
n
Low estimate
Central case
High estimate

www.TheCIE.com.au
Proposal to include minimum accessibility standards for housing in the National Construction Code 119
Underlying causes
When operating efficiently, markets generally respond to the needs of consumers. To the
extent that there is currently a shortage of accessible private housing, this implies that the
market response may be falling short of the need. For the RIS, it is important to
understand the underlying cause of the problem (i.e. why is the market not providing
sufficient levels or types of housing with accessibility features?).
Market imperfections
Some factors that potentially contribute to a shortage of accessible housing include the
following.
Separate houses
In principle, the design of new separate houses should reflect the owner’s choice given
their current needs/preferences, budget and associated costs. However, various barriers
to universal design have been identified in the literature, which potentially lead to an
under-supply of accessible housing.
■ The market could potentially under-supply accessible housing where owners/buyers
are not able to foresee (or do not give sufficient thought to) their future accessibility
needs, or possibly the accessibility needs of future residents if accessibility features are
not reflected in market prices (this is referred to as a ‘bounded rationality’ problem).
Some stakeholders suggested that buying a home can be an ‘aspirational’ decision and
nobody aspires to acquiring disability. This is consistent with the lack of education on
universal design identified by Bringolf (2011).
■ Bringolf (2011) also identified the housing delivery chain as a barrier to universal
design. Many houses (particularly in greenfield areas) are built by ‘volume builders’.
Under this business model consumers choose from a set of standard designs.
Incorporating additional accessibility features into a dwelling would involve deviating
from the standard design. Bringolf (2011) provides evidence that it can be difficult to
get volume builders to deviate from a standard design. During consultation, industry
stakeholders advised that some volume builders have included some accessible
designs in the standard offerings, although uptake had been limited.
■ Bringolf (2011) also identifies the rigid application of planning regulations by local
government as a barrier to the uptake of universal design.170 This can create an
environment where builders are reluctant to deviate from designs that have received
approval in the past. In this respect SGS (2019) provide some specific examples of
individual local councils trying to promote accessible housing via planning
regulation.171
170 Bringolf, J. 2011, Barriers to Universal Design in Housing, A thesis submitted for the degree of
Doctor of Philosophy, Urban Research Centre, College of Health and Science, University of
Western Sydney, September 2011, pp.45-47.
171 SGS 2019, Planning Schemes Research, Prepared for ABCB July 2019.

www.TheCIE.com.au
120 Proposal to include minimum accessibility standards for housing in the National Construction Code
During consultation some industry stakeholders noted a growing awareness of
accessibility issues by some consumers, particularly from the age of around 50 onwards.
Unpublished analysis of a COTA NSW survey for the 50+ Report found that the extent to
which accessibility features influenced the choice of current home varied.
■ More than 80 per cent of respondents indicated that easy access kitchen and storage
and easy access bathroom and shower was either important or very important.
■ Around 60 to 70 per cent of respondents indicated that the following features were
either important or very important:
– Minimal steps into home
– Easy access from garage
– Single storey.
■ Around 50 per cent of respondents indicated that wide hallways and doorways were
either an important or very important feature.172
Apartments
Many apartments are sold ‘off the plan’ and therefore developers aim to appeal to the
buyers’ current average demand, rather than the specific needs of an individual buyer.
Consultation feedback suggested that this business model was a barrier to the apartment
market being more responsive to the growing demand for accessible housing.
Renters
Although meeting accessibility needs through home modifications is often a reasonable
option for owner-occupiers, it is not always an achievable option for renters.
Owner-occupiers have full control over the decision to make necessary home
modifications (subject to funding), while renters must obtain agreement from the
landlord.173
The ABCB Consultation Report notes the following issues in relation to private
renters.174
■ Landlords are reluctant to allow property modification even though by law they are
required to allow for reasonable modifications. This is reflected in the SDAC data
showing that a very small proportion of private rentals are modified to meet the needs
of tenants with mobility-related disability.
■ Tenants are often required to pay for the relevant modifications and then pay again to
have them removed when vacating the property. As rental tenancies are often
relatively short, the future benefits associated with these modifications (that may be
172 Bringolf, J. 2015, Let’s Talk About Where You Live, Incomplete draft by Jane Bringolf based on
COTA NSW 2014 survey data for the 50+ Report with a focus on how and when older people
are living, unpublished draft.
173 ABCB 2019, Accessible Housing Options Paper, Consultation Report, April 2019, p.55.
174 ibid, p.55.

www.TheCIE.com.au
Proposal to include minimum accessibility standards for housing in the National Construction Code 121
specific to a particular tenant) may also be short (and uncertain), which acts as a
significant disincentive for both landlords and tenants.
This is reflected in the proportion of people with mobility-related disability living in
modified dwellings. SDAC data shows that the proportion of owners with home
modifications is around double the proportion for all renters (chart 3.52).
3.52 Proportion of people with a mobility impairment with home modifications
Data source: ABS, Survey of Disabilities, Ageing and Carers, 2018, TableBuilder.
The type of landlord is also relevant.
■ The proportion of tenants of state and territory housing authorities with
mobility-related disability in modified dwellings broadly aligns with owner-occupiers.
■ The proportion of people with mobility-related disability living in a modified home
rented from a real estate agent is around 5 per cent, even for people with a profound
mobility-related disability.
This implies that private renters with mobility-related disabilities are less likely to be
living in homes that meet their accessibility needs.
Information failures
There is a lack of reliable information to effectively match buyers and sellers (or landlords
and renters) of accessible properties. In principle, a voluntary certification system could
address this issue; however, the existing certification system appears to have had limited
impact.
■ During consultation, stakeholders noted that when people who require more
accessible housing try to locate it, it is very difficult to judge (without physically
visiting the property) whether it is accessible. This makes the process of searching and
securing accessible housing very costly.
■ It was also noted that when builders wish to build accessible housing, it is very
difficult to get their plans certified in advance of construction, meaning it cannot be
0
5
10
15
20
25
30
35
40
45
Profound Severe Moderate Mild Total
Per
cen
t
Owners
All renters
Landlord is real estate agent
Landlord is state/territory housing authority

www.TheCIE.com.au
122 Proposal to include minimum accessibility standards for housing in the National Construction Code
marketed as ‘accessible’ to buyers before the product is completed. Similarly, sellers of
newly completed or existing homes that are accessible cannot get these homes
certified as accessible. This significantly reduces the incentive for builders to build
accessible housing.
Low incomes
An underlying cause of the problem may be that households containing people with
disability have insufficient income to fund their housing needs. A number of stakeholders
stressed the importance of affordability, as well as accessibility and location. It was also
identified by the public consultation as the top factor causing the problem (table 3.53).
For example, older people may be reliant on a pension, while some people with
mobility-related disability may have limited employment opportunities. Employment
opportunities may also be limited for other members of the household where they have
significant caring duties.
People with disability are more likely to have a lower income. According to SDAC data,
income units (families) containing a member with moderate, severe or profound
disability are concentrated in the lower deciles, with around 78 per cent of income units
below the median equivalised income (chart 3.53).
3.53 Equivalised income distribution
Data source: ABS, Survey of Disabilities, Ageing and Carers, 2018, TableBuilder.
Views from the public consultation
In addition to the two main reasons (‘buyers failing to think about their future
accessibility needs’, and ‘volume builders being reluctant to deviate from standard plans’)
which were incorporated into the public consultation questionnaire, submissions also
pointed out other causes of the problem (table 3.54).
0%
5%
10%
15%
20%
25%
30%
1 2 3 4 5 6 7 8 9 10
Pe
r ce
nt
Equivalised income decile
No members with a disability
1 or more members with a disability

www.TheCIE.com.au
Proposal to include minimum accessibility standards for housing in the National Construction Code 123
3.54 Other factors contributing to the lack of accessible housing
Factors Count Percentage
Additional cost/affordability 37 25.9
No demand/different needs 17 11.9
Other aspiration 10 7.0
Site constraint 5 3.5
Adverse perceptions 3 2.1
Lack of appeal of accessible fixtures 9 6.3
Government inaction 18 12.6
Conflict with other regulations/requirements 3 2.1
Lack of community awareness 10 7.0
Information problem 10 7.0
Industry problem 14 9.8
Limited choice 3 2.1
Social connection 1 0.7
Not sufficiently insured 1 0.7
Stamp duty 1 0.7
Lack of long-term lease security 1 0.7
Total 143 100.0
Source: CIE compilation based on submissions.
It should be noted that some factors raised may be a different expression of the same
factor. For example, ‘no demand/different needs’ may be due to low income and
affordability, or ‘other aspiration’ which in turn appears related to ‘buyers failing to think
about their future accessibility needs’.
For more details, please see appendix A.

www.TheCIE.com.au
124 Proposal to include minimum accessibility standards for housing in the National Construction Code
4 Objectives and options
Objectives
Under the COAG Guidelines, a RIS should clearly articulate the objectives, intended
outcomes, goals or targets of government policy.175
Broader government policy objectives
Accessible housing issues cut across several policy areas, including disability and aged
care policy. In establishing the objectives of the proposed change to the NCC, it is
important to consider the Government’s broader objectives in these policy areas.
Disability policy
The NDS adopts the principles set out in Article 3 of the UNCRPD:
■ respect for inherent dignity, individual autonomy including the freedom to make
one’s own choices, and independence of persons
■ non-discrimination
■ full and effective participation and inclusion in society
■ respect for difference and acceptance of persons with disabilities as part of human
diversity and humanity
■ equality of opportunity
■ accessibility
■ equality between men and women
■ respect for the evolving capacities of children with disabilities and respect for the right
of children with disabilities to preserve their identities.
More specifically, Outcome 1 of the NDS is:
“People with disability live in accessible and well-designed communities with opportunities for
full inclusion in economic, sporting and cultural life.”176
Policy Direction 3 under Outcome 1 refers to:
175 Council of Australian Governments, Best Practice Regulation, A Guide for Ministerial
Councils and National Standard Setting Bodies, p.10.
176 Commonwealth of Australia 2011, National Disability Strategy 2010-2020: An initiative of the
Council of Australian Governments, p.32.

www.TheCIE.com.au
Proposal to include minimum accessibility standards for housing in the National Construction Code 125
“Improved provision of accessible and well designed housing with choice for people with
disability about where they live”.177
Similar themes — including equity and fostering independence — were raised in
submissions to the ABCB’s Options Paper, although the Options Paper Consultation
Report (the consultation report) noted that these objectives were generally not well
defined.
■ According to the Consultation Report, a definition of ‘equity’ can be gleaned from the
existing NCC provisions that address accessibility of public buildings. One of the
objectives of those provisions is to provide people with ‘safe, equitable and dignified’
access to buildings. In that context, the use of the term ‘equitable’ is explained as
follows:
“One of the primary intentions of the [Disability Discrimination Act] is to provide people with
a disability with the same rights as the rest of the community.
The word ‘equitable’ refers to concepts of fairness and equality. It does not mean that all people
must be able to do the same thing in the same way. However, if some people can use a building
for a particular purpose, then most people should be able to use the building for that
purpose.”178
■ Based on the broader body of literature, the ABCB inferred that the objective of
‘fostering independence’ refers to the potential for accessible housing to lead to
increased ability for people (with disability) to minimise their dependence on others to
carry out households tasks.179
Aged care policy
A key focus of aged care reforms over recent years has been to improve support for
people to remain at home for as long as possible.180 This aligns with the preference of
many older Australians, as well as having the potential to reduce the cost of care met by
the Australian Government.
Objectives of the proposed changes to the NCC
The ABCB’s Consultation Report notes that equity and fostering independence can both
be considered relevant objectives.181 That said, there are a range of other policies in place
that are already intended to address these objectives directly.
177 ibid, p.32.
178 ABCB 2019, Accessible Housing Options Paper, Consultation Report, April 2019, p.24.
179 ABCB 2019, op.cit., pp.24-25.
180 ABCB 2019, op.cit., p.20.
181 ABCB 2019, op.cit., p.25.

www.TheCIE.com.au
126 Proposal to include minimum accessibility standards for housing in the National Construction Code
During consultation some stakeholders suggested that the objective is to ‘mainstream’
universal design principles. This suggestion is not in keeping with the COAG RIS
Guidelines which state the objectives should not pre-justify a preferred solution.182
In recognition that the proposal is based on universal design principles (that aim to meet
the needs of the largest number of people), rather than the specific needs of people with
disability, CIE proposes an objective that applies more generally to the broader
community, but is also specifically related to dwellings as follows.
■ To ensure that new housing is designed to meet the needs of the community,
including older Australians and others with mobility limitations.
Options
The COAG Guidelines require that a RIS identifies a range of viable options including,
as appropriate, non-regulatory, self-regulatory and co-regulatory options.183 Six options
have been considered in this RIS and are discussed below.
Options to include accessible housing standards in the NCC
The proposed changes to the NCC are broadly based on the LHDG produced by Livable
Housing Australia.
■ Option 1 is based on the silver standard
■ Option 2 is based on the gold standard
■ Option 3 is based on the gold standard, with some additional features from the
platinum standard.
The proposed standards are summarised in table 4.1. These options are based on
universal design principles, focusing mostly on design improvements that have broad
benefits across many future residents (including future residents without a
mobility-related disability), rather than design features specific to those with a
mobility-related disability.
The options apply to all Class 1a (houses) and Class 2 (apartments) dwellings subject to
some exemptions (discussed below).
182 Council of Australian Governments, Best Practice Regulation, A Guide for Ministerial
Councils and National Standard Setting Bodies, p.10.
183 Council of Australian Governments 2007, Best Practice Regulation: A Guide for Ministerial
Councils and National Standard Setting Bodies, October 2007, p.10.

www.TheCIE.com.au
Proposal to include minimum accessibility standards for housing in the National Construction Code 127
4.1 Key requirements to be added to NCC under different stringency under
consideration
Required element Option 1 Option 2 or Option 3
Dwelling access
and entry
■ Step-free dwelling access (via
garage or external path)
■ 1000mm wide access path
■ Landing area of 1200mm by
1200mm for front door
■ 820mm clear opening front
door
■ Maximum front door
threshold: 56mm
■ Carpark: 3200mm by
5400mm (see Note)
■ Step-free dwelling access (via garage or external
path)
■ 1100mm wide access path
■ Landing area of 1350mm by 1350mm for front door
■ 850mm clear opening front door
■ Maximum front door threshold: 56mm
■ Carpark: 3200mm by 5400mm (if parking space
provided) (see Note below the table)
■ Vertical clearance above the parking space:
2500mm
Internal doors and
corridors
■ 820mm clear opening doors
■ 1000mm clear width
corridors
■ 5mm threshold
■ 850mm clear opening doors
■ 1200mm clear width corridors
■ 5mm threshold
Toilet ■ Toilet on ground floor/level of
entry
■ 1200mm between front edge
of toilet and arc of door
■ 900mm between side walls
of toilet
■ In bathroom, toilet installed in
the corner
■ Toilet on ground floor/level of entry
■ 1200mm between front edge of toilet and arc of
door
■ 1200mm between side walls of toilet
■ In bathroom, toilet installed in the corner
Shower ■ Removable shower screen
■ 5mm transition for entry
■ Removable shower screen
■ 5mm transition for entry
■ Shower on ground floor/level of entry
■ 900mm by 900mm shower space
■ 1200mm by 1200mm adjacent space
Reinforce walls for
bathroom
Two scenarios:
■ Reinforced walls so rails can
be installed in one position
only; or
■ Reinforced walls so that rails
and other fixtures can be
installed in any location
Same as Option 1
Internal stairs No requirement ■ Straight flights with landing
■ No winders in lieu of landing
■ Adjoin wall that supports hand rail
Kitchen No requirement ■ 1200mm clearance from benches (Option 2)
■ 1500mm clearance from benches (Option 3)
Laundry No requirement ■ 1200mm clearance from benches (Option 2)
■ 1500mm clearance from benches (Option 3)
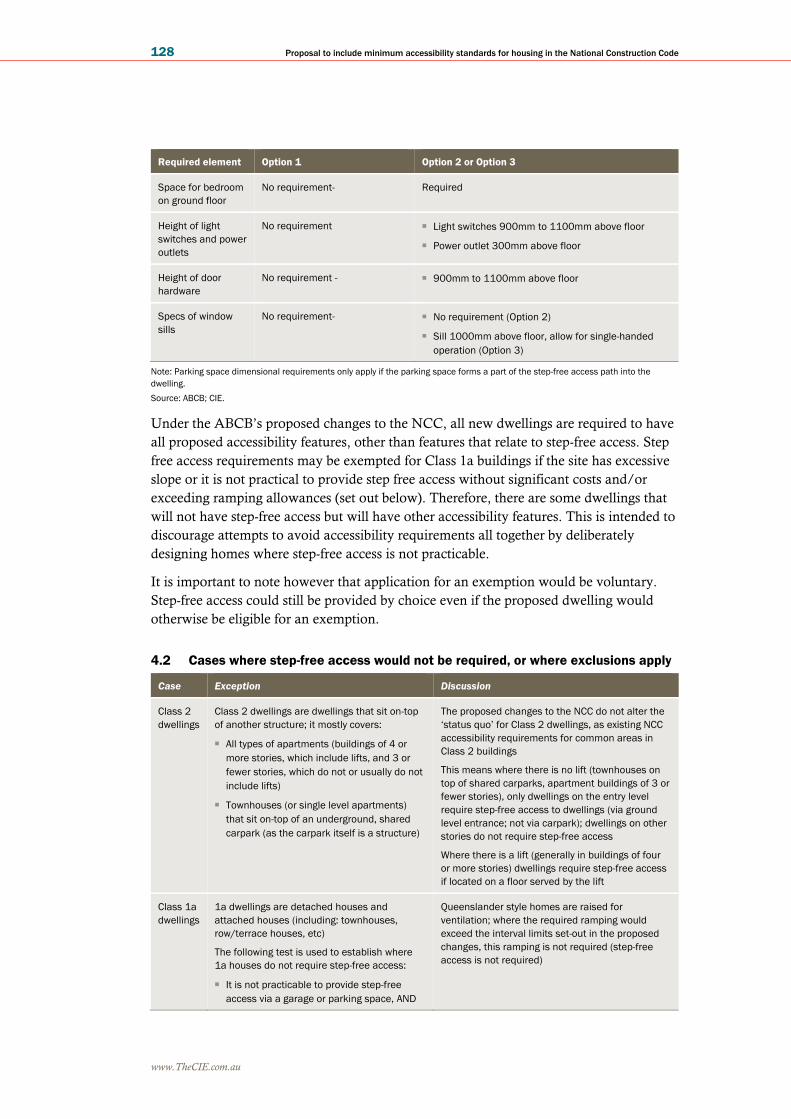
www.TheCIE.com.au
128 Proposal to include minimum accessibility standards for housing in the National Construction Code
Required element Option 1 Option 2 or Option 3
Space for bedroom
on ground floor
No requirement- Required
Height of light
switches and power
outlets
No requirement ■ Light switches 900mm to 1100mm above floor
■ Power outlet 300mm above floor
Height of door
hardware
No requirement - ■ 900mm to 1100mm above floor
Specs of window
sills
No requirement- ■ No requirement (Option 2)
■ Sill 1000mm above floor, allow for single-handed
operation (Option 3)
Note: Parking space dimensional requirements only apply if the parking space forms a part of the step-free access path into the
dwelling.
Source: ABCB; CIE.
Under the ABCB’s proposed changes to the NCC, all new dwellings are required to have
all proposed accessibility features, other than features that relate to step-free access. Step
free access requirements may be exempted for Class 1a buildings if the site has excessive
slope or it is not practical to provide step free access without significant costs and/or
exceeding ramping allowances (set out below). Therefore, there are some dwellings that
will not have step-free access but will have other accessibility features. This is intended to
discourage attempts to avoid accessibility requirements all together by deliberately
designing homes where step-free access is not practicable.
It is important to note however that application for an exemption would be voluntary.
Step-free access could still be provided by choice even if the proposed dwelling would
otherwise be eligible for an exemption.
4.2 Cases where step-free access would not be required, or where exclusions apply
Case Exception Discussion
Class 2
dwellings
Class 2 dwellings are dwellings that sit on-top
of another structure; it mostly covers:
■ All types of apartments (buildings of 4 or
more stories, which include lifts, and 3 or
fewer stories, which do not or usually do not
include lifts)
■ Townhouses (or single level apartments)
that sit on-top of an underground, shared
carpark (as the carpark itself is a structure)
The proposed changes to the NCC do not alter the
‘status quo’ for Class 2 dwellings, as existing NCC
accessibility requirements for common areas in
Class 2 buildings
This means where there is no lift (townhouses on
top of shared carparks, apartment buildings of 3 or
fewer stories), only dwellings on the entry level
require step-free access to dwellings (via ground
level entrance; not via carpark); dwellings on other
stories do not require step-free access
Where there is a lift (generally in buildings of four
or more stories) dwellings require step-free access
if located on a floor served by the lift
Class 1a
dwellings
1a dwellings are detached houses and
attached houses (including: townhouses,
row/terrace houses, etc)
The following test is used to establish where
1a houses do not require step-free access:
■ It is not practicable to provide step-free
access via a garage or parking space, AND
Queenslander style homes are raised for
ventilation; where the required ramping would
exceed the interval limits set-out in the proposed
changes, this ramping is not required (step-free
access is not required)

www.TheCIE.com.au
Proposal to include minimum accessibility standards for housing in the National Construction Code 129
Case Exception Discussion
■ One of the following is true:
– (i) to provide an external step free access
path would necessitate construction of
ramping that exceeds the length and
gradient allowed
– (ii) there is insufficient space available on
the site to accommodate
– (iii) the ground on which the step free
access would be located has a gradient
exceeding 1;14.
For ‘smaller blocks’ (usually inner-city) where
dwelling access is via a step that is right on the
edge of the lot (required by planning authorities),
ramping is not practicable as there is insufficient
space and is therefore not required (step free
access is not required)
Where the ground floor of a dwelling is a garage,
step-free access to the rest of the dwelling is not
required
Source: CIE.
Other options
As identified above, there are a range of existing programs that seek to address aspects of
the problem. To the extent that existing measures do not fully address the issues, it is
possible that expanding some existing programs could reduce the extent of the problem.
A key question raised by industry stakeholders during targeted consultations is that,
noting the range of existing programs, is there a need to apply accessibility standards to
all new dwellings.
Other options through the NCC
As the NCC applies to all new buildings, there is limited scope to impose accessibility
standards on only a proportion of new dwellings through the NCC. The proposed
options currently include some exemptions; however, these generally apply where it is
either not possible or impractical to apply all of the accessible design elements.
Alternative policy options for addressing the problem, include applying accessibility
standards to either:
■ Class 1a dwellings only, or
■ Class 2 dwellings only.
Planning requirements
Some states increase the supply of accessible dwellings through mandated planning
requirements or incentives through the planning system.
■ Mandated requirements generally apply to a proportion of dwellings and as such, can
only be applied to multi-dwelling developments.
– One potential advantage of this planning approach (compared with the NCC) is
that applying accessibility requirements to a proportion of dwellings can reduce
compliance costs (as not all dwellings would need to comply).
– On the downside, this approach will be less effective in increasing the stock of
accessible dwellings.
– Variations across Local Government Agencies (LGAs) can also increase costs for
builders and designers.

www.TheCIE.com.au
130 Proposal to include minimum accessibility standards for housing in the National Construction Code
■ Other incentives through the planning system could include:
– exemptions from infrastructure charges
– preferential approval pathways
– density bonuses (or similar).
Unlike the NCC, planning requirements vary across states and in some cases LGAs.
Planning frameworks vary significantly across states, making national consistency
difficult to achieve. For example, in some states accessibility requirements for
multi-dwelling developments are applied through apartment design guidelines. However,
not all states have apartment design guidelines.
There is currently no mechanism to apply nationally consistent planning requirements.
Implementing this approach would require state and territory governments to reach
agreement and apply the agreed nationally consistent requirements through each state or
territory’s planning framework.
Social housing
One approach to improving the availability of accessible housing for people with a
mobility-related disability is through expanding accessible social housing.
■ A key advantage of this approach is that it may be more targeted to addressing the
problem as state and territory housing authorities could ensure that new accessible
housing is allocated to people with a mobility impairment.
■ However, increased provision of accessible social housing would address only one
aspect of the problem — the lack of accessible rental properties for those who are
eligible for social housing.
Direct subsidies
During ABCB’s consultations, some stakeholders expressed a preference for direct
subsidies to build accessible dwellings. Presumably, this approach would involve either
the Commonwealth or state governments funding developers or individuals to build
dwellings that meet a specified accessibility standard.
While regulatory options would generally apply to all new buildings (unless specifically
exempt), subsidies can have the advantage of being a more targeted approach to
achieving the objectives. In particular, a subsidy program can potentially ensure that
accessible dwellings are allocated to households with accessibility needs through an
administrative process.
Providing subsidies to owner-occupiers would not make additional accessible housing
available to households with accessibility needs in the short-term. Owner-occupiers with
current accessibility needs would have incorporated accessible design features into the
housing design already – without the subsidy. Consequently, additional accessible
housing would not become available to those with accessibility needs, unless offered for
rent, or until the original owner moved out (or a household member acquires a
disability). For these reasons, subsidising owner-occupiers to incorporate universal design

www.TheCIE.com.au
Proposal to include minimum accessibility standards for housing in the National Construction Code 131
principles into their dwelling design would not be a targeted approach to achieving the
objectives.
Given the different barriers to the uptake of universal design principles for apartments,
there is more logic in subsidising developers to build accessible apartments; however,
there does not appear to be an effective mechanism to ensure that these apartments are
actually occupied by people with accessibility needs over the longer-term.
The most targeted approach would be to provide a subsidy to landlords that provide
rental accommodation to households with specific accessibility needs. This is similar to
the approach used for SDA, although presumably these subsidies would apply to some
households that are not eligible for SDA (SDA is an insurance scheme that has stringent
eligibility requirements).
■ This approach would be specifically targeted to addressing the issue associated with a
lack of accessible private rental properties.
■ As there are already policies in place to support low-income households with
accessibility needs (i.e. social housing) and households with care needs (i.e. SDA),
this subsidy could be targeted at ensuring accessible rental stock is available, implying
that rents could be charged at rates reflecting rents charged for similar properties
(which may not have relevant accessibility features). That is, the subsidy would be
designed to stimulate the market for accessible rental properties and would only cover
the additional cost of the relevant accessibility features.
■ A subsidy on accessible rental properties is a way of providing assistance to renters
that may be unable to access the subsidies on home modifications provided to
owner-occupiers.
Enhanced voluntary guidance
During the targeted consultations, some stakeholders suggested that options for
encouraging voluntary uptake of accessible housing designs could be further explored
and that the availability of agreed standards could be enhanced if more resources were
available to:
■ promote the LHDG to both:
– builders/developers, and
– potential buyers
■ promote the existing LHA voluntary certification scheme.
Voluntary certification schemes can help markets to operate more efficiently through the
provision of reliable information.
■ Certification provides independent verification to buyers that a product meets a
particular standard.
■ Suppliers can use voluntary certification to demonstrate that their product meets the
standard. This can help them market their product and can have commercial benefits
(particularly where buyers are willing to pay more for a product that meets the
standard).

www.TheCIE.com.au
132 Proposal to include minimum accessibility standards for housing in the National Construction Code
In principle, a voluntary certification scheme for accessible houses could encourage
additional uptake of LHA-compliant designs.
■ Buyers and renters may be willing to willing to pay more for certified dwellings if they
are more confident that it will meet their current or future accessibility needs.
■ Home builders/investors would therefore have more incentive to invest in accessible
design features if there are future financial benefits (through either a higher future sale
price, higher rents or lower vacancy rates).
However, as highlighted in submissions, the current LHA voluntary certification scheme
does not appear to have been effective in encouraging a significant increase in accessible
dwellings.184 Previous analysis by ANUHD and RI Australia estimated that less than
5 per cent of new dwellings are built to the LHDG standard,185 although industry
stakeholders have argued that not all compliant dwellings are certified to the standard.
An enhanced voluntary option to improve the effectiveness of the current voluntary
certification scheme could include the following elements.
■ A voluntary ABCB handbook —stakeholders suggested that this would raise the
profile of accessible housing and encourage uptake. If a voluntary ABCB handbook
was developed, any state or local government requirement could refer to the voluntary
standard, perhaps improving the consistency of the standards applied across
jurisdictions.
■ Information provision at the point of sale — more information on the benefits of
accessible housing could be provided at the point of sale to encourage more demand
for accessible housing.
■ Better matching services — although there are some services available, matching
buyers/sellers nevertheless has been identified as a problem. Options to improve these
services could include the following.
– Developing a specialised web-based search facility.
– Working with mainstream websites (such as realestate.com or domain) to enable
people to search for certified accessible dwellings. This would also help to
encourage better awareness and greater uptake of the certification scheme.
The ABCB would have responsibility for publishing a voluntary handbook; however, the
other elements of this option are outside of the ABCB’s responsibility.
Summary of options to be considered
A range of options have been developed based on those proposed through stakeholder
consultation, including some not within the ABCB’s broad area of responsibility (e.g.
Option 5 and the information provision and matching aspects of Option 6) and non-
184 For example, Margret Ward, op.cit., p.15, p.25, p.48
185 ANUHD and RI Australia 2015, Report on the progress of the National Dialogue on Universal
Housing Design 2010-14, p.13,
https://aduhdblog.files.wordpress.com/2016/08/nduhd_report_jan15.pdf

www.TheCIE.com.au
Proposal to include minimum accessibility standards for housing in the National Construction Code 133
regulatory alternatives as required under best practice guidelines. The RIS explicitly
considers the impacts of the following options.
■ Status quo: The status quo is used as the baseline against which the impacts of all
other options are assessed.
■ Regulatory options: The regulatory options (involving changes to the NCC) include
the following.
– Option 1: Accessibility standard, broadly reflecting LHDG silver standard, in the
NCC applying to all new Class 1a and Class 2 buildings.
– Option 2: Accessibility standard, broadly reflecting LHDG gold standard, in the
NCC applying to all new Class 1a and Class 2 buildings.
– Option 3: Accessibility standard, broadly reflecting LHDG gold standard (plus
some platinum features), in the NCC applying to all new Class 1a and Class 2
buildings.
– Option 4: Accessibility standard, broadly reflecting LHDG gold standard, in the
NCC applying to all new Class 2 buildings.
■ Non-regulatory options: These options are largely outside of the ABCB’s
responsibility and are not therefore the primary focus of the RIS. However, they have
been considered to comply with the requirements set out in the COAG RIS
Guidelines to establish whether a change to the NCC is the most efficient approach to
addressing the problems associated with a lack of accessible housing.
– Option 5: A generalised subsidy program to encourage additional availability of
accessible rental properties to LHDG Gold standard.
– Option 6: An enhanced approach to voluntary guidance, including:
… a non-regulatory ABCB handbook
… information provision at the point of sale
… better matching services.
Options 1-5 are included in the CBA. Option 6 is discussed qualitatively, without
quantifying the costs and benefits.
Stakeholder feedback on options
Feasible options
During public consultation, the consultation questionnaire asked a specific question
about the feasibility of the options. Among the 98 responses to the question, 83
respondents provided answers to that question (Question 15). Most respondents (63 out
of 83) suggested more than one feasible option (chart 4.3).
These figures should be considered with caution as more than half of respondents did not
provide an answer to this question and, some 15 respondents did not include their
preferred option (for Question 19 discussed below) as one of the feasible options in
answering this question.

www.TheCIE.com.au
134 Proposal to include minimum accessibility standards for housing in the National Construction Code
4.3 Responses by number of feasible options
Note: answers to Question 15
Data source: Consultation Hub
As shown in chart 4.4, Option 5 has the highest count – 46 respondents indicated it is
feasible. It is followed by Option 6 (42 counts), Option 1 (36 counts), and Option 3 (30
counts).
4.4 Feasible option counts
Note: Answers to Question 15.
Data source: Consultation Hub.
Some respondents believe that applying the accessibility standards to a part of the
buildings or adopting a different combination or a subset of LHDG elements in the NCC
are feasible (chart 4.5).
0
5
10
15
20
25
30
1 2 3 4 5 6 7
Co
un
t
0
5
10
15
20
25
30
35
40
45
50
Status quo Option 1 Option 2 Option 3 Option 4 Option 5 Option 6
Co
un
t
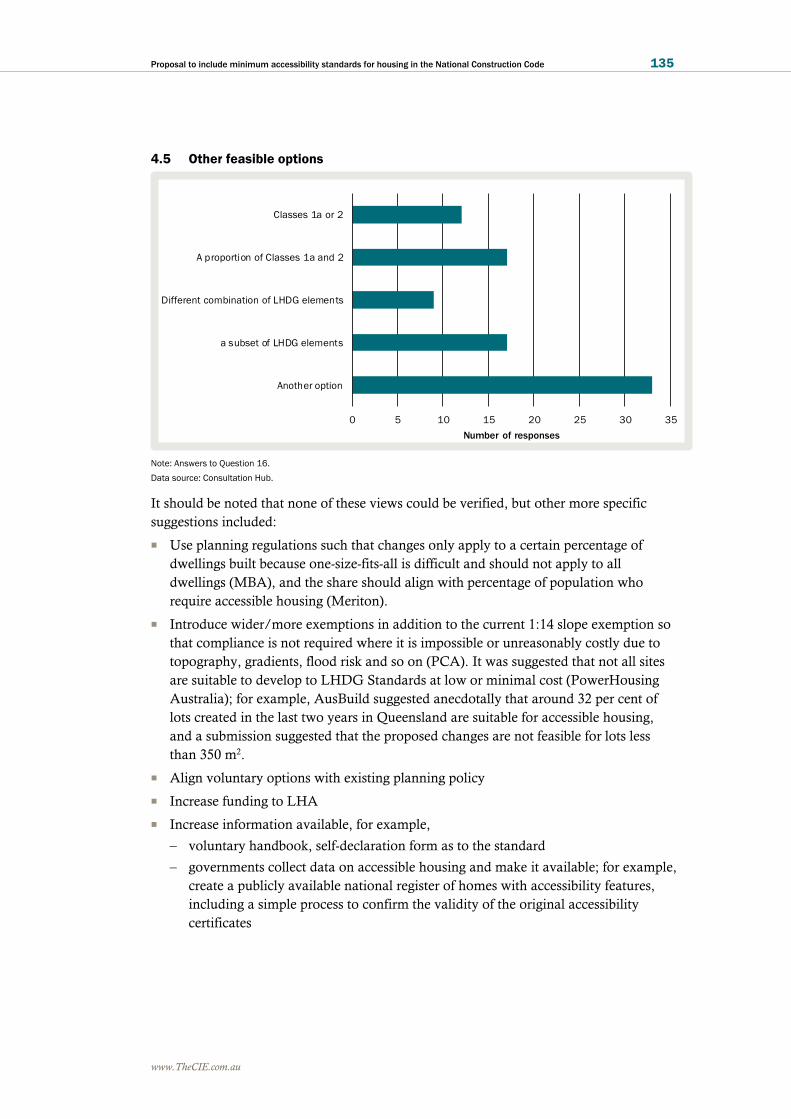
www.TheCIE.com.au
Proposal to include minimum accessibility standards for housing in the National Construction Code 135
4.5 Other feasible options
Note: Answers to Question 16.
Data source: Consultation Hub.
It should be noted that none of these views could be verified, but other more specific
suggestions included:
■ Use planning regulations such that changes only apply to a certain percentage of
dwellings built because one-size-fits-all is difficult and should not apply to all
dwellings (MBA), and the share should align with percentage of population who
require accessible housing (Meriton).
■ Introduce wider/more exemptions in addition to the current 1:14 slope exemption so
that compliance is not required where it is impossible or unreasonably costly due to
topography, gradients, flood risk and so on (PCA). It was suggested that not all sites
are suitable to develop to LHDG Standards at low or minimal cost (PowerHousing
Australia); for example, AusBuild suggested anecdotally that around 32 per cent of
lots created in the last two years in Queensland are suitable for accessible housing,
and a submission suggested that the proposed changes are not feasible for lots less
than 350 m2.
■ Align voluntary options with existing planning policy
■ Increase funding to LHA
■ Increase information available, for example,
– voluntary handbook, self-declaration form as to the standard
– governments collect data on accessible housing and make it available; for example,
create a publicly available national register of homes with accessibility features,
including a simple process to confirm the validity of the original accessibility
certificates
0 5 10 15 20 25 30 35
Classes 1a or 2
A proportion of Classes 1a and 2
Different combination of LHDG elements
a subset of LHDG elements
Another option
Number of responses

www.TheCIE.com.au
136 Proposal to include minimum accessibility standards for housing in the National Construction Code
■ Add a matching service to achieve the benefits – as put by one stakeholder, SDA is
successful because it is generously funded and has a matching program 186
■ Provide incentives for developers, builders and purchasers
■ Accreditation program for accessible builders
■ Lowering transfer duties because the duties lead to low take-up of accessibility
features by mobility impaired households
■ Light-weight, cheap removable threshold ramps are an alternative
■ Proposed changes should be expanded to help vision impaired people and mentally
impaired people; for example, better insulation in Class 2 units to cut down noise
transfer which can be stressful
Options to meet the objective
Consultation questionnaire Question 17 asked which option can meet the objective.
Eighty submissions provided answers to this question through the Consultation Hub.
Chart 4.6 compares the answers to the question about feasible options.
It can be seen from chart 4.6 that the number of respondents thinking one option has the
ability to meet the objective is slightly less than the number of respondents who thought
they were feasible regulatory options (Options 1 to 4), while the gap is wider for the non-
regulatory options (Options 5 and 6).
It is interesting to note that more respondents thought that the Silver standard (Option 1)
could meet the objective than the Gold (Option 2) and Gold Plus (Option 3), although
the difference is not big.
A similar number of respondents indicated they believed that an enhanced approach to
voluntary guidance (Option 6) and the Gold Plus (Option 3) can meet the objective.
186 Submission by Jane Bringolf for Centre for Universal Design Australia, answer to Question 8,
accessed 24 December 2020, https://consultation.abcb.gov.au/engagement/consult-ris-accessible-
housing/consultation/published_select_respondent

www.TheCIE.com.au
Proposal to include minimum accessibility standards for housing in the National Construction Code 137
4.6 Feasible options versus options meeting the objective
Note: Structured answers to Questions 15 and 17.
Data source: Consultation Hub.
Preferred option
Chart 4.7 reports the count of preferred options from the 98 Consultation Hub responses.
42 respondents prefer a regulatory option with 11 preferring Option 2 (Gold), while 30
respondents prefer a non-regulatory option, and 13 prefer other options.
118 respondents did not answer the question including those submitting their responses
separately rather than through the Consultation Hub. By analysing stakeholder feedback
outside the Consultation Hub, a further 82 respondents with preferred options were
identified. Chart 4.8 reports the simple count of preferred options from both the
Consultation Hub submissions and those responding outside that mechanism. The total
count in the chart is more than the total number of responses as many submissions
outside the Consultation Hub process provided multiple preferred options. The chart
shows that Options 2 and 6 are the most preferred options – 55 and 50 counts
respectively.
0
5
10
15
20
25
30
35
40
45
50
Status quo Option 1 Option 2 Option 3 Option 4 Option 5 Option 6 Other option
Co
un
t
Feasible options Meeting objectives

www.TheCIE.com.au
138 Proposal to include minimum accessibility standards for housing in the National Construction Code
4.7 Preferred option identified through Consultation Hub questionnaire
Note: Structured answer to Question 19 through the Consultation Hub.
Data source: Consultation Hub.
4.8 Preferred option in all submissions including multiple choices
Note: Structured answer to Question 19 through the Consultation Hub.
Data source: Consultation Hub.
To resolve the multiple choices provided by submissions outside the Consultation Hub,
the approach to interpreting stakeholder preferences was to allocate the more stringent of
regulatory options (where a regulatory option was present) and least stringent of options
where it was not. With this interpretation, chart 4.9 reports preferred option counts in all
responses identifiable, where each response is allocated only one choice. 93 respondents
prefer a regulatory option with 54 preferring Option 2, while 58 respondents prefer non-
regulatory options with 49 preferring Option 6. There are 16 respondents who prefer
other options.
0
5
10
15
20
25
Status quo Option 1 Option 2 Option 3 Option 4 Option 5 Option 6 Other
option
Not
Answered
Nu
mb
er
of
su
bm
issio
ns
0
10
20
30
40
50
60
Status quo Option 1 Option 2 Option 3 Option 4 Option 5 Option 6 Other option
Nu
mb
er
of
su
bm
issio
ns

www.TheCIE.com.au
Proposal to include minimum accessibility standards for housing in the National Construction Code 139
4.9 Preferred options in all responses
Note: Answer to Question 19 through the Consultation Hub and other submissions.
Data source: CIE based on Consultation Hub.
0
10
20
30
40
50
60
Status quo Option 1 Option 2 Option 3 Option 4 Option 5 Option 6 Other option
Nu
mb
er
of
su
bm
issio
ns

www.TheCIE.com.au
140 Proposal to include minimum accessibility standards for housing in the National Construction Code
5 Impacts
This chapter identifies the impacts of the proposed options and sets out the CBA
framework used to quantify these impacts.
Impacts
The impacts (including costs and benefits) of the proposed options are identified below.
Proposed changes to the National Construction Code
Under the options involving changes to the NCC, there would be an increase in the
number of accessible dwellings and therefore an increase in the proportion of the stock of
dwellings that are accessible for people with mobility limitations, including older people
and people with disability.
Benefits
The benefits of the proposed changes to the NCC (Options 1-4) essentially involve
reducing the size of the problem estimated in chapter three. This includes:
■ reduced costs associated with falls
■ reduced carer needs
■ reduced cost of home modifications
■ reduced stays in hospital and transition care
■ reduced costs associated with social isolation and loneliness
■ reduced premature and unnecessary entry into residential aged care
■ reduced costs associated with moving
■ reduced costs for people with short-term injuries and families with young dependants
due to inaccessible housing
■ reduced adverse quality of life impacts
■ societal benefits.
Costs
The costs of the proposed changes to the NCC (Options 1-4) could include the following.
■ The additional costs associated with complying with the proposed accessibility
standards – these costs include:
– Additional construction costs

www.TheCIE.com.au
Proposal to include minimum accessibility standards for housing in the National Construction Code 141
– Loss of space – where some areas of a dwelling (such as bathrooms and hallways)
expand to meet the proposed standards, this space must come from either:
… expanding the footprint of the building, which means either expanding lot sizes
or loss of outdoor/garden space, or
… loss of living and/or bedroom spaces where the additional hallway and
bathroom space is accommodated within the existing building footprint.
■ Costs associated with additional excavation work on sloped lots.
■ Transition costs – this includes:
– Transition costs for volume builders, including the costs associated with
re-designing the standard offering and rebuilding display homes
– Other industry transition costs — this includes the cost of various industry
professionals familiarising themselves with the new NCC requirements. This
would include:
… architects/building designers
… builders
… certifiers.
Transition costs are likely to be one-off costs due to the nature of industry adaptation to
new requirements.
Subsidy scheme
A proposed subsidy (Option 5) would be provided to providers of accessible rental
accommodation.
■ The benefits of this approach are the extent to which a subsidy scheme would address
the problem (see chapter three). However, as the subsidy scheme would apply only to
renters, this approach would address only the proportion of the problem relating to
renters.
■ The costs of this approach include the additional cost of providing accessible
accommodation, either through building new dwellings or through refurbishing
existing dwellings to meet the standard. One indicator of these additional costs is the
subsidy required to encourage private landlords to provide the service.
Both the benefits and costs of the subsidy scheme would depend on the number of
subsidised dwellings provided under such scheme. The extent to which private providers
would take up the subsidy and provide accessible rental accommodation to people with
accessibility needs is difficult to estimate.
There are around 81 000 people living in unmodified private rental accommodation (i.e.
excluding social housing) with limited mobility that require assistance or have difficulty
moving around their place of residence (suggesting that the dwelling does not meet their
needs).
To provide an indicative estimate of the benefits and costs of a subsidy scheme, it is
assumed that an additional 5 000 accessible rental properties are provided each year that

www.TheCIE.com.au
142 Proposal to include minimum accessibility standards for housing in the National Construction Code
are leased to people whose existing rental accommodation is not meeting their
accessibility needs.
Chart 5.1 compares the assumed number of subsidised accessible rental properties
compared with the number of people with accessibility needs living in inaccessible
private rental accommodation.
5.1 Assumed number of subsidised rental properties compared with the number of
people living in inaccessible private rental accommodation
Note: It is assumed that an additional 5000 accessible rental properties would be provided each year.
Data source: ABS 2018 Survey of Disabilities, Ageing and Carers, TableBuilder, CIE.
Enhanced voluntary guidance
As well as a voluntary handbook, this option would include measures, such as:
■ a centralised search engine for (certified) accessible housing
■ information provision on accessible housing at the point of sale.
Costs
Costs associated with this option would include the following.
■ The costs associated with developing a voluntary handbook would be relatively low.
The proposed changes (based on LHDG) could be reproduced (subject to permission
of LHA), as a voluntary handbook at minimal cost.
■ There would be costs associated with developing a new search engine specifically for
certified accessible housing or working with an existing provider to include the
relevant functionality in their existing search engines. There may also be ongoing
operating costs (or an increase in operating costs).
■ There may also be modest costs associated with developing information material to be
provided at the point of sale, and modest costs associated with providing the relevant
material (whether on a voluntary or mandatory basis).
0
20
40
60
80
100
120
2018 2019 2020 2021 2022 2023 2024 2025 2026 2027 2028 2029 2030 2031
'00
0
People living in inaccessible private rental
accommodation ('000)
Assumed number of subsidised rental properties
www.TheCIE.com.au
Proposal to include minimum accessibility standards for housing in the National Construction Code 143
■ To the extent that these measures encourage additional uptake of universal design
principles, there would also be the associated costs, including construction costs, the
opportunity cost of space (where relevant) and possibly additional excavation costs.
However, these costs would be incurred on a voluntary basis. A potential advantage
of this approach, relative to a mandatory requirement, is that there is scope for
consumers to make their own choices; where some consumers have a strong
preference for non-compliant designs or the cost of complying with the standard is
higher than average (due to the specific characteristics of the lot) they would be able to
choose not to include accessible design features.
Benefits
To the extent that this approach encourages additional uptake of universal design
principles (if at all) it could potentially reduce the size of the problem. As uptake would
be significantly lower than under the mandatory requirements, the benefits would be
commensurately smaller.
Unintended consequences
The public consultation encouraged respondents to identify less intuitive or unintended
consequences of the proposed changes.
Mis-alignment with state government policies
One submission noted that the proposal could hinder design and housing product choice
if adopted across all new homes and residential apartments. This broad approach does
not align with state driven housing policies, such as NSW ‘missing middle’ which
advocates for multi-level terrace style housing, smaller lot sizes, urban living and so forth.
As inner city lots become smaller to accommodate housing affordability constraints, the
proposed changes in the NCC seem to be at odds with such policies.
PCA suggested that there is a risk of regulatory overlap given the prevalence and
complexity of state, territory and local government regulation. It provided a list of
accessibility requirements in state and territory and local government areas.187
The NCC provides a national framework of consistent requirements and standards. The
adoption of the NCC requirements is the jurisdiction of each state and territory and also
provides for benefits of harmonisation of standards across states and territories which are
established under other reforms. When adopting the NCC, state and territory authorities
would take into consideration and manage any inconsistencies between the new NCC
requirements and existing state planning and other regulations. However, this may result
in any consistencies being ‘managed’ by a State or Territory varying or choosing not to
adopt the NCC requirements.
187 Submission by Tim Wheeler for PCA, p2; Appendix B, p.11-13, accessed 1 December 2020,
https://consultation.abcb.gov.au/engagement/consult-ris-accessible-
housing/consultation/published_select_respondent

www.TheCIE.com.au
144 Proposal to include minimum accessibility standards for housing in the National Construction Code
Affordability
A number of submissions suggested that proposed changes would increase costs and thus
impact housing affordability, especially for first home buyers. The higher cost could
result in a reduction in new dwelling demand.
For instance, as a submission noted, first home buyers or persons with a limited budget
may well be excluded from the new housing market due to the increased costs which
would generally not assist them directly. Affordable housing supply continues to be an
increasing issue and introduction of additional measures across all new dwellings will
further exacerbate this problem. It will result in an overall reduction in new housing
demand.188
It was also suggested that people with accessibility needs may actually be adversely
affected because they are more likely to have low income, and affordability is also
important to them.
By contrast, research cited by another submission supports mechanisms that standardise
local planning requirements as a way to reduce costs of construction and improve
affordability189. This view suggested there may be benefits from having a national
standard around accessible housing. It further proposed that construction cost increases
for the lower end of the market be addressed by introducing specific mechanisms to
enable and support affordable housing inclusion and use of government cross-subsidy.
As such, views on affordability impacts were mixed in the submissions. Housing price
and affordability are affected by many factors, of which the construction cost is only one
factor. In general, increase in construction cost is not fully passed on to housing price due
to demand and supply elasticities. In metropolitan areas where land supply is limited and
the housing supply is very inelastic, the increase in construction cost would be more
likely absorbed by the industry (through reduction in land price premium).
The impact on housing price and affordability are discussed in more detail in the next
chapter.
Loss of architecture richness and diversity
A number of submissions pointed out that some house designs will be no longer viable
with the introduction of proposed accessible requirements in the NCC. For example, split
level homes, those incorporating mezzanines, pole homes and traditional Queenslanders
do not lend themselves to being very accessible by their nature.
It should be noted that some of these impacts on architecture diversity could be avoided
or alleviated through the exemption clauses in the proposal.
188 Sam Plaschke, op. cit., p.4
189 Gurran, N., K. Ruming and B. Randolph 2009, Counting the costs: planning requirements,
infrastructure contributions, and residential development in Australia, AHURI Final Report No.140,
Australian Housing and Urban Research Institute Limited, Melbourne,
https://www.ahuri.edu.au/research/final-reports/140

www.TheCIE.com.au
Proposal to include minimum accessibility standards for housing in the National Construction Code 145
Other safety concerns
Registered Accommodation Association of Victoria (RAAV) highlighted a scenario
where a non-wheelchair user uses a wheelchair accessible shower. Because the
wheelchair accessible shower has no shower door, excessive water could spray across
floor, increasing the risk of slips and falls.190
Cost-benefit analysis framework
Cost-benefit analysis (CBA) is the COAG Guidelines recommended tool for weighing up
the costs and benefits of a regulatory (or other) proposal in a systematic way. Where
possible, all financial, social and environmental costs and benefits are estimated in a
common metric (usually monetary terms) so they can be readily compared. The stream of
future costs and benefits are ‘discounted’ back to their present value to ensure costs and
benefits incurred in different periods are on a comparable basis.
Baseline
A key element of a CBA is establishing a ‘baseline’ against which the costs and benefits
of each of the policy options are assessed. A typical baseline is a ‘business-as-usual’ case;
that is, the scenario without the policy (or policies) in question.
As set out in chapter three, there are a significant number of policies aimed at ensuring
that older Australians and people with disability have access to housing that meets their
needs. The baseline scenario assumes that these policies will continue.
The CBA is therefore assessing the incremental benefits and costs of each of the proposed
options relative to existing policies.
With respect to construction costs and space requirements, DCWC takes a two-step
approach to define the baseline, reflecting the complexity of building type and design.
First, for each design element, various scenarios are defined to reflect the different
baselines. For example, some designs may already be compliant under the baseline, and
thus the required changes incur zero cost. Some designs are not compliant in the
baseline, and thus require changes to meet the standard, which incur additional
construction costs. Furthermore, the compliance may be achieved through different
design solutions. For example, to meet the toilet circulation space requirement, a design
replacing a side hung door with a cavity sliding door would mean minimal cost, while in
some cases this design is not feasible and bigger space is required to meet the standard,
with higher costs. For Gold and/or Gold+ standards, more scenarios may be needed to
define the baselines for those already meeting the lower standard.
In the second step, weightings are given to each scenario to define the baseline for the
relevant elements and building types in the market.
190 Berenice Hale submission for RAAV, p.2, accessed 1 December 2020,
https://consultation.abcb.gov.au/engagement/consult-ris-accessible-
housing/consultation/published_select_respondent
www.TheCIE.com.au
146 Proposal to include minimum accessibility standards for housing in the National Construction Code
Time periods
According to OBPR, the time period for a CBA needs to be long enough to capture all
potential costs and benefits. As with previous ABCB RISs, a 10-year regulatory period
has been adopted. However, as buildings are long-lived assets, accessible dwellings
constructed over the 10-year regulatory period will provide housing (and therefore
benefits) over a much longer period. The benefits of the dwellings built over the 10-year
regulatory period have in the past been assessed over the life of the dwelling (generally
assumed to be around 40 years).
One challenge with this approach, in the context of the current RIS, is that (one of) the
approach(es) to quantifying benefits assumes that the extent to which the proposal
addresses the problem (estimated in chapter two) is related to the share of accessible
dwellings in the overall stock, rather than estimating the benefits for an individual
dwelling and then extrapolating across the stock built under the new code. This is
because most (but not all) of the benefits depend on whether a person with specific
accessibility needs resides in the dwelling.
The approach therefore involves estimating the additional upfront costs associated with
the dwellings constructed over the 10-year regulatory period. The benefits escalate as the
share of the stock that is accessible increases. The benefits are then held constant at the
end of the 10-year regulatory period for an additional 30 years.
Discount rate
As required by OBPR, all costs and benefits are discounted using an annual real discount
rate of 7 per cent.191 Alternative discount rates of 3 per cent, 5 per cent and 10 per cent
are used in sensitivity testing.
CBA summary outputs
Key CBA summary outputs are as follows:
■ Net present value (NPV) — this output represents the present value of the future
benefits less the present value of future costs.
– An NPV greater than zero indicates that the benefits of the proposal outweigh the
costs.
– An NPV less than zero indicates that the costs of the proposal outweigh the
benefits.
■ Benefit-cost ratio (BCR) — this represents the ratio of future benefits to costs (both in
present value terms).
– A BCR greater than 1 indicates that the benefits of the proposal outweigh the costs
– A BCR less than 1 indicates that the costs of the proposal outweigh the benefits.
191 Department of the Prime Minister and Cabinet 2016, Cost-Benefit Analysis, Office of Best
Practice Regulation, February 2016, pp.7-8.

www.TheCIE.com.au
Proposal to include minimum accessibility standards for housing in the National Construction Code 147
Projected dwelling construction
A key driver of both benefits and costs is the level of new dwelling construction over the
regulatory period. CIE’s dwelling projection sees completions declining gradually from
just above 200 000 in 2022 to around 182 000 by 2031 (chart 5.2).
5.2 Projections for dwelling completions in Australia
Data source: CIE.
The underlying drivers of completions are population growth, the ratio of the dwelling
stock to population and a demolition rate. The ratio of the dwelling stock to population
has been derived from state government projections for population and dwellings, and
aggregated to the national level.
New dwellings constructed under a revised NCC would become an increasing share of
the stock over time (chart 5.3). The share of accessible housing will increase accordingly.
0
50
100
150
200
250
2022 2023 2024 2025 2026 2027 2028 2029 2030 2031
Dw
ellin
gs
('0
00
)
Apartment Townhouse Detached

www.TheCIE.com.au
148 Proposal to include minimum accessibility standards for housing in the National Construction Code
5.3 Share of the dwelling stock (by type) constructed under the new Code
Data source: CIE estimates.
0%
5%
10%
15%
20%
25%
30%
2021 2022 2023 2024 2025 2026 2027 2028 2029 2030 2031
Pe
r ce
nt
of
sto
ck
Detached
Townhouse
Apartment
Total
www.TheCIE.com.au
Proposal to include minimum accessibility standards for housing in the National Construction Code 149
6 Estimating costs
This chapter presents the estimates of the costs associated with each of the options.
Additional cost of complying with proposed standards
The impacts of the proposed standards on construction costs will vary across dwellings
based on factors such as: the type of dwelling, design choices, the approach to achieving
compliance, the size and topography of the lot.
The additional costs associated with complying with the proposed standards (including
both additional construction costs and the opportunity cost of space) are estimated in
Table 6.1.
■ DCWC, quantity surveyor, has provided estimates of the additional construction costs
of incorporating the proposed changes to the NCC into new builds.192 DCWC
costing is ‘a weighted cost that provides an indication of likely average cost impact on
each architype [sic], averaged across the population of non-exempt dwellings
constructed’. A summary of these costs is provided in the construction cost column of
Table 6.1.
■ DCWC’s cost estimates are based on construction costs in Canberra. Construction
costs in Canberra tend to be higher than the national average. Rawlinson’s Australian
Construction Handbook (2019) provides regional cost indices for each state/territory
capital and for regional areas. Weighting each capital city cost index by the number of
dwelling completions in each state during 2018-19 suggests that construction costs in
Canberra are around 5.4 per cent higher than the national average (table 6.2). So that
the cost estimates reflect the national average cost, CIE has adjusted DCWC’s
construction cost estimates accordingly.
■ DCWC has also provided an estimate of impacts on space of the proposed changes
(for example, where the size of new homes needs to expand to incorporate the
changes), see table 6.5 below. The net effect of space is the opportunity cost of the
additional land required (developers have to buy more land for each new dwelling
they create), offset by the value the new home-owner places on the additional space
(table 6.8). The assumptions for the net effect of these impacts are noted in table 6.1.
The summary cost results for the three building types in table 6.1 are aggregated from
DCWC’s cost estimates for five different dwelling types (archetypes) using the following
shares:
192 DCWC 2020, Accessible housing: Estimated cost impact of proposed changes to NCC, Report Version
V2.2 – 23 December 2020, see Table 2.1 and appendices.

www.TheCIE.com.au
150 Proposal to include minimum accessibility standards for housing in the National Construction Code
■ Apartment buildings consist of 8 per cent of walk-up blocks and 92 per cent of 4+
storey buildings (which would typically include a lift), according to building approval
data from ABS (Cat. 8731), and
■ Detached houses consist of 57 per cent of volume builds and 43 per cent of custom
builds according to DCWC.
6.1 Estimated additional compliance costs
Option Dwelling Estimated
construction
costs
($ per
dwelling)
Adjusted
costsb ($ per
dwelling)
Net opportunity
cost of space
($ per dwelling)
Total
($ per dwelling)
Non-exemption
properties
Option 1 (Silver) Separate house 4 055 3 837 37 3 874
Option 1 (Silver) Townhouse 4 385 4 150 36 4 186
Option 1 (Silver) Apartment 3 005 2 843 2 904 5 748
Option 2 (Gold) Separate house 12 221 11 565 93 11 658
Option 2 (Gold) Townhouse 17 036 16 121 153 16 274
Option 2 (Gold) Apartment 11 850 11 214 18 126 29 340
Option 3 (Gold+) Separate house 15 914 15 060 124 15 184
Option 3 (Gold+) Townhouse 21 500 20 346 195 20 541
Option 3 (Gold+) Apartment 16 571 15 681 22 061 37 742
Exempt
properties a
Option 1 (Silver) Separate house 3 414 3 231 33 3 264
Option 1 (Silver) Townhouse 3 397 3 214 33 3 247
Option 2 (Gold) Separate house 11 280 10 674 91 10 765
Option 2 (Gold) Townhouse 15 886 15 033 151 15 183
Option 3 (Gold+) Separate house 14 972 14 168 122 14 290
Option 3 (Gold+) Townhouse 20 350 19 258 193 19 451
a Exemptions for level access are applicable to Class 1a buildings only
b DCWC cost estimates were adjusted by the difference between Canberra and Australia’s weighted average construction costs index
from Rawlinsons.
Note: Reported opportunity of space costs are derived with assumptions noted in tables 6.4 and 6.5 net of capital value of bigger
space noted in tables 6.6
Source: Estimated construction costs is provided by DCWC (2020) which are aggregated by CIE using market shares of each type of
building – see text preceding the table; Net opportunity of cost of space is the space impact (provided in table 6.3 below) multiplied by
the net opportunity cost of space (provided in table 6.6 below); CIE estimates.
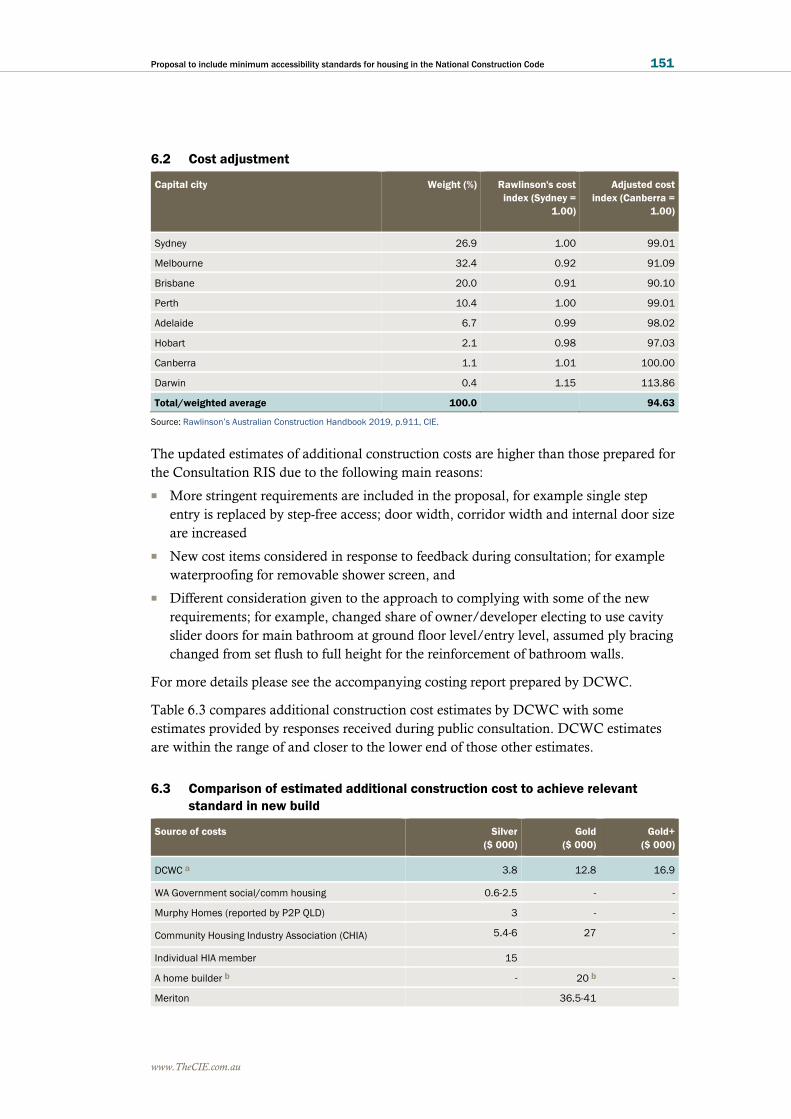
www.TheCIE.com.au
Proposal to include minimum accessibility standards for housing in the National Construction Code 151
6.2 Cost adjustment
Capital city Weight (%) Rawlinson's cost
index (Sydney =
1.00)
Adjusted cost
index (Canberra =
1.00)
Sydney 26.9 1.00 99.01
Melbourne 32.4 0.92 91.09
Brisbane 20.0 0.91 90.10
Perth 10.4 1.00 99.01
Adelaide 6.7 0.99 98.02
Hobart 2.1 0.98 97.03
Canberra 1.1 1.01 100.00
Darwin 0.4 1.15 113.86
Total/weighted average 100.0 94.63
Source: Rawlinson’s Australian Construction Handbook 2019, p.911, CIE.
The updated estimates of additional construction costs are higher than those prepared for
the Consultation RIS due to the following main reasons:
■ More stringent requirements are included in the proposal, for example single step
entry is replaced by step-free access; door width, corridor width and internal door size
are increased
■ New cost items considered in response to feedback during consultation; for example
waterproofing for removable shower screen, and
■ Different consideration given to the approach to complying with some of the new
requirements; for example, changed share of owner/developer electing to use cavity
slider doors for main bathroom at ground floor level/entry level, assumed ply bracing
changed from set flush to full height for the reinforcement of bathroom walls.
For more details please see the accompanying costing report prepared by DCWC.
Table 6.3 compares additional construction cost estimates by DCWC with some
estimates provided by responses received during public consultation. DCWC estimates
are within the range of and closer to the lower end of those other estimates.
6.3 Comparison of estimated additional construction cost to achieve relevant
standard in new build
Source of costs Silver
($ 000)
Gold
($ 000)
Gold+
($ 000)
DCWC a 3.8 12.8 16.9
WA Government social/comm housing 0.6-2.5 - -
Murphy Homes (reported by P2P QLD) 3 - -
Community Housing Industry Association (CHIA) 5.4-6 27 -
Individual HIA member 15
A home builder b - 20 b -
Meriton 36.5-41

www.TheCIE.com.au
152 Proposal to include minimum accessibility standards for housing in the National Construction Code
Source of costs Silver
($ 000)
Gold
($ 000)
Gold+
($ 000)
HIA members (summary across members) 5-40 c 5-40 c
Industry members >55 c >55 c
a weighted average across dwelling types
b upgrade home to AS128.1
c It’s unclear which standard-level these estimates refer to
Note: Basis of estimates (houses, apartments) vary across submitters and in some cases it Is not clear
Source: CIE based on DCWC and submissions
The estimated aggregate costs over time are calculated by multiplying these per dwelling
cost estimates by the number of dwellings expected to be built as projected and shown in
chart 5.2 in the previous chapter).
Additional construction costs
A key challenge in estimating the additional costs associated with complying with the
proposed standards is sufficiently capturing variation across dwellings. While it is
difficult to capture all of the variations, it is important that the estimates are broadly
representative of the additional costs across dwellings.
Approach to costings
The ABCB engaged DCWC to prepare estimates of the additional cost of meeting the
proposed accessibility standards. DCWC has estimated the additional costs for 5 different
dwelling archetypes:
■ 2 separate houses (Class 1a dwellings), including:
– a ‘custom built’ house
– a typical volume builder house
■ a townhouse (Class 1a dwelling)
■ 2 apartments (Class 2 dwellings), including
– an apartment in a 3-storey ‘walk-up’
– an apartment in a 4+ storey building (which would typically include a lift).
To account for the variation across buildings within each building type (archetype),
DCWC estimated the weighted average cost of complying with each design element
covered by the relevant standard. DCWC:
■ identified a range of scenarios (reflecting the current levels of compliance under the
baseline, e.g. non-compliant, Silver compliant, or Gold and Gold+ compliant, and
different ways to achieve compliance at these levels)
■ estimated the cost of complying with the relevant standard under each scenario
■ estimated the share of dwellings that are represented by each scenario (these estimates
were used as weightings to estimate the weighted average cost across the various
scenarios) for each design element in each archetype.

www.TheCIE.com.au
Proposal to include minimum accessibility standards for housing in the National Construction Code 153
DCWC cost estimates
DCWC has provided detailed cost estimates and discussion in their accompanying
report.193
Space-related costs
Several accessible design elements have the effect of widening entry passages and
increasing garages and bathroom sizes, compared to existing practice.
There are generally two ways that these additional space requirements could be
accommodated:
■ Expanding the footprint of the building – this means the additional space must come
from either:
– a loss of outdoor (garden) space, or
– an increase in lot size/width, which implies fewer lots in any given development
area. This would mean that the value of the additional lots would be foregone.
■ Accommodating the additional space requirements within the existing footprint of the
building — this implies a loss of living (or bedroom) space, for example.
For Class 1a separate dwellings, increasing the building footprint to accommodate
accessible design elements may be possible on larger lots. However, there may be more
significant impacts on some smaller lots.
■ There has been a recent trend towards smaller lots for greenfield housing (chart 6.4).
■ Submissions suggest that ‘every millimetre’ is utilised to achieve an affordable product
in multiunit and townhouse developments.194
193 DCWC 2020, Accessible housing: Estimated cost impact of proposed changes to NCC, Report Version
V2.2 – 23 December 2020
194 For example, see Anonymous Submission 0808182020, accessed 11 November 2020,
https://consultation.abcb.gov.au/engagement/consult-ris-accessible-
housing/consultation/published_select_respondent

www.TheCIE.com.au
154 Proposal to include minimum accessibility standards for housing in the National Construction Code
6.4 Median lot size
Data source: Urban Development Institute of Australia, State of the Land 2018, National Residential Greenfield and Multi-Unit Market
Study, p. 11.
Consequently, it may not always be possible (or straightforward) to increase the building
footprint.
■ This could mean that some commonly used dwelling designs may not be possible on
smaller lots, resulting in less-preferred designs, such as designs with smaller living (or
other) areas to offset increased floorspace elsewhere to meet minimum accessibility
standards.
■ Alternatively, developers and planning authorities may need to widen lot sizes to
accommodate accessible dwellings, leading to fewer lots on a given subdivision. This
could also have the effect of reducing the viability of some developments because
fewer lots would be offered and thus there would be less revenue.
■ Even when it is possible to expand the footprint of the building on a smaller block,
this would reduce the (already limited) outdoor space.
These space requirements may also affect some apartment developments and multi-
dwelling townhouse developments. As with separate Class 1a buildings, creating
additional space in the dwelling to comply with the minimum standards would require
either:
■ offsetting reduction in floor space in other interior spaces (such as living areas),
reducing amenity and possibly impacting on the value of the dwelling;
■ fewer dwellings within a given building envelope (for apartments) or subdivision area
(for townhouses). As above, this could affect the viability of some developments
because sale price increase per dwelling would not offset the loss of the number of
dwellings.
Estimated impact on space
DCWC’s estimates for the space impacts are noted in table 6.5.

www.TheCIE.com.au
Proposal to include minimum accessibility standards for housing in the National Construction Code 155
6.5 Estimated space impacts of complying with proposed changes to NCC
Option Building Estimated space impacts
(m2)
Share of dwelling footprint
(per cent)
Option 1 (Silver) Separate house 1.5 1.0
Option 1 (Silver) Townhouse 1.4 1.4
Option 1 (Silver) Apartment 0.8 0.6
Option 2 (Gold) Separate house 3.7 2.4
Option 2 (Gold) Townhouse 6.1 5.8
Option 2 (Gold) Apartment 4.7 4.0
Option 3 (Gold+) Separate house 4.9 3.2
Option 3 (Gold+) Townhouse 7.8 7.4
Option 3 (Gold+) Apartment 5.8 4.9
Source: DCWC (2020), Table 2.2.
Valuing the space impacts through the marginal value of land for Class 1a buildings
As outlined above, one way to achieve additional internal space required to comply with
the proposed standards is to expand the footprint of the building (such as through the loss
of outdoor/garden space). These space impacts can be valued through estimating the
marginal value of land. The marginal value of land reflects the willingness to pay for an
additional square metre of land.
■ A recent Reserve Bank of Australia (RBA) Research Discussion Paper estimated the
price elasticity195 of demand for land with respect to lot size in Sydney, Melbourne,
Brisbane and Perth. These elasticities can be interpreted as the percentage increase in
the sale price of a property for a 1 per cent increase in the size of the lot.
■ Based on approximate median greenfield lot sizes in capital cities reported in the
Urban Development Institute of Australia’s State of the Land 2019 report, a 1 m2
increase in the footprint of the building is equivalent to a 0.2 to 0.3 per cent reduction
in the median lot size.
■ This implies a 0.05-0.06 per cent reduction in property values. Based on the median
house prices, this implies a weighted average opportunity cost of land equivalent to
around $500 per m2 (table 6.6).
Note that the implied cost per square metre is significantly lower than the average price
of land in some cities. The RBA attributes this gap to land use restrictions (such as
zoning).
195 This price elasticity is the percentage change in land price with respect to (divided by) the
percentage change in lot size. For example, an elasticity of 0.24 means that, for one per cent
increase in the lot size, the land price would increase by 0.24 per cent.

www.TheCIE.com.au
156 Proposal to include minimum accessibility standards for housing in the National Construction Code
6.6 Estimated marginal cost of land
City Elasticity Median
greenfield
lot size c
(m2)
1 m2
reduction
in lot size
(per cent)
Implied
reduction
in property
value e
(per cent)
Median
property
value f
($’000)
Cost of lost
space
($ per m2)
Sydney 0.24 a 379 - 0.26 - 0.06 1 142.2 - 723
Melbourne 0.25 a 400 - 0.25 - 0.06 902.0 - 564
Brisbane 0.21 a 385 - 0.26 - 0.05 577.7 - 315
Perth 0.24 a 375 - 0.27 - 0.06 537.0 - 344
Adelaide 0.24 b 425 - 0.24 - 0.06 542.9 - 300
Hobart 0.24 b 507 - 0.20 d - 0.05 530.6 - 246
Canberra 0.24 b 507 - 0.20 - 0.05 788.6 - 366
Darwin 0.24 b 507 - 0.20 d - 0.05 509.5 - 236
Weighted average - 506
a From ‘Large Equation’ reported in Kendall and Tulip (2018, p. 9). b As Kendall and Tulip (2019) estimated the elasticities for Sydney,
Melbourne, Brisbane and Perth only, the elasticities for the other cities were based on the average across Sydney, Melbourne,
Brisbane and Perth. c Approximate values taken from UDIA (2019, pp. 14-15). d Median lot sizes were not reported for Darwin or
Hobart. It is assumed that median lot sizes would be similar to Canberra. e Reduction in lot size multiplied by the elasticity. f From
Domain House Price Report — December 2019, https://www.domain.com.au/research/house-price-report/december-2019/#sydney,
accessed 29 January 2020.
Source: Kendall, R. and Tulip, P. The Effect of Zoning on Housing Prices, Reserve Bank of Australia Research Discussion Paper RDP
2018-03, March 2018, p. 9; Urban Development Institute of Australia, State of the Land 2019, National Residential Greenfield and
Apartment Market Study, pp. 14-15.
As also noted above, rather than expanding the building’s footprint, the additional space
requirements for functional space could be accommodated within the existing building
footprint through reducing the size of living areas or bedrooms. This is, in effective, loss
of internal space.
During consultation, some stakeholders suggested that the loss of internal floor space can
be overcome through better design. That is, the loss of amenity associated with a loss of
internal floor space in living areas can be minimised through better design. Although this
is a reasonable position, CIE considers it unlikely that these amenity costs can be
completely ‘designed away’. In CIE’s view, the loss of space is a real cost that should be
included in the CBA.
CIE considers that it is reasonable to infer that the costs associated with a loss of internal
space would be of a similar magnitude to the increase in construction costs and the loss
of garden space in a scenario where the building footprint expands.
■ The footprint of the building relative to the size of the lot is effectively a trade-off
between indoor and outdoor space. Subject to planning constraints (such as setback
requirements), CIE would expect that an owner would choose a building footprint to
the point where the marginal benefit of additional internal floor space (i.e. the
additional value from the last square metre of floor space) is equal to the marginal cost
(the marginal cost of additional floor space is the associated construction costs plus
the value placed on the loss of outdoor space).
■ This implies that if the balance between internal and external space is optimised under
the baseline (i.e. under status quo requirements), the total cost of expanding the

www.TheCIE.com.au
Proposal to include minimum accessibility standards for housing in the National Construction Code 157
building’s footprint to meet the proposed accessibility standards would be similar to
the loss of amenity associated with smaller living spaces.
■ The additional construction costs plus the value of land in a scenario where the
building footprint expands is likely to be a reasonable indicator of costs, regardless
of whether the building footprint expands or additional space requirements are
absorbed internally.
Valuing the loss of living space in apartments
For apartments, it is likely that the footprint of the building would occupy as much of the
lot as is permitted by planning restrictions. Consequently, there is likely to be little scope
to expand the overall footprint of the building, implying that additional space
requirements for functional spaces (bedrooms, kitchen and bathrooms) would come at
the expense of living space. Consistent with this, DCWC has assumed that the additional
space required for accessibility purposes is achieved by reallocating space within an
existing apartment.
One way to value the loss of living space in apartments is to treat it as an effective
reduction in the size of the apartment (assuming that the initial balance between living
and functional spaces is optimised under the baseline scenario). Based on current
apartment prices and an estimated average size of a new apartment, it is estimated that
the weighted average price per square metre (weighted by apartment completions) is
around $4 500 (table 6.7).
6.7 Average price per square metre - apartments
City Median apartment pricea
($)
Average apartment sizeb
(m2)
Average cost per square
metre ($ per m2)
Sydney 735 387 130 5 679
Melbourne 549 701 131 4 196
Brisbane 377 549 126 3 008
Perth 342 708 123 2 786
Adelaide 306 327 152 2 011
Hobart 441 104 130 3 398
Canberra 455 537 96 4 755
Darwin 286 249 155 1 853
Weighted average 4 517
a From Domain House Price Report — December 2019, https://www.domain.com.au/research/house-price-report/december-2019/#sydney,
accessed 29 January 2020. b CommSec, Australian home size hits 20-year low: CommSec Home Size Trends Report, Economic
Insights, 17 November 2017, https://www.commsec.com.au/content/dam/EN/ResearchNews/ECOReport.20.11.17_Biggest%20homes_size-
fall.pdf, accessed 30 January 2020.
It may be a more accurate measure of the amenity costs of losing living space to consider
the marginal value of floor space, rather than the average value which implies all areas are
equally valued. The marginal value represents the cost of losing that particular space,
rather than just a per square metre average based on the value of the space in its entirety.
However, there are few relevant studies that estimate the marginal value of floor space in
apartments.

www.TheCIE.com.au
158 Proposal to include minimum accessibility standards for housing in the National Construction Code
Two studies by the Secret Agent (a buyers’ advocate based in Melbourne) for a broader
study on the economic impacts of Melbourne’s apartment design guide by SGS Planning
and Economics196 estimated the marginal value of apartment space for apartments in
inner Melbourne.
■ The first study estimated that the marginal value of additional floor space was around
$6 200 per m2.
■ A second study, where the sample was restricted to apartment buildings that were 4
storeys or less, estimated the marginal value of additional floor space was around
$3 900 per m2.
The lower estimate was broadly consistent with the average price per square metre at the
time, suggesting that the average price per square metre is a reasonable indicator of the
marginal value of apartment space.
Capital value of more space
As discussed in chapter two, Dalton and Carter (2020a,b) suggested that the CBA in the
Consultation RIS did not capture the ‘utility in use’ or capital value of the additional
space and this should be included in the analysis in addition to the benefit of improved
functionality.197 Dalton and Carter (2020a,b) suggest that the capital value would be
equivalent to the opportunity cost of the additional space.
Extra space in functional areas of a home would increase the value of the home only if it
provides additional or utility in use (sometimes referred to as amenity) that is valued by
the market (the main market failure leading to an undersupply of accessible dwellings is
that the market undervalues the functional benefits of accessibility). CIE has found
minimal direct evidence to support this proposition, and notes the following:
■ Master Builders Australia’s submission to the Consultation RIS suggests that
Silver-level features do not necessarily improve amenity. The submission refers to the
experience of a builder displaying Silver-level homes at a major display village. The
submission notes that:198
– the public were left confused with a negative impression of the builder’s design
– if the sales consultant does not effectively explain LHDGs (i.e. oversized powder
rooms etc.) buyers walk away questioning their designs.
■ Hedonic pricing 199studies using property value typically include a range of variables
that have a significant impact on property values (as control variables). These studies
196 SGS Economics and Planning 2016, Economic analysis of the Better Apartments initiative, Final
report, Prepared for Department of Environment, Land, Water and Planning and the Office of
the Government Architect, Appendix C: Secret Agent Study Part 1 and 2, 18 November 2016.
197 Professor Bruce Bonyhady and Dr Di Winkler, op.cit. Summer Foundation and MDI
submission, Appendix 1, and Supplementary submission
198 Submission by Max Rafferty for Master Builders Australia, pp. 5-6, accessed 7 December
2020, https://consultation.abcb.gov.au/engagement/consult-ris-accessible-
housing/consultation/published_select_respondent
199 The hedonic pricing method uses statistical models to link the price of a product to the product
characteristics.

www.TheCIE.com.au
Proposal to include minimum accessibility standards for housing in the National Construction Code 159
rarely include the accessibility features provided under the NCC proposal (such as
additional space in bathrooms, toilets, kitchens and hallways).200 This suggests that
these features are not a major influence on property prices.
■ The evidence from the stated preference survey does not support the proposition that
buyers value the additional floor space under the NCC proposal highly. Holding
constant accessibility features and the proportion of floor space used for functional
versus living areas, the value of the additional spaces provided to comply with the
proposed NCC requirements is not statistically significantly different from zero (z
values are between 1.5 and 1.9 depending on the models used). In other words, the
statistical evidence does not support additional capital value in addition to the
functionality benefits.
■ Furthermore, there is no particular reason why these benefits would equal the
additional cost. Indeed this is likely to be an extreme upper bound estimate; if the
utility in use benefits were higher than the cost of the additional space, logically more
people would choose designs that incorporate these features.
CIE acknowledges that there may be some ‘utility in use’ benefits from the additional
space that would be provided under the proposed change to the NCC in addition to the
functionality benefits already estimated; in principle, more space would be preferred to
less space (all else being equal).
Although not statistically significant, the ‘use value’ WTP for a 5 per cent increase in
floor space, holding constant accessibility features and proportion of floor space used for
functional versus living areas, is estimated at $376 per year for buyers and $288 per year
for renters.
The average size of newly built houses and apartments is about 230.8 m2 and 124.8 m2,
respectively.201 Assuming a life span of 50 years for a dwelling and a discount rate of 7
per cent, the annual WTP for a 5 per cent increase in floor space suggests that the capital
value in addition to the functional value of additional space is $481/m2 for detached
houses and $682/m2 for apartments (table 6.8)
Net opportunity cost of space
In summary, the net opportunity cost of the space impacts is estimated at $25/m2 for
separate houses and townhouses and $3 836/m2 for apartments (table 6.8).
200 See for example, Wing, C.K. and T.L. Chin 2003, ‘A Critical Review of Literature on the
Hedonic Price Model’, International Journal for Housing Science and Its Applications, 27(2), p.145-
165; Gilbert, S.W. 2013, Applying the Hedonic Method, NIST Technical Note 1811, National
Institute of Standards and Technology.
201 CommSec 2018, “Australian home size hits 22-year low: CommSec Home Size Trends
Report”, Economic Insights, 16 November 2018,
https://www.commsec.com.au/content/dam/EN/ResearchNews/2018Reports/November/ECO_Insigh
ts_191118_CommSec-Home-Size.pdf
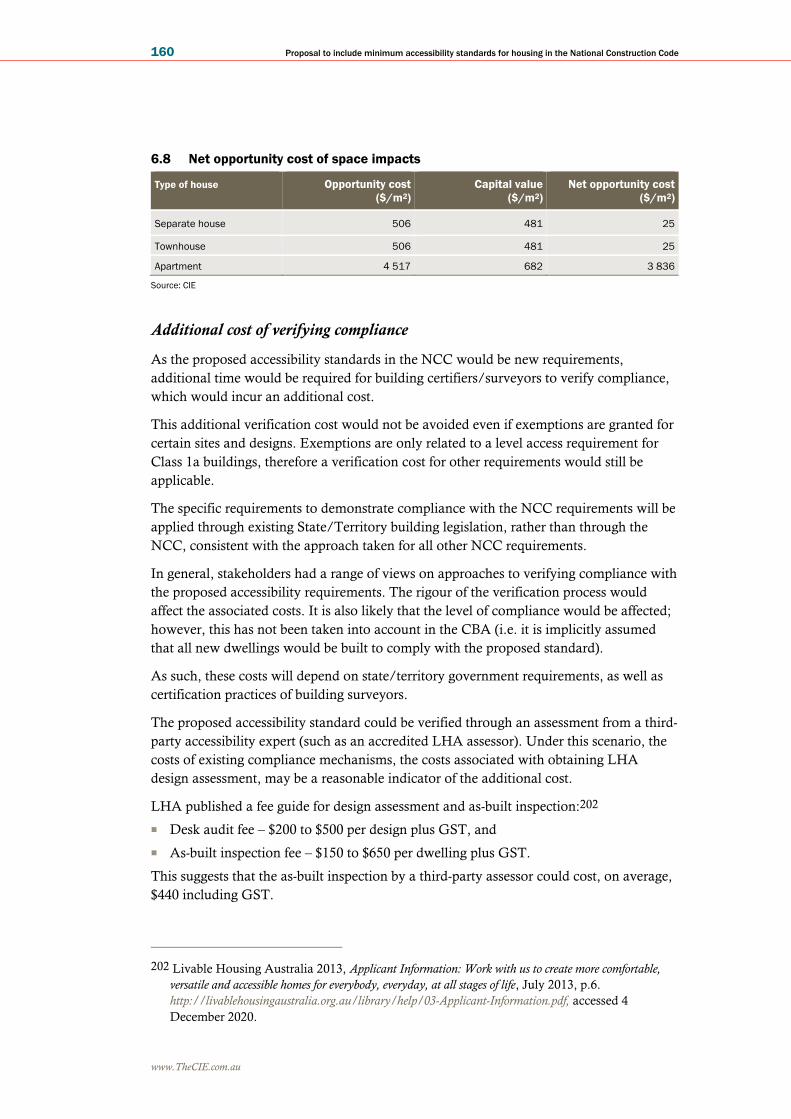
www.TheCIE.com.au
160 Proposal to include minimum accessibility standards for housing in the National Construction Code
6.8 Net opportunity cost of space impacts
Type of house Opportunity cost
($/m2)
Capital value
($/m2)
Net opportunity cost
($/m2)
Separate house 506 481 25
Townhouse 506 481 25
Apartment 4 517 682 3 836
Source: CIE
Additional cost of verifying compliance
As the proposed accessibility standards in the NCC would be new requirements,
additional time would be required for building certifiers/surveyors to verify compliance,
which would incur an additional cost.
This additional verification cost would not be avoided even if exemptions are granted for
certain sites and designs. Exemptions are only related to a level access requirement for
Class 1a buildings, therefore a verification cost for other requirements would still be
applicable.
The specific requirements to demonstrate compliance with the NCC requirements will be
applied through existing State/Territory building legislation, rather than through the
NCC, consistent with the approach taken for all other NCC requirements.
In general, stakeholders had a range of views on approaches to verifying compliance with
the proposed accessibility requirements. The rigour of the verification process would
affect the associated costs. It is also likely that the level of compliance would be affected;
however, this has not been taken into account in the CBA (i.e. it is implicitly assumed
that all new dwellings would be built to comply with the proposed standard).
As such, these costs will depend on state/territory government requirements, as well as
certification practices of building surveyors.
The proposed accessibility standard could be verified through an assessment from a third-
party accessibility expert (such as an accredited LHA assessor). Under this scenario, the
costs of existing compliance mechanisms, the costs associated with obtaining LHA
design assessment, may be a reasonable indicator of the additional cost.
LHA published a fee guide for design assessment and as-built inspection:202
■ Desk audit fee – $200 to $500 per design plus GST, and
■ As-built inspection fee – $150 to $650 per dwelling plus GST.
This suggests that the as-built inspection by a third-party assessor could cost, on average,
$440 including GST.
202 Livable Housing Australia 2013, Applicant Information: Work with us to create more comfortable,
versatile and accessible homes for everybody, everyday, at all stages of life, July 2013, p.6.
http://livablehousingaustralia.org.au/library/help/03-Applicant-Information.pdf, accessed 4
December 2020.

www.TheCIE.com.au
Proposal to include minimum accessibility standards for housing in the National Construction Code 161
Alternatively, the verification would involve the building surveyor reviewing the plans
and/or conducting inspection to ensure compliance. Under this scenario, the additional
assessment costs are likely to be relatively modest. According to the Australian Institute
of Building Surveyors,203
■ Additional time of assessing the design could range between 5 and 30 minutes.
■ Alternatively, an additional inspection could potentially be required to verify a
dwelling complies with the proposed standard. This could potentially be mandated
through state and territory government legislation or be incorporated into the standard
practice of building surveyors.
While the hourly rate charged by building surveyors will vary across companies, $150 per
hour is an indicative average rate.204 This suggests that additional reviewing time may
cost between $12.50 and $75 with an average of $43.75.
As for the additional inspection, it was estimated that the cost is $200 per inspection by
CIE when preparing the BCR evaluation.205
Given the approach to verifying compliance with the proposed accessibility standards is
unclear, CIE estimates the additional verification costs under a range of approaches.
■ The lower bound scenario is based on the average cost of additional time of reviewing
the design
■ The central case scenario is based on the cost associated with the additional inspection
by building surveyors, and
■ The upper bound scenario is based on an as-built inspection by a third-party expert
(similar to LHA).
Based on the above discussion, it is estimated that the present value of additional
compliance verification cost could be between $63.5 million and $639.1 million over a
10-year regulatory period with a discount rate of 7 per cent for Options 1 to 3, and
between $18.3 million and $184.4 million for Option 4 (table 6.9).
6.9 Additional compliance verification cost
Unit cost Option 1 Option 2 Option 3 Option 4 Option 5
$/dwelling $m $m $m $m $m
Low 43.75 63.5 63.5 63.5 18.3 0
Central 200 290.5 290.5 290.5 83.8 0
High 440 639.1 639.1 639.1 184.4 0
Note: Additional compliance verification costs (for Options 1 to 5) are evaluated in net present value terms over the 10-year regulatory
period, using a discount rate of 7 per cent.
Source: CIE.
203 Jeremy Turner, pers com., 9 February 2021.
204 CIE 2020, Building Confidence Report: A case for intervention, report prepared for the Australian
Building Codes Board, p.81.
205 CIE 2020, op. cit., p.85.

www.TheCIE.com.au
162 Proposal to include minimum accessibility standards for housing in the National Construction Code
Transition costs
Transition costs include:
■ The cost incurred by volume builders, such as re-designing their standard offerings
■ Costs associated with industry professionals learning and understanding the new
requirements.
Transition costs for volume builders
Volume builders typically have a ‘standard offering’ of a range of designs for consumers
to choose from. During consultation, industry stakeholders noted that most standard
offering designs do not comply with the proposed standards. Consequently, volume
builders will need to re-design their standard offerings. Additional costs include:
■ The costs associated with re-designing the standard offering
■ Costs associated with re-building compliant display homes.
These costs could be alleviated through a transitional period (in the NCC or
State/Territory regulations) which would allow industry to incorporate the required
design changes into their normal cycles for updating standard designs and selling and
replacing former display homes.
Retraining costs for industry practitioners
As the proposed changes to the NCC are significant, both government and industry
would incur some one-off costs associated with raising awareness of the changes and
re-training. It is estimated total retraining costs would be around $28.47 million
(including $721 000 to government and $27.745 million to industry – for more details see
discussion below).
Costs to government
Transition costs to government are estimated to be $721 000 (see table 6.10)
■ These costs reflect: (1) to assist with the transition to the new code, it is assumed the
ABCB would prepare a range of guidance material, and (2) the cost to the ABCB or
other government bodies for organising and running seminars that educate relevant
stakeholders on the changes.
■ For a Decision Regulatory Impact Statement for proposed changes to the NCC
relating to energy efficiency in commercial buildings, total transition costs to
government were estimated at $355 000. In that analysis, CIE estimated that around
26 000 individuals would require retraining. For the current changes to the NCC
relating to accessibility, it is estimated that around 53 000 individuals would require
retraining. It is therefore estimated that government transition costs would be around
$721 000 ($355 000 multiplied by the ratio of 53 000 to 26 000)

www.TheCIE.com.au
Proposal to include minimum accessibility standards for housing in the National Construction Code 163
6.10 Transitional costs to government
Changes to NCC Estimate ($000)
Estimated costs for accessibility changes (current) 721
Source: CIE.
Costs to industry
Industry stakeholders will also incur one-off costs associated with familiarising
themselves with the new code requirements. It is estimated that the time costs associated
with familiarising themselves with the relevant aspects of the new code would be
$27.7 million (see table 6.11), which is based on assumptions that follow.
6.11 Estimated number of individuals to be retrained and retraining costs
Profession/trade People to be retrained
(’000)
Total time costs
($’000)
Construction managers 41 23 560
Architects/building designers 11 3 522
Certifiers/surveyors 2 663
Total 53 27 745
Source: CIE estimates.
Assumptions underpinning estimated industry retraining costs
Stakeholders that will require retraining due to changes in the code include individuals in
the following professions/trades, who work in (or provide services to) the residential
building industry:
■ Construction managers
■ Architects/building designers
■ Certifiers/surveyors
Number of construction managers who require re-training
CIE estimates there are 40 876 construction managers in 2019 who would require
retraining, as follows (see table 6.12).
■ There were 71 817 construction managers at September 2016, according to Census
data. Using employment growth in the equivalent occupation in ABS Cat. 6291, these
data were grown to 2019.
■ Census data indicates whether these individuals work in residential construction, non-
residential construction, heavy and civil engineering construction or construction
services. It is assumed individuals who work in residential construction and the sub-
sector of residential construction services would require retraining. The share of
individuals who work in construction services which services residential construction
is assumed to be employment in residential construction as a share of residential
construction, non-residential construction and heavy and civil engineering
construction. These are 40 876 construction managers.

www.TheCIE.com.au
164 Proposal to include minimum accessibility standards for housing in the National Construction Code
6.12 Construction managers
Item Total in 2016 Total in 2019 Who do not require
training a
Who do require
training
Data source Census data CIE estimates
(using ABS Cat
6291)
CIE estimates
(using Census data)
CIE estimates (using
Census data
Construction managers 71 817 75 442 34 566 40 876
Source: CIE estimates, sources as noted.
Number of architects and certifiers and surveyors that require retraining
The occupation details in the Census data are not sufficient to count architects and
certifiers/surveyors (the Census only provides data on ‘architects and landscape
architects’ and ‘Architectural, Building and Surveying Technicians’).
ABCB data indicates there are 32 905 architects and 5 731 certifiers/surveyors who are
subscribers to the NCC.
Census data cannot be used to estimate how many of these individuals provide services
to residential construction or to other types of construction (only data on their industry of
employment is provided).
Data in the ABS Input-Output Tables (Cat. 5209) suggest that the industry ‘Professional,
Scientific and Technical Services’ (which employs architects and certifiers) provided
$2 931 million dollars of output to the residential construction, non-residential
construction and heavy engineering and civil construction industries in 2016-17, of which
$940 million (32 per cent) was provided to residential construction. Therefore, it is
assumed that 32 per cent of architects (10 533 individuals) and 32 per cent of
certifiers/surveyors (1 723 individuals) provide services to residential construction and
would therefore require retraining.
Time costs incurred by individuals who require retraining
It is estimated that each individual who requires retraining would require 9.5 hours of
retraining (attending a 2 hour seminar/webcast, 3.75 hours of continuing professional
development, and 3.75 hours of self-paced learning), based on another RIS.206 The
assumption is adopted because retraining is required for similar changes to the NCC.
It is assumed that these time costs are additional to other training that occurs. This can be
interpreted literally: this retraining time is added onto any other training that would
otherwise occur. Alternatively, where the retraining replaces other training that would
have occurred, these time costs are retained as the value of the training which is lost.
206 CIE 2018, Decision Regulation Impact Statement Energy Efficiency in Commercial Buildings,
Prepared for ABCB, 20 November 2018, p.88-89

www.TheCIE.com.au
Proposal to include minimum accessibility standards for housing in the National Construction Code 165
Opportunity cost of time
CIE’s estimates of the hourly earnings of individuals in the relevant professions/trades,
excluding taxation, are shown in table 6.13. CIE has adjusted the underlying ABS
data.207 It is assumed that this data represents the opportunity cost of the relevant
individuals’ time.
6.13 Assumptions for hourly earnings in relevant occupations
Profession/trade Hourly earnings ($/hour)
Construction managers 61
Architects/building designers 35
Certifiers/surveyors 41
Source: CIE estimates
Total time costs
The cost of the time of individuals for retraining is the estimated hours for retraining
multiplied by the opportunity cost of the individual’s time.
Subsidies
One indicator of the level of subsidy that would be required to encourage the private
sector to offer more accessible rental properties is the pricing for SDA.
CIE estimates the subsidy required in the following way.
■ The estimates start with SDA rates for different types of residences (averaged across
new buildings and existing stock). The estimates are based on the SDA ‘Fully
Accessible’ standard with no onsite overnight assistance.
■ The rental payment SDA participants would be required to pay (based on 25 per cent
of the Disability Support Pension) is then added to the above estimates.
■ As it is assumed that participants in the proposed subsidy program would pay market
rent, the estimated market rent (based on the weighted average median rent across
capital cities) is then subtracted.
207 From ABS Cat. 6306, data for May 2018 on total hourly cash earnings is available for the
occupations: construction, distribution and production managers (which are used for
construction managers), architects, designers, planners and surveyors (architects), and building
and engineering technicians (certifiers). These data are grown forward to 2019 using
nationwide WPI. ABS Cash earnings data is a gross amount that includes superannuation and
taxation. Taxation is excluded as it is a transfer to government (not a cost). The data are
multiplied by 0.8, which is equivalent to assuming each of these individuals has an average tax
rate of 20 per cent.

www.TheCIE.com.au
166 Proposal to include minimum accessibility standards for housing in the National Construction Code
6.14 Estimated subsidy
Dwelling Average SDA
subsidy
($)
SDA subsidy plus
rent
($)
Market rent
($)
Subsidy
($)
Separate house 19 563 28 117 23 052 5 065
Townhouse 19 711 28 265 23 052 5 213
Apartment 40 016 48 570 21 838 26 732
Source: National Disability Insurance Scheme, Specialist Disability Accommodation, Price Guide (2019-20), 28 October 2019.
The subsidy is targeted at private renters whose accessibility needs are not currently met.
These cost estimates are applied to the assumed uptake profile shown in chart 5.1 in
Chapter five.
Flow-on impacts of higher construction costs
Impact on housing price
A flow-on impact of the higher costs associated with complying with the new
requirement in the NCC is the impact on housing price and housing affordability.
It should be noted that housing price is determined by many supply and demand factors,
among which construction cost is only one factor.
From the supply side, land availability, which is in turn affected by planning regulations,
has an impact on housing price. Construction costs, which are affected by the labour and
material markets and technological progress, also affects the housing price.
From the demand side, population growth, income growth and preference change are the
most important factors affecting the housing price.
Table 6.15 reports the increase in construction cost, space impacts and compliance
verification cost as a percentage of the average housing price in capital cities. The
percentage varies from slightly higher than a half of one per cent to 11.6 per cent,
depending on the level of changes in the NCC, housing type and the location.
6.15 Additional construction cost as percentage of average housing price
Silver
Gold
Gold+
House Apartment House Apartment House Apartment
% % % % % %
Sydney, NSW 0.48 0.88 1.44 4.22 1.85 5.43
Melbourne, Vic 0.62 1.15 1.87 5.53 2.39 7.10
Brisbane, Qld 0.87 1.63 2.60 7.80 3.33 10.02
Adelaide, SA 0.99 1.87 2.96 8.95 3.80 11.49
Perth, WA 0.92 1.67 2.75 8.00 3.53 10.28
Hobart, Tas 1.02 1.89 3.06 9.05 3.92 11.63
Canberra, ACT 0.69 1.49 2.05 7.14 2.63 9.17

www.TheCIE.com.au
Proposal to include minimum accessibility standards for housing in the National Construction Code 167
Source: CIE calculation based on DCWC costing and space impact, compliance verification costs (central estimate) and capital city
housing price (https://www.livingin-australia.com/australian-house-prices/)
This however does not suggest that the housing prices would increase by the same
percentage as shown in table 6.15.
In a typical supply-demand model, the higher cost would be partly absorbed by the
suppliers and partly passed onto consumers. The magnitude of costs passed on is
determined by the supply and demand elasticities.
As illustrated by chart 6.16, the proposed changes would increase the construction cost
by c, shifting the supply curve up by that amount.
6.16 Illustration: price impact of increased supply cost
Data source: CIE.
Without the change, the housing price is P and the housing supply is Q. With the
proposed change, housing price and supply become P’ and Q’, respectively. The increase
in price (P’P) is less than the cost increase (c), the balance of the full cost increase (PB) is
absorbed by the suppliers.
In this particular case, the supply is more elastic than the demand, that is, it is easier for
producers to adjust production in response to price change than consumers to adjust their
demand. As a result, it is easier for suppliers to pass the higher cost on to consumers. By
contrast, if the demand is more elastic than the supply, more of the cost increase would
be absorbed by the industry.
In urban areas especially metropolitan areas, land for new housing development is scarce
and thus the housing supply is more inelastic, suggesting that more of the cost increase
due to the proposed changes in the NCC would be absorbed by the industry and less
would be passed on to consumers. For example, as CIE found for the Infrastructure
Contributions Review by the NSW Productivity Commission, land prices hold a
substantial premium over the opportunity cost of the land for its next best use due to land

www.TheCIE.com.au
168 Proposal to include minimum accessibility standards for housing in the National Construction Code
use regulations. This means higher infrastructure contributions, or higher construction
cost in general, would be reflected in lower land values (reduced land price premium)
rather than higher housing prices.208
In other regions where land for housing development is less scarce, relatively more of the
construction cost increase due to the proposed changes in the NCC is likely to be passed
on to housing price. All other things being equal, the impact on housing price could be
closer to the full amount estimated. While it is not possible to definitely state the
quantum or scale of an impact on house prices, the impact could be higher in this case.
Another factor that would further limit the overall housing price increase is that the
proposed regulatory Options would likely increase construction costs of new dwellings
only. As new dwellings account for a small share of total housing the overall impact on
housing price is less observable due to ‘averaging out’.
Competition impact
Competition effects of a regulation can be assessed against the following aspects:
■ imposing barriers to entry, exit, or innovation
■ restricting consumer choice
■ raising prices, and
■ reducing overall economic efficiency and productivity.
The proposed accessible requirement for residential buildings in the NCC would have
minimal additional impact on competition.
Although the proposed changes in the NCC would favour existing architects, designers,
developers, builders and certifiers with accessibility expertise, they do not impose any
barriers for relevant players to enter or exit the market. Those who do not have the
relevant expertise could improve their competitiveness through retraining. As discussed
above, the retraining costs for industry practitioners are estimated at $27.7 million.
With respect to consumer choice, these requirements lead to more features in new
dwellings provided to consumers and as such these requirements do not restrict consumer
choice per se (although some consumers without accessibility needs may not appreciate
these additional features and place a low value or no value on them).
There may be some restriction in consumer choice with respect to house designs that may
be more difficult to build following the introduction of proposed accessible requirements
in the NCC. For example, split level homes, those incorporating mezzanines, pole homes
and traditional Queenslanders do not lend themselves to being very accessible by the
nature of their design. This restriction of consumer choices is intended to be alleviated
through the exemption clauses to be included in the NCC.
208 CIE 2020, Evaluation of infrastructure contribution reform in New South Wales, report prepared for
NSW Productivity Commission, December 2020, Chapter four, p.39-59,
http://productivity.nsw.gov.au/sites/default/files/2020-
12/Evaluation%20of%20Infrastructure%20Contributions%20Reform%20in%20NSW.pdf

www.TheCIE.com.au
Proposal to include minimum accessibility standards for housing in the National Construction Code 169
Impact on housing prices has been discussed above. Overall, the price impact of the new
requirements in the NCC is highly dependent on the housing type and location. It could
be small in metropolitan areas where the supply is more inelastic due to land use
regulations. In other places the impact could be larger. It is not possible to definitively
state the quantum or the scale of the impact.
Other than the cost estimates presented above, there would be no loss of economic
efficiency and productivity. The additional costs arise from the additional requirements,
that is, to provide more features. In measuring the productivity as resource costs per
‘feature’ or ‘functionality’, the proposed changes would not reduce productivity.

www.TheCIE.com.au
170 Proposal to include minimum accessibility standards for housing in the National Construction Code
7 Estimating the benefits
This chapter sets out the approach to estimating the benefits of each of the options.
General approach to estimating the benefits
In the Consultation RIS, CIE estimated the benefits generated by each of the options
using two different approaches.
■ The central approach was based on an estimate of the extent to which the proposed
changes to the NCC (and other options) would be expected to address the extent of
the problem (see chapter three).
■ The alternative approach was based on estimates of household willingness to pay for
various accessibility features when choosing a home to buy or rent. These estimates
were derived from the stated preference survey using questions that offered
hypothetical choices between homes with differing accessibility features and rents.
There are inherent uncertainties associated with relying entirely on stated preference
surveys. As pointed out by OBPR:209
As a general rule, estimates of individuals’ valuations of goods and services derived from
observing their behaviour in markets tend to be more credible than those from survey
questionnaires (Boardman et al. 2010). Observing purchasing decisions directly reveals
preferences, whereas surveys elicit statements about preferences.
Therefore, in this chapter, CIE has adopted a methodology that estimates the benefits for
each option based on the extent to which each option will address the problem(s) as
defined in chapter three.
Accessibility of the NCC options
The Consultation RIS assumed that:
■ Option 1 would meet the needs (and therefore address all of the associated problems)
for all people with accessibility issues, except for wheelchair users.
■ Options 2 and 3 would meet the needs (and therefore address all of the associated
problems) of all people with accessibility needs.
However, feedback from stakeholders during consultations and associated further review
of available data suggests these assumptions may not necessarily be an accurate reflection
209 Department of the Prime Minister and Cabinet 2016, Cost-Benefit Analysis, Guidance Note,
Office of Best Practice Regulation, February 2016, p. 11.

www.TheCIE.com.au
Proposal to include minimum accessibility standards for housing in the National Construction Code 171
of the benefits created in all circumstances. Stakeholder submissions made the following
points:
■ A dwelling needs to have all of the relevant features to be ‘accessible’. Under this
view, a dwelling is either accessible or it is not (i.e. a dwelling cannot be a ‘bit
accessible’). For example, ANUHD (supported by other stakeholders), notes that the
features only create benefits when provided as a ‘coherent suite’, not as individual
items.210
■ Option 1 (Silver) does not have all of the relevant features and cannot therefore be
considered ‘accessible’. This is reflected in a strong preference for Option 2 over
Option 1 (see chapter four).
Together these arguments could be interpreted as meaning that a dwelling that complies
with Option 1 would deliver no benefits.
Although some people may require all accessibility features, there is also evidence to
suggest that not everyone with accessibility needs require all features provided under the
NCC proposal for a dwelling to meet their needs.
■ According to the MDI survey, a significant share of respondents rated their dwelling
as ‘accessible’ even though the dwelling did not have all of the relevant features.
– For example, more than 40 per cent of homes were self-rated as ‘accessible’ by
people with limited mobility, even though they did not have at least one step-free
entrance.
– Similarly, not all dwellings that were self-rated as accessible had other relevant
features (including safe continuous step-free path from the street or parking to the
entrance and a hobless shower).
■ The SDAC data also suggests that when homes are modified to meet accessibility
needs, not all of the features included in the NCC proposal appear to be provided.
– For example, only 60 per cent of electric wheelchair users and only 20 per cent of
people who use walking sticks implement toilet, bath or laundry modifications,
(table 7.1).
– In general the prevalence rate is low. However some types of modifications are
more prevalent than others. For example, toilet, bathroom and laundry
modifications are the most prevalent, followed by ramps. In contrast, door
widening and kitchen modifications have a much lower level of prevalence.
While this data may be consistent with the proposition that some proposed features are
not essential, data on modifications must be interpreted carefully because many people
who require modifications may be budget constrained (and government subsidy
programmes often have strict eligibility requirements), and therefore are not able to make
modifications that they want and need.
210 Submission by Margret Ward for ANUHD, p.18, accessed 1 December 2020,
https://consultation.abcb.gov.au/engagement/consult-ris-accessible-
housing/consultation/published_select_respondent

www.TheCIE.com.au
172 Proposal to include minimum accessibility standards for housing in the National Construction Code
7.1 Prevalence of modifications, by selected mobility aids
Mobility aid Toilet, bath or
laundry
modifications
Ramps Structural
changes
Doors widened Kitchen
modifications
Electric wheelchair 0.6 0.5 0.3 0.3 0.2
Manual wheelchair 0.4 0.3 0.1 0.1 0.1
Walking frame 0.3 0.2 0.1 0.0 0.0
Walking stick 0.2 0.1 0.0 0.0 0.0
Note: Data is drawn from people who live in households, who have a mobility limitation. For each type of mobility aid, for each type of
modification, the data is the number of people who implement the relevant modification, divided by the number of people who use the
relevant aid.
Source: CIE.
As the above evidence suggests that not all people with limited mobility need all of the
accessibility features provided under the NCC, this suggests that Option 1 (Silver) will
provide some benefits, even though it is not accessible to all.
Review of the features provided under each option
Table 4.1 in chapter four summarises the features required under the proposal. These
features could be grouped by
■ dwelling access requirements
■ wider internal doorways and corridors
■ toilet
■ shower
■ kitchen and laundry
■ space for bedroom on entrance level
This section provides a detailed review of these features with respect to how they help
people with disability and older people.
Dwelling access requirements
In general, the dwelling access requirements under all options provide step-free access
into the dwelling via either a path from the perimeter of the property or from a parking
space. The main differences between the options are as follows.
■ Options 2 and 3 provide a wider access path, compared with Option 1 (1 100 mm
wide versus 1 000 mm wide)
■ Options 2 and 3 provide a wider entrance (850 mm), compared with Option 1
(820 mm).
In principle, step-free access should:
■ enable access (unassisted) for:
– users of some mobility aids (potentially including wheelchair users, users of
walking frames, crutches and walking sticks)
– people unable to lift their feet

www.TheCIE.com.au
Proposal to include minimum accessibility standards for housing in the National Construction Code 173
■ improve safety outcomes by removing a trip hazard.
However, it is not clear that a dwelling that complies with the step-free access
requirements under the NCC proposal would provide accessibility for all as explained
below.
■ Consistent with the LHDG, the proposed NCC access standard under all of the NCC
options allows for a 56 mm transition at the entrance.
– Discussions with accessibility experts211 suggest that many wheelchair users, users
of walking frames and others who are unable to lift their feet may be unable to
negotiate a 56 mm transition (unless a ramped threshold is provided).
– While this issue could potentially be addressed by providing a transition ramp, it is
not clear that a 56 mm transition ramp would be accessible for all
– A 56 mm threshold with a threshold ramp exceeds the maximum entry transition
used in some other standards.
… Similarly, the NDIS SDA Design Standards refer to the Australian standard
AS1428.1: Design for access and mobility (which applies to public buildings) and
allows a maximum threshold of 35 mm (and requires a threshold ramp for
entrance thresholds between 5 mm and 35 mm).212 This applies across all
SDA Design categories, including ‘Improved Liveability’ and ‘Robust’, where
many features are based on Silver requirements.
– It is not necessarily the case that a transition ramp would be used in all cases.
While it is reasonable to assume that someone who was prevented from accessing
their own home by a 56mm threshold would use a transition ramp, there are likely
to be circumstances where a transition ramp is not provided, including for visitors
(although presumably some households would provide a transition ramp if
friends/family with accessibility needs visited regularly).
■ The proposed accessibility standard allows for step-free access via a path from the
perimeter of the property or the garage.
Wider internal doorways and corridors
Wider doorways and corridors allow for easier movement around the dwelling, by
providing additional circulation space for users of some mobility aids (such as
wheelchairs and walking frames with wheels). Additional width can also be helpful
where a person with limited mobility requires assistance moving around the dwelling.
The main differences across the options are as follows.
■ Options 2 and 3 provide wider internal doorways (850 mm), compared with Option 1
(820 mm).
■ Options 2 and 3 provide wider corridors (1200 mm), compared with Option 1
(1000 mm).
211 Discussions with representatives from Occupational Therapy Australia, 10 December 2020;
and Professor Catherine Bridge, pers. comm. 8 December 2020.
212 NDIS, NDIS Specialist Disability Accommodation Design Standards, Edition 1.1, 25 October
2019, p. 25.

www.TheCIE.com.au
174 Proposal to include minimum accessibility standards for housing in the National Construction Code
■ The door widths may not be wide enough to meet all accessibility needs.
– Discussions with accessibility experts suggest that 820 mm doorways provided
under Option 1 are unlikely to be sufficiently wide for some people (such as
wheelchair users and potentially users of walking frames with wheels).213
– The 850 mm door width provided under Options 2 and 3 is somewhat consistent
with AS1428.1214 and is therefore likely to be sufficiently wide for at least
80 per cent of people with accessibility needs. However, this still may not be wide
enough to provide easy access for some people.
… Discussions with Occupational Therapy Australia suggest that some people
may require 900 mm or more.215
… The SDA Design Standards require wider door widths for ‘Fully Accessible’
(900 mm) and High Physical Support (950 mm) dwellings.216
Toilet
The main difference between the options in relation to toilet requirements is that Options
2 and 3 provide extra space (1200 mm between walls) compared with Option 1 (900 mm
between walls) where the toilet is provided in a separate room.
These requirements are broadly consistent with the requirements of an ambulant toilet
(i.e. a toilet that can be used by someone who can walk).217 However, feedback received
during consultation suggested it is not clear there would be sufficient space for a
wheelchair user to transition onto the toilet without assistance. In some cases it may be
possible to transition onto a toileting aid outside the bathroom/toilet cubicle and then
roll into position. 218 However, such an arrangement may not be suitable for everyone
and toileting aids will not necessarily be available for visitors.
The NCC proposal provides for reinforced walls to facilitate installation of grab-rails,
which is a feature of all regulatory options. In general, grab-rails are helpful for many
people with limited mobility. But this does not necessarily mean that grab-rails will be
installed. In particular, it is less likely that grab-rails would be installed:
■ for visitors
■ in rental properties (where evidence has been provided that landlords are reluctant to
allow any sort of modification).
This suggests the NCC requirements may not address accessibility issues for some people
in these contexts.
213 Discussion with representatives from Occupational Therapy Australia, 10 December 2020.
214 Standards Australia 2009, op.cit., p 57
215 Discussion with representatives from Occupational Therapy Australia, 10 December 2020.
216 NDIS, NDIS Specialist Disability Accommodation Design Standards, Edition 1.1, 25 October
2019, p. 26.
217 Standards Australia 2009, op.cit., Figure 53b, p 92
218 Professor Catherine Bridge, pers. comm. 8 December 2020.

www.TheCIE.com.au
Proposal to include minimum accessibility standards for housing in the National Construction Code 175
Shower
The requirements relating to showers are significantly different across options:
■ Option 1 requires:
– step-free access
– a removable shower screen.
■ Options 2 and 3 also require:
– Shower on ground floor/level of entry
– 900mm by 900mm shower space
– 1200mm by 1200mm adjacent space
Under Options 2 and 3, the shower is likely to be accessible for most people with
disability. The extra space would be beneficial for carers providing assistance with
showering.219
However, under Option 1 there is no requirement for a shower to be on the ground
floor/entry level. Where there is no shower on the ground floor/entry level, the house
may not be suitable for people who have trouble ascending and descending stairs (see
discussion below), without significant modification.
Kitchens and laundries
Under Option 1 (Silver), there is no requirement relating to accessibility of kitchens and
laundries.
It is therefore questionable whether a Silver-level dwelling would fully support
independent living for people with limited mobility without additional modifications.
Options 2 and 3 provide for additional space in kitchens and laundries. This additional
space would not necessarily make these spaces accessible for some people with limited
mobility (such as wheelchair users). For example, standard benches may not meet the
needs of wheelchair users. However, the additional space would allow kitchens and
laundries to be more easily adapted.
Space for bedroom on entrance level
Options 2 and 3 require a space that could be used as a bedroom to be provided on the
ground floor/entry level. If a resident acquired a disability that prevented them from
using stairs, this requirement would enable them to live satisfactorily on the ground
floor/entry level.
It is not clear whether the requirement for a space on ground-level that could be used as a
bedroom would have any material impact on housing designs. In principle, any space
(such as living spaces) could be used as a bedroom for the purposes of complying with the
NCC requirements, provided it also meets existing NCC requirements for natural light
and ventilation. However, in the event that a resident did acquire a disability, it is not
clear how practical this arrangement would be in some houses. For instance, partitioning
219 Discussions with Occupational Therapy Australia, 10 December 2020.

www.TheCIE.com.au
176 Proposal to include minimum accessibility standards for housing in the National Construction Code
off an area of the living space to be used as a bedroom may not be convenient for some
households.
Option 1 does not specifically require a space that could be used as a bedroom to be
provided on the ground floor/entry level. In principle a downstairs living space might be
converted to a bedroom. However, it is not clear how satisfactory this arrangement
would be in the longer term, particularly where there are other people living in the
dwelling.
Key points
Some general points that emerge from the discussion above are set out in table 7.2. These
points are further elaborated below.
7.2 Key points
Type of dwelling Silver standard Gold or Gold+ standard
Single storey (Class 1a)
dwelling
■ May be a suitable long-term dwelling for
some people with limited mobility (but
not wheelchair users and users of some
walking frames), assuming a transition
ramp would be provided.
■ May not be a suitable long-term dwelling
for wheelchair users, people who use a
scooter/gopher inside and some walking
frame users.
■ May be visitable for most people with
limited mobility, but only if a transition
ramp is provided.
■ May be a suitable long-term dwelling for
most (but not all) people with limited
mobility (assuming a transition ramp is
provided).
■ May be visitable for most (but not all)
people with limited mobility, but only if a
transition ramp is provided.
Two-storey (Class 1a)
dwelling
■ May not be a suitable long-term dwelling
for people with limited mobility (unless
bedrooms and showers are provided
downstairs or there are modifications to
allow people with limited mobility to get
to the upper floor).
■ May be visitable for some people with
limited mobility (except wheelchair users
and some users of walking frames).
■ May be a suitable long-term dwelling for
people with limited mobility (but may
require conversion of a downstairs living
space to a bedroom).
■ May be visitable for some people with
limited mobility.
Apartment (Class 2) on
the ground floor of a 3-
storey walk-up or in a 4+
storey complex
■ May be a suitable long-term dwelling for
some people with limited mobility.
■ May not be a suitable long-term dwelling
for wheelchair users, users of walking
frames.
■ May be visitable for people with limited
mobility.
■ May be a suitable long-term dwelling for
most (but not all) people with limited
mobility.
■ May be visitable for people with limited
mobility.
Apartment (Class 2)
above the ground floor in
a 3-storey walk-up
building
■ May not be a suitable long-term dwelling
for people with limited mobility.
■ May not be visitable for people with
limited mobility.
■ May not be a suitable long-term dwelling
for people with limited mobility.
■ May not be visitable for people with
limited mobility.
Source: CIE.
www.TheCIE.com.au
Proposal to include minimum accessibility standards for housing in the National Construction Code 177
Accessibility of NCC options
Some general points on the accessibility of the NCC options are as follows.
■ Options 2 (Gold) and 3 (Gold +) provide greater accessibility than Option 1 (Silver).
■ A Silver level dwelling is unlikely to be a long-term suitable dwelling for some people
with disability, including wheelchair users and some users of walking frames
(particularly those with wheels). However, it may provide adequate levels of
accessibility temporarily or for visitors.220
■ A Gold and Gold+ level dwelling would generally be suitable for most people with
disability. However, it may not provide sufficient accessibility to be a suitable
dwelling for people with high accessibility needs.
Two-storey homes
Dwellings built to Gold and Gold+ standard are required to:
■ provide space for a bedroom on entry-level
■ provide a shower on entry level.
In the event that a resident of a two-storey Gold or Gold+ standard dwelling acquires a
disability that limits their ability to climb stairs, these requirements mean they would be
able to use the ground-level bedroom space and remain living in the dwelling.
However, two-storey dwellings designed to comply with Silver-level requirements could
potentially retain a number of features that are ‘inaccessible’. It is therefore not clear that
two-storey dwellings would be accessible for people with limited mobility, even if
designed to meet Silver-level requirements.
Two-storey dwellings could continue to have internal stairs. Stairs can be a major issue
for people with disability and older people.
■ An (unpublished) survey of people over the age of 50 found that a single storey home
was among the most important design features respondents would look for in a future
home.
■ Some of the personal stories provided in submissions highlight the problems
associated with steps. For example, one of the case studies in the submission from
MDI and the Summer Foundation — Andrea’s story in Box J.10 — referred to
challenges associated with stairs. Andrea’s bedroom is located upstairs, which
requires her to sit and use her arms to push herself up and down the stairs.
A relatively common configuration of two-storey homes has living spaces downstairs and
bedrooms upstairs. These designs typically have a toilet downstairs, but full bathrooms
are often located upstairs.
People with limited mobility may be able to enter the dwelling; however, without
significant modifications, they would not necessarily be able to access:
■ the bedrooms, or
220 Discussions with Occupational Therapy Australia, 10 December 2020.

www.TheCIE.com.au
178 Proposal to include minimum accessibility standards for housing in the National Construction Code
■ the shower (there is no requirement for a shower to be downstairs under Silver).
General modelling assumptions
As demonstrated by the discussion above, modelling the differences between options is a
challenge. Accessibility needs are specific to each individual, making it difficult to
generalise about accessibility needs based on the information available from SDAC and
the extent to which the various options would address their needs.
Although, as established in the above discussion, the needs and abilities of people within
different groups (identifiable through SDAC cross-tabulations) could vary considerably, it
is necessary to define clear assumptions on which to base the modelling.
The modelling assumptions adopted are outlined below. They have been further refined
from the Consultation RIS based on information provided during consultation.
■ A Silver-level single-storey house/townhouse is:
– liveable (i.e. would avoid the costs estimated in chapter three) for people with
limited mobility living in the dwelling, except for wheelchair users (this is a
similar assumption to that used in the Consultation RIS)
– visitable for all people with limited mobility
■ A Silver-level double-storey house/townhouse (where a toilet is on the ground floor
but a bathroom with a shower/bedrooms are upstairs) is:
– not liveable for people with limited mobility and would therefore deliver no
benefits to these people
– visitable for all.
■ A Silver-level apartment on the ground floor of a 3-storey walk-up (with no lift) or in
4+ storey building is:
– liveable for all people with limited mobility except wheelchair users
– visitable for all people with limited mobility.
■ A Silver apartment above ground floor in a 3-storey walk-up is:
– not liveable for people with limited mobility
– not visitable for people with limited mobility.
■ A Gold or Gold+ level house (single or double-storey) is:
– liveable for all people with limited mobility
– visitable for all people with limited mobility.
■ A Gold or Gold+ level apartment on the ground floor of a 3-storey walk-up or in 4+
storey building is:
– livable for all people with limited mobility
– visitable for all people with limited mobility.
■ A Gold or Gold+ level apartment above the ground floor in 3-storey walk-up is:

www.TheCIE.com.au
Proposal to include minimum accessibility standards for housing in the National Construction Code 179
– not livable for people with limited mobility
– not visitable for people with limited mobility.
While it is impossible to model every individualised scenario as the needs of people with
disability vary and are highly individualised, these specific assumptions have been chosen
as it is more likely they will overstate rather than understate the benefits of the proposed
NCC standards for the following reasons:
■ houses/townhouses are assumed to be visitable for all, despite allowing for a 56 mm
transition threshold at the entrance, and
■ dwellings are assumed to be livable for renters with accessibility needs, even though
the landlord could possibly prevent them from installing grab-rails.
However, these assumptions are considered broadly reasonable from a high-level
modelling perspective based on the information available.
Specific modelling assumptions
The specific assumptions used in the modelling are set out below.
Proportion of wheelchair users
Based on the assumptions outlined above, housing designed to Silver level would not be
a suitable long-term dwelling for wheelchair users.
While wheelchair users are around 6 per cent of all people with limited mobility, they
tend to benefit from accessible housing more proportionately than other people with
disability. As a result, wheelchair users would represent more than a 6 per cent share of
people with the various problems estimated in chapter three. Table 7.3 reports the
estimated share of wheelchair users in each of the problems estimated in chapter three
and the adjusted size of the problem that could potentially be addressed through
mandating Silver-level dwellings. The adjusted size of the problem in table 7.3 is used as
a base to determine the benefits of Option 1 in the CBA subject to the allocation and
additionality adjustments (discussed in the next two sections).
7.3 Adjusted size of the problem
Cost item Share of wheelchair
users (%)
Adjusted size of the
problema ($ million)
Safety-related costs 6.1 100.61
Additional carer-related costs 8.1 862.06
Quality of life 10.5 1 712.18
Additional time in hospital/transition care 6.0 220.51
Home modifications 0.0 452.30
Additional moving costs 14.0 139.24
Premature/inappropriate entry into aged care 46.0 99.75
Cost of non-visitability n.a. 80.93
Families with young dependants n.a. 0.62

www.TheCIE.com.au
180 Proposal to include minimum accessibility standards for housing in the National Construction Code
Cost item Share of wheelchair
users (%)
Adjusted size of the
problema ($ million)
Short-term injuries n.a. 28.09
Total 3 696.29
Note: The adjusted size of the problem shown in the table is based on the central case assumptions.
Source: CIE (details are provided in chapter three and appendices B to I).
Number of inaccessible dwellings
CIE has employed the following assumptions relating to the accessibility of dwellings:
■ Double-storey houses built to Silver level that do not have a bedroom and/or a
shower on the entrance level are not a suitable long-term dwelling for people with
limited mobility.
■ Apartments in a 3-storey walk-up building that are above ground-level would not be a
suitable dwelling under any option.
As the number of high-rise residential towers has increased (particularly in the major
cities), the share of apartments in blocks that are 3-storeys or less has declined
significantly (chart 7.4).
■ Based on the most recent data, only around 10 per cent of new apartments are in
blocks that are 3-stories or less.
■ For the purposes of the CBA, it is assumed that two-thirds of these apartments would
not be suitable for people with limited mobility (i.e. dwellings on the ground floor
would be accessible, but not on the second and third storeys). This implies that
around 6.7 per cent of new apartments would not be accessible.
7.4 Share of new apartments in buildings 3-storeys or less
Data source: ABS.
To date, there is no data on:
■ the proportion of new build houses that are double-storey, or
0%
5%
10%
15%
20%
25%
30%
35%
40%
45%
2003-2004 2005-2006 2007-2008 2009-2010 2011-2012 2013-2014 2015-2016 2017-2018
Pe
r ce
nt
of
tota
l

www.TheCIE.com.au
Proposal to include minimum accessibility standards for housing in the National Construction Code 181
■ the proportion of double-storey houses that have no bedrooms or showers on the
entrance level.
With lot sizes declining (particularly in major cities), the proportion of double-storey
dwellings has reportedly been increasing.221
■ In their cost estimates, DCWC estimated that around 26 per cent of townhouses
would need to relocate the shower to comply with Gold and Gold+ requirements. On
this basis CIE assume that 26 per cent of townhouses would not be accessible due to
the shower being upstairs.
■ In the absence of other information, CIE also assumes that 26 per cent of separate
houses built to Silver level would be inaccessible for people with limited mobility due
to a lack of a bedroom and/or shower on the ground level.
Accessible housing as a share of the dwelling stock
Based on the assumptions outlined above and the dwelling projections presented
previously, the number of accessible dwellings as a share of the dwelling stock under the
various options is shown in chart 7.5.
7.5 Accessible dwellings as a share of the dwelling stock
Data source: CIE estimates.
As the characteristics of the dwelling stock (and the likelihood that a person with limited
mobility would live in an accessible dwelling — see below) varies, it is necessary to
differentiate between owner-occupied homes and rental properties.
It is assumed that the share of each type of dwelling (house/townhouse/apartment) that
is occupied by the owner or a renter is based on the current share of (from the 2016
Census) (table 7.6). Apartments account for a higher share of new dwellings than their
share in the existing stock and a greater proportion of apartments are used as rental
221 See for example: Dalton, T. Hurley, J. Gaharale, E. Wakefield, R. and Horne, R. 2013,
Australian suburban house building: industry, organization, practices and constraints, AHURI Final
Report No. 213, October 2013, p. 12.
0%
2%
4%
6%
8%
10%
12%
14%
16%
18%
20%
2022 2023 2024 2025 2026 2027 2028 2029 2030 2031
Sh
are
of
sto
ck
Option 1 - owner-occupied
Option 2 - owner-occupied
Option 4 - owner-occupied
Option 1 - rental
Option 2 - rental
Option 4 - rental

www.TheCIE.com.au
182 Proposal to include minimum accessibility standards for housing in the National Construction Code
properties. On this basis the share of rental properties is likely to continue to increase
over time.
7.6 New accessible dwellings by tenure
Type of dwelling Owner-occupied (%) Rental (%)
Separate houses 77 23
Townhouses 48 52
Apartments 32 68
Total 66 34
Source: 2016 Census.
Allocation of accessible housing to people with limited mobility
New housing is generally allocated through the market so it is not necessarily the case
that new accessible housing will be occupied (either purchased or rented) by those with
accessibility needs.
There are broadly two types of benefits from an increase in accessible housing under the
various options.
■ The greatest benefits (but not all) are contingent on people with accessibility needs
living in the additional accessible housing provided under the various options. The
extent of these benefits therefore depend on the extent to which people with limited
mobility live in the new accessible housing.
■ Additional accessible housing also has some benefits for people other than residents.
In particular, more accessible housing increases the ability for people with limited
mobility to visit family and friends. These ‘visitability’ benefits would generally be
proportional to the share of ‘visitable housing’ in the total dwelling stock. For
example, if there are 10 per cent visitable dwellings in the total housing stock, the cost
associated with a lack of visitability would be reduced by 10 per cent.
Increasing the stock of accessible housing would reduce the size of the problem
(estimated in chapter three) over time in the following ways.
■ The proportion of the population who acquire a disability already living in accessible
housing will increase over time.
■ For people not already living in accessible housing and who acquire a disability (or
have a pre-existing disability), there will be, in general, greater options available to
move to an accessible dwelling. The impacts are different for owner-occupiers and
renters based on the assumption that
– the proposed changes to the NCC would have minimal impact on owner-occupiers
due to a range of factors outlined below, and
– the proposed changes will significantly increase the proportion of renters moving.
www.TheCIE.com.au
Proposal to include minimum accessibility standards for housing in the National Construction Code 183
Owner-occupiers
As noted above, as accessible housing increases as a share of the stock over time, a
greater proportion of people (including both owner-occupiers and renters) will already be
living in accessible housing at the time they acquire a disability.
It is estimated that around 4.5 per cent of the total number of people with mobility
limitation due to disability have newly acquired the disability in the past year. This
estimate is based on:
■ the growth in the number of people with mobility limitation each year
■ plus: the estimated number of deaths (based on weighted-average mortality rates by
age).
This approach assumes that people with mobility-related disability have the same
age-specific mortality rates as the broader community. It effectively assumes that all
people with a mobility-related disability have that disability until their death (i.e. ignores
the possibility that a disability is resolved); and ignores the net impact of migration. It is a
reasonable approximation of the number of newly acquired disabilities in each period.
■ It is assumed that the proportion of owner-occupiers already living in accessible
housing when they acquire a disability will reflect the share of new accessible
housing built under a revised NCC in the total dwelling stock.
As the proportion of new accessible dwellings (i.e. those that would comply with the
proposed accessibility requirements) being built under the current code is not known, this
issue is addressed separately (see below).
For owner-occupiers who already have a mobility-related disability or acquire a
mobility-related disability and are not already living in accessible housing when they
acquire it, the benefits of the proposed changes to the NCC are less clear. In principle, the
stock of accessible housing would increase over time as a result of the proposed change to
the NCC. This would give these people (and their families) greater choice of accessible
dwellings should they choose to move to a dwelling that better meets their needs.
However, the following factors would limit the impact of the proposed changes to the
NCC on the available stock of accessible housing.
■ First, the option of building an accessible house that meets their specific needs is
already available to people who acquire a mobility-related disability. While there are
many reasons people do not choose this option including financial constraints,
location etc, the proposed regulation would not change this choice.
■ Second, to the extent that the regulation encourages additional accessible houses to be
built, it is likely that the initial owner would not have accessibility needs (if they did,
they would have chosen to build an accessible home under current conditions).
– The regulations are therefore unlikely to directly benefit the initial owner (unless
they acquire a disability while still living in the dwelling – see above).
– Additional accessible dwellings would become available to people with
accessibility needs only when the initial owner moves out. The RBA reports that

www.TheCIE.com.au
184 Proposal to include minimum accessibility standards for housing in the National Construction Code
owner-occupier turnover rates have been less than 4 per cent over recent years.222
This implies that on average it would take around 25 years for the accessible home
to become available for a person with accessibility needs to purchase.
Even if more accessible dwellings become available, there are a range of factors that
suggest that the number of people who would choose to move to a more accessible
dwelling would likely be relatively low for owner-occupiers.
■ SDAC data suggests that between 2 and 6 per cent of owner-occupiers have ever
moved because of their condition for reasons that are either directly or possibly related
to the characteristics of the dwelling. That said, the reason that some people have not
moved may have been a lack of available accessible dwellings.
■ Several stakeholders, as well as a number of studies stressed the importance of factors
such as affordability and location, as well as accessibility for the decision of buying a
house. Affordability and location issues could reduce the likelihood of people moving
to newly built accessible housing.
– In particular, the new accessible housing may not be in the preferred
neighbourhood for many people with a mobility-related disability.
… In NSW, just 11 (out of 131) LGAs account for 50 per cent of all dwelling
approvals223
… Currently, only 29 per cent of all people in NSW with a mobility limitation live
in these LGAs according to SDAC data
… Analysis of Census data suggests that more than 80 per cent of all people who
moved house over the past 5 years, moved within the same LGA. This
proportion increases to more than 90 per cent for people over the age of 65.
– The financial cost of moving house is relatively high for owner-occupiers relative
to renters because moving house for owner-occupiers generally involves buying a
new dwelling and selling the existing dwelling, both incurring transaction costs
(including stamp duties, real estate agent commissions and legal expenses). This
means that in many cases home modifications (where possible) may be more
cost-effective, particularly as home modifications are subsidised through the NDIS
and various aged care programs.
… Many households containing people with disability have lower than average
incomes (see chapter three).
… The financial cost of selling an existing home and buying a new one is
estimated at close to $30 000 (see table E.1 in appendix E).
222 Leal, H. Parsons, S. White, G. and Zurawski, A. “Housing Market Turnover”, Bulletin,
Reserve Bank of Australia, March 2017, p. 23.
223 Blacktown, Parramatta, Liverpool, The Hills Shire, Camden, Bayside, Cumberland, Penrith,
Canterbury-Bankstown, Sutherland Shire, Campbelltown, Central Coast

www.TheCIE.com.au
Proposal to include minimum accessibility standards for housing in the National Construction Code 185
… Stamp duties are a significant barrier to moving in most States and
Territories.224 Stamp duties can amount to tens of thousands of dollars
(particularly in the major cities).225
… Some older Australians on a full or part pension could lose their pension if they
choose to down-size as the family home is not included in the pension asset
test.
People with pre-existing mobility limitation (i.e. mobility limitation acquired prior to the
commencement of the proposed regulations) may be even less likely to be affected by the
increased availability of accessible housing. These people have already made a housing
choice at the point when they acquired the disability (although where the disability gets
worse over time, these choices may be constantly re-assessed). Furthermore, they may
have already made choices to accommodate their disability in their existing home (such
as through home modifications).
■ This discussion suggests that including an accessibility standard in the NCC is
unlikely to significantly affect owner-occupiers with pre-existing mobility-related
disability or those still living in inaccessible housing when they acquire a disability
in the future (in the CBA CIE assume that the regulation has no benefits for these
people), although a small number may benefit from increased choice of accessible
dwellings over time.
224 The ACT abolished stamp duties for eligible first home buyers from 1 July 2020 and continues
to reduce stamp duty rates for all home buyers; and NSW intends to phase out stamp duties
over time.
225 See for example, https://www.revenue.nsw.gov.au/taxes-duties-levies-royalties/transfer-duty
www.TheCIE.com.au
186 Proposal to include minimum accessibility standards for housing in the National Construction Code
Renters
As for owner-occupiers, the proportion of renters that are already living in accessible
housing at the time they acquire a disability will increase as the proportion of accessible
housing in the rental stock increases over time. Renters who acquire a disability may be
more likely to move as more accessible rental properties become available for the
following reasons.
■ Renters generally move more frequently than owner-occupiers226 (although the
proportion of renters with a mobility-related disability who have moved because of
their disability is only slightly higher than owner-occupiers at 15 per cent).
■ The financial disincentives for renters to move are less than owner-occupiers, as
renters do not incur stamp duties and selling agent commissions.
■ Renters are less likely to have already made home modifications to meet their
accessibility needs as landlords are reluctant to allow for major changes to their
property and tenants are required to make the property to its original condition when
the lease is ended.
The estimates of the share of renters with accessibility needs that are likely to live in an
accessible rental property under the proposed regulations are based on the following
assumptions.
■ The probability of a tenant with accessibility needs living in an accessible rental
property is likely to be related to the share of accessible properties in the rental stock.
Where the probability of a tenant with accessibility needs lives in an accessible
dwelling is equal to the share of accessible dwellings in the rental stock (e.g. if
accessible housing makes up 10 per cent of the dwelling stock, the probability of living
in an accessible house is 10 per cent), this implies ‘random allocation’.
■ It would be reasonable to assume that tenants with accessibility needs would value
accessibility features more highly than those without accessibility needs and would
therefore be more likely to be attracted to rental properties with these features.
However, the evidence from the stated preference survey of randomly-selected
households is mixed:
– There is some evidence that households containing a member with mobility
limitation are more likely to have a dwelling with some accessibility features.
– On the other hand, there were several accessibility features that were just as likely
to be present in households that did not include a member with mobility limitation
as those that did.
226 As of September 2019, property owners in Australia are now holding on houses for an average
of 11.3 years, while apartments average 9.6 years (see Lorusso, Vic 2020, Length of home
ownership in Australia reaches 10 year peak, https://www.homes.com.au/news/length-of-home-
ownership-in-australia-reaches-10-year-
peak/#:~:text=Facts%3A%20Average%20Home%20Ownership%20Length,while%20apartments%20av
erage%209.6%20years.). By contrast, renters on average stay in the same rental for 4.4 years (see
Goddard, Hayley 2017, ‘Victorian renters say in the same home longer than the national
average’, Herald Sun, 29 May 2017, https://www.realestate.com.au/news/victorian-renters-stay-in-
the-same-home-longer-than-the-national-average/).

www.TheCIE.com.au
Proposal to include minimum accessibility standards for housing in the National Construction Code 187
■ Based on the analysis of the survey results (weighting accessibility features by the
estimated willingness to pay for them), it can be determined that for renters,
households that include a member with mobility limitation are around 12.6 per cent
more likely to have accessibility features than rental households that do not contain a
member with mobility limitation (see discussions in appendix K for details).
■ Based on the above discussion, it is assumed that the probability that households
with accessibility needs live in an accessible rental property is 12.6 per cent higher
than the share of accessible properties in the rental stock.
For example, if 50 per cent of rental properties were accessible, this approach implies that
56.3 per cent (i.e. 50 x 1.126) of households with accessibility needs would live in
accessible rental properties.
Additionality
The benefits attributable to the proposed options could also depend on the extent to
which dwellings with accessibility features would have been provided under the baseline
scenario (i.e. the extent to which the accessibility features in dwellings built under the
new code are ‘additional’ and therefore can be attributed to the new code).
Under the proposed changes to the NCC, all (or most) new dwellings would need to
comply with the relevant standard. However, some proportion of new housing would
have included some or all of the accessibility features set out in the standard, even
without the proposed changes to the NCC. Previous estimates and stakeholder feedback
suggest that around 5-10 per cent of new stock current meets LHDG Silver standard.
Stakeholder feedback suggested that, although relatively few new dwellings incorporate
all of the design elements in the standard, a significant proportion incorporate at least
some of these design elements. This is also evident in DCWC’s cost weightings where
scenarios involving ‘no impact’ had significant weightings across some design elements,
indicating that compliance with the standards reflects current practice for these dwellings.
Where the proposed changes to the NCC reflect current practice for particular design
elements, there are no additional costs and benefits from the standard. These costs have
been excluded from our cost estimates (through a non-zero weighting on a ‘no impact’
scenario). This is in keeping with the approach adopted in the Consultation RIS.
Stakeholder submissions provided different suggestion on how these ‘baseline effects’
should be taken into account in estimating the benefits.
■ The HIA submission argued that as the weights used to derive the weighted-average
costs imply that many accessibility features are already provided, the benefits would
also need to be adjusted accordingly.227 This argument is consistent with the
approach in the Consultation RIS.
227 Simon Croft, op.cit., p. 30.

www.TheCIE.com.au
188 Proposal to include minimum accessibility standards for housing in the National Construction Code
■ On the other hand, some submissions suggested that dwellings must have all relevant
features to be accessible and that the features must be provided in a coherent way.228
To the extent that at least some accessibility features are currently provided in some
dwellings, the additional cost of complying with the proposed standard would reflect
only the cost of the features not already provided (as reflected in the weighted average
approach — see chapter six) and that providing these additional features would
provide all of the benefits of accessibility.
There is limited data on what features are needed by specific people and the extent to
which individual accessibility features provide benefits even when not combined with all
of the other accessibility features under the NCC options. However, on the basis of the
discussion in the second section (Accessibility of the NCC options) in this chapter, it may
be assumed that there is a distinction between wheelchair users and non-wheelchair
users. As noted in the Consultation RIS, all accessibility features are needed for the
dwelling to be suitable for wheelchair users. By contrast, for other people with disability
(non-wheelchair users), dwellings with some accessibility features could meet (at least
part of) their needs, even without some of the features provided under the various NCC
options.
The Consultation RIS reduced the benefits attributable to the NCC proposal based on the
extent to which the provision of the various features reduced costs. Consultation
feedback and additional evidence suggest that the relationship between the cost of a
particular accessibility feature and the benefits provided is weak.229
Where possible, the features provided under the base case are weighted by the estimated
WTP for each feature (and cost where a separate WTP estimate was not available).
Based on this approach, the benefits attributable to the NCC proposal is:
■ around 66 per cent of the total estimated benefits for Option 1
■ around 86 per cent of the total estimated benefits for Option 2
■ around 86 per cent of the total estimated benefits for Option 3.
The estimates of the average share of features provided in the baseline are presented in
appendix K.
The benefits where no adjustment is made to the benefits based on features provided in
the base case are estimated as an alternative scenario in sensitivity testing.
The benefits of a subsidy on accessible rental properties
This option would reduce the number of people living in rental properties that do not
meet their needs. Where this option provides an accessible rental property to a household
228 Margret Ward, op.cit., p.46.
229 See Carnemolla, P. 2015, Measuring non-shelter effects of housing design, A mixed-methods
exploration of home modifications, care-giving and health-related quality of life, A thesis in fulfilment of
the requirements for the degree of Doctor of Philosophy, University of NSW, Faculty of Built
Environment, pp. 116-119 and 127.

www.TheCIE.com.au
Proposal to include minimum accessibility standards for housing in the National Construction Code 189
with accessibility needs that would not otherwise be available, this option could
potentially:
■ reduce the number of falls
■ reduce the need for formal and informal care
■ improve quality of life
■ reduce some time spent in hospital or transition care
■ reduce premature or inappropriate entry into residential aged care.
However, this option is less likely to significantly:
■ reduce the costs associated with moving to a more accessible home (this option would
involve a person with disability moving to a subsidised accessible rental property and
could in fact increase the number of moves and therefore the cost)
■ reduce the cost of home modifications (as relatively few rental properties are
modified)
■ improve the ability of people with disability to visit family and friends
■ deliver benefits to households that do not contain a member with disability (as these
households would presumably not be eligible for a subsidy).
The assumed uptake profile (see chart 5.1) is presented as a percentage of the total
number of people with limited mobility that live in unmodified dwellings that require
assistance or have trouble moving around their place of residence (implying that their
home does not meet their accessibility needs) (chart 7.7). This is an indicator of the
extent to which a subsidy scheme could potentially reduce the extent of the problems
identified above.
7.7 Share of the problem addressed through a subsidy scheme
Note: This option reduces costs associated with: falls, additional care needs, reduced quality of life, additional time in hospital or
transition care and premature or inappropriate entry into aged care.
Data source: CIE estimates based on ABS, 2018 Survey of Disabilities, Ageing and Carers, TableBuilder.
0%
2%
4%
6%
8%
10%
12%
14%
2022 2023 2024 2025 2026 2027 2028 2029 2030 2031
Pe
r ce
nt

www.TheCIE.com.au
190 Proposal to include minimum accessibility standards for housing in the National Construction Code
Societal benefits
In the Consultation RIS, CIE estimated the community’s preference for more equitable
housing outcomes for people with disability and older Australians using a stated
preference survey. This was included in the CBA as a ‘societal benefit’.
The survey undertaken for this project (see appendix K for further information) included
a component designed to estimate household WTP to improve housing accessibility for
other people outside the household. The conservative estimate of average altruistic WTP
derived from the survey is around $40 per household per year for a policy scenario that
would increase the amount of accessible housing to 15 per cent by 2035 and “greatly
improve the chances of Australians with limited mobility finding suitable homes.”
This equates to $389 million annually across all households. Assuming an income
elasticity of WTP of 0.42, projected annual real wage growth of 0.25 per cent per year230
and the ABS Cat No. 3236 Series II household projections (extrapolated beyond 2041 to
2066), this equates to $6.9 billion in present value terms.
For the purpose of deriving benefit estimates for options that partially solve the problem,
it is assumed that this $40 amount represents the value households place on solving the
problem completely by 2035.
CIE considers that the limited amount of information provided in the questionnaire
would have given respondents the impression that the policy would solve the problem,
particularly the comparison between two figures that were provided — the 15 per cent of
housing stock that would be accessible by 2035 and the 5 per cent of Australians who
have a disability and use a mobility aid.
It is assumed that a partial solving of the problem by 2035 would be valued
proportionately to the extent to which the problem is solved. For each of the options, the
$6.9 billion figure above is scaled in this way. Specifically, the assumptions used to
estimate the benefits for the Decision RIS imply that by 2035:
■ Option 1 would address around 11 per cent of the problem
■ Options 2 and 3 would address around 13 per cent of the problem
■ Option 4 would address around 5 per cent of the problem
■ Option 5 would address around 15 per cent of the problem.
Estimating the societal benefits acknowledges that the primary beneficiaries of these
proposals are people with disability and older Australians (as well as savings on
government programs that assist these people). However, as discussed in chapter one
(refer to the subsection ‘Approach to the RIS’ on pages 27-28), OBPR guidance material
(including the COAG RIS Guidelines), requires that weighing up equity considerations
against the costs and benefits of the proposal is best left to decision-makers, rather than
directly incorporated into the CBA.
230 Based on the recent slowdown trend in Australian real wage rate, see Gilfillan, Geoff 2019,
The extent and causes of the wage growth slowdown in Australia, Research Paper Series, 2018-19,
Parliamentary Library, table 3, p.25,
https://parlinfo.aph.gov.au/parlInfo/download/library/prspub/6609740/upload_binary/6609740.pdf

www.TheCIE.com.au
Proposal to include minimum accessibility standards for housing in the National Construction Code 191
As such, the ‘societal benefits’ are not included in the central case CBA.
They are, however, included in the sensitivity analysis (in the next chapter) as additional
information for decision-makers.

www.TheCIE.com.au
192 Proposal to include minimum accessibility standards for housing in the National Construction Code
8 Cost-benefit analysis
This chapter combines the costs and benefits discussed in the previous two chapters using
a cost-benefit analysis framework.
Estimated net benefits and costs
The estimated costs and benefits of Options 1-5 in present value terms over the 10-year
regulatory period (using a discount rate of 7 per cent) are shown in table 8.1. The benefits
of all dwellings constructed over the regulatory period are estimated over the (assumed)
40-year life of the dwelling. These have been discussed in chapter five (subsection ‘Time
periods’ on page 146).
Based on the benefits that were able to be quantified, the CBA results suggest the
following.
■ All of the options involving changes to the NCC are estimated to impose a net cost on
the community.
■ Option 5 (involving a generalised subsidy program to encourage additional accessible
rental properties) is estimated to deliver a significant net benefit. This option is not
formally under consideration, so this program is in effect hypothetical and as such not
ready to be implemented. This option is included in the CBA to compare regulatory
options (Options 1-4) with non-regulatory options, consistent with the RIS guidelines.
The CBA results demonstrate that this more targeted approach could be more
effective in addressing the specific problem associated with renters.
8.1 Estimated net benefits/costs
Option 1 ($
million)
Option 2 ($
million)
Option 3 ($
million)
Option 4 ($
million)
Option 5
($ million) a
Benefits
Avoided safety costs 99.16 164.05 164.64 64.35 88.97
Avoided carer-related costs 590.80 998.90 1 002.47 391.79 541.70
Quality of life improvements 1 173.43 2 036.32 2 043.59 798.70 1 104.29
Avoided time in hospital/transition care 151.13 249.68 250.57 97.93 135.40
Avoided home modifications 341.89 530.95 532.85 208.25 287.93
Avoided moving costs 95.43 172.33 172.94 67.59 0.00
Avoided entry into residential aged care 75.85 218.25 219.02 85.57 116.17
Visitability benefits 112.79 147.48 148.01 33.78 0.00
Benefits for families with young
dependants 0.86 1.13 1.13 0.26 0.00

www.TheCIE.com.au
Proposal to include minimum accessibility standards for housing in the National Construction Code 193
Option 1 ($
million)
Option 2 ($
million)
Option 3 ($
million)
Option 4 ($
million)
Option 5
($ million) a
Benefits for short-term injuries 39.15 51.19 51.37 11.73 0.00
Total benefits 2 680.50 4 570.28 4 586.61 1 759.95 2 274.47
Costs
Construction costs -5 243.10 -17 906.95 -23 591.51 -4 699.84 0.00
Opportunity cost of space -1 255.38 -7 709.42 -9 393.51 -7 596.93 0.00
Compliance verification costs - 290.49 - 290.49 - 290.49 - 83.82 0.00
Industry re-training costs - 28.47 - 28.47 - 28.47 - 28.47 0.00
Subsidy 0.00 0.00 0.00 0.00 -1 076.70
Total costs -6 817.44 -25 935.33 -33 303.98 -12 409.06 -1 076.70
Net benefit/costs -4 136.94 -21 365.05 -28 717.37 -10 649.11 1 197.77
Benefit-cost ratio 0.39 0.18 0.14 0.14 2.11
a For Option 5, the proposed subsidy covers the value of industry costs, which are assumed to be willingly adopted.
Note: The cost-benefit analysis includes the lifetime costs and benefits of all dwellings constructed over a 10-year regulatory period
from 2022 to 2031 (including the lifetime benefits of these dwellings over 40 years), using a discount rate of 7 per cent.
Source: CIE estimates.
A point to note is that the opportunity cost of space under Option 4 (applying the Gold
standard to new Class 2 buildings only) has a different trend to construction costs, when
comparing to those under Option 2 (applying Gold to both Class 1a and Class 2
buildings) – construction costs reduce significantly from $18.9 billion under Option 2 to
close to $5.0 billion for Option 1, while opportunity cost of space changes only
marginally from $7.7 billion to $7.6 billion. This is because the net opportunity cost for
Class 1a building is relatively small (only $25/m2) while that for Class 2 building is
significant ($3 836/m2) as reported in table 6.7 in chapter six.
Qualitative assessment of Option 6
The aim of Option 6 (enhanced voluntary guidance) would be to encourage voluntary
provision of accessible housing through improving the effectiveness of the existing LHA
voluntary certification scheme. An enhanced voluntary option could potentially increase
the supply of accessible dwellings, without imposing excessive regulatory costs on
homebuilders.
The reasons the current voluntary arrangements have been relatively ineffective at
encouraging voluntary uptake of LHA compliant dwellings are not entirely clear.
■ There is evidence of significant demand for accessible housing.
– As discussed above (see Chapter three), people with accessibility needs have
trouble finding accessible housing. This indicates demand for accessible housing
(but not necessarily housing with LHA accreditation)
– The stated preference survey for the Consultation RIS also suggested significant
demand from the general community for accessibility features (although it is
possible that the stated preference survey does not capture the community’s true
preferences). The survey suggested that the WTP of many members of the
community (including many without specific accessibility need) is higher than the

www.TheCIE.com.au
194 Proposal to include minimum accessibility standards for housing in the National Construction Code
cost. Where the value buyers place on these accessibility features are higher than
the cost, we generally expect to see these design features adopted voluntarily.
However, this does not align with the reported low uptake of the LHDG.
■ Yet industry submissions argued that a lack of demand has been a key contributor to
low uptake. In particular, HIA attributed the low uptake partly to a failure to generate
demand from home owners and residents through education and promotion of the
LHDG.231
This suggests that while there is significant demand for accessible housing, there is not
necessarily demand for LHA accredited housing. Without demand for accredited
housing, there is little incentive for home-owners and investors to obtain accreditation
(industry stakeholders have suggested that not all LHA-compliant dwellings obtain
accreditation).
The underlying reasons why there appears to be little demand for LHA certified
dwellings despite evidence of significant demand for accessible housing could include the
following.
■ A lack of awareness of the LHA voluntary certification scheme and what it means.
■ Deficiencies in services available to match buyers and sellers (although there are some
specialised services available). Some stakeholders noted cases where homes are
advertised as accessible, but in reality lack key accessibility features.232 This increases
the time and effort associated with finding and securing an accessible home233 and is
frustrating for people with accessibility needs.
Stakeholders had mixed views on the effectiveness of this option.
■ Industry groups tended to support this option, arguing it could be effective. The
submissions from both HIA and MBA argued that publishing the LHDG as an ABCB
Handbook would raise its profile and increase uptake of accessible options.
■ Other stakeholders noted that voluntary approaches do not work, given the existing
voluntary initiatives over the last two decades have failed to achieve significant uptake
of accessible housing.234
Publishing agreed accessibility standards as a voluntary handbook (the component that is
within the ABCB’s area of responsibility) could raise awareness (as noted by HIA, the
ABCB’s subscriber base is nearly 250 000 people). However, on its own, this may do little
to encourage uptake of accessible design as there currently appears to be little incentive to
either invest in accessible design or to obtain certification.
However, together with other measures (that are not within the ABCB’s area of
responsibility), it is possible that an enhanced certification scheme could create a market
for LHA certified homes and encourage further uptake. In particular:
231 See Simon Croft, op.cit., pp.15, 30-31.
232 ABCB 2019, Accessible Housing Options Paper: Consultation Report, April 2019, p. 56.
233 Hayley Stone, op. cit., p. 18
234 See for example, Margret Ward, op.cit., 9.48.

www.TheCIE.com.au
Proposal to include minimum accessibility standards for housing in the National Construction Code 195
■ Increased effort to raise awareness of the certification scheme among buyers could
create demand for LHA certified housing (reflecting the underlying demand for
accessible housing).
■ Although there are currently some specialised services that advertise accessible
housing, these services could be improved. For example, an ability to search
specifically for LHA certified housing on mainstream real estate websites could help
to raise awareness of the certification scheme. This could:
– reduce search costs (and frustration) associated with finding accessible housing
through the provision of reliable independently verified information
– allow property owners to buy and sell homes as assets that can be reliably
advertised as ‘accessible’, and potentially earn additional returns for these assets,
where the market supports this. This increases their incentive to pay for
accessibility features that go beyond their own needs, as they may be able to
recoup costs via renting or selling the property to someone who needs the
additional features. In turn, this increases incentives for the building industry to
supply more homes with accessibility features.
Although an enhanced voluntary scheme could encourage some additional uptake of
LHA compliant designs, it is unlikely to achieve the targets that were previously set by
the National Dialogue on Universal Housing Design and would not therefore meet the
aspirations of many advocates.
Qualitative assessment of exemptions
In its proposed changes to the NCC, the ABCB has included ‘exemptions’ for
circumstances where a step-free access path (Clause 1.1) would not need to be provided
for a new Class 1a home. In these circumstances the exemption is applicable for the step-
free access requirement only; all other requirements still apply.
The purpose of these exemptions is to reduce cases where costs to meet the step free path
requirements are unreasonably large (for example, on a lot with significant slope) and
cases where meeting the standard is potentially unfeasible (for example, a small lot where
dwelling sits on the boundary).
While exemptions would reduce both benefits and costs, they are generally intended to
apply to dwellings where compliance costs are disproportionately high and can therefore
improve the net benefit of the proposal.
Exemptions and interpretation
The proposed exemptions are not specified in terms of objective criteria and are therefore
open to interpretation. Issues of ‘practicality’, ‘insufficient space’, and so on are matters
of interpretation. Their impact would therefore depend on how they are implemented by
governments and how they are interpreted by appropriate authorities.
As an example, there is no clear definition for small lots. Some state and local
governments provide different definitions of ‘small lots’; for example,

www.TheCIE.com.au
196 Proposal to include minimum accessibility standards for housing in the National Construction Code
■ In Victoria, a lot is defined as ‘small’ if it less than 300 m2.235
■ The Brisbane City Council defines a small lot as less than 450 m2 (600 m2 where the
lot is a ‘rear lot’, excluding the driveway).236
■ In Western Australia, development approval is required for the erection of a single
house on any lot that is smaller than 260 m2, except where it complies with a local
structure plan or local development plan.237
While the 1:14 slope condition for exemption238 appears definitive, it may still be subject
to interpretation in combination with other requirements. The Drafting of Proposed NCC
Changes notes a dwelling is exempt if: 239
■ It is not practicable to provide step-free access via a garage or parking space, and
■ One of the following is true:
– To provide an external step free access path would necessitate construction of
ramping that exceeds the length and gradient allowed
– There is insufficient space on the site to accommodate a compliant step-free access
path
– The average slope of the ground on which the access path would be constructed
exceeds 1:14
It could be interpreted that even if a house is built on a site where one or more of the
three criteria (including the slope criteria) listed above are applicable, it is not exempt
from step free access if step free access via a garage or a parking place could be achieved.
Difficult to determine the number of new builds impacted by exemption
There is insufficient data to reliably estimate the number of Class 1a buildings that would
be exempt from the step free access requirement.
Two data sources may be used to provide some indicative estimates.
■ NSW Government topography data240 suggests that around 12 per cent of sites in
future potential greenfield development have a total slope (across the whole site)
greater than 1:14.
235 Victoria Planning Authority 2019, Small lot housing code, November 2019, p 2, https://vpa-
web.s3.amazonaws.com/wp-content/uploads/2020/06/Small-Lot-Housing-Code-November-2019.pdf,
accessed January 2021.
236 Brisbane City Council Small lot projects. See: https://www.brisbane.qld.gov.au/planning-and-
building/do-i-need-approval/residential-projects/dwellings/small-lot-projects, accessed January 2021
237 WA Government 2018, R-Codes State Planning Policy 3.1, p. 6,
https://www.dplh.wa.gov.au/getmedia/5dce3eb2-abe9-4fc3-bbab-
92cc89f0b5cf/State_Planning_Policy_3-1-Residential_Design_Codes-for-mobile, accessed January
2021
238 ABCB 2021, ABCB Standard for Livable Housing Design, p.4
239 ABCB 2021, Accessible Housing Drafting of Proposed NCC Changes, February 2021 p.14.
240 See https://maps.six.nsw.gov.au/clipnship.html

www.TheCIE.com.au
Proposal to include minimum accessibility standards for housing in the National Construction Code 197
■ About 11 per cent of separate houses and townhouse developments in Victoria
between 2005 and 2016 were built on lots less than 300 m2.241 This share is likely to
have grown significantly, as lot sizes in Victoria have fallen significantly over time.242
While the conditions for exemption are subject to interpretation as discussed above, this
limited data may suggest that up to 10-15 per cent of new Class 1a buildings could be
exempt from step free access requirement.
Potential impact of exemptions
As more extreme cost assumptions are associated with more obvious exemptions, it is
reasonable to assume that the estimated construction cost would be applied in cases
closer to the average (where interpretation is likely to be most common). Where
properties are exempt from the step-free access requirement, a significant proportion of
the proposal’s costs due to other requirements are still incurred. As shown in table 6.1,
under Option 1, an exempt townhouse and an exempt detached house would still incur
77 per cent and 84 per cent of additional costs, respectively. For Option 2 and Option 3,
these percentages are above 90 per cent.
Detached houses and townhouses account for about 56 per cent and 15 per cent of new
dwellings, respectively. Exemptions are not applicable to apartment buildings which have
higher compliance costs than Class 1a buildings. Assuming 15 per cent of Class 1a
buildings are exempted, the exemption would see compliance cost in weighted average
terms reduced by:
■ 1.6 per cent for Option 1
■ 0.6 per cent for Option 2
■ 0.4 per cent for Option 3.
The impact of exemption on benefits is complicated. There are different ways to measure
the impact on benefits. One way is to assume that benefits change in proportion to the
change in costs. CIE suggest it would be too extreme to assume that all, or none, of the
benefits are lost without the step free access.
The WTP results present a middle point of the above assumptions. As shown in
table K.17 in appendix K, WTP for step free access account for 59 per cent, 29 per cent
and 33 per cent of total WTP, respectively, under Options 1, 2 and 3. Assuming
15 per cent of Class 1a buildings are exempt, the benefits may fall by 6.3 per cent,
3.0 per cent and 3.5 per cent, respectively, for Options 1, 2 and 3.
Given that the potential for higher than average costs can’t be known, due to a lack of
data, the impact of exemptions on the proportion of new builds can’t be estimated with
accuracy.
241 SGS Economics and Planning 2019, Planning Schemes Research, Draft Report V2, June 2019,
Table 7, p.38
242 UDIA 2020, State of the Land 2020 National Residential Greenfield and Apartment Market Study,
p.46 See: https://udia.com.au/research/udia-state-of-the-land-2020/, accessed January 2021.

www.TheCIE.com.au
198 Proposal to include minimum accessibility standards for housing in the National Construction Code
With all these factors considered, and assuming reductions in costs under the average
case (where interpretation is likely to be more common) for the step free path are
representative, the above discussion indicates that benefits may reduce disproportionately
to costs in all but extreme cases. In other words, the CBA results presented above, which
do not apply exemptions and assume average construction costs and full benefits for all
new builds, are more likely to understate the costs and/or to overstate the benefits.
Scenario and sensitivity analysis
As the CBA was prepared based on limited evidence and there were differing stakeholder
views on some input assumptions, it is important to test the sensitivity of the estimated
impacts to alternative assumptions. This provides insights into the robustness of the
conclusions drawn from the CBA result.
The potential impact of qualitative but not quantifiable benefits
As discussed above, CIE has made every effort to quantify as many of the costs and
benefits that the available information would allow. There are a number of potentially
significant benefits that are not able to be completely quantified in economic terms and
are not presented in the central case of the CBA. These are noted below.
Societal benefits
Many stakeholders have put forward the reasonable view that concepts such as human
rights (including compliance with the UN Convention on the Rights of Persons with
Disability) and social justice are critical to any decision on whether to include a
minimum accessibility standard in the NCC. These issues relate to the distribution of
benefits and costs within the community (i.e. many of the benefits would accrue to
disadvantaged groups and also in cost savings to programs to assist these groups).
Consistent with OBPR Guidance, these issues cannot be resolved through CBA. 243
Weighting benefits which accrue to certain groups, against the costs imposed on other
members of the community, are judgements decision-makers are best placed to make.
To support decisions making with respect to the societal benefits, CIE’s stated preference
survey was used to measure the community’s preference for equitable housing outcomes
for people with mobility-related disability (including older members of the community)
(see discussion in chapter three from page 113 on). This provides a way to include some
of these benefits in the CBA.
The CBA results with the inclusion of these societal benefits as informed by the stated
preference survey, are presented in table 8.2. This has been included as information for
decision-makers.
243 Office of Best Practice Regulation 2020, Guidance Note, Cost-Benefit Analysis, March 2020, pp.
12-13.

www.TheCIE.com.au
Proposal to include minimum accessibility standards for housing in the National Construction Code 199
While these societal benefits are estimated to be significant, the sensitivity analysis
indicates that the broad conclusions from the central case CBA remain unchanged.
8.2 Net benefits/costs including societal benefits
Benefit/cost Option 1
($ million)
Option 2
($ million)
Option 3
($ million)
Option 4
($ million)
Option 5
($ million)
Benefits included in central case 2 680.50 4 570.28 4 586.61 1 759.95 2 274.47
Societal benefits a 666.62 794.92 794.92 301.46 978.00
Total benefits (including societal benefits) 3 347.12 5 365.20 5 381.52 2 061.41 3 252.47
Estimated costs -6 817.44 -25 935.33 -33 303.98 -12 409.06 -1 076.70
Net benefits/costs -3 470.32 -20 570.13 -27 922.46 -10 347.65 2 175.77
Benefit-cost ratio 0.49 0.21 0.16 0.17 3.02
a As with other benefits, the estimates of the societal benefits differ across options because each option provides different levels of
accessibility.
Note: The cost-benefit analysis includes the lifetime costs and benefits of all dwellings constructed over a 10-year regulatory period
from 2022 to 2031 (including the lifetime benefits of these dwellings over 40 years), using a discount rate of 7 per cent.
Source: CIE estimates.
Employment benefits
The main employment-related benefits include improved productivity and more
employment opportunities for people with mobility-related disability. Although the
qualitative evidence suggests that accessible housing can improve productivity and
employment opportunities for working age people with disability, there was insufficient
quantitative evidence to quantify these benefits.
The analysis presented in appendix J suggests that these benefits could be significant. An
assessment of these benefits suggests that up to around $500 million per year could be a
reasonable upper bound estimate.
The net benefits/costs of the proposal after including the employment-related benefits (as
calculated above) is shown in table 8.3. While these estimates suggest that the
employment-related benefits could potentially be significant, they are not significant
enough to change the CBA results from negative to positive. The broad conclusions from
the central case of CBA hold with the inclusion of employment benefits.
8.3 Net benefits/costs including employment-related benefits
Benefit/cost Option 1
($ million)
Option 2
($ million)
Option 3
($ million)
Option 4
($ million)
Option 5
($ million)
Benefits included in central case 2 680.50 4 570.28 4 586.61 1 759.95 2 274.47
Employment benefits a 342.67 532.17 534.07 208.73 1 345.01
Total benefits (including employment
benefits) 3 023.17 5 102.45 5 120.67 1 968.68 3 619.48
Estimated costs -6 817.44 -25 935.33 -33 303.98 -12 409.06 -1 076.70
Net benefits/costs -3 794.27 -20 832.88 -28 183.31 -10 440.38 2 542.78
Benefit-cost ratio 0.44 0.20 0.15 0.16 3.36
a As with other benefits, the estimates of the employment benefits differ across options because each option provides different levels
of accessibility.

www.TheCIE.com.au
200 Proposal to include minimum accessibility standards for housing in the National Construction Code
Note: The cost-benefit analysis includes the lifetime costs and benefits of all dwellings constructed over a 10-year regulatory period
from 2022 to 2031 (including the lifetime benefits of these dwellings over 40 years), using a discount rate of 7 per cent.
Source: CIE estimates.
Societal and employment benefits
The broad conclusions from the central case CBA also hold when both the societal and
employment-related benefits are included (table 8.4).
8.4 Net benefits/costs including societal and employment-related benefits
Benefit/cost Option 1 ($
million)
Option 2 ($
million)
Option 3 ($
million)
Option 4 ($
million)
Option 5 ($
million)
Benefits included in central case 2 680.50 4 570.28 4 586.61 1 759.95 2 274.47
Societal benefits a 666.62 794.92 794.92 301.46 978.00
Employment benefits a 342.67 532.17 534.07 208.73 1 345.01
Total benefits (including both societal and
employment benefits) 3 689.79 5 897.37 5 915.59 2 270.14 4 597.48
Estimated costs -6 817.44 -25 935.33 -33 303.98 -12 409.06 -1 076.70
Net benefits/costs -3 127.65 -20 037.96 -27 388.39 -10 138.92 3 520.78
Benefit-cost ratio 0.54 0.23 0.18 0.18 4.27
a As with other benefits, the estimates of the societal and employment benefits differ across options because each option provides
different levels of accessibility.
Note: The cost-benefit analysis includes the lifetime costs and benefits of all dwellings constructed over a 10-year regulatory period
from 2022 to 2031 (including the lifetime benefits of these dwellings over 40 years), using a discount rate of 7 per cent.
Source: CIE estimates.
Sensitivity analysis
As noted in previous chapters, there is significant uncertainty associated with the above
estimates on both the cost and benefit sides, largely due to data limitations. It is therefore
important to test the robustness of the results (and the conclusions drawn from the
analysis) with alternative assumptions.
Alternative allocation assumptions for owner-occupiers
A key finding from the CBA is that although the problems associated with a lack of
accessible housing are relatively significant, the NCC options are estimated to have a
relatively modest impact in the near to medium term. This is largely because under the
NCC options accessible housing is allocated through the market (rather than through an
administrative process), meaning that the additional accessible housing will not
necessarily be allocated to people with accessible needs.
One of the key assumptions in the CBA is that owner-occupiers with a pre-existing
mobility limitation (or that acquire one while living in inaccessible housing) will not
move from their current residence to new accessible housing.
■ A key rationale for this assumption can be summarised as follows.

www.TheCIE.com.au
Proposal to include minimum accessibility standards for housing in the National Construction Code 201
– People with accessibility needs already have the option of building a new house
that meets their accessibility needs. The proposed regulation will not change the
incentive (including affordability) of this option.
– Additional accessible homes as a result of changes to the NCC would not become
available for people with accessibility needs to purchase until the original owner
moves out. On average this would take 25 years.
■ Other reasons include:
– New accessible housing constructed under a revised NCC would not necessarily be
located in preferred locations.
– Many people have a preference to remain in their current home.
– In many cases, the financial costs associated with moving house for
owner-occupiers (including stamp duties and other transaction costs) would make
home modifications more cost-effective.
The first argument above implies that consumers have control over the design of the
dwelling. This is largely the case for new houses, but less so for townhouses and
apartments, which are often purchased off the plan (although the other barriers to
owner-occupiers moving to newly constructed accessible dwellings apply equally to all
types of dwellings).
To test the sensitivity of the CBA results to this assumption, an alternative scenario
where some owner-occupiers move to newly constructed accessible townhouses and
apartments is considered. The alternative assumption is that the proportion of
owner-occupiers that move to newly constructed accessible townhouses and apartments
reflects the share of these dwellings in the total owner-occupied dwelling stock. These
‘movers’ are in addition to the increase share of owner-occupiers who live in accessible
housing at the time they acquire their disability, which is reflected in the central case
assumption.
Some points to note:
■ One of the benefits of mandating that new dwellings comply with an accessibility
standard is to avoid unnecessary moves and to facilitate ‘ageing in place’. If this
assumption were to hold, more owner-occupiers with disability would move house
incurring additional moving costs (these costs are estimated at close to $30 000 plus
stamp duty). The cost of these additional moves has not been included in the
estimates below.
■ Based on SDAC data, around 88 per cent of owner-occupiers with limited mobility
living in the community currently live in separate houses. This assumption would
therefore require a large number of owner-occupiers to move from a separate house to
a townhouse or apartment. Survey evidence suggests that around 40 per cent of older
Australians who ‘downsize’ move from a house to a townhouse or apartment.244
244 James, A. Rowley, S. and Stone, W. 2020, Effective downsizing options for older Australians,
AHURI Final Report No. 325, Australian Housing and Urban Research Institute Limited, p.
98.

www.TheCIE.com.au
202 Proposal to include minimum accessibility standards for housing in the National Construction Code
Alternative allocation assumptions for renters
A significant share of the benefits arise from the increased availability of accessible rental
properties. However, the extent to which these accessible rental properties would be
allocated to renters with accessibility needs is not known.
The central case CBA assumed that the probability of a renter with accessibility needs
moving to a new accessible rental property is around 12.6 per cent higher than the share
of new accessible rental properties in the stock based on an analysis of the stated
preference survey data.
Two scenarios are tested:
■ As a lower bound scenario, the probability of a renter with accessibility needs living in
a new accessible rental property is the same as the share of new accessible rental
properties in the stock (random allocation scenario).
■ As an upper bound scenario, the probability of a renter with accessibility needs living
in a new accessible rental property is assumed to be 25 per cent higher than the share
of new accessible rental properties in the stock (high allocation scenario).
Sensitivity analysis for benefits
The allocation assumptions are a key uncertainty in relation to the benefits estimates.
Other areas of uncertainty and additional scenarios tested include the following.
■ The CBA assumes that under Option 1 some dwellings (including double-storey
houses and townhouses with the only bedrooms and shower not on entry level) are
not livable for people with limited mobility, even if compliant with the proposed
standard. The share of these dwellings is not known. The CBA assumes the share
would be around 26 per cent for both houses and townhouses (based on DCWC’s
estimate relating to townhouses). The following alternative scenarios are also tested.
– As a low alternative assumption, it is assumed that 16 per cent of houses and
townhouses would not be livable for people with disability, even with compliant
with the proposed standard under Option 1.
– As a high alternative assumption, it is assumed that 36 per cent of houses and
townhouses would not be livable for people with disability, even with compliant
with the proposed standard under Option 1.
■ For some of the problems identified (including safety-related costs, reduced quality of
life, additional moving costs, premature or inappropriate entry into aged care, costs of
non-visitability, costs to families with young dependants and short-term injuries), a
range is estimated and in some cases the range is relatively wide. Alternative scenarios
using low and high estimates of benefits are therefore tested.
■ Dalton and Carter (2020a) suggested that OBPR’s preferred VSL of $4.9 million may
be too low.245 The benefits are also tested using Dalton and Carter’s preferred VSL of
$7.0 million. This also implies a Value of a Life Year of around $304 000 (rather than
$213 000 preferred by OBPR).
245 Dalton, A. and Carter, R. 2020a, op.cit., p. 26.

www.TheCIE.com.au
Proposal to include minimum accessibility standards for housing in the National Construction Code 203
■ To take into account the fact that a significant proportion of new housing built under
the current code will have some accessibility features (although relatively few houses
will have all of the features in the proposed standard), the benefits attributable to the
NCC proposal were reduced. However, in response to stakeholder suggestions that
dwellings must have all the accessibility features to be accessible, a scenario is
considered whereby all of the accessibility benefits are attributed to the NCC.
Sensitivity analysis for costs
Key uncertainties in relation to the cost estimates and our approach to sensitivity testing
are as follows.
■ The weightings underpinning the costings are mainly based on DCWC’s professional
judgement, as limited responses and reliable data were received at consultation.
Rather than testing the sensitivity to each weighting, the sensitivity of the results can
be seen in the cost change per dwelling required for each option to break-even.
■ Whether the opportunity cost of additional space requirements has been measured
correctly. Some stakeholders suggested that any loss of amenity could be minimised
through better design or that the increase in the capital value of the dwelling as a
result of the additional space would offset the additional cost. To test the extent to
which the opportunity cost of space affects the CBA results, CIE tested a scenario that
excludes the opportunity cost of space.
■ The approach to verifying compliance with the proposed NCC standards is also not
known and a range of possible costs were estimated. The impact of using the low and
high alternative assumptions is therefore tested.
CBA parameters
The sensitivity of the results to alternative CBA parameters is also tested.
■ Consistent with OBPR requirements, net benefits are calculated under alternative
discount rates, 3 per cent and 10 per cent. A 5 per cent discount rate scenario is also
tested to provide additional information for decision makers.
■ The CBA is based on a 10-year regulatory period. However, as only around 2 per cent
of the dwelling stock is added per year, the impact on the size of the problem is
relatively modest. As a long-term strategy, the impacts over a 20-year regulatory
period are also estimated.
■ The benefits are estimated over the life of the dwelling, assumed to be 40 years. Some
submissions suggested this should be longer. In response to this suggestion, a scenario
where the life of the dwelling is assumed to be 50 years is also tested.
Sensitivity analysis for central case CBA
Table 8.5 shows the estimated benefit-cost ratio under these alternative input
assumptions/parameters as well as the break-even analysis.
■ A benefit-cost ratio greater than 1 indicates that the benefits are greater than the costs.
■ A benefit-cost ratio less than 1 indicates that the costs are greater than the benefits.

www.TheCIE.com.au
204 Proposal to include minimum accessibility standards for housing in the National Construction Code
8.5 Sensitivity and break-even analysis — benefit-cost ratio under alternative
assumptions
Assumptions Option 1 Option 2 Option 3 Option 4 Option 5
Break-even analysis
Change in cost per dwelling to break even
($) -3 010 -15 544 -20 893 -26 850 n.a.
Sensitivity analysis (BCR)
Central case 0.39 0.18 0.14 0.14 2.11
Alternative allocation assumption for owner-
occupiers 0.57 0.26 0.20 0.21 2.11
Random allocation for renters 0.36 0.16 0.13 0.13 2.11
Higher allocation for renters (25% higher
than random allocation) 0.43 0.19 0.15 0.16 2.11
Opportunity cost of space excluded 0.42 0.18 0.14 0.14 2.11
Low problem scenario 0.37 0.18 0.14 0.14 2.11
High problem scenario 0.48 0.25 0.19 0.37 2.11
High VSLa 0.28 0.13 0.10 0.10 1.54
No adjustment for baseline effects
(Additionality) 0.62 0.28 0.22 0.23 3.38
10% discount rate 0.41 0.18 0.14 0.14 2.11
5% discount rate 0.37 0.17 0.14 0.14 2.11
3% discount rate 0.40 0.18 0.14 0.14 2.15
20 year regulatory period 0.60 0.20 0.16 0.16 2.11
50-year life of dwelling 0.29 0.13 0.10 0.11 2.11
a reflects the value of statistical life (VSL) suggested by Dalton and Carter (2020a).
Source: CIE estimates.
Sensitivity analysis for CBA including employment and societal benefits
Table 8.6 shows the break-even analysis and the BCRs when the societal benefits and the
upper bound estimate of employment impacts are included.
8.6 Sensitivity and break-even analysis with societal and employment benefits
being included in the central case — benefit-cost ratio under alternative
assumptions
Assumptions Option 1 ($
million)
Option 2 ($
million)
Option 3 ($
million)
Option 4 ($
million)
Option 5 ($
million)
Break-even analysis
Change in cost per dwelling to break even
($) -2 276 -14 580 -19 927 -25 566 n.a.
Sensitivity analysis (BCR)
Central case 0.54 0.23 0.18 0.18 4.27
Alternative allocation assumption for owner-
occupiers 0.79 0.33 0.26 0.27 4.27

www.TheCIE.com.au
Proposal to include minimum accessibility standards for housing in the National Construction Code 205
Assumptions Option 1 ($
million)
Option 2 ($
million)
Option 3 ($
million)
Option 4 ($
million)
Option 5 ($
million)
Random allocation for renters 0.36 0.16 0.13 0.13 2.11
High allocation for renters (25% higher than
random allocation) 0.59 0.25 0.19 0.20 4.27
Opportunity cost of space excluded 0.58 0.23 0.18 0.18 4.27
Low problem scenario 0.50 0.23 0.18 0.18 4.27
High problem scenario 0.66 0.32 0.25 0.47 4.27
High VSL:a 0.43 0.18 0.14 0.14 3.69
No adjustment for baseline effects
(Additionality) 0.77 0.33 0.26 0.27 5.54
10% discount rate 0.56 0.23 0.18 0.18 4.27
5% discount rate 0.51 0.22 0.18 0.18 4.27
3% discount rate 0.55 0.23 0.18 0.19 4.30
20 year regulatory period 0.77 0.26 0.20 0.21 4.27
50-year life of dwelling 0.41 0.17 0.13 0.14 4.20
a reflects the value of statistical life (VSL) suggested by Dalton and Carter (2020a).
Source: CIE estimates.
Key finding from sensitivity testing
Key findings from the sensitivity and break-even analysis outlined above are as follows.
■ When the community’s preference for more equitable housing outcomes for people
with disability is included in the CBA, the costs are still estimated to outweigh the
benefits. This is one way of incorporating benefits related to equity, human rights and
social justice into CBA. However, weighing up these benefits against the net costs
imposed on other members of the community is ultimately a matter for
decision-makers.
■ One of the main unquantified benefits from more accessible housing relate to
improved productivity and greater employment opportunities for those members of
the community with accessibility needs. Even though these employment-related
benefits could be significant, the analysis shows they are unlikely to be sufficiently
large to change the outcome of the CBA.
■ Under all scenarios outlined above and tested, the costs associated with all of the
NCC options are estimated to outweigh the benefits, suggesting that this finding is
reasonably robust.
– The CBA results are generally relatively sensitive to the assumptions around
market allocation, which is a key area of uncertainty.
– Extending the period over which the proposed regulatory change are analysed
tends to result in a modest improvement in the CBA results. This reflects two
factors: the size of the problem is estimated to increase over time; and changes to
the NCC become more effective in addressing the problem as the share of
accessible dwellings in the housing stock increases.
■ For the breakeven figure to be achieved the cost of Options 1-4 would need to have
been significantly overestimated, as changes to the weightings would imply greater

www.TheCIE.com.au
206 Proposal to include minimum accessibility standards for housing in the National Construction Code
provision of particular design features under the baseline would counteract the
benefits from mandating these features. This is considered to be unlikely.
■ On the other hand, the benefits associated with a subsidy program to provide
accessible housing for renters with mobility-related disability is estimated to outweigh
the costs under all scenarios tested. Although this option is outside the ABCB’s area
of responsibility, it is included as an alternative non-regulatory option as opposed to
the regulatory options (Options 1 to 4). The finding suggests that a more targeted
approach to addressing the issue of a lack of accessible rental properties is likely to be
more cost-effective than changing the NCC, but the option has not been subject to a
detailed, operational analysis. As this approach is targeting a limited number of rental
properties, it would not fully address visitability issues which would require all
dwellings to be accessible.
These findings will be discussed in the next chapter to form the conclusion of the RIS.

www.TheCIE.com.au
Proposal to include minimum accessibility standards for housing in the National Construction Code 207
9 Conclusions
Inaccessible housing is a significant problem
The costs associated with inaccessible housing are a large and growing problem for the
community. More than 3 million Australians have a mobility limitation and/or a
self-care limitation due to disability, with more than 90 per cent living within the
community.246 This is estimated to increase to around 4.5 million people by 2040.
Despite their disability, more than 80 per cent of people with limited mobility living in
the community have no difficulty moving around their residence,247 suggesting that their
housing generally meets their needs.
Table 9.1 reports the estimated number of people who may be affected by inaccessible
housing with respect to the type of problems associated with inaccessibility. The numbers
across problem type are not additive because one person may have multiple problems.
9.1 Number of people affected by lack of accessible housing per year
Problem Estimated number of people affected per year
Safety-risks 325 100
Additional care needs 453 400
Quality of life 554 400
Additional time in hospital/transition care 159 900
Home modifications per annum a 21 790
Additional home moves Range of 6 400 – 17 300
Premature/inappropriate entry into residential aged care Range of 2 767 – 6 199
Inability to visit family and friends-(vistability) 85 800
Families with young dependants Up to 16 000
Short-term injuries 17 551
a Assumes one person per relevant modification per year
Note: the number of people affected is not additive across each type of problem.
Source: CIE – population is estimated on the basis of analysis in appendices B-J.
While the number of people affected by inaccessible housing appears a small proportion
of the total population, the costs to the community for those whose needs are not met (or
who have incurred significant cost in having their needs met) are estimated to be
246 Based on data from the 2018 Survey of Disabilities, Ageing and Carers.
247 Based on data from the 2018 Survey of Disabilities, Ageing and Carers.

www.TheCIE.com.au
208 Proposal to include minimum accessibility standards for housing in the National Construction Code
significant. The costs to the community are assessed and estimated around each type of
problem. For quantifiable costs they are additive.
■ The costs associated with inaccessible housing that were able to be quantified are
estimated to range between around $3 billion and $6.5 billion per year based on 2018
data.
■ These costs are estimated to increase to between $4.5 billion and $9.9 billion per year
by 2040.
Discussion of results
NCC options
The costs of each of the NCC options considered as part of the RIS were estimated to
outweigh the benefits, although not all of the benefits were able to be quantified.
One of the main benefits that were not able to be quantified were the employment-related
benefits. Although there is qualitative evidence to support the proposition that
inaccessible housing can contribute to poorer employment outcomes among people with
limited mobility, this evidence does not enable robust quantification.
However, sensitivity analysis presented in the previous chapter suggests that these
benefits are unlikely to be sufficiently large to change the outcome of the CBA. Including
these unquantifiable benefits in the CBA would still result in net cost.
The key factors that drive the net cost outcome of the CBA are as follows.
■ The cost of complying with the proposed requirements are estimated to be non-trivial,
in the order of several thousand dollars per dwelling. These estimates are
conservative, compared with most cost estimates from industry submissions that
ranged from $3 000 to over $55 000 (table 6.2 in chapter six).
■ As new dwellings contribute around 2 per cent of the dwelling stock per year, changes
to the NCC will address the problem slowly over time. The impacts are estimated to
be modest in the near to medium term.
■ Addressing the problem through the NCC is generally a blunt approach to addressing
the problems associated with inaccessible housing. A mandatory accessibility standard
in the NCC would result in a large number of accessible dwellings being built,
although a relatively small share will be occupied by people with accessibility needs
through the market process. There are many factors affecting who may purchase or
rent a dwelling with accessible features, as discussed in the ‘allocation’ section in
chapter eight.
■ There is a risk with adopting a universal design approach to accessible housing that
one size does not fit all. In particular, it is possible that the accessibility features
provided under the NCC proposal are not needed by most of the population (i.e. the
benefits are likely to be small), while the features may not be sufficient to meet the
needs of those with significant accessibility needs (i.e. the universal design features are
in some cases less stringent than some other accessibility standards – see the
discussion in chapter seven).

www.TheCIE.com.au
Proposal to include minimum accessibility standards for housing in the National Construction Code 209
There are two important caveats around these findings.
■ The CBA does not explicitly take into account distributional impacts. In particular,
the benefits of the proposal would mostly accrue to people with disability and older
Australians and their families (and also reduce costs to government support
programs).
■ The CBA is based on limited evidence of the benefits of universal design as discussed
in chapters three (statement of the problem) and seven (estimating the benefits) in
particular.
Distributional impacts
Several stakeholders advocated for minimum accessibility standards on human rights and
other equity grounds. These arguments can be summarised as follows.
■ People with disability should have the same access and housing choices as other
members of the community. They should have access to mainstream housing options,
rather than segregated housing that specifically caters for those with accessibility
needs.
■ Australia has an obligation to implement the recommendation of the Committee on
the Rights of Persons with Disabilities to introduce a minimum accessibility standard
into the NCC.248
Consistent with the COAG RIS Guidelines, the key analytical tool adopted in this RIS is
CBA. CBA is based on utilitarian principles, where the costs and benefits on all members
of the community are considered equally. This approach does not take into consideration
distributional impacts, although as suggested by stakeholders these impacts are important
when considering the provision of accessible housing.
Consistent with the COAG RIS Guidelines, decision-makers are best placed to weigh up
the distributional impacts against the net cost of the proposal. In particular:
“Distributional judgements are properly made at the political level. In the interests of avoiding
subjective bias, analysts should, by and large, refrain from attaching distributional weights to
cost and benefit streams. Exceptions might be where there are unambiguous government policy
objectives to assist specific groups in the community, and where the justification for special
assistance to these groups relative to other groups is clearly established. However, for reasons
of transparency, decision-makers and the public should be made fully aware of the costs of
government action aimed at benefiting particular individuals or groups in the community.”249
For the Consultation RIS, CIE estimated the community’s preference for fairer outcomes
for people with disability and older people through a stated preference survey.
To provide some guidance to decision-makers, an estimate of these societal benefits is
included as part of the scenario analysis. When these benefits are included, all of the
248 Note that CIE is not in a position to offer a legal opinion on whether Australia has an
obligation to implement the recommendations of the Committee on the Rights of Persons with
Disabilities.
249 Council of Australian Governments 2007, Best Practice Regulations: A Guide for Ministerial
Councils and National Standards Setting Bodies, October 2007, p. 26.

www.TheCIE.com.au
210 Proposal to include minimum accessibility standards for housing in the National Construction Code
NCC proposals are estimated to impose a net cost to the community (see the scenario
and sensitivity analysis section, especially tables 8.4 through 8.6 in chapter eight).
However, some stakeholders have suggested this approach did not capture the full range
of benefits.
Though CIE has attempted to include all benefits in its CBA assessment, some benefits
resist quantification. Decision-makers are best placed to weigh up factors, such as social
justice for people with disability and policies to progress Australia’s human rights
commitments under the UNCRPD against the net cost imposed on other members of the
community.
Limited research in the literature
Although there is much qualitative evidence on the costs associated with inaccessible
housing, there is little robust quantitative evidence on the number of people who require
accessible housing and the benefits of universal design.
■ Although SDAC is a detailed and reliable source of information, there is little detail
on accessibility needs in relation to housing and the extent to which these needs are
met. As such, the estimates in this report are mainly based on inferences, rather than
direct evidence.
■ Most of the literature on the impacts of accessible housing relates to home
modifications. However, the benefits of universal design cannot necessarily be
extrapolated from the impacts of bespoke home modifications.
■ There is limited quantitative evidence on some of the key benefits.
– In particular, there is limited evidence on the impact of universal design on some
of the key benefits (which together are likely to contribute most of the total),
including:
… quality of life
… care needs and
… employment outcomes.
– In some cases, the benefits were not able to be quantified at all.
The lack of a strong body of quantitative evidence creates room for different
interpretations of the available evidence and the need to make general assumptions that
are contestable. In this regard, although CIE’s sensitivity testing suggests it is unlikely,
the possibility that the proposal could deliver a net benefit cannot be completely ruled
out. For example, it is possible that some of the benefits may be much larger than
estimated based on CIE’s interpretation of the available evidence. If strong quantitative
evidence was to emerge in the future that the benefits were significantly understated in
the CBA, the conclusions may need to be re-considered.
Under COAG best practice principles, the RIS must demonstrate the benefits of the
restrictions to the community as a whole outweigh the costs. In this context, the lack of
strong quantitative evidence to support the proposal tends not to strengthen the case for
change.

www.TheCIE.com.au
Proposal to include minimum accessibility standards for housing in the National Construction Code 211
Non-regulatory options
The Decision RIS also considered two non-regulatory options:
■ a generalised subsidy scheme to target a lack of accessible rental properties – Option 5
■ an enhanced voluntary code – Option 6.
While a subsidy scheme is outside of the ABCB’s area of responsibility, it is included in
the analysis to test whether regulatory options deliver more net benefits than non-
regulatory options. Consistent with the COAG RIS Guidelines, a RIS must establish not
only that the benefits of a regulatory proposal outweigh the costs, but also that it is the
best policy approach to meet the objectives (i.e. delivers the greatest net benefits). As
such, regulatory options must be tested against alternative approaches to meet the
objectives.
As this option is not formally under consideration, the design of a subsidy scheme
(including eligibility requirements) has not been fully developed. Furthermore, the speed
with which such a scheme could be developed is likely to be much slower than estimated
in the CBA.
Nevertheless, the CBA suggests that a subsidy scheme to provide accessible rental
properties to people with accessibility needs is a more targeted and therefore more
cost-effective approach to at least partially addressing the problems associated with
inaccessible housing than through the NCC. In particular:
■ renters are often unable to make modifications to a rental property because landlords
are reluctant to approve modifications
■ renters are unable to take advantage of subsidies on home modifications.
The benefits and costs of an enhanced voluntary code were unable to be quantified.
However, construction of more accessible homes is likely to be beneficial. Although it is
acknowledged that a voluntary approach has not seen high levels of adoption in the past
(which means the impact of enhanced measures may be limited), any relatively low-cost
initiatives to encourage voluntary uptake of more accessible dwellings would be
beneficial.
Findings of analysis
This RIS has investigated the inclusion of minimum accessibility housing standards in
the NCC. It considers the costs and benefits of options to ensure housing is built to meet
the needs of all Australians, drawing on the best available information, supported by
important lived experiences and information received during consultation.
Although a lack of accessible housing imposes a significant and growing cost on the
community (incurred mostly by people with disability and older people), this RIS
concludes that regulatory options to amend the NCC for all new houses and apartments
based on Silver, Gold and Gold + impose costs that outweigh the benefits.
To provide a comparison to the regulatory options, this RIS also looked at two non-
regulatory options (Options 5 and 6). Analysis of Option 5 (conceptual targeted

www.TheCIE.com.au
212 Proposal to include minimum accessibility standards for housing in the National Construction Code
subsidies), undertaken on a general basis, suggests the potential for a net benefit, noting
the analysis of Option 5 and Option 6 were conducted in general and on limited terms.
The CBA provides quantitative information to inform policy decisions. In an effort to
provide further information, the RIS also discusses broader impacts to society including
employment and productivity benefits and the community’s preference for more
equitable outcomes in housing.
Finally, the CBA is not the only input to decision making. Decision-makers are best
placed to weigh up factors, such as social justice for people with disability supporting
more inclusive communities and ageing in place, as well as Australia’s future progress
towards international human rights treaties, against the net cost imposed on other
members of the community.
www.TheCIE.com.au
Proposal to include minimum accessibility standards for housing in the National Construction Code 213
A Consultation summary
The Centre for International Economics (CIE) prepared the Consultation Regulation
Impact Statement (Consultation RIS) for the proposal to include minimum accessibility
standards for housing in the National Construction Code (NCC).250
The Consultation RIS provided a basis for review and input from a range of stakeholders
including advocacy groups, industry and the general public.
Public consultation on the Consultation RIS extended from 6 July to 31 August 2020.
Consultation was conducted through the ABCB’s Consultation Hub platform251 which
featured 36 structured questions to assist the public to provide their feedback on relevant
parts of the Consultation RIS. Submissions were also received outside the Consultation
Hub.
There were 203 submissions in total, with 98 submissions responding through the
Consultation Hub, and the remaining being submitted separately.
Among the 203 submissions, there were 114 public submissions, 63 anonymous
submissions, and 26 confidential submissions. Public submissions are identified by the
respondent name while anonymous ones by their unique ID number on the ABCB
consultation website252. Confidential submissions are not published and are not
identified explicitly in this RIS. The phrase ‘a/one submission’ is used when referencing
feedback from a confidential submission.
CIE has conducted three follow-up consultations to better understand how the proposed
accessible features benefit people with accessibility needs. These consultations were held
with Professor Catherine Bridge of the Home Modification Information Clearinghouse;
Madison Silver, Michael Barrett, Emily Steel and Tammy Aplin of Occupational
Therapy Australia (OTA); and Michael Fox AM (access consultant).
This appendix summarises the views expressed in the submissions received during public
consultation on the Consultation RIS. It is structured around the topics discussed in the
Consultation RIS. The appendix does not provide comments and/or responses to the
submission received. It is discussed in chapter two in the main body of the report.
250 CIE 2020, Proposal to include minimum accessibility standards for housing in the National Construction
Code: Consultation Regulation Impact Statement, July 2020,
https://consultation.abcb.gov.au/engagement/consult-ris-accessible-
housing/supporting_documents/Consultation_RIS_Proposal_to_include_minimum_accessibility_standa
rds_for_housing_in_the_NCC.pdf
251 https://consultation.abcb.gov.au/engagement/consult-ris-accessible-housing/
252 https://consultation.abcb.gov.au/engagement/consult-ris-accessible-
housing/consultation/published_select_respondent

www.TheCIE.com.au
214 Proposal to include minimum accessibility standards for housing in the National Construction Code
Size of the problem
General assessment
Despite the high number of nil answers to many of the questions around the problem,
more respondents agreed that the problem in the Consultation RIS is adequately
established (Question 8) and the extent of the problem is adequately described (Question
9) (chart A.1).
The following subsections discuss the specific issues raised in the submissions which
would affect the estimation of the size of the problem.
A.1 Problem established and the extent of the problem
Note: answers to Questions 8 and 9.
Data source: Consultation Hub.
Impacts to the broader community
A number of submissions suggested that the Consultation RIS should consider the costs
to a wider community that inaccessible housing has caused, rather than costs to people
with mobility disability and older Australians. For example, one submission expressed
concern that the Consultation RIS was ‘only using the information from the
exceptionally small cross section of the community who have a strong personal interest in
the matter, and treating it as is it is somehow ‘broadly representative.’253
Spinal Life Australia suggested the following people need accessible housing:254
253 Anonymous Submission 462974436, answer to Question 12, accessed 1 December 2020,
https://consultation.abcb.gov.au/engagement/consult-ris-accessible-
housing/consultation/published_select_respondent
254 Submission by John Mayo for Spinal Life Australia, p.2-3, accessed 1 December 2020,
https://consultation.abcb.gov.au/engagement/consult-ris-accessible-
housing/consultation/published_select_respondent
0 20 40 60 80 100 120 140
Yes
No
Not answered
No of submissions
Problem established?
Adequate extent?

www.TheCIE.com.au
Proposal to include minimum accessibility standards for housing in the National Construction Code 215
■ people with disability in order to participate in their community as Australians
without disability do
■ people over 60s to manage diminishing functionality associated with ageing, to age in
place, and to maintain their local relationships through peers and family with
diminished functionality being able to visit them
■ people with a medical condition (illness, muscular, respiratory and cognitive) to
manage diminished functionality associated with their medical condition and aging,
to age in place, and to maintain their local relationships through peers and family with
diminished functionality being able to visit them, and
■ young families to seek accessibility in order that aging grandparents (and their peers)
can participate in the lives of their children and contribution in supporting their
family.
Accordingly, the populations affected by inaccessible housing are:
■ people with short-term injuries and chronic health conditions
■ families rather than individuals with accessibility needs, and
■ the general public.
These are discussed in detail below.
People with short-term injury and chronic health conditions
Several submissions (including Specialist Disability Accommodation (SDA) Alliance255)
noted that the analysis in the Consultation RIS has not taken into account the potential
benefits of accessible housing to people with temporary injuries.
SDA Alliance and ANUHD256 suggested that people with chronic health conditions but
not identified as having disability are affected by the lack of accessibility. These chronic
illnesses include:
■ mental and behavioural conditions (4.8 million people);
■ back problems - 4.0 million people (16.4 per cent)
■ arthritis - 3.6 million people (15.0 per cent)
■ asthma - 2.7 million people (11.2 per cent)
■ diabetes mellitus- 1.2 million people (4.9 per cent) comprising Type 1 Diabetes -
144,800 people (0.6 per cent) and Type 2 Diabetes - 998,100 people (4.1 per cent)
■ heart, stroke, and vascular disease - 1.2 million people (4.8 per cent)
■ osteoporosis - 924,000 people (3.8 per cent)
■ chronic obstructive pulmonary disease (COPD) - 598,800 people (2.5 per cent)
255 Submission by Melanie Southwell for SDA Alliance, answer to Question 9, accessed 1
December 2020, https://consultation.abcb.gov.au/engagement/consult-ris-accessible-
housing/consultation/published_select_respondent
256 Submission by Margret Ward for ANUHD, p.10, accessed 1 December 2020,
https://consultation.abcb.gov.au/engagement/consult-ris-accessible-
housing/consultation/published_select_respondent

www.TheCIE.com.au
216 Proposal to include minimum accessibility standards for housing in the National Construction Code
■ cancer - 432,400 people (1.8 per cent)
■ kidney disease - 237,800 people (1.0 per cent)
According to SDA Alliance, in 2017-18, two thirds (67.0 per cent) of Australian adults
were overweight or obese (12.5 million people), a condition that is on the increase not
only in numbers but also in severity. There is also a large increase in the incidence of
obesity in people aged 18-24 years. It has been established that, for many people, obesity
leads to chronic health problems later in life.257
Submissions also suggested that pregnant women and young families would also benefit
from accessible housing.
Post-Polio Victoria (PPV) suggested that the accessibility needs of the hearing impaired
and those with psycho-social disability need to be considered, as per the UN Committee
on the Rights of Persons with Disabilities’ Concluding Observations on the Initial Report of
Australia, adopted by the Committee at its Tenth Session (2-13 September 2013).258
Person-based versus family-based approach
Some submissions made the point that the analysis is flawed because it is based on the
impacts on the person with a mobility-related disability, rather than the household. The
submissions made the point that people with disability live in households – accessible
housing is not about individuals; it is about households (families).
Broader community
Some submissions suggested that the impact of inaccessible housing on the general public
has not been considered in the Consultation RIS.
For example, the SDA Alliance259, PM&D Architects P/L260, among others, were
concerned that the true and realistic estimate of cost to the community from a lack of
accessible housing was not fully captured. They agreed with Dalton and Carter
(2020a)261 that the significant benefits that flow directly from improved design and
functionality to the general community were not included.
257 Melanie Southwell, op.cit., answer to Question 9
258 Submission by Barbary Clarke for Post-Polio Victoria, p. 10, accessed 1 December 2020,
https://consultation.abcb.gov.au/engagement/consult-ris-accessible-
housing/consultation/published_select_respondent
259 Melanie Southwell, op.cit., answer to Question 11
260 Submission by Geoffrey Barker for PM&D Architects P/L, answer to Question 11, accessed 1
December 2020, https://consultation.abcb.gov.au/engagement/consult-ris-accessible-
housing/consultation/published_select_respondent
261 Dalton, Andrew and Rob Carter 2020a, Economic advice prepared to assist with responses to the
Consultation Regulation Impact Statement on minimum accessibility standards for housing in the
National Construction Code, prepared for the Melbourne Disability Institute, University of
Melbourne and the Summer Foundation, 18 August 2020, as Appendix 1 of the submission by
Melbourne Disability Institute (MDI) and Summer Foundation to the public consultation.

www.TheCIE.com.au
Proposal to include minimum accessibility standards for housing in the National Construction Code 217
Physical Disability Council of NSW (PDCN) argued that liveable housing design (LHD)
has benefits across the broader population for the following reasons:262
■ the benefit of decreased general trips and falls in the home across all population
demographics
■ the benefit of childcare being able to be provided by older relatives in the home
■ benefits in terms of savings across the NDIS, Aged Care system and individuals’
personal funds for modifications to homes
■ benefits stemming from a reduced need for mobility aids
■ benefits from reduced need for respite services
■ better health outcomes for carers, particularly mental health costs
■ less time and resources spent looking for suitable accommodation, both for the
individual and their carers/advocates
■ benefits in terms of cost saving relating to homelessness for persons with physical
disability who cannot secure affordable/accessible accommodation
■ benefits accruing from individuals being able to remain in the workforce for longer
and delay retirement
■ benefits associated with delayed physical decline from existing medical conditions,
and
■ benefits of increased capacity for formal and informal volunteer work
It is noted that some of these reasons relate to other items associated with the size of the
problem (benefits).
Ageing in place
A number of submissions, including:
■ Housing for the Aged Action Group (HAAG)263
■ Shelter WA264
■ Spinal Life Australia265
■ Jacqueline Marks266
262 Submission by Hayley Stone for Physical Disability Council of NSW (PDCN), p.18, accessed
1 December 2020, https://consultation.abcb.gov.au/engagement/consult-ris-accessible-
housing/consultation/published_select_respondent
263 Submission by Gemma White for Housing for the Aged Action Group, p.2, accessed 4
December 2020, https://consultation.abcb.gov.au/engagement/consult-ris-accessible-
housing/consultation/published_select_respondent
264 Submission by Michelle Mackenzie for Shelter WA, p.5, accessed 4 December 2020,
https://consultation.abcb.gov.au/engagement/consult-ris-accessible-
housing/consultation/published_select_respondent
265 John Mayo, op.cit., p.2-3
266 Submission by Jacqueline Marks, accessed 4 December 2020,
https://consultation.abcb.gov.au/engagement/consult-ris-accessible-
housing/consultation/published_select_respondent

www.TheCIE.com.au
218 Proposal to include minimum accessibility standards for housing in the National Construction Code
■ Victorian Council of Social Service (VCOSS)267
■ Department of Communities, Housing Advisory Unit WA268
noted that costs associated with care for those remaining in their family home are much
lower than residential aged care, whether care is provided through formal or informal
means.
Therefore, housing designs that support enabling people with care needs to remain in
their home are important in reducing the calls on the residential aged care system,
reducing costs to government. The cost savings associated with in home care have been a
major reason guiding policies around ageing in place.
As cited by the submissions, Judd et al (2010)269 found that most older home owners
(over 90 per cent) prefer to age in place – usually in their present dwelling, modifying
their home and using care services in the home. However in a survey of older home
owners, around a third (34 per cent) had made modifications to their house to make it
safer or easier to use, with the most common modifications being grab rails, modified
bathrooms or stairs.
One submission highlighted mixed appeal for universal, adaptable or visitable designs
among older people. On the one hand, as quoted by the submission, Judd et al (2010)
found that most older people support adaptable or universal design (85 per cent and 78
per cent respectively see it as important) compared to moving house or visitable design
(68 per cent and 65 per cent seeing as important). On the other hand, the submission
quoted a study by James et al (2019)270 that found, when asked about the most important
physical features they aspired to in their housing, only 28 per cent regarded accessible or
universally designed housing as an important physical characteristic in their housing, and
similar numbers regarded adaptability as an important characteristic in a house.
267 Submission by Karen Taranto for VCOSS, p.9, accessed 4 December 2020,
https://consultation.abcb.gov.au/engagement/consult-ris-accessible-
housing/consultation/published_select_respondent
268 Submission by Coralie Ayres for Department of Communities, Housing Advisory Unit WA,
answer to Question 8, accessed 4 December 2020,
https://consultation.abcb.gov.au/engagement/consult-ris-accessible-
housing/consultation/published_select_respondent
269 Judd, B., D. Olsberg, J. Quinn, L. Groenhart and O. Demirbilek 2010, Dwelling, land and
neighbourhood use by older home owners, AHURI Final Report No. 144, Australian Housing and
Urban Research Institute Limited, Melbourne, https://www.ahuri.edu.au/research/final-
reports/144
270 James, A., S. Rowley, W. Stone, S. Parkinson, A. Spinney and M. Reynolds 2019, Older
Australians and the housing aspirations gap, AHURI Final Report No.317, Australian Housing
and Urban Research Institute Limited, Melbourne, https://www.ahuri.edu.au/research/final-
reports/317

www.TheCIE.com.au
Proposal to include minimum accessibility standards for housing in the National Construction Code 219
Visitability
Post Polio Victoria (PPV)271 cited a study by Duncan et al (2018)272 on the impact of an
individual’s social and environmental context on their health outcomes. The study points
out that inability to access their friends’ homes (Duncan et al, 2018:6) can impact on
‘their commitment to continue to build a life full of meaning’ (Duncan et al, 2018:3) and,
due to their friends’ potential lack of understanding of their physical limitations, to
diminished social relationships, or inclusion.
Employment and productivity
Dalton and Carter (2020a) in the MDI and Summer Foundation submission also raise
other issues that may have a smaller impact. One of them is the employment and
productivity impact of premature retirement, premature death and morbidity (section
1.7.3, p.10; section 3.5.3, p.27 in Dalton and Carter (2020a)) and the productivity impact
for people not in the paid workforce (section 3.5.3, p.27 Dalton and Carter (2020a)).
For example, someone who is injured as result of a fall may also require time off work,
which is a cost to their employer and to the wider economy.273
Some submissions provided data on the employment impact of people with disability, for
example:
■ Close to one-third of respondents to a survey by Dr Wiesel reported lack of accessible
housing has resulted in job loss, missed job opportunities, reduced work hours, or
reduced productivity at work.274
■ 16 per cent to 30 per cent of members of Spinal Life Australia report that a lack of
accessible housing has impacted their employment.275
Cost of falls
PPV276 cited the estimates of costs of falls related injuries by the Australian Commission
on Safety and Quality in Health Care (ACSQHC) (2009). It was estimated that, if
nothing was done to decrease the number of falls in older people between 2020 and 2051,
■ the cost of falls-related injury would be $1.4 billion p.a.
271 Barbary Clarke, op.cit., p.6
272 Duncan, A. and Batliwalla, Z. 2018, ‘Growing older with post-polio syndrome: Social and quality-of-
life implications’, SAGE Open Medicine, v.6, p.1-7.
273 Submission by Jane Scott, answer to Question 11, accessed 4 December 2020,
https://consultation.abcb.gov.au/engagement/consult-ris-accessible-
housing/consultation/published_select_respondent
274 Submission by Professor Bruce Bonyhady and Dr Di Winkler for Melbourne Disability
Institute and Summer Foundation, Appendix 2, accessed 4 December 2020,
https://consultation.abcb.gov.au/engagement/consult-ris-accessible-
housing/consultation/published_select_respondent
275 John Mayo, op.cit., p.3
276 Barbary Clarke, op.cit., p.8

www.TheCIE.com.au
220 Proposal to include minimum accessibility standards for housing in the National Construction Code
■ hospitals would have 886 000 additional bed days occupied by people who had
suffered from falls (or 2 500 dedicated hospital beds), and
■ 3 320 additional residential aged care places would be required due to falls-related
injuries.
Health care cost
ANUHD277 suggested that the costs of avoidable hospital stays are underestimated –
transition care added on average 12 weeks of care within the health system for each
person. The figure for avoidable costs as a result of bed blocking in rehabilitation care
wards is also likely to be underestimated because of a continuing trend towards patients
in sub-acute beds being sicker and older than would typically have been the case in the
past. It suggested that people who stay in hospital longer than is clinically required tend
to suffer adverse consequences such as heightened risk of infection, and loss of
independence, which in turn, lead to higher rates of readmission, more accidents,
increased need for greater home care etc.
Care costs
Submissions suggested the Consultation RIS understated estimates of care costs (as a
result of inaccessibility) in relation to the:
■ hours of care required
■ minimum wage rate, and
■ productivity and/or employment impact on informal carers.
Hours of care required
One submission278 pointed out that the care cost estimates in the Consultation RIS were
understated:
For appendix B, the paper cited considers older Australians who have a condition that is
gradually deteriorating and the change in hours of care provided may significantly underweight
the benefits of universal design for people with significant mobility issues. The cost of care and
time of interventions were based upon certain studies relating to individuals with vision issues.
The minimum wage calculation also does not take into account penalty wages or the cost of
assistance on weekends or at short notice.
This part of the paper is particularly underwhelming and needs to be heavily revised. It is quite
common for showering and dressing of an individual once per day to take 2-3 hours and some
NDIS packages provide for 24 hr a day care.
An assumption (without a clear basis) is made that the need for assistance for people with
disability is often unrelated to housing design. This is, again, difficult to reconcile. Services
provided for older Australians and Australians with disability are often related to selfcare and
277 Margret Ward, op.cit., p.19-20
278 Anonymous Submission 284174932, answer to Question 11, accessed 4 December 2020,
https://consultation.abcb.gov.au/engagement/consult-ris-accessible-
housing/consultation/published_select_respondent

www.TheCIE.com.au
Proposal to include minimum accessibility standards for housing in the National Construction Code 221
personal care, which require access to either the bathroom or the kitchen. The significant
waiting periods for entry into aged care highlight that many Australians need a vast array of
services in the home, which may be impacted upon my housing design (cf the number of Aged
Care Assessment Team reviews conducted annually).
The submission suggested work by Professor Catherine Bridge and other accessibility
researchers might prove helpful.
Minimum wage rate for informal carers is inappropriate
Some submissions questioned the use of the minimum wage rate in the Consultation RIS
to estimate informal care costs, suggesting that the same rate of formal care or the
average wage rate should be used instead.
For example, Alexandrina Council279 pointed out, ‘[t]he opportunity costs for many
providers of informal assistance would be much higher where their time could be used in
work, study or other caring responsibilities’.
One submission280 pointed out that the minimum wage calculation also does not take
into account penalty wages or the cost of assistance on weekends or at short notice.
Productivity and/or employment impacts of informal carers
Some submissions, including Building Designers Association of Australia,281 suggested
that the impacts on informal carers resulting from their reduced opportunity to engage in
paid work should be included in the analysis.
As explained by Carers WA282, informal carers may wish to participate in the workforce
but are limited by the care they need to provide to a family member who does not have
access to suitable housing. Carers often spend a great deal of time and effort seeking
information, assessments and advice on modifications to the family home which could be
saved with better availability of accessible housing.
A recent report by Carers Australia and Deloitte Access Economics on the value of
informal care, which was mentioned in the Carers WA submission, notes that there are
279 Submission by Sam Priest for Alexandrina Council, p.12, accessed 4 December 2020,
https://consultation.abcb.gov.au/engagement/consult-ris-accessible-
housing/consultation/published_select_respondent
280 Anonymous Submission 284174932, answer to Question 11, accessed 4 December 2020,
https://consultation.abcb.gov.au/engagement/consult-ris-accessible-
housing/consultation/published_select_respondent
281 Submission by John Hatch for Building Designers Association of Australia, answer to
Question 11, accessed 4 December 2020, https://consultation.abcb.gov.au/engagement/consult-ris-
accessible-housing/consultation/published_select_respondent
282 Submission by Felicity Mitchell for Carers WA, answer to Question 11, accessed 4 December
2020, https://consultation.abcb.gov.au/engagement/consult-ris-accessible-
housing/consultation/published_select_respondent

www.TheCIE.com.au
222 Proposal to include minimum accessibility standards for housing in the National Construction Code
substantial differences in the employment outcomes for carers relative to non-caregiving
Australians.283
Moving home
Several submissions suggested that the costs associated with moving home are likely to
be understated because the Consultation RIS only covers removalist costs.
Moving-related costs that have been omitted could include:284
■ real estate agent fees
■ stamp duties
■ repair and cleaning obligations for renters, and
■ additional search costs associated with a lack of accessible housing.
Home modifications
About 53 submissions provided additional information about the type and cost of home
modifications that are made to improve the accessibility of a home (Question 13).
Home Modification Information Clearinghouse285 stressed that modifications are not
universal design and cannot be assumed as a proxy for their costs. Because most of the
modifications are bespoke to meeting special needs and are not included in the universal
design, using their costs as an indication to the size of the problem that universal design
could avoid may be an overstatement.
Features added by home modification
A number of submissions provided suggestions on the features that people with disability
often need and/or have been added to existing dwellings based on their personal or
professional experience. These features include:
■ Adding grab rails, noggins for grab rails
■ Widening doorways, hallways and corridors
■ Converting garages to bedrooms
■ Modification to bathrooms
■ Adding ramps
■ Level access – simultaneous pedestrian and car access and levelling flooring
transitions do not only help to reduce trip hazards for those less mobile but also help
283 Carers Australia and Deloitte Access Economics 2020, The value of informal care in 2020,
https://www.carersaustralia.com.au/wp-content/uploads/2020/08/FINAL-Value-of-
Informal-Care-2020.pdf, p.iv
284 Sam Priest, op.cit., p.12
285 Submission by Professor Catherine Bridge for Home Modification Information Clearinghouse,
p.7, accessed 4 December 2020, https://consultation.abcb.gov.au/engagement/consult-ris-accessible-
housing/consultation/published_select_respondent
www.TheCIE.com.au
Proposal to include minimum accessibility standards for housing in the National Construction Code 223
robot vacuums to move between rooms which many people with disability use to
remain independent
■ Shade for car parking as many people with neuromuscular conditions and spinal cord
injuries are sensitive to heat
■ Access to clothes lines
■ Additional storage in a home as clear space for circulation impacts on the amount of
furniture in any room, its position and placement, additional storage is also needed for
mobility equipment
■ Stair lifts
■ Changing bench top heights, cupboard heights and appliance heights in kitchens,
bathrooms and laundries
■ Kitchen access between counters
■ Automated lights, doors, curtains, and
■ Door and cabinet handles
One submission cited a survey of older home owners, which found around a third (34 per
cent) had made modifications to their house to make it safer or easier to use, with the
most common modifications being grab rails, modified bathrooms or stairs (Judd et al.
2010).
The Alexandrina Council286 survey also found that the majority of respondents felt that
it would be easy to modify their home if needed (59 per cent) or reported that their home
was already modified to their needs (16 per cent).
One submission287 noted that some of these modifications are not obvious access
modifications, but that they all play a part in daily tasks for people with disability.
Some submissions noted that some modifications are impractical. For example, as
mentioned in the submission by Andrew Ferris Drafting and Design288, a bathroom
upgrade involving removing a corner shower was impractical in itself.
Home modification costs
The community survey conducted by Alexandrina Council289 in 2016 found that 16 per
cent of respondents felt that it would not be easy to modify their home if needed, and the
most common reason cited was the need for major/high cost home renovation.
286 Sam Priest, op.cit., p.5-10
287 Anonymous Submission 454639644, answer to Question 13, accessed 4 December 2020,
https://consultation.abcb.gov.au/engagement/consult-ris-accessible-
housing/consultation/published_select_respondent
288 Submission by Andrew Ferris for Andrew Ferris Drafting and Design, answer to Question 13,
accessed 4 December 2020, https://consultation.abcb.gov.au/engagement/consult-ris-accessible-
housing/consultation/published_select_respondent
289 Sam Priest, op.cit., p.5-10

www.TheCIE.com.au
224 Proposal to include minimum accessibility standards for housing in the National Construction Code
Some submissions suggested that the modification costs would be substantial or
significant. In contrast, a couple of submissions suggested that the modification costs
would be comparable to good quality alterations.290
Home Modification Information Clearinghouse291 noted that the five most common
modifications are under $1 000 and can be done without the need for licensed tradesmen
i.e. installation of grabrails and handrails. However, it also noted that most existing
Australian housing cannot be modified to comply with the LHDG Silver level 292 which
means that substantial costs could be incurred in retrofitting modifications to kitchens
and laundries but mostly these can be done using modular furnishing for approximately
$20 000 to $40 000 if required.
Some submissions referred to the Victorian Government RIS on visitable and adaptable
features in housing,293 stating that modification costs 14 to 20 times more than building
them at the beginning.
Many home modifications have been done through government programs.
WA Department of Communities Housing Advisory Unit294 advised that available data
on home modification expenditure for eligible people with disability (those people with
substantially reduced functional capacity) shows many are related to inaccessible
housing:
■ $2 000 to $5 000 for shower hob removal, and
■ $15 000 to $20 000 per room (for laundry, bathroom, bedroom, kitchen modifications
to LHDG Silver level).
According to ANUHD295, it costs about $30 000 for the NDIS funded retrofitting of the
following features:
■ provision of step-free showers
■ wider access doors, and
■ reinforcement of walls to support grab rails.
290 Submission by Michelle Surgeon, answer to Question 13, accessed 4 December 2020,
https://consultation.abcb.gov.au/engagement/consult-ris-accessible-
housing/consultation/published_select_respondent
291 Professor Catherine Bridge, op.cit.
292 sic. There is no requirement for kitchen and laundry under the proposal equivalent to LHDG
silver level.
293 Department of Planning and Community Development 2010, Visitable and Adaptable Features in
Housing: Regulatory Impact Statement, https://www.vic.gov.au/sites/default/files/2019-
11/Amendment-to-the-Building-Code-of-Australia-Visitable-and-Adaptable-Features-in-Housing-RIS.pdf
294 Coralie Ayres, op.cit., answer to Question 11.
295 Margret Ward, op.cit. p.41-42

www.TheCIE.com.au
Proposal to include minimum accessibility standards for housing in the National Construction Code 225
The submission by the ACT Disability, Aged and Carer Advocacy Service
(ADACAS)296 noted that Home and Community Care (HACC) allocated approximately
75 per cent of funds to services for older people, and the remainder on people with
disability under the age of 65 in NSW between 2000 and 2011.
There were three tiers of funding for home modifications, allocated to providers and
allocated on priority. Level 2 modifications were above $10 000, and Level 3 were above
$25 000. In 2009-2010 in NSW there were 260 home modifications jobs done under
Level 2, at an average cost (then) of $16 013, and 50 jobs completed under Level 3, at an
average cost of $36 045.
Some other submissions provided more specific estimates of costs of home modification
to achieve accessibility. For example,
■ An accessible toilet costs 3 times that of a normal toilet. 297
■ Wheelchair ramps cost $6 000, while Gold standard wheelchair accessibility involving
knocking down walls cost $18 000. 298
■ Converting a unit to Platinum standard costs $115 000. 299
■ A personal story suggests that it cost $900 to include battens for grab bars and the grab
bars themselves (the shower rail is a grab bar as are all towel rails) in new builds and
would cost $19 000 to retrofit them as informed by the builder.300
■ A respondent, who has cerebral palsy, notes her modification costs: around $42 000
for the kitchen, $50 000 for bathroom, $67 000 for structural changes (including
raising the level of a floor) and $35 000 for other changes (including extending the
pergola).301
Some submissions emphasised that modification costs may be an underestimate of the
problem as in some cases modifications are not sufficient to meet accessibility needs.
296 Submission by Michael Bleasdale for ADACAS, answer to Question 13, accessed 7 December
2020, https://consultation.abcb.gov.au/engagement/consult-ris-accessible-
housing/consultation/published_select_respondent
297 Anonymous Submission 607199877, answer to Question 13, accessed 7 December 2020,
https://consultation.abcb.gov.au/engagement/consult-ris-accessible-
housing/consultation/published_select_respondent
298 Anonymous Submission 122486412, answer to Question 13, accessed 7 December 2020,
https://consultation.abcb.gov.au/engagement/consult-ris-accessible-
housing/consultation/published_select_respondent
299 Anonymous Submission 914154835, answer to Question 13, accessed 7 December 2020,
https://consultation.abcb.gov.au/engagement/consult-ris-accessible-
housing/consultation/published_select_respondent
300 Submission by Lee Jordan, p.1, accessed 7 December 2020,
https://consultation.abcb.gov.au/engagement/consult-ris-accessible-
housing/consultation/published_select_respondent
301 Anonymous Submission 118250068, p.2-3, accessed 7 December 2020,
https://consultation.abcb.gov.au/engagement/consult-ris-accessible-
housing/consultation/published_select_respondent

www.TheCIE.com.au
226 Proposal to include minimum accessibility standards for housing in the National Construction Code
It was also suggested that time cost of modifications (that is waiting for the modification
to be completed) should be considered.
Further information
Some further information sources were suggested by submissions. They include:
■ Home Modification Information Clearinghouse302
■ NDIS providers
■ Government compensable insurance schemes, e.g. Transport Accident Commission
(TAC) in Victoria
■ Councils, e.g. permit information relating to retrofitting existing structure
■ Public housing authorities, e.g. SA Housing Authority; Queensland Department of
Housing and Public Works
■ Hospitals, and
■ Aged care.
Costs of prolonged hospital stay
A couple of submissions suggested that avoided costs of longer stays in hospitals were
understated. Prolonged hospital stay would result in higher risk of infection and higher
risk of dependence, which in turn increases risk of readmission. These impacts should be
considered in the size of the problem.
Search cost
Submissions suggested search costs should be included in the size of the problem as a
result of the lack of accessible housing in the market. These costs would reduce if more
houses are accessible. The creation of a substantial number of accessible homes would
offer people more choices and thus reduce the search cost.
Cost to industry
One submission mentioned that there are costs to the building industry due to the lack of
accessible housing and the lack of harmonised standards:
The lack of accessible housing provisions represents a significant cost to industry. This is
predominantly for provision of Class 2 dwellings, where there are multiple different planning
policies requiring different designs to differing proportions of dwellings. For example, some
planning requirements will seek 20 per cent of all dwellings to AS4299 Class C and 10 per cent
to LHA Silver. The amount of time in design is extensive as designers grapple with the nuances
between different standards and builders incur rework costs as they get confused building to
multiple requirements.
This also affects Class 1 where multiple dwellings are being built and planning requirements
are similarly triggered.
302 https://www.homemods.info/
www.TheCIE.com.au
Proposal to include minimum accessibility standards for housing in the National Construction Code 227
Value of statistical life (VSL)
The Consultation RIS used value of statistical life (VSL) (box A.5 and table A.6 in the
Consultation RIS) as suggested by the OBPR guidelines. The VSL for the 25-34 years old
cohort in the Consultation RIS was $5.4 million.
Dalton and Carter (2020a) suggested that the VSL should be higher – ranging from $4.5
million to $7.9 million with an average value of $7 million.
Social justice
Dalton and Carter (2020a) discussed social justice as a reason for government
intervention, links this to the principle of solidarity, and points to the need for social
justice in housing in the human rights frameworks and in other government reports
(section 2.2, p.14 and section 2.3.1, p. 15). Some other submissions also share this view.
Ensuring minimum accessibility standards in the NCC is consistent with Australia’s
human rights obligations, according to QLD Human Rights Commission.303 Physical
Disability Council of NSW argued that international and domestic reputational gains
should be included as a benefit.304
Intangible morbidity impacts and quality of life
A number of submissions, some through personal stories, pointed out the negative
impacts of inaccessible housing on mental health and daily life.
It was suggested that the additional cost of the mental health impact on someone living
under the stress of inappropriate housing or the pressure of having to find accessible
housing in a pressured market should be considered.305
Dalton and Carter (2020a) suggested that ‘pain and anxiety’ were not considered in the
Consultation RIS in the cost-reduction approach, or at least not explicitly in the case of
WTP analysis. They acknowledged that placing a dollar value to such intangibles is not
straightforward or uncontested. They suggested that such health status considerations
could be measured through quality of life measurement using a technique called cost-
utility analysis (CUA), with results presented as a ‘cost per quality adjusted life year
(QALY)’. Sometimes analysts convert QALYs to dollar values by applying the decision
threshold on what constitutes value-for-money in CUA.
The survey by Dr Wiesel included in the MDI and Summer Foundation submission of
people with disability and senior people found that 60 per cent of people with both low
and high support needs living in accessible housing reported improved self-reported
mental health and wellbeing, thanks to the accessibility of their home. In contrast, 71.7
303 Submission by Heather Corkhill for Queensland Human Rights Commission, p.3-4, accessed 7
December 2020, https://consultation.abcb.gov.au/engagement/consult-ris-accessible-
housing/consultation/published_select_respondent
304 Hayley Stone, op.cit., p.18-19
305 Jacqueline Marks, op.cit., answer to Question 12.

www.TheCIE.com.au
228 Proposal to include minimum accessibility standards for housing in the National Construction Code
per cent of people with high support needs, and 50.0 per cent of people with low support
needs, living in inaccessible housing reported worsened mental health and wellbeing.306
It was suggested avoided costs of loneliness and exclusion should be considered too. For
example, Summer Foundation noted that:
■ 53 per cent of young people living in residential care receive a visit from a friend less
than once a year, and
■ 45 per cent never participate in leisure activities in the community.
Causes of the problem
Question 14 asked responders to consider the main contributor to a lack of uptake of
universal design principles in new dwellings. The question offered the following two
factors along with other reasons for respondents to specify:
■ Buyers failing to think about their future accessibility needs, and
■ Volume builders being reluctant to deviate from standard plans.
Chart A.2 summarises the responses to this question.
Buyers failing to think about their future accessibility needs
Among those submitting their answers to the Consultation Hub, 46 submissions
considered buyers failing to think about their future accessibility needs as the main
contributor to a lack of uptake of universal design principles in new dwellings.
There are other underlying factors leading to this barrier, for example, different needs and
failing to foresee future accessibility demand, which will be discussed below.
Volume builders being reluctant to deviate from standard plans
Forty six submissions also considered reluctance of volume builders to deviate from
standard plans as the main contributor to a lack of uptake of universal design principles
in new dwellings.
306 Professor Bruce Bonyhady and Dr Di Winkler, op.cit. Appendix 2, p.5; p.14; Table 19,
p.31.

www.TheCIE.com.au
Proposal to include minimum accessibility standards for housing in the National Construction Code 229
A.2 Main contributor to a lack of uptake of universal design principles in new
dwellings
Note: answer to Question 14.
Data source: Consultation Hub.
Other factors in general
61 submissions indicated other barriers to the uptake of universal design principles and
77 submissions provided more specific discussions to these barriers. Table A.3 categorises
these other factors.
A.3 Other factors contributing to the lack of accessible housing
Factors Count Percentage
Additional cost/affordability 37 25.9
No demand/different needs 17 11.9
Other aspiration 10 7.0
Site constraint 5 3.5
Adverse perceptions 3 2.1
Lack of appeal of accessible fixtures 9 6.3
Government inaction 18 12.6
Conflict with other regulations/requirements 3 2.1
Lack of community awareness 10 7.0
Information problem 10 7.0
Industry problem 14 9.8
Limited choice 3 2.1
Social connection 1 0.7
Not sufficiently insured 1 0.7
Stamp duty 1 0.7
Lack of long-term lease security 1 0.7
Total 143 100.0
Source: CIE compilation based on submissions.
0 20 40 60 80 100 120 140
Buyers failing to think about
their future accessibility needs
Volume builders being reluctant
to deviate from standard plans
Other barriers
Not Answered
No of responses

www.TheCIE.com.au
230 Proposal to include minimum accessibility standards for housing in the National Construction Code
Higher cost and affordability
High cost of construction accounts for one quarter of the other barriers mentioned by
submissions.
Most people including home buyers and the industry perceive that universal design
principles will put severe economic pressure on land and building. As one submission
stated, ‘you get substantially less usable building function in the same space and it costs
you more money.’307
Some submissions suggested that some people have the perception that accessible
features of a new dwelling are cost prohibitive, and unnecessary at their particular stage
of life.
Some submissions noted that people are very conscious of costs. As pointed out by
Environmental Design in answering Question 13 relating to home modification, $500 to
$1 000 cost difference could change one’s opinion on the house choice.308
One submission cited a survey of older home owners, which found around a third (34 per
cent) had made modifications to their house to make it safer or easier to use, with the
most common modifications being grab rails, modified bathrooms or stairs. When asked
if they would be able to pay for necessary modifications only a little over half indicated
they would, 35 per cent were uncertain and 11 per cent said they could not. Ability to
pay was even more constrained for lower income groups (Judd et al. 2010).
The same submission also suggested that significant sunk costs in their existing
accommodation are an important factor preventing people from moving even if their
present housing is inappropriate. Citing a study by Beer and Faulkner (2009), the
submission noted that 42 per cent of people with mobility impairments had not moved
house for over a decade and a further 29 per cent had only made one move. Despite this,
around one fifth felt their present house did not meet their needs, with almost 30 per cent
feeling the house would not meet future needs.
It should be noted that some submissions mentioned the cost factor in a totally different
way.
One submission argued that it is a misunderstanding that universal design costs more –
‘when integrated it needn’t cost more’.309
The Centre for Universal Design Australia (CUDA) pointed out that costs were often
cited as the main reason for not applying universal design features, however, quantifiable
307 Anonymous Submission 506249822, answer to Question 14, accessed 7 December 2020,
https://consultation.abcb.gov.au/engagement/consult-ris-accessible-
housing/consultation/published_select_respondent
308 Submission by Peter Robert Hirst for Environmental Design, answer to Question 13, accessed
7 December 2020, https://consultation.abcb.gov.au/engagement/consult-ris-accessible-
housing/consultation/published_select_respondent
309 Anonymous Submission 113712101, answer to Question 14, accessed 7 December 2020,
https://consultation.abcb.gov.au/engagement/consult-ris-accessible-
housing/consultation/published_select_respondent

www.TheCIE.com.au
Proposal to include minimum accessibility standards for housing in the National Construction Code 231
calculations were not forthcoming. Some of the features are more expensive because they
are not standard.310
Another submission provided a positive personal experience of her universally accessible
home:311
My home is universally accessible and it is by far the most stunning home that I have ever been
in. It is no more expensive than the homes of my friends and neighbours – but it has a great
feel, it is open and it flows.
Submissions also highlighted another factor related to higher cost as site and design
constraints. For example, topography and lot size will impact on the feasibility and/or
costs of building accessible housing.
Related to cost factor, stamp duty and lack of government subsidy were also mentioned
in submissions as a barrier to the uptake of universal design in the new dwellings.
No demand or different needs
The lack of demand or different needs was also identified in submissions as an important
barrier to uptake of universal design in the new dwellings. The number of people who
need accessible houses is a small proportion of the housing market. For most buyers it is
‘an unnecessary and burdensome cost’312.
One submission identified seven different categories of families that have different needs
for housing, with only two categories being able to benefit from accessible design
features.
Moreover, MBA pointed out that people move approximately every 7 years, implying
that not everyone needs accessible housing at one stage.313
Some submissions questioned the ‘one size fits all’ approach, arguing that the problem is
small and does not warrant a universal solution. ‘People want their own home to be
designed for their own ergonomic needs. …… Why would you impose that on
everyone?’314
310 Submission by Jane Bringolf for CUDA, answer to Question 14, accessed 7 December 2020,
https://consultation.abcb.gov.au/engagement/consult-ris-accessible-
housing/consultation/published_select_respondent
311 Anonymous Submission 90458024, answer to Question 14, accessed 7 December 2020,
https://consultation.abcb.gov.au/engagement/consult-ris-accessible-
housing/consultation/published_select_respondent
312 ‘Submission by Tory Puglisi, answer to Question 14, accessed 7 December 2020,
https://consultation.abcb.gov.au/engagement/consult-ris-accessible-
housing/consultation/published_select_respondent’
313 Submission by Max Rafferty for MBA, p.5, accessed 7 December 2020,
https://consultation.abcb.gov.au/engagement/consult-ris-accessible-
housing/consultation/published_select_respondent
314 Anonymous Submission 506249822, answer to Question 14, accessed 7 December 2020,
https://consultation.abcb.gov.au/engagement/consult-ris-accessible-
housing/consultation/published_select_respondent

www.TheCIE.com.au
232 Proposal to include minimum accessibility standards for housing in the National Construction Code
It was claimed that investors in private rental housing generally do not consider people
with disability as preferred tenants (Beer and Faulkner 2009 as quoted by an anonymous
submission315).
As an indication of the lack of demand for accessible housing, one submission made the
observation from its own business experience: ‘Our business has several Silver and
Platinum Level LHA designs available if a client decides that type of product is for them.
The uptake from the community on this however is extremely low.’316
Features may not align with aspiration
This factor is closely related to the barrier of buyers failing to think about their future
accessibility needs as discussed above.
Submissions suggested that housing is an aspirational purchase or is symbolic of meeting
an aspiration in the future. Whereas no-one aspires to have future disability.
Submissions suggested people systematically underestimate their need for an accessible
home. For example, as quoted in the ANUHD submission, Ozanne (2009) observed that
imminent retirees, mostly ‘baby-boomers’, indicate they want to stay in the community,
live well and for a long time, yet, are not showing signs of planning for the realities of old
age, illness or disability; caring for an ageing or ill partner; or for the costs of home
modifications that may be necessary.317
One submission quoted several studies to suggest that consumers are relatively myopic
about the relative importance of accessibility and are willing to trade off these aspects.
While they regard accessibility and universal design positively in principle, when making
market decisions, it gets prioritised down.
However, alternative views were also expressed in submissions. For example, Building
Designers Association of Queensland noted, ‘the exception to this is in the retiree market
where quite often the new house is likely to be their forever house and as such they are
looking ahead to potential mobility issues as they get older and are prepared to pay a
little more to have these accommodated for future use.’318
315 Submission by Erika Webb for Blind Citizens WA, answer to Question 14, accessed 7
December 2020, https://consultation.abcb.gov.au/engagement/consult-ris-accessible-
housing/consultation/published_select_respondent
316 Submission by Peter Springham, answer to Question 14, accessed 7 December 2020,
https://consultation.abcb.gov.au/engagement/consult-ris-accessible-
housing/consultation/published_select_respondent
317 Margret Ward, op.cit., p.21
318 Submission by Brenden Creed for Building Designers Association of Queensland, answer to
Question 14, accessed 7 December 2020, https://consultation.abcb.gov.au/engagement/consult-ris-
accessible-housing/consultation/published_select_respondent

www.TheCIE.com.au
Proposal to include minimum accessibility standards for housing in the National Construction Code 233
Government inaction
Some 18 submissions argued that the non-mandatory requirement is a factor and blamed
the reluctance by governments to apply and enforce accessible standards and to provide
subsidies for the lack of uptake of universal design in new dwellings. Failure of the
voluntary approach was presented as an argument for government regulation.
Lack of consistent access requirements in legislation was also mentioned as a barrier.
Conflict with other regulations and requirements
Conflicts with other regulations and good design objectives were mentioned by some
submissions as factors contributing to the problem. They include, for example,
■ stepped entry thresholds for waterproofing
■ subfloor clearances for ventilation and termite inspection, and
■ raised window sills and opening mechanisms for compliance with overlooking and
anti-fall regulations.
Lack of community awareness
Lack of community awareness and society prejudices towards change, especially lack of
awareness of the benefits of accessibility to the whole economy, were raised by some
submissions as a barrier.
For example, the ACT Disability, Aged and Carer Advocacy Service (ADACAS) noted
that, the inclusion of people with disability is not normative. It is still considered special.
It has been characterised as a minority movement that works only in the interest of those
with specialised needs.319
Industry lacking leadership
Some submissions noted that inertia in the building industry leads to less uptake of
universal design in new dwellings. For example, volume builders are reluctant to deviate
from standard plans, designers fail to think about future accessibility needs of occupants.
Design trends and the acceptability to home buyers of certain features were also raised as
barriers.
Submissions suggested consumers have less influence in the design and construction
process. Many homes, especially Class 2 homes, are built ‘on spec’ and design is decided
and locked in well before coming on to the market.
Industry inertia is also linked to the cost consideration, especially for the low-cost volume
builders who try to make homes as low cost as possible for market competition. Some
submissions acknowledged that the costs of incorporating accessibility features would fall
on the builder with a limited increase in value to the client.
319 Michael Bleasdale, op.cit., answer to Question 14.

www.TheCIE.com.au
234 Proposal to include minimum accessibility standards for housing in the National Construction Code
Information problem
Some submissions mentioned there are different understandings of what universal design
is. Most trade personnel are not familiar with the LHDG.
In addition, one submission noted that the ambiguity of the LHDG creates confusion
and contrary opinions which introduces liability.320
Submissions also noted there is often an information imbalance between builders and
buyers. For example, consumers are persuaded that their accessible needs are not allowed
in the building code or that the local council will not allow them. These are probably due
to the lack of education available to builders and consumers. It is also difficult to educate
people as to what design features are needed to make a home accessible.
Lack of appeal of accessible features
The lack of appeal of accessible fixtures, such as ambulatory grabrails/Disability
Discrimination Act (DDA) compliant toilets which aren’t appealing, often costly and
incredibly limited in design options, was raised by some submissions as the barrier.
Submissions suggested accessible compliant dwellings often look very nursing home or
hospital like, impacting visual attractiveness.
In addition, some submissions noted that houses may be devalued by the look of grab
rails in bathrooms, disabled toilets and shower curtains.
Some submissions noted that accessible features are removed in some cases. As noted in
the answer to Question 13 regarding home modification by SDA Alliance, ‘[i]f a
participant of these schemes chooses to relocate and leave the modified home, more than
often the home is purchased by a person who doesn’t immediately require the
modifications and the modification is reverted to an inaccessible configuration.’321
As mentioned above, one submission provided positive experience of her accessible
home’s appearance: ‘My home is universally accessible and it is by far the most stunning
home that I have ever been in. … it has a great feel, it is open and it flows.’322
Limited choices
Some submissions noted that there are a limited number of accessible houses and/or
accessible designs in the market, making it difficult to find or to build an accessible
dwelling. The inaccessible salesrooms and display homes also add to the difficulty of
buying new accessible housing.
320 Submission by Sam Plaschke for Wilson Homes Tasmania Pty Ltd, p.2, accessed 7 December
2020, https://consultation.abcb.gov.au/engagement/consult-ris-accessible-
housing/consultation/published_select_respondent
321 Melanie Southwell, op.cit., answer to Question 13.
322 Anonymous Submission 90458024, answer to Question 14, accessed 7 December 2020,
https://consultation.abcb.gov.au/engagement/consult-ris-accessible-
housing/consultation/published_select_respondent

www.TheCIE.com.au
Proposal to include minimum accessibility standards for housing in the National Construction Code 235
Lack of long-term lease security is another factor which disinclines renters to invest in
their rental property, according to ANUHD. The problem is aggravated by renters being
legally obliged to reinstate the home at the end of the lease.323
Views about the options
Views were sought for the following options in relation to the proposed accessibility
requirement in the NCC:
■ Status quo: No changes to existing policy settings
■ Option 1 (Silver): Accessibility standard, broadly reflecting LHDG Silver standard, in
the NCC applying to all new Class 1a (houses) and Class 2 (apartments) buildings
■ Option 2 (Gold): Accessibility standard, broadly reflecting LHDG Gold standard, in
the NCC applying to all new Class 1a (houses) and Class 2 (apartments) buildings
■ Option 3 (Gold +): Accessibility standard, broadly reflecting LHDG Gold standard
(with some platinum features), in the NCC applying to all new Class 1a (houses) and
Class 2 (apartments) buildings
■ Option 4 (Gold in apartments): Accessibility standard, broadly reflecting LHDG
Gold standard, in the NCC applying to all Class 2 (apartments) buildings
■ Option 5: A subsidy program to encourage additional availability of accessible rental
properties, and
■ Option 6: An enhanced approach to voluntary guidance, which includes turning the
current proposals into a non-regulatory ABCB handbook and other measures to
encourage additional uptake of universal design principles, including: a search engine
for dwellings certified as complying with the LHDGs and provision of information at
the point of sale.
Options 1 through 4 may be classified as regulatory options while Status quo and Options
5 and 6 non-regulatory options.
Proposal versus LHDG
A number of submissions pointed out the difference between accessible, liveable and
universal designs.
Some submissions distinguished the Silver and Gold/Gold + standards. Silver is mainly
about visitability while Gold/Gold + is about accessibility (that is for someone to live in).
A number of submissions suggested that the current proposal in the NCC is a ‘diluted’
version of the LHDG and will not achieve accessibility. ANUHD pointed out a number
of items in the proposal that deviate from the LHDG that ANUHD does not support.324
323 Margret Ward, op.cit., p.21
324 Margret Ward, op.cit., p.30

www.TheCIE.com.au
236 Proposal to include minimum accessibility standards for housing in the National Construction Code
Feasible options
Among the 98 respondents to the Consultation Hub questionnaire, some 83 respondents
provided answers to the feasible options question (Question 15). Most respondents (63
out of 83) suggested more than one feasible option (chart A.4).
A.4 Responses by number of feasible options
Note: answers to Question 15.
Data source: Consultation Hub.
Chart A.5 reports the count of feasible options provided by respondents. Option 5 has the
highest count – 46 respondents indicated it is feasible. It is followed by Option 6 (42
counts), Option 1 (36 counts), and Option 3 (30 counts).
A.5 Feasible option counts
Note: Answers to Question 15.
Data source: Consultation Hub.
0
5
10
15
20
25
30
1 2 3 4 5 6 7
Co
un
t
0
5
10
15
20
25
30
35
40
45
50
Status quo Option 1 Option 2 Option 3 Option 4 Option 5 Option 6
Co
un
t
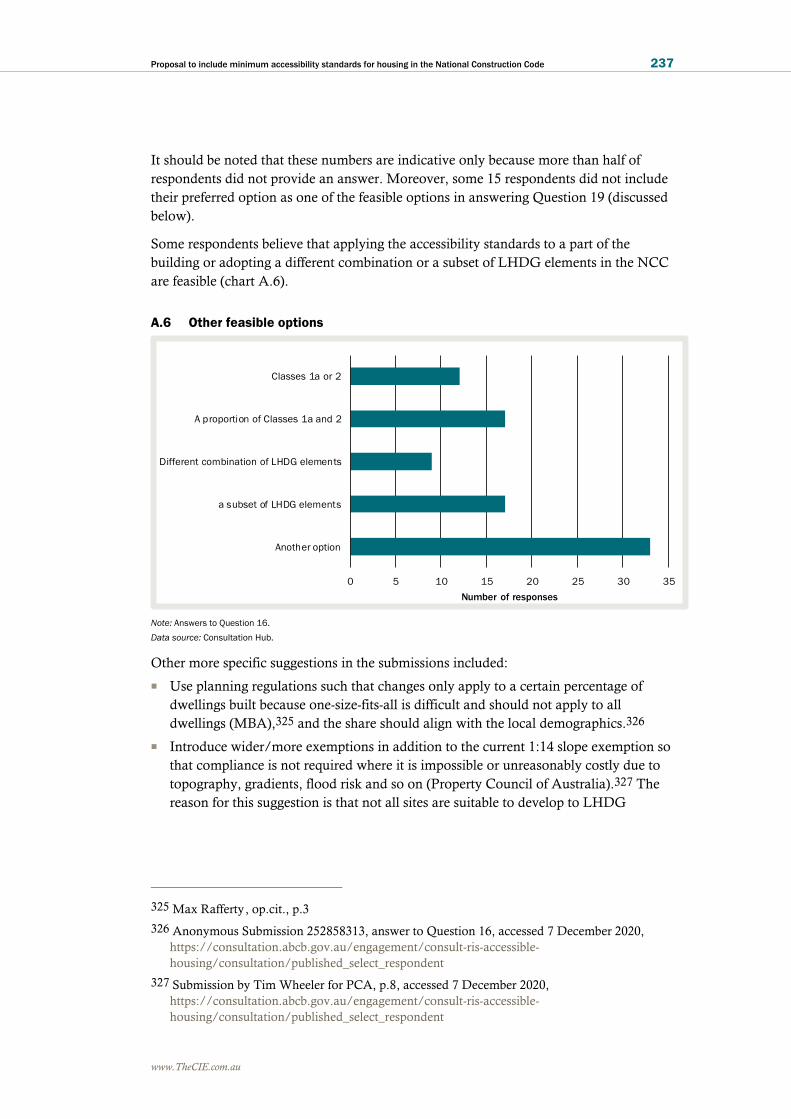
www.TheCIE.com.au
Proposal to include minimum accessibility standards for housing in the National Construction Code 237
It should be noted that these numbers are indicative only because more than half of
respondents did not provide an answer. Moreover, some 15 respondents did not include
their preferred option as one of the feasible options in answering Question 19 (discussed
below).
Some respondents believe that applying the accessibility standards to a part of the
building or adopting a different combination or a subset of LHDG elements in the NCC
are feasible (chart A.6).
A.6 Other feasible options
Note: Answers to Question 16.
Data source: Consultation Hub.
Other more specific suggestions in the submissions included:
■ Use planning regulations such that changes only apply to a certain percentage of
dwellings built because one-size-fits-all is difficult and should not apply to all
dwellings (MBA),325 and the share should align with the local demographics.326
■ Introduce wider/more exemptions in addition to the current 1:14 slope exemption so
that compliance is not required where it is impossible or unreasonably costly due to
topography, gradients, flood risk and so on (Property Council of Australia).327 The
reason for this suggestion is that not all sites are suitable to develop to LHDG
325 Max Rafferty , op.cit., p.3
326 Anonymous Submission 252858313, answer to Question 16, accessed 7 December 2020,
https://consultation.abcb.gov.au/engagement/consult-ris-accessible-
housing/consultation/published_select_respondent
327 Submission by Tim Wheeler for PCA, p.8 , accessed 7 December 2020,
https://consultation.abcb.gov.au/engagement/consult-ris-accessible-
housing/consultation/published_select_respondent
0 5 10 15 20 25 30 35
Classes 1a or 2
A proportion of Classes 1a and 2
Different combination of LHDG elements
a subset of LHDG elements
Another option
Number of responses

www.TheCIE.com.au
238 Proposal to include minimum accessibility standards for housing in the National Construction Code
standards at low or minimal cost (PowerHousing Australia328), for example AusBuild
noted around 32 per cent of lots created in the last two years in Queensland are
suitable for accessible housing,329 and one submission argued that the proposed
changes are not feasible for lots less than 350 m2.
■ Align voluntary options with existing planning policy
■ Increase funding to LHA to expand its education systems
■ Increase information available, for example,
– voluntary handbook, self-declaration form as to the standard
– governments collect data on accessible housing and make them available; for
example, create a publicly available national register of homes with accessibility
features, including a simple process to confirm the validity of the original
accessibility certificates (PCA)330
■ Add matching service to achieve the benefits
– For example; SDA has a matching program
■ Provide incentives for developers, builders and purchasers
■ Accreditation program for accessible builders
■ Lowering transfer duties because the duties lead to low take-up of accessibility
features by mobility impaired households (ANUHD)331
■ Light-weight, cheap removable threshold ramps are an alternative
■ Proposed changes should be expanded to help vision impaired people and mentally
impaired people; for example, better insulation in Class 2 units to cut down noise
transfer which can be stressful.
Options to meet the objective
Question 17 of the Consultation Hub questionnaire asked respondents to consider which
option can meet the objective. Some 80 submissions provided answers to this question
through the Consultation Hub. Chart A.7 compares the answers to the question about
feasible options.
For the regulatory options (Options 1 to 4), the number of respondents who thought one
option has the ability to meet the objective was slightly less than the number of
respondents who thought the option is feasible. For the non-regulatory options (Options
5 and 6), the gap is wider.
328 Submission by Nicholas Proud for PowerHousing Australia, p.3, accessed 7 December 2020,
https://consultation.abcb.gov.au/engagement/consult-ris-accessible-
housing/consultation/published_select_respondent
329 Submission by Brent Fletcher for AusBuild Pty Ltd, p.3, accessed 7 December 2020,
https://consultation.abcb.gov.au/engagement/consult-ris-accessible-
housing/consultation/published_select_respondent
330 Tim Wheeler, op.cit., p.2-4
331 Margret Ward, op.cit., p.23

www.TheCIE.com.au
Proposal to include minimum accessibility standards for housing in the National Construction Code 239
More respondents thought that the Silver standard (Option 1) could meet the objective
than the Gold (Option 2) and Gold Plus (Option 3), although the difference is not large.
There was a similar number of respondents who consider that an enhanced approach to
voluntary guidance (Option 6) and the Gold Plus (Option 3) can meet the objective.
A.7 Feasible options versus options meeting the objective
Note: Structured answers to Questions 15 and 17.
Data source: Consultation Hub.
Effectiveness of voluntary approach
Questions 32 asked about effectiveness of providing better information and promotion of
an enhanced non-regulatory approach (Option 6) to encourage the voluntary uptake of
universal design principles in new dwellings.
Chart A.8 summarises the responses to this question. As can be seen from the chart, there
are about an equal number of responses thinking it is at least somewhat effective (39
responses or 19 per cent) or not effective (36 responses or 18 per cent).
0
5
10
15
20
25
30
35
40
45
50
Status quo Option 1 Option 2 Option 3 Option 4 Option 5 Option 6 Other option
Co
un
t
Feasible options Meeting objectives
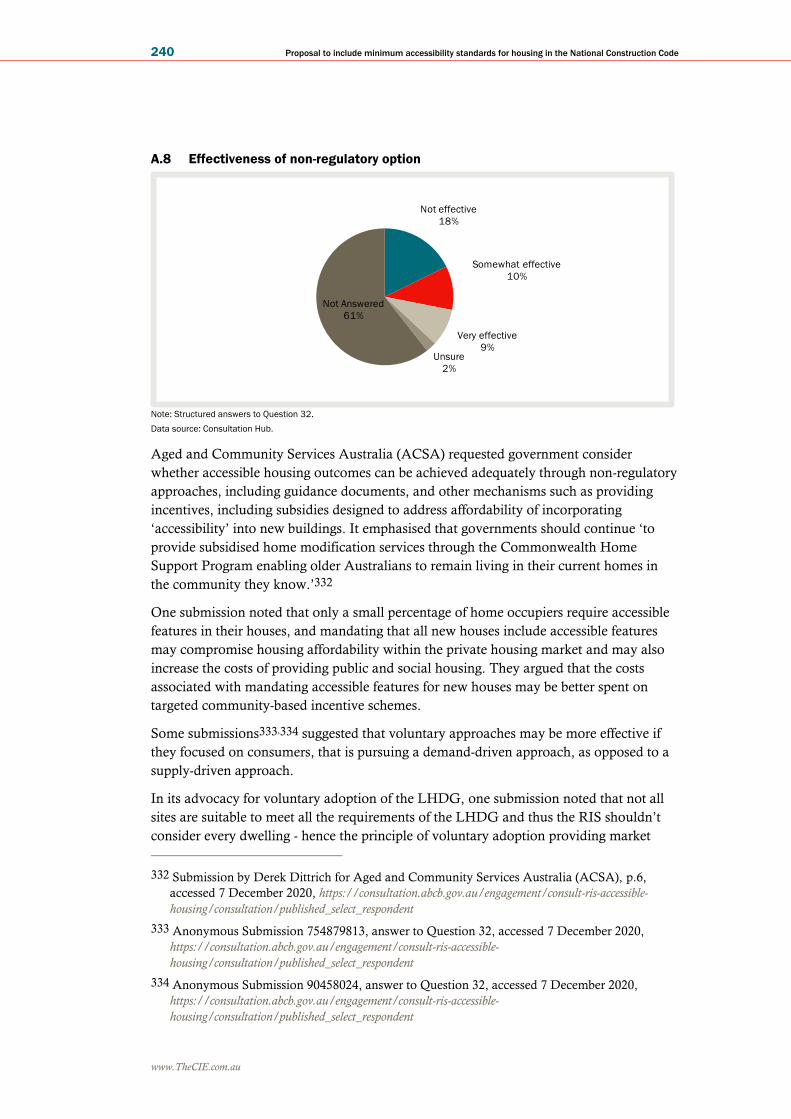
www.TheCIE.com.au
240 Proposal to include minimum accessibility standards for housing in the National Construction Code
A.8 Effectiveness of non-regulatory option
Note: Structured answers to Question 32.
Data source: Consultation Hub.
Aged and Community Services Australia (ACSA) requested government consider
whether accessible housing outcomes can be achieved adequately through non-regulatory
approaches, including guidance documents, and other mechanisms such as providing
incentives, including subsidies designed to address affordability of incorporating
‘accessibility’ into new buildings. It emphasised that governments should continue ‘to
provide subsidised home modification services through the Commonwealth Home
Support Program enabling older Australians to remain living in their current homes in
the community they know.’332
One submission noted that only a small percentage of home occupiers require accessible
features in their houses, and mandating that all new houses include accessible features
may compromise housing affordability within the private housing market and may also
increase the costs of providing public and social housing. They argued that the costs
associated with mandating accessible features for new houses may be better spent on
targeted community-based incentive schemes.
Some submissions333,334 suggested that voluntary approaches may be more effective if
they focused on consumers, that is pursuing a demand-driven approach, as opposed to a
supply-driven approach.
In its advocacy for voluntary adoption of the LHDG, one submission noted that not all
sites are suitable to meet all the requirements of the LHDG and thus the RIS shouldn’t
consider every dwelling - hence the principle of voluntary adoption providing market
332 Submission by Derek Dittrich for Aged and Community Services Australia (ACSA), p.6,
accessed 7 December 2020, https://consultation.abcb.gov.au/engagement/consult-ris-accessible-
housing/consultation/published_select_respondent
333 Anonymous Submission 754879813, answer to Question 32, accessed 7 December 2020,
https://consultation.abcb.gov.au/engagement/consult-ris-accessible-
housing/consultation/published_select_respondent
334 Anonymous Submission 90458024, answer to Question 32, accessed 7 December 2020,
https://consultation.abcb.gov.au/engagement/consult-ris-accessible-
housing/consultation/published_select_respondent
Not effective
18%
Somewhat effective
10%
Very effective
9%Unsure
2%
Not Answered
61%

www.TheCIE.com.au
Proposal to include minimum accessibility standards for housing in the National Construction Code 241
flexibility. It was suggested the greater flexibility provided through utilisation of non-
mandatory options will result in the LHDG being implemented more efficiently, aligning
with accessibility requirements of the community and site suitability.
A number of submissions questioned the effectiveness of voluntary approaches, arguing
previous attempts at voluntary or enhanced nonregulatory approaches have failed in
Australia and overseas.
Some submissions cite higher costs to industry and consumers as a reason why voluntary
approaches would not be effective in encouraging uptake of universal designs in new
dwellings.
Unintended consequences
Question 18 asked respondents to identify less intuitive or unintended consequences of
the proposed changes.
ACSA suggested that assessment of unintended consequences should be undertaken to
understand flow-on effects for the building sector and for homeowners and renters,
including impact on business models for village operators should refurbishments require
accessibility to be built in.335
Mis-alignment with state driven policies
One submission noted that the proposal would likely hinder design and housing product
choice if adopted across all new homes and residential apartments. This submission
suggests that this approach does not align with state driven housing policies, such as
NSW ‘missing middle’ which advocates for multi-level terrace style housing, smaller lot
sizes, urban living and so forth, or the trend towards inner city lots become smaller to
accommodate housing affordability constraints.
PCA argued that there is a risk of regulatory overlap given the prevalence and complexity
of state, territory and local government regulation. It provided a list of accessibility
requirements in state and territory and local government areas.336
Red tape and delays
Wilson Homes Tasmania noted that, depending on the certification outcome, the
introduction of additional red tape into the design and construction of new dwellings will
increase the required time (with cost noted previously) for each respective activity.337
335 Derek Dittrich, op.cit., p.6-7
336 Tim Wheeler, op.cit., p2; Appendix B, p.11-13
337 Sam Plaschke, op.cit., p.4

www.TheCIE.com.au
242 Proposal to include minimum accessibility standards for housing in the National Construction Code
Affordability
A number of submissions pointed out the proposed changes would increase the costs and
thus impact housing affordability, especially for first home buyers. The higher cost would
result in a reduction in new dwelling demand.
First home buyers or persons with a limited budget may be excluded from the new
housing market due to the increased costs which would generally not assist them directly.
Affordable housing supply continues to be an increasing issue and introduction of
additional measures across all new dwellings will further exacerbate this problem. It will
result in an overall reduction in new housing demand. 338
For many people with accessibility needs and those on low incomes, affordability would
be a key concern. Reductions in affordability would disadvantage some in the
community.
Questioning ‘one-size-fits-all’ approach
A number of submissions questioned the ‘one-size-fits-all’ approach taken in the proposal
to the NCC.
Some suggested it may erode the market system.339
Some suggested that it is a tax mixed with social policy.340
Loss of architecture richness and diversity
A number of submissions pointed out that some house designs will no longer be viable
with the introduction of proposed accessibility requirements in the NCC. For example,
split level homes, those incorporating mezzanines, pole homes and traditional
Queenslanders do not lend themselves to being very accessible by their nature.
Other safety concerns
Registered Accommodation Association of Victoria (RAAV) pointed out a scenario as an
unintended consequence, where a non-wheelchair user uses a wheelchair accessible
shower. Because the wheelchair accessible shower has no shower door, excessive water
could spray across the floor, increasing the risk of slips and falls. 341
338 Sam Plaschke, op.cit., p.4
339 Anonymous Submission 958471840, answer to Question 17, accessed 7 December 2020,
https://consultation.abcb.gov.au/engagement/consult-ris-accessible-
housing/consultation/published_select_respondent
340 Anonymous Submission 715644280, answer to Question 11, accessed 7 December 2020,
https://consultation.abcb.gov.au/engagement/consult-ris-accessible-
housing/consultation/published_select_respondent
341 Berenice Hale, op.cit., p.2

www.TheCIE.com.au
Proposal to include minimum accessibility standards for housing in the National Construction Code 243
Preferred option
Question 19 asked respondents to suggest their preferred option.
Chart A.9 reports the count of 98 respondents answering their preferred option through
the Consultation Hub. Some 42 respondents prefer a regulatory option with 11 preferring
Option 2 (Gold), while 30 respondents prefer a non-regulatory option and 13 prefer other
options.
In total about 118 respondents did not answer the question, including those submitting
their responses outside the Consultation Hub. By manually analysing the
answers/submissions provided outside the Consultation Hub, a further 82 respondents
with preferred options were identified.
Chart A.10 reports the simple count of preferred options, including those submitted in
response to the Consultation Hub questionnaire and those providing direct submissions.
It should be noted that many written submission-based responses provided multiple
choices as their preferred options. This is why the total count in the chart is more than
the number of responses. The chart shows that Options 2 and 6 are the most preferred
options – 55 and 50 counts respectively.
To resolve the multiple choices provided in the written submissions, an option with the
most stringent requirement was selected by CIE for the response which favours several
regulatory options, and if multiple non-regulatory options were preferred by one
response, the least stringent option was selected. The results are presented in chart A.11.
As shown in chart A.11, 93 respondents prefer a regulatory option with 54 preferring
Option 2, while 58 respondents prefer a non-regulatory option with 49 preferring Option
6. There are 16 respondents who prefer other options.
A.9 Preferred option (feedback through Consultation Hub)
Note: Structured answer to Question 19 through the Consultation Hub.
Data source: Consultation Hub.
0
5
10
15
20
25
Status quo Option 1 Option 2 Option 3 Option 4 Option 5 Option 6 Other
option
Not
Answered
Nu
mb
er
of
su
bm
issio
ns

www.TheCIE.com.au
244 Proposal to include minimum accessibility standards for housing in the National Construction Code
A.10 Preferred option in all submissions including multiple choices
Note: Structured answer to Question 19 through the Consultation Hub.
Data source: Consultation Hub.
A.11 Preferred options in all submissions
Note: Answer to Question 19 through the Consultation Hub and other submissions.
Data source: CIE based on Consultation Hub.
Other options
Respondents were also asked to identify any alternative options to solve the identified
problem.
Some submissions suggested that a broader range of options should be considered,
including those beyond changes to the NCC. For example, one submission provided in-
principle support for ongoing progression of the RIS process and its findings, and
suggested considering a broader range of options, including beyond changes to the NCC,
0
10
20
30
40
50
60
Status quo Option 1 Option 2 Option 3 Option 4 Option 5 Option 6 Other option
Nu
mb
er
of
su
bm
issio
ns
0
10
20
30
40
50
60
Status quo Option 1 Option 2 Option 3 Option 4 Option 5 Option 6 Other option
Nu
mb
er
of
su
bm
issio
ns

www.TheCIE.com.au
Proposal to include minimum accessibility standards for housing in the National Construction Code 245
that might be considered to support the delivery of the appropriate level of accessibility in
new houses.
Some of the other options most cited are presented below.
Incentives provided to new accessible housing supply
One submission welcomed and supported both subsidy and enhancement options,
complemented by a certification and registration process for quality assurance and to
provide information on complying dwellings citing the Universal Housing Design
Incentive introduced by Brisbane City Council (BCC) in June 2019.
Some other incentive measures raised by submissions include:
■ Stamp duty holidays or reductions or other incentives to assist older Australians to
downsize to new, more accessible housing
■ Development of additional social housing
■ Support for housing incentive schemes which spread the cost burden of increased
accessibility across a broader cross spectrum of the community in line with the whole-
of-community responsibility for improving quality of life for Australians with
disabilities.
Education
Some submissions suggested that Options 5 and 6 will increase supply organically
through education of the wider community. Demand will be created and will more
accurately address supply issues without imposing unnecessary requirements on
100 per cent of new housing supply.342
One submission suggested it would be sensible to develop the LHDG into a precise and
accurate document to remove ambiguity and enable it to become a standard (not a
guideline) in its own right.343
Education could be provided to members of the community through various mediums
along with research into demand which could be both location and needs specific.
Financial incentives or stimulus could be targeted to specific areas of need to cater for the
time lapse between education and the growth in market demand.344
It was argued that this approach would result in the provision of targeted, fit for purpose
housing, in the correct volume and in the correct location. Should uptake in the private
sector not eventuate the evidence gained through this time would direct the result, with
potential amendments completed accordingly. 345
342 Sam Plaschke, op.cit., p.3
343 Sam Plaschke, op.cit., p.3
344 Sam Plaschke, op.cit., p.3
345 Sam Plaschke, op.cit., p.3

www.TheCIE.com.au
246 Proposal to include minimum accessibility standards for housing in the National Construction Code
Applied to only defined sites and areas
One submission suggested there is a key role for state and local governments in
identifying sites that are suitable for LHA certified dwellings through incentives to
encourage voluntary adoption of the LHDG compliant housing options. Offsetting
impacts on net usable area of a dwelling should also be considered. This would have
positive impacts for educating the market about the benefits of the LHDG and further
enhance the market’s perceived value and willingness to pay for liveability.
ACSA suggested accessibility criteria could apply to only defined areas in new buildings
e.g. entrance, hallways, kitchen/dining/lounge, main bathroom and bedroom (and not
subsequent bathrooms and bedrooms).346
Proportional to suburban demographics
One submission suggested the creation of new housing stock (Class 1 and Class 2) be
appropriate to the demographics of each suburb, rather than a broad-brush national
mandate.
Exemption
A number of submissions suggested that exemptions to accessibility requirement should
be clearly defined and included in the NCC. For example, ACSA suggested
incorporating an exemptions process to accessibility criteria where local circumstances
would render accessible housing financially unviable. Criteria for exemptions could, for
example, include:
■ site issues (slope/ramping requirements, step free entrances)
■ yield, and
■ car parking costs (particularly for class 2 buildings).347
One example, provided in a submission, considered an exemption could be granted if the
cost of providing ramp exceeds 15 per cent of the build cost.348
One submission suggested that, if there are to be mandatory provisions they should only
apply to a percentage of new dwellings and a broad range of housing types should be
completely exempt from the provisions.
Mornington Peninsula Shire Council suggested regular reporting and auditing to ensure
that there is no overuse of exemptions. This should include an operational general review
of the effectiveness of any new provisions after 12 months of operation.349
346 Derek Dittrich, op.cit., p.6
347 Derek Dittrich, op.cit., p.6
348 Submission by Andrew Remely for Andrew Remely - Building Designer, answer to Question
23, accessed 8 12 December 2020, https://consultation.abcb.gov.au/engagement/consult-ris-
accessible-housing/consultation/published_select_respondent
349 Submission by Cr Sam Hearn, Mayor Mornington Peninsula Shire for Mornington Peninsula
Shire, p.2 and p.10. accessed 8 December 2020,

www.TheCIE.com.au
Proposal to include minimum accessibility standards for housing in the National Construction Code 247
Applied to refurbishment too?
ACSA raised the issue of whether ‘accessibility’ is to be incorporated into refurbishment
of older building stock (for example older independent living units or older retirement
village units) where the upgraded buildings are not being ‘repurposed’. Requiring
‘accessibility’ outcomes for refurbishments of these types of dwellings may make them
financially unviable. If this is the outcome, housing availability will be reduced at the
affordable end of the housing market, further exacerbating a lack of supply.350
Database
One submission suggested that to ensure that accessible housing supply is meeting
localised demand, a central database containing all new projects and apartments which
are accessible and adaptable could be kept and linked to a search function within
property websites.
Similarly, PCA proposed establishing a national register for accessible housing to collate
existing data and expand it as new information becomes available, and to investigate the
possibility of providing accessibility information at the point of sale.351
Postponing the implementation of the proposal
One submission suggested that the ABCB should delay the NCC 2022 introduction by at
least 5 years, whilst undertaking a whole-of-project analysis approach.
Technical issues
One submission pointed out that the options presented might not be adequate for
wheelchair accessibility, particularly large electric wheelchairs which would require
additional modification to the home.
The same submission also pointed out that, some forms of housing; for example,
townhouses, split level homes, those incorporating mezzanines, pole homes, traditional
Queenslanders, and those on sloping sites, do not lend themselves to being very
accessible by their nature. It is suggested increasing accessible housing supply should be
achieved across industry while not creating an impact on these forms of housing.
Cost estimates
Scenarios and weights
There were 76 responses to the Consultation Hub questions about the costing scenarios
(Question 20) and the weighted average approach (Question 21). Slightly more
350 Derek Dittrich, op.cit., p.6.
351 Tim Wheeler, op.cit., p.2 and p.4

www.TheCIE.com.au
248 Proposal to include minimum accessibility standards for housing in the National Construction Code
responses, 43 versus 33 for Question 20 and 39 versus 37 for Question 21, agree with the
scenarios and the weighted average approach for estimating the costs (chart A.12).
A.12 Views on the costing scenarios and approach
Note: Structured answer to Questions 20 and 21.
Data source: Consultation Hub.
Baseline
Some submissions argued that the estimated costs are higher than the true cost because
some requirements in the proposal are already present in new dwellings.
For example, minimum dimensions and floor areas for width of halls, circulation spaces
to kitchen areas, bathrooms and laundries are generally already greater than the
minimum dimensions and areas in most new Class 1a project homes and custom built
homes.352
One submission pointed out that accessible dwellings have been provided in new
construction, so no or minimal modifications are required.353
Doorways are usually built with 820mm wide doors.354
352 John Hatch, op.cit., answer to Question 21.
353 Anonymous Submission 351248224, answer to Question 13, accessed 8 December 2020,
https://consultation.abcb.gov.au/engagement/consult-ris-accessible-
housing/consultation/published_select_respondent
354 Submission by David Aitken for Town of Victoria Park, answer to Q13, accessed 8 December
2020, https://consultation.abcb.gov.au/engagement/consult-ris-accessible-
housing/consultation/published_select_respondent
0 20 40 60 80 100 120 140
Scenarios
correct
Weighted
average
approach
appropriate
No of respondents
Yes
No
Not Answered

www.TheCIE.com.au
Proposal to include minimum accessibility standards for housing in the National Construction Code 249
A submission noted that closer to 100 per cent (rather than 70 per cent as assumed in the
DCWC costing) of custom homes have corridors of 1 000mm already.
Level access through double garage is standard, according to Murphy Homes in
Queensland, so there are no additional costs.355
Opportunity cost of additional space requirement
Question 22 asked about the approach taken to valuing the opportunity cost of the
additional space required. 36 submissions agreed with the approach while 37 submissions
did not, with the remaining 130 submissions not providing an answer. Among the 33
submissions not agreeing with the approach, 14 argued that the cost was overstated while
10 suggested the opposite (chart A.13).
A.13 Do you agree with the approach of valuing the opportunity cost of additional
space requirement
Note: Answers to Question 22.
Data source: CIE compilation based on submissions on the Consultation Hub.
Space cost may be overstated because:356
■ good design can overcome space impacts (absorbed internally)
■ quality of design will improve over time. For example, the apartment guides in NSW
(2015) and Victoria (2017) through State planning mechanisms markedly improved
the quality of design and the level of innovation in apartment construction and ended
the proliferation of substandard sole-occupancy units
■ costs may be recovered through the supply of better designed buildings (lighter, more
airy spaces, more thoughtful layouts and greater ease of movement) for early adopters
of the standard before it is mandated. The City of London’s RIS found that this to be
355 Margret Ward, op.cit., p.41
356 Margret Ward, op.cit., p.16-17, p.41
Not Answered, 130
Yes, 36
Understated, 10
Overstated, 14
Other, 13
No,
37

www.TheCIE.com.au
250 Proposal to include minimum accessibility standards for housing in the National Construction Code
a significant cost recovery factor with the lower end of the recovery range at 60 per
cent of costs (EC Harris, 2014) referred to in the submission
■ functional spaces in apartments are shared spaces (e.g. laundry in cupboard or
corridor, study nook in entrance), so dis-amenity from space impacts may be
overstated, and
■ most homes are spacious enough to incorporate the requirement so there is no need to
increase floor space.
In addition, one submission argued that there would be potential environmental benefits
due to less wasted space with its associated build and running costs.357
On the other hand, some submissions argued that space costs were understated as land
has been more and more difficult and expensive to access. Custom home design and
building on sloping sites will be difficult.
One submission argued that on a 10 to 15 per cent sloping lot, the proposed accessible
requirement would make a house 38 m2 bigger and accordingly require the lot size to be
100 m2 bigger.358
P2P Housing presented four plans for detached houses from Murphy Homes and the
additional space requirement for Silver ranges from 2.01 m2 to 4.78 m2 for single storey
houses, implying the average space requirement for Silver is 3.67 m2 (compared to the
0.61 m2 for volume build and 0.48 m2 for custom build used in the Consultation RIS).359
One submission suggested, for Class 2 buildings, a whole-of-project approach is required
to costing the space requirement; for example, deeper basements and water table levels all
increase the costs. The feasibility of apartment yields and sensitivity of gross floor area
(GFA) are important factors to understand the true costs. 360
One submission argued that 7 to 30 per cent more space would be required to be
compliant. 361
357 Submission by C Harvey, answer to Question 22, accessed 8 December 2020,
https://consultation.abcb.gov.au/engagement/consult-ris-accessible-
housing/consultation/published_select_respondent
358 Anonymous Submission 958471840, answer to Question 26. accessed 8 December 2020,
https://consultation.abcb.gov.au/engagement/consult-ris-accessible-
housing/consultation/published_select_respondent
359 Submission by Shane de klerk for P2P Housing (Parent to Parent Assoc QLD Inc.), p. 7-10,
accessed 8 December 2020, https://consultation.abcb.gov.au/engagement/consult-ris-accessible-
housing/consultation/published_select_respondent
360 Anonymous Submission 252858313, answer to Question 22, accessed 8 December 2020,
https://consultation.abcb.gov.au/engagement/consult-ris-accessible-
housing/consultation/published_select_respondent
361 Anonymous Submission 462974436, answer to Question 22, accessed 8 December 2020,
https://consultation.abcb.gov.au/engagement/consult-ris-accessible-
housing/consultation/published_select_respondent

www.TheCIE.com.au
Proposal to include minimum accessibility standards for housing in the National Construction Code 251
Another submission suggested in its answer to Question 14 that real costs are likely four
times higher for sloping sites. 362
One submission suggested that Option 1 requiring all apartment car parking spaces to be
around a third larger, creates underestimated costs in the Consultation RIS. Another
submission argued that Option B (one step) is not accessible.363
One submission suggested that significant costs are also generated from slab finished
level requirements, balcony step, stair landings, additional space use and the requirement
for a ground floor bedroom.
MBA suggested that cost impacts to the home from a valuation perspective by decreasing
net useable area of the building and property to facilitate accessibility has not been
accounted for.364
Capital value
Dalton and Carter (2020a) suggested that additional space as a result of accessibility
requirements would increase capital value in addition to the value of enhanced
functionality from improved accessibility.
The Centre for Universal Design Australia pointed out the experience in the UK where
the requirement for a downstairs toilet soon became of additional value to purchasers.365
In addition to the potential capital gain, the extra space has other potential value for use
other than for accessibility to people with mobility impairment, suggested by the ACT
Disability, Aged and Carer Advocacy Service (ADACAS); for example, future
requirement of housing for work purposes, a place to educate children, a place where
people will age and receive care and support.366
In addition, it has long term benefits to the community and all levels of government, in
terms of services and capital infrastructure implications (PM&D Architects P/L).367
Other submissions made counter arguments for capital value. As pointed out by MBA,
the consumer measures and values the size of habitable rooms and recreational outdoor
space more than the width of a hallway or toilet space. Where room sizes are reduced to
accommodate wider hallways to facilitate compliance for accessibility, the capital value
of the home would be lesser as a result.368
362 Anonymous Submission 400818322, answer to Question 14, accessed 8 December 2020,
https://consultation.abcb.gov.au/engagement/consult-ris-accessible-
housing/consultation/published_select_respondent
363 Submission by Michael Fox for Rights & Inclusion Australia, answer to Question 21, accessed
8 December 2020, https://consultation.abcb.gov.au/engagement/consult-ris-accessible-
housing/consultation/published_select_respondent
364 Max Rafferty, op.cit., p.10.
365 Jane Bringolf, op.cit., answer to Question 22.
366 Michael Bleasdale, op.cit., answer to Question 22.
367 Geoffrey Barker, op.cit., answer to Questions 18 and 22.
368 Max Rafferty, op.cit., p.10

www.TheCIE.com.au
252 Proposal to include minimum accessibility standards for housing in the National Construction Code
In addition, a number of submissions pointed out that the accessible features were often
removed after a new consumer purchased or rented the house, suggesting a capital loss.
Excavation cost
The Consultation RIS discussed the excavation costs and presented the estimates in table
5.12. The costs were used for sensitivity analysis, but not included in the central CBA.
Question 23 asked respondents whether additional excavation costs are likely to be
required in order to provide homes that comply with the regulatory options (Options 1-
3), and Question 24 asks whether the excavation cost estimates presented in table 5.12 of
the Consultation RIS were reasonable.
Are additional excavation costs required?
75 submissions provided an answer to Question 23. Among them, 42 submissions agreed
that additional excavation costs are likely or highly likely, while another 33 submissions
pointed to the opposite (chart A.14).
A.14 Likelihood of additional excavation costs
Data source: Consultation Hub.
Arguments put forward in some submissions for additional excavation costs include:369,
370, 371
369 Submission by David Cremona for Meriton, p.2, accessed 8 December 2020,
https://consultation.abcb.gov.au/engagement/consult-ris-accessible-
housing/consultation/published_select_respondent
370 Anonymous Submission , answer to Question 21, accessed 8 December 2020,
https://consultation.abcb.gov.au/engagement/consult-ris-accessible-
housing/consultation/published_select_respondent
371 Andrew Ferris, op.cit., answer to Question 23.
0
20
40
60
80
100
120
140
Highly unlikely Unlikely Likely Highly likely Not Answered
Nu
mb
er
of
su
bm
issio
ns

www.TheCIE.com.au
Proposal to include minimum accessibility standards for housing in the National Construction Code 253
■ Increased space or building footprint size will impact on excavation costs
■ Class 2 basement, pipes or easement are impacted
■ Options 1 to 4 seek a maximum 1:14 rise from front boundary to slab finished level.
This would require a lower underlying pad level of finished allotments to change from
what is normally produced in land divisions today. The impact of this will mean in
most cases that there will be higher costs associated with site excavation and exported
material. This would also create the need for the majority of lots to have a more
developed stormwater drainage system to drain the surface and roof water to protect
the dwelling as there will be less fall to the street kerb and channel.
■ Providing adequate flooding mitigation for homes and preventing moisture
penetration to the structure of these homes is a key concern for sustainable
development and construction.
■ This component of works is significant. One example is that the larger car parking
spaces required under LHDG Silver would introduce column grid inefficiencies, and
possibly mean additional basement parking levels are required. Similarly, the higher
parking height requirements under LHDG Gold would require 900mm of additional
excavation for a 2-3 basement level development, and increase perimeter shoring wall
depths, foundation pile depths, and hydrostatic slab requirements.
By contrast, other submissions argue that little or no additional excavation costs will be
incurred for the following reasons:
■ Excavation required is invariant to accessibility requirement, so no additional costs
■ Most development, especially volume builders, favour flat sites
■ Alternative design, for example, access from garage would avoid the need for
excavation
■ Exemption may be granted to those sloping lots and government planning controls
may mean steep sites are not to be developed
Are the excavation cost estimates presented in the Consultation RIS reasonable?
65 submissions answered Question 24, with 34 agreeing that the cost estimates are
reasonable and 31 disagreeing (table A.15). Among the 31 submissions not agreeing with
the excavation cost estimates, 18 submissions thought that additional excavation costs
would be likely or highly likely while 12 submissions considered additional excavation
costs unlikely or highly unlikely in their answer to Question 23.
A.15 Count of responses to Q24 breakdown by answer to Q23
Answer to Q24
Answer to Q23 Yes No Not Answered Total
Highly unlikely 3 11 3 17
Unlikely 13 7 5 25
Likely 16 10 2 28
Highly likely 2 2 1 5

www.TheCIE.com.au
254 Proposal to include minimum accessibility standards for housing in the National Construction Code
Answer to Q24
Answer to Q23 Yes No Not Answered Total
Not Answered 0 1 127 128
Total 34 31 138 203
Source: Consultation Hub
Some 33 submissions provided some supplementary information in response to the
question, including alternative estimates or reasoning. Review of this supplementary
information found that only 23 of the 33 submissions do not agree with the estimates in
the Consultation RIS.
Among the 33 submissions, 13 submissions do not provide alternative estimates or
reasoning, citing no expertise, they are not qualified to comment, not being able to find
the table, no position fully established, or not relevant to excavation costs (table A.16).
A.16 Reasons for disagreeing with the excavation cost estimates in Consultation RIS
Count
Not providing alternative estimate or reasoning 13
no expertise/not qualified 6
not sure 1
can't find the table 2
not assessed 1
not relevant answer 1
not specific 1
position not established 1
Excavation costs over-estimated 12
little or no additional cost 2
excavation required invariant to accessibility 1
alternative design 4
exemption 4
should not be singled out 1
Excavation costs under-estimated 9
not enough 5
site variation 4
Other 3
too many variables 1
hard to estimate 1
industry provided 1
Note: The number of counts is different to the number of submissions as some submissions provided multiple reasons.
Source: Consultation Hub.
Reasons for not agreeing with the excavation cost estimates in the Consultation RIS
include:
■ costing being provided by industry subcontractors

www.TheCIE.com.au
Proposal to include minimum accessibility standards for housing in the National Construction Code 255
■ site conditions vary dramatically, e.g. location and soil type, and thus not appropriate
for an average
■ cost estimate is understated – a number of submissions provided very different
alternative estimates; for example:
– bulk and detailed excavation cost $2 750 without rock excavation and retaining
walls only would cost $60 000 on a 10 to 15 per cent sloping lot372
– inadequate cost estimate of the extra excavation, which should be in the range of
$20 000 to $50 000 per lot
– It was found that the costs would be between $36 500 and $41 000 per apartment
pending ground conditions and water table heights. For example, Dee Why city
centre would see costs escalate to over $100 000 per car spot due to the adverse soil
conditions and construction implications due to hydrostatic uplift and flood
management.
■ people with a disability not wanting to live on a sloping lot, so no excavation required
■ excavation cost is one of many cost items and should not be singled out
■ difficult sites could be exempted under the proposed changes to the NCC, and most
volume housing developers favour flat sites for other reasons
■ excavation cost could be avoided by careful design and better site preparation, e.g. a
driveway to the carport
■ a degree of excavation is required for a standard home and is not necessarily an
additional cost to be accessible.
Transition cost
Some submissions pointed out that some transition costs for industry were not considered
or were underestimated in the Consultation RIS; for example,
■ costs in R&D and rework on new designs
■ working drawings
■ brochures, and
■ website updates.373
There are transition costs associated with reconfiguration and alignment of building
footprints and lot dimensions (WA Department of Communities Housing Advisory
Unit).374
Changing a standard form design has impacts not only on design costs (around $5 000 to
$8 000 per design according to AusBuild), but also on construction, marketing and
372 Anonymous Submission 958471840, answer to Question 26, accessed 8 December 2020,
https://consultation.abcb.gov.au/engagement/consult-ris-accessible-
housing/consultation/published_select_respondent
373 Peter Springham, op.cit., answer to Question 21.
374 Coralie Ayres, op.cit., answer to Question 26.

www.TheCIE.com.au
256 Proposal to include minimum accessibility standards for housing in the National Construction Code
sales.375 Transition of adjusting lot configuration and sizes, to accommodate changes to
dwellings will take 3-5 years. Some builders and developers have indicated to Housing
Industry Association (HIA) that these transition costs may be higher than physical
construction costs.376
Wilson Homes Tasmania pointed out that retraining will be required across the industry
– all areas of new housing business staffing units would require retraining. It also noted
that there will be more marketing costs as it takes resources and time to raise the
awareness of potential customers.377
AusBuild pointed out that the proposed changes to the NCC will apply to dwellings built
on land that is currently being purchased and subdivided, and because the planning and
approval process takes more than two years, this may create costs where subdivisions
have to be altered to meet the proposed requirement.378
By contrast, other submissions argued that transition costs are over-stated:379
■ industry players are already incorporating Silver standard and don’t have to retrain to
understand this standard
■ changing regulations/requirements is ‘normal’ in the building industry and this
experience will help reduce transition costs – incorporating regulation changes is part
of the job
■ transition cost for architects, building designers, builders and certifiers would be
minimal as this sector of the industry is well accustomed to changes in building
requirements and Development Application permit requirements (ANUHD quoted
cases from Murphy Homes on the Sunshine Coast).
Efficiency gains from standardisation
Some submissions argued that the cost of incorporating changes in standards and
requirements falls over time as the market innovates to deliver these changes.
For example, as outlined by ANUHD in its submission, cost reductions would be
captured by a mandatory scheme for the following reasons:380
■ increased efficiencies of scale
■ reduced need to develop bespoke solutions
■ reduced risk of construction errors, especially for volume builders
■ removing the need for different government funders and customers to each specify the
accessibility standards to apply to their projects, and
375 Brent Fletcher, op.cit., p.7.
376 Submission by Simon Croft for Housing Industry Association, p.26
377 Sam Plaschke, op.cit., p.6.
378 Brent Fletcher, op.cit., p.5.
379 Margret Ward, op.cit., p.17-18 and p.41.
380 Margret Ward, op.cit., p.17 and p.41.

www.TheCIE.com.au
Proposal to include minimum accessibility standards for housing in the National Construction Code 257
■ efficiency gains from one national standard for builders, regulators and planners to
save time as they don’t have to use and understand different standards.
This sentiment is echoed in other submissions. ADACAS suggested that the costings do
not adequately take account of economies of scale, and the potential savings in
manufacturing and retailing costs of, for example, standard sized doors. The majority of
cost increases will be largely deflected by mass adoption, and any modest increase in the
price of housing will be negligible and absorbed into the cost of the real estate in any
case.381
One submission provided an example of how economies of scale could help to reduce the
construction cost. Palm Lakes Resort in Ballina NSW offers retirement accommodation
at Gold Plus in hundreds of standalone dwellings. Common sense design of a suite of
floor plans and economies of scale meant construction costs were comparable to the
market cost for similar dwellings built elsewhere in suburbia.382
It was also suggested that the proposed changes may adversely impact industry
productivity because currently homes are optimised to reduce costs as much as possible,
so deviating from optimisation increases costs.383
Other costs
A number of submissions suggested other cost items that should be considered in the
RIS.
Underground work
Where underground infrastructure (tunnels and sewerage) or water tables prevent
additional levels being added to underground carparks, the results will be more
apartments without carparks, lowering their value.
Additional costs for entrance requirement
Option 1B for dwelling entrance (one step) has additional requirements such as boundary
to door excavation, 1m wide landings, structural components, and a threshold ramp. For
some houses that don’t have a path (bark, gravel or landscaping items), the requirement
for an accessible path would mean more costs.
381 Michael Bleasdale, op.cit., answer to Question 21.
382 Submission by John McPherson, answer to Question 13, accessed 8 December 2020,
https://consultation.abcb.gov.au/engagement/consult-ris-accessible-
housing/consultation/published_select_respondent
383 Anonymous Submission 442128431, p.1, accessed 8 December 2020,
https://consultation.abcb.gov.au/engagement/consult-ris-accessible-
housing/consultation/published_select_respondent

www.TheCIE.com.au
258 Proposal to include minimum accessibility standards for housing in the National Construction Code
Waterproofing costs for dwellings
Submissions cited the need for additional items including waterproof door seals, concrete
hobs, a grated drain at doorways, low angle slope to balconies and awnings to deal with
waterproofing.
Costs to replace framed floors
One submission raised the point that framed floors with required subfloor clearances for
termite inspection may no longer be viable under Options 1 to 3 without excavation and
significant ramps. The cost of replacing framed floor solutions with slab-on-ground
solutions (with associated excavation costs and insulation issues) should be
considered.384
Wall cost
Cost of wall reinforcement is too low in the Consultation RIS.
Waterproofing costs for bathroom
Level access showers have drainage issues, and waterproofing for the whole bathroom is
required and incurs costs if the shower door is removed.
Costs of removing shower-over-bath design
Shower-over-bath design is not compliant under the proposal. However, some
consumers, for example young families with children, need both bath and shower, and
the shower-over-bath design is an efficient solution for them. Removing this design
would mean they have to have a separate bath built with additional cost.
Granny flat costs
Granny flats are required to be transportable and are currently designed to fit on trucks.
Space requirements of the NCC provisions may change this, causing significant re-design
costs.385
Compliance costs
The Strata Community Association suggested that increase in accessibility standards
requires an increase in compliance cost to avoid “defects” where homes are supplied
384 Anonymous Submission 754879813, answer to Question 21, accessed 8 December 2020,
https://consultation.abcb.gov.au/engagement/consult-ris-accessible-
housing/consultation/published_select_respondent
385 Anonymous Submission 946040564, p.1, accessed 8 December 2020,
https://consultation.abcb.gov.au/engagement/consult-ris-accessible-
housing/consultation/published_select_respondent

www.TheCIE.com.au
Proposal to include minimum accessibility standards for housing in the National Construction Code 259
without required features386. AusBuild suggested that additional certifier time would be
required.387 Another submission suggested that changes to standard form designs,
subdivision layouts and display home requirements would require additional certification
and approval and would incur costs.
Maintenance costs
The Strata Community Association pointed out that maintenance costs will be higher
because more expensive buildings are generally more expensive to maintain.388
Distributional impacts
Cost of regulation is not evenly distributed. It is higher in smaller markets where the cost
of specialist installation/maintenance is higher.
Alternative cost estimates and quantity surveyor issues
Alternative cost estimates
WA Department of Communities Housing Advisory Unit noted internally collected data
from the Department’s construction of new social and affordable dwellings and
renovation works suggest costings vary between $600 to $2 500 for LHDG Silver for new
builds.389
P2P Housing presented four plans from Murphy Homes and quoted an average
additional cost of $3 000 to achieve Silver.390
One submission estimated total additional costs on a typical lot of 10 to 15 per cent
sloping for an average sized house would be between $235 000 and $261 192 (table
A.17).391
A.17 Cost estimates provided by one submission
Item Cost ($)
Bulk and detailed excavation (not including rock excavation) 2 750
Additional retaining walls and stormwater drainage 60 000
386 Submission by Shaun Brockman for Strata Community Association, p.9, accessed 8 December
2020, https://consultation.abcb.gov.au/engagement/consult-ris-accessible-
housing/consultation/published_select_respondent
387 Brent Fletcher, op.cit., p.8.
388 Shaun Brockman, op.cit., p.7.
389 Coralie Ayres, op.cit., answer to Question 13.
390 Shane de klerk, op.cit., p.4.
391 Anonymous Submission 958471840, answer to Question 26, accessed 8 December 2020,
https://consultation.abcb.gov.au/engagement/consult-ris-accessible-
housing/consultation/published_select_respondent

www.TheCIE.com.au
260 Proposal to include minimum accessibility standards for housing in the National Construction Code
Item Cost ($)
Extra cost associated with large garage 18 500
– slab only 6 850
– extra costs over the added cost of the garage slab a 11 650
Reinforcing the bathroom and toilet walls 2 296
Installing sub-sill drainage to all sliding doors on the basis that the outdoor areas are level with
the main house floor level
2 950
Land cost for larger lot size (100 m2 bigger) 91 666
Bigger house size (38 m2 larger) 83 030
Total 261 192
a including extra walls, larger garage door, more frame work, larger steel lintels over garage door, extra roofing material
Source: Anonymous Submission 958471840, answer to Question 26
Community Housing Industry Association suggested that:392
■ it costs $5 400 to $6 000 to upgrade homes to Silver, with this data being more
applicable to ‘units’ (apartments and townhouses)
■ the cost to upgrade to Gold is $27 000 per unit, and
■ it costs $1 500 per dwelling for additional design and certification costs.
A lift can add $50 000 - $100 000 to a project. A disabled bathroom costs more than
$410 000 (as such) and ramps can add huge costs.393
One submission provided costings for constructing adaptable housing and accessible
housing to Gold level which required increasing the overall house size to accommodate
larger bathroom areas and an accessible bedroom. Additional costs to the dwellings were
between $17 000 and $21 000.
Another submission cited its members analysis which shows proposed changes would
cost upward of $55 000 per apartment. It also cited costings from a developer that the
costs would be between $36 500 and $41 000 per apartment pending ground conditions
and water table heights. For example, Dee Why city centre would see costs escalate to
over $100 000 per car spot due to the adverse soil conditions and construction
implications due to hydrostatic uplift and flood management.
The MBA submission provided cost estimates for some elements according to member
feedback (table A.18). MBA also provided some comments on the elements which have
cost implications:394
■ Fly wire/security doors will create a further impact to costs as the landing or
accessible area on the approach side will need to be larger
■ All hallways will need to be a minimum 1 050mm wide
392 Submission by Wendy Hayhurst for CHIA, p.6-7, accessed 8 December 2020,
https://consultation.abcb.gov.au/engagement/consult-ris-accessible-
housing/consultation/published_select_respondent
393 Anonymous Submission 57608831, answer to Question 13, accessed 8 December 2020,
https://consultation.abcb.gov.au/engagement/consult-ris-accessible-
housing/consultation/published_select_respondent
394 Max Rafferty, op.cit., p.11

www.TheCIE.com.au
Proposal to include minimum accessibility standards for housing in the National Construction Code 261
■ All doors will need to be a minimum 870 to 920mm in lieu of 820mm
■ Toilets need to be wider and deeper which will impact the designs of the common
area in the home
■ WC needs skirts and switches, so the toilet suite is measured 900mm clear from walls
or skirts and switches
■ Straight stairs without winders will make a substantial impact on the useable space of
the floor design, and
■ Considering required location for additional smoke detectors for future allocation of a
non-dedicated bedroom becomes problematic and will add additional cost.
A.18 Cost estimates by MBA to achieve accessibility standards
Item Cost ($)
Access via paths and driveways which are not a standard inclusion for most homes 5 000
Entrance door upgrade area 350
Step free entrance
Consultation fees and building surveyor/certifier fees for performance solution 3 500
Inclusions for grate drain, plumbing work, concreting 1 000
Internal doors 150 each
Bathroom and toilet
A bathroom with a hobless shower will need to be fully waterproofed, bedded and graded 2 000
Poly marble bases no longer suitable 2 000
Solid blocking or sheeting to bathroom, toilet areas 500
Upgrade to accessible toilet suite from standard 300
Source: MBA submission.
PCA provided a case study to illustrate how building to LHDG Gold requires an increase
in overall apartment size and reduces yield and the number of dwellings on a
development plot.395
Wilson Homes Tasmania suggested the following elements were missing from the
Consultation RIS or required adjustments:396
■ addition of the path itself should a car space not be utilised or comply
■ excavation, retaining or other siteworks for 1:40 grade parking in lieu of Australian
Standards (potentially also affecting dwelling floor levels)
■ covered parking to Gold and Gold Plus
■ internal (and one entry) doors require 820mm ‘clear opening’ inferring the use of an
870mm door
■ potential floor area increases to allow for shower and toilet requirements
■ 'removable' shower imposes significant requirements (waterproofing, falls to floors,
additional tiling/vinyl to walls, more floor space in bathroom), and
395 Tim Wheeler, op.cit., p.6-7.
396 Sam Plaschke, op.cit., p.4.

www.TheCIE.com.au
262 Proposal to include minimum accessibility standards for housing in the National Construction Code
■ hobless shower will make obsolete nearly all poly marble shower bases and increase
costs on entry level housing.
One submission noted that the step free entrance requirements will impact the choice of
structural floor system that can be used, essentially meaning that any raised sub floor or
raised slab systems would no longer be viable solutions.
Another submission pointed out cost savings from personal experience: ‘When building
our home - we saved expenses due to some modifications – rather than adding costs (i.e.
removing walls in bathroom areas to keep the space open).’397
Whole-of-project approach
Some submissions suggested adopting a whole-of-project approach for cost estimation.
For example, one submission mentioned the cost implication of car parking requirement:
■ The proposed changes of Silver Option would reduce the number of car spots within a
basement footprint, thus requiring an additional basement level or bigger basement
footprint. Larger car spots would also introduce column grid inefficiencies as typical
structural column grid layouts would not align with the superstructure. An
engineering review would need to be conducted to see if additional transfer
beams/capitols at columns etc. are needed and impact to yield.
■ The Gold Option will see an increase in carpark heights from 2.2 to 2.5m. Presuming
this is 2.5m clear of services, over 3 basement levels, an additional excavation depth
of 900mm would be needed. Whilst this doesn’t seem much, within ‘brown-field’ sites
the soil is generally classified as General Solid Waste or at times water charged. An
additional 900mm could significantly increase costs, to perimeter shoring wall depths,
foundation pile depths, hydrostatic slab requirements as so forth. Again a whole-of-
project approach would be required to truly understand the cost and risk implications
of this item.
Conflicting and competing requirements
Some submissions suggested, for Class 1a dwellings, that there is considerable concern
that the stepless entries and stepless outdoor thresholds will not be in accordance with the
NCC and Australian Standards and will require performance solutions: More specifically
■ the step free entrances will create substantive issues for water ingress, termite
protection and termination of cladding to protect against rising damp;
■ the requirements will conflict with local planning requirements that seek to manage
dwelling design including
– limits on cut and fill
– limits on dwelling heights
– boundary setbacks from each boundary which create a maximum building
footprint, or
397 Anonymous Submission 90458024, answer to Question 13, accessed 9 December 2020,
https://consultation.abcb.gov.au/engagement/consult-ris-accessible-
housing/consultation/published_select_respondent

www.TheCIE.com.au
Proposal to include minimum accessibility standards for housing in the National Construction Code 263
– higher set houses to improve street scape appeal and neighbourhood character
■ the proposals do not account for or resolve the impacts on dwellings from other parts
of the NCC such as the provision of weep holes and would require more costly and
possibly unsustainable slab requirements
■ not accounting for the need to ensure flood safety of dwellings and the requirements
of local governments and others for increasing freeboard of the slab above street
■ requirements for straight stair runs or mandatory ground floor bedrooms may make
dwellings difficult or impossible to fit on existing restricted sites.398
Interpretation
A number of submissions questioned the interpretation of the provisions in the proposed
change, for example the required clear-opening of doors (the width available to a user)
was mis-interpreted as the door leaf (width of the door frame).399
Additional inclusion
One submission suggested that slip resistance should be included in the proposed changes
to the NCC. The regulatory focus must be to ensure that products have adequate slip
resistance at the end of an economically reasonable life cycle, rather than a momentary
satisfaction of the slip resistance condition at the time of handover.400
Benefit estimates
Questions 27 – 34 asked respondents their views on the assumptions and approaches
used to estimate benefits of the proposed changes to the NCC.
As shown in chart A.19, there are roughly equal numbers of respondents agreeing or
disagreeing with the assumptions and approaches taken in the Consultation RIS to
estimate the benefits of the proposed changes to the NCC.
Among those who disagree with CIE’s approaches or assumptions, their views are
polarised. For example, some claim the benefits are overstated while others argue the
opposite.
398 Anonymous Submission 754879813, answer to Question 21, accessed 9 December 2020,
https://consultation.abcb.gov.au/engagement/consult-ris-accessible-
housing/consultation/published_select_respondent
399 Anonymous Submission 462974436, answer to Question 13, accessed 9 December 2020,
https://consultation.abcb.gov.au/engagement/consult-ris-accessible-
housing/consultation/published_select_respondent
400 Submission by Richard Bowman, p.1, accessed 9 December 2020,
https://consultation.abcb.gov.au/engagement/consult-ris-accessible-
housing/consultation/published_select_respondent

www.TheCIE.com.au
264 Proposal to include minimum accessibility standards for housing in the National Construction Code
A.19 Views on the assumptions and approaches to estimate benefits
Data source: Consultation Hub.
‘Allocation’ of new accessible housing
The Consultation RIS made assumptions about the occupation of accessible housing by
owner occupiers and renters. Question 27 asked respondents whether they considered the
assumptions to be reasonable.
As shown in chart A.19, some 35 respondents to the questionnaire agreed with the
assumptions, while 36 respondents did not. Not many respondents provided further
explanation.
One submission questioned the notion of allocation, suggesting it is problematic in a free
market where there is an undersupply of a particular product and a dysfunctional market
is a consequence. It is also practically unachievable and therefore a flaw in the approach
to considering problem reduction.
The extent of features assumed in the baseline
Significantly higher number of respondents agreed with the assumption about the extent
to which accessibility features are currently provided in the new dwellings than those
disagreeing (49 versus 25) in the answers provided to Question 28 via Consultation Hub.
Some submissions suggested that the Consultation RIS over-stated the extent to which
mobility needs are currently being met. Accessibility provided by current polices (e.g.
modifications) falls short of LHA benchmarks. In addition, “alternative” policies are not
0 10 20 30 40 50 60
Q27: Occupatoin assumption
Q28: Assumption of the extent
features not in new dwellings
Q30: Size of problem reduced
by partial accessbility
Q31: Additional features increase
the number of beneficiaries
No of respondents
Yes
No

www.TheCIE.com.au
Proposal to include minimum accessibility standards for housing in the National Construction Code 265
real alternatives to accessible housing, and thus the size of the problem and the benefits
may be understated; for example,401
■ Aged care: about 80 per cent of people don’t want to go into aged care
■ Social housing is less than 5 per cent of the market and most social housing was built
in 1950s-80s and is not accessible
■ SDA is an exception because it is generously funded and has a matching program
■ Voluntary programs have not worked.
By contrast, others argued that the extent of accessibility features assumed in the baseline
may be understated.
PCA questioned the estimate that only 5 per cent of newly constructed housing meets
LHDG Silver based on Livable Housing Australia’s certification figures, noting under-
reporting, suggesting there may be housing that, while being built to a LHCG standard,
has never officially sought certification.402 PowerHousing Australia suggests that new
community housing dwellings are generally built to LHA Silver, based on feedback from
their members.403
More supply of accessible housing in new developments appears a result of government
incentive programs and/or planning requirements.
Accessible Public Domain noted that many councils require housing developments to
include 10 to 20 per cent of units to be accessible, adaptable or LHA design.404
Many government projects, such as Build-to-Rent, DHHS and TAC, do provide Options
1 to 3 in their housing, according to Design Matters National.405
One submission pointed out that, in general, new homes are already more accessible than
older homes. It estimated approximately 10 per cent of new residential apartment
building dwellings across NSW met the LHDG requirements through an incentive
mechanism.
Another submission also pointed out that some developers are providing up to
10 per cent of units as adaptable or accessible housing, depending upon various council’s
requirements.
Alexandrina Council in South Australia conducted a community survey in 2016, which
found 54 per cent of dwellings are suitable for people with mobility impairments or other
forms of disability, and 30 per cent not suitable. The most commonly cited reasons for a
home not being suitable were:406
401 Margret Ward, op.cit., p.13-14, p.25 and p.48.
402 Tim Wheeler, op.cit, p.4
403 Nicholas Proud, op.cit, p.6
404 John Evernden, op.cit., answer to Question 29.
405 Submission by Peta Anderson for Design Matters National, answer to Question 29, accessed 9
December 2020, https://consultation.abcb.gov.au/engagement/consult-ris-accessible-
housing/consultation/published_select_respondent
406 Sam Priest, op.cit., p.5-6.

www.TheCIE.com.au
266 Proposal to include minimum accessibility standards for housing in the National Construction Code
■ the presence of internal or external steps
■ an unsuitable bathroom or toilet, and
■ difficulty moving around with mobility devices (commonly due to narrow hallway or
doorways).
Partial accessibility
Some but not all of the accessible features of the proposed changes may have already
been provided in new dwellings. Stakeholders were asked to comment on whether this
partial accessibility would reduce the size of the problem in the baseline (Question 30).
As shown in chart A.19, more respondents agreed that this would reduce the size of the
problem than those who disagreed (46 versus 30).
Some submissions pointed out that it may depend on the individual features and the
person in need.
Mornington Peninsula Shire acknowledged that while some features may make a
difference in particular cases (e.g. enabling a visit by a person who may need access to a
toilet with no stairs) such an approach did not present the required scale to increase the
liveability of the housing stock.407
ANUHD suggested that individual accessibility features do not provide related individual
benefits unless a coherent suite of accessibility features is provided.408
Post-Polio Victoria highlighted this argument with a case study (Case Study 3) in its
previous submission to the ABCB Options Paper:409
The cost of the fire door entry might have been $X, but if the occupier becomes too frail to
open it, then no matter how many accessibility features lie in the apartment on the other side of
that door, they are useless to the renter, and even the high cost of that desirable feature does
not render the whole flat accessible. Or if the lip onto the balcony is too high for the renter to
step over with a walker, then there might as well be no balcony. And the shower flooding the
entire bathroom floor when it is turned on in its stepless alcove - especially if the tiles become
slippery when wet – is useless to an older inhabitant who is very scared of falling, after
previously breaking her hip.
More features lead to more beneficiaries
A related question asked respondents if they agree with the assumption that additional
features required under accessibility standards in Option 2 and Option 3 would increase
the number of beneficiaries compared to Option 1 (Question 31).
As shown in chart A.19, more respondents agreed with the assumption than those who
did not (47 versus 24). A number of submissions suggested this was self-evident.
407 Cr Sam Hearn, Mayor Mornington Peninsula Shire, op.cit., p.12.
408 Margret Ward, op.cit., p.18 .
409 Barbary Clarke, op.cit., p.6.

www.TheCIE.com.au
Proposal to include minimum accessibility standards for housing in the National Construction Code 267
Some submissions argued that it is not necessarily the case. For example, more features
mean more costs, and ‘the people with most needs may not be able to afford it’.410
A number of submissions pointed out that Silver and Gold/Gold+ serve different
purposes.411 Silver is about visitability while Gold/Gold+ are about accessibility (that is
for people to live in). It is therefore not necessarily the case that moving from Silver to
Gold/Gold+ would increase the number of beneficiaries.
Benefits reduced proportionately with the cost
To avoid attributing benefits to accessibility features already installed in dwellings under
current arrangements, the impact of the proposal in the Consultation RIS was reduced in
proportion to those elements assumed prevalent and at weighted average cost. Question
33 asked respondents to provide additional evidence to make the assumption more
robust.
Submissions suggest it may also depend on individual circumstance.
‘Without knowing the exact nature of disability to be catered for existing features may be
rendered effectively redundant and be required to be removed or modified anyway’ (All
Construction Approvals).412
As mentioned above, ANUHD, among others, argued that individual accessibility
features do not provide related individual benefits unless a coherent suite of accessibility
features is provided.413 In other words, benefits should not be reduced proportionately
with the costs – marginal increase in costs would lead to full realisation of benefits.
Mismatch between undersupply and high willingness to pay
The Consultation RIS identified a mismatch between the amount of accessible housing
being built and the apparent willingness of many survey respondents (including
households without any persons with limited mobility) to pay above cost for Option 1.
Question 34 asked respondents to consider what the explanation might be for this
mismatch and whether it is a reflection of the market failure.
A number of submissions (Blind Citizens WA,414 for example) noted bounded
rationality and optimism bias as explanation for the market failure and the mismatch.
410 Anonymous Submission 1009094404, answer to Question 31, accessed 9 December 2020,
https://consultation.abcb.gov.au/engagement/consult-ris-accessible-
housing/consultation/published_select_respondent.
411 For example, see Margret Ward, op.cit., p.47.
412 Submission by Harald Weber for All Construction Approvals, answer to Question 33, accessed
9 December 2020, https://consultation.abcb.gov.au/engagement/consult-ris-accessible-
housing/consultation/published_select_respondent
413 Margret Ward, op.cit., p.18 and p.46.
414 Erika Webb, op.cit., answer to Question 34.

www.TheCIE.com.au
268 Proposal to include minimum accessibility standards for housing in the National Construction Code
Mornington Peninsula Shire noted it is expected to be a factor of market failure
associated with the general unaffordability of housing and the lack of standardisation in
housing products to match people’s ideal level of accessibility.415
The studies cited by one submission suggested that ‘the consumer is relative myopic
about the relative importance of accessibility and is willing to trade off these aspects.
While they regard accessibility and universal design positively in principle, when making
market decisions, it gets prioritised down.’
One submission suggested accessibility features are hypothetically nice to have but actual
purchasing decisions are made on perceptions of ‘must have’.416 The mismatch is a
reflection of the hypothetical willingness to pay rather than an actual commitment.417
It might be the case that survey respondents ‘do not express their controversial views, but
they respond differently when it comes to dollars and if it hurts’.418
Submissions419 also distinguished willingness to pay with capacity to pay as a reason for
the mismatch. People with the needs may want to pay for the features, but in reality they
cannot afford them.
Monopoly was also raised as a factor.420
It was suggested that the mismatch might be due to the misperception that demand is
high while the actual demand is low.421
The mismatch could also be a result of the demand and costs not being well studied and
the market responding accordingly,422 ending up with limited choices.423
415 Cr Sam Hearn, Mayor Mornington Peninsula Shire, op.cit., p.13.
416 Submission by Moshe Gilovitz for Moshe Gilovitz Architect, answer to Question 34, accessed
9 December 2020, https://consultation.abcb.gov.au/engagement/consult-ris-accessible-
housing/consultation/published_select_respondent
417 Anonymous Submission 506249822, answer to Question 34, accessed 9 December 2020,
https://consultation.abcb.gov.au/engagement/consult-ris-accessible-
housing/consultation/published_select_respondent
418 Anonymous Submission 1009094404, answer to Question 34, accessed 9 December 2020,
https://consultation.abcb.gov.au/engagement/consult-ris-accessible-
housing/consultation/published_select_respondent
419 For example, Jane Scott, op.cit., answer to Question 34.
420 John McPherson, op.cit., answer to Question 34.
421 Submission by Ron Lochert, answer to Question 34, accessed 9 December 2020,
https://consultation.abcb.gov.au/engagement/consult-ris-accessible-
housing/consultation/published_select_respondent
422 Anonymous Submission 405838978, answer to Question 34, accessed 9 December 2020,
https://consultation.abcb.gov.au/engagement/consult-ris-accessible-
housing/consultation/published_select_respondent
423 Anonymous Submission 628500418, answer to Question 34, accessed 9 December 2020,
https://consultation.abcb.gov.au/engagement/consult-ris-accessible-
housing/consultation/published_select_respondent

www.TheCIE.com.au
Proposal to include minimum accessibility standards for housing in the National Construction Code 269
Under-reporting of the accessible housing in the market is also cited as one factor for this
mismatch. Because there is no register of adaptable housing, it is possible that many
adaptable units have been built and the purchasers do not know that they have purchased
an adaptable unit.424
One submission attributed the mismatch to the survey contents (‘flawed and biased and
its findings unreliable’) and to chronic undersupply of accessible homes in the market.
Another submission questioned the representativeness of the survey sample.425
Benefits underestimated
Most submissions that suggested there was an understatement of benefits in the
Consultation RIS stated that this was related to an understatement of the size of the
problem (as discussed in detail in the previous section).
Some other submissions pointed out that the benefits may be underestimated because the
flow-on impact on other policies is not considered. For example, changes to the NCC426
■ may increase benefits of NDIS as NDIS is built on getting people into work427
■ avoid costs to implement reforms raised in the Royal Commission on aged care, and
■ reduce cost to Home Care Package and Commonwealth Home Support Program.
Benefits overestimated
By contrast, other submissions suggested that the benefits may be overestimated in the
Consultation RIS.
One suggested reason for overstatement is that the proposed changes to NCC are not
accessible and thus the benefits of achieving accessibility are overestimated. For
example, HIA notes428
■ that proposed changes to NCC are less than the wheelchair standard AS1428.1, and
■ that the single step entrance requirement does not meet community needs.
424 Anonymous Submission 552143712, answer to Question 34, accessed 9 December 2020,
https://consultation.abcb.gov.au/engagement/consult-ris-accessible-
housing/consultation/published_select_respondent
425 Anonymous Submission 462974436, answer to Question 34, accessed 9 December 2020,
https://consultation.abcb.gov.au/engagement/consult-ris-accessible-
housing/consultation/published_select_respondent
426 See Margret Ward, op.cit., p.27 and Hayley Stone, op.cit., p.18
427 This is limited by data reported by AMIDA – only 10 per cent of people with a disability are
eligible for NDIS
428 Simon Croft, op.cit., p.2-3.

www.TheCIE.com.au
270 Proposal to include minimum accessibility standards for housing in the National Construction Code
Advocate groups such as ANUHD and Summer Foundation also noted that the
proposed changes have been diluted down so much that they are no longer accessible.429
Another reason for overstatement of benefits is the difference between potential benefits
and actual benefits, as noted by HIA. For example, accessibility standards do not require
grab rails (only reinforced walls), therefore, the extent to which falls are prevented may
be overstated (although acknowledging that a step free path and a flat shower will reduce
falls).430
Benefits may be overstated due to using home modification as a proxy for the estimate of
the size of the problem. As discussed above, Home Modification Information
Clearinghouse noted that home modifications (which are bespoke to users) and universal
housing (which is general) may achieve different outcomes. They may be complements
rather than substitutes.431
A number of submissions suggested that a one-size-fits-all approach cannot capture
individual needs and modifications are still required. Some results of the survey in the
MDI and Summer Foundation submission appear to support this argument; for
example,432
■ although significantly more accessible than mainstream housing, partial inaccessibility
was surprisingly high even in specialist disability housing such as group homes (47.1
per cent) and supported residential services (46.2 per cent)
■ ability to afford home modifications remains a concern even for those living in
accessible homes (47.5 per cent of those with high support needs, and 44.2 per cent of
those with low support needs), implying that needs change over time and that more
modifications are required accordingly.
An information problem also impacts the realisation of accessibility benefits. People who
need or prefer accessible housing need more information on accessibility features in
housing. This is not achieved in the proposal and thus impacts the realised benefits.
HIA notes that accessible housing has been offered, but with little uptake.433 According
to Meriton, buyers rarely provide feedback about lack of accessibility features. Inner city
apartments are mostly owned/rented by young workers, while older people have higher
degrees of ownership than young people and thus better protected against accessibility
issues.434
A 2015 Registered Accommodation Association of Victoria (RAAV) member survey to
evaluate the performance of AS1428.1 standard found that only 6 members (out of 58
429 For example, see Margret Ward, op.cit., p.31 and Profession Bruce Professor Bruce Bonyhady
and Dr Di Winkler, op.cit. p.4 and p.21.
430 Simon Croft, op.cit. p.13-14.
431 Professor Catherine Bridge, op.cit., p.7.
432 Profession Bruce Professor Bruce Bonyhady and Dr Di Winkler, op.cit., Appendix 2, p.5-6 of
44.
433 Simon Croft, op.cit., p.12 and p.29.
434 David Cremona, op.cit., p.1-2.

www.TheCIE.com.au
Proposal to include minimum accessibility standards for housing in the National Construction Code 271
respondents) received 7 requests in total for disabled access facilities and 52 received no
requests. Member feedback indicated that rooms with full disability access are the last
rooms to be rented in a rooming house, and generally receive lower rentals as tenants
prefer a standard bathroom.435
The benefits created by accessible housing will be a function of the location of new
accessible housing because, for accessible housing to meet its purpose, it must be built
close to where people with mobility limitation live (or where they would prefer to
live).436
CBA approach
Symmetry in reporting costs and benefits
The submission by Melbourne Disability Institute (MDI) and Summer Foundation
included a report prepared by Associate Professor Andrew Dalton and Emeritus
Professor Rob Carton from Deakin Health Economics, Deakin University (Dalton and
Carter 2020), 437 suggesting the costs and benefits should be reported in a symmetric way
to avoid bias or confounding. Dalton and Carter (2020a) suggest the Consultation RIS
does not provide a symmetrical view of the benefits and costs in that the ‘problem
reduction approach’ over-counts the cost side while the ‘willingness to pay’ approach
under-counts the benefit side. They go on to suggest that benefits in these two approaches
are additive with less overlap: ‘we favour the no overlap/25% overlap results as most
items listed are clearly different’.438
Many advocate groups also quoted the Dalton and Carter report in their submissions.
Qualitative analysis
Consultation feedback expressed concern about the Consultation RIS for its lack of
qualitative analysis. As pointed out by ANUHD,439
The consultation RIS repeatedly concedes that the available quantitative data are incomplete
and unreliable. We share this concern and add that the Consultation RIS does not provide any
qualitative analysis in these areas as required.
435 Submission by Berenice Hale for RAAV, p.2-3, accessed 9 December 2020,
https://consultation.abcb.gov.au/engagement/consult-ris-accessible-
housing/consultation/published_select_respondent.
436.Tim Wheeler, op.cit., p.4
437 Dalton, Andrew and Rob Carter 2020a, Economic advice prepared to assist with responses to the
Consultation Regulation Impact Statement on minimum accessibility standards for housing in the
National Construction Code, prepared for the Melbourne Disability Institute, University of
Melbourne and the Summer Foundation, 18 August 2020, as Appendix 1 of the submission by
Melbourne Disability Institute (MDI) and Summer Foundation to the public consultation.
438 ibid, p.6
439 Margret Ward, op.cit, p.11

www.TheCIE.com.au
272 Proposal to include minimum accessibility standards for housing in the National Construction Code
The MDI and Summer Foundation submission echoes this criticism, ‘[i]t is notable,
however, that they make limited reference to equity considerations and that their analysis
does not include any qualitative analysis’.440
Discount rate
A key issue raised by many submissions, for example ANUHD, Summer Foundation
and MDI which refer to Dalton and Carter (2020a), is that the central case discount rate
of 7 per cent is too high. They suggest a rate of at most 3 per cent would be preferable,
citing the Australian bond rate and low discount rates used in other studies.
Other approaches suggested
Cost-effectiveness analysis
SGS Economics and Planning suggested a cost-effectiveness analysis (CEA). Their
submission noted that, under the CEA approach, ‘the desired outcome or end-state is
defined. With this outcome established, a range of implementation options can be
compared based on their relative costs and effects. This approach, unlike CBA, does not
require the benefits to be monetized.’441
Capability approach
An anonymous submission442 argued that a cost-benefit methodology is not the only
way to evaluate the provision of minimum standards for accessible housing.
The submission suggested that accessible housing needs to be seen as a human rights and
social justice issue, not just an economic issue. The submission proposed that a more
appropriate empirical methodology relating to people with disability is the capability
approach developed by Sen and Martha Nussbaum (2011). The capability approach can
be developed into an alternative evaluative tool which can replace traditional social cost-
benefit analysis. A nuanced development “Closing the Gap” empirical methodology that
is applied to Aboriginal policy is more appropriate to policy relating to people with
disability.
440 Profession Bruce Professor Bruce Bonyhady and Dr Di Winkler, op.cit., p.3; Appendix 1, p.9.
441 Submission by Emily Hobbs for SGS submission, p.2,
442 Anonymous Submission 343459347, answer to Question 24, accessed 9 December 2020,
https://consultation.abcb.gov.au/engagement/consult-ris-accessible-
housing/consultation/published_select_respondent

www.TheCIE.com.au
Proposal to include minimum accessibility standards for housing in the National Construction Code 273
Social-ecological approach
Post-Polio Victoria Inc (PPV)443 suggested that a socio-ecological framework would
provide a more balanced perspective on the needs of polio survivors, people living with
other disabilities, their families, social networks, and health practitioners.
According to PPV, people who actually have a disability are not the only people who are
‘living with disability’: their families, carers, and social networks; their healthcare
practitioners; legislators, politicians and bureaucrats; and Australian society all join them
in that space.
The social-ecological approach ‘accounts for the impact of an individual’s social and
environmental context on their health outcomes’. For instance, inability to access their
‘friends’ homes’ can impact on ‘their commitment to continue to build a life full of
meaning’ and, due to their friends’ potential lack of understanding of their physical
limitations, to diminished social relationships, or inclusion.
443 Barbary Clarke, op.cit., p.6-7.

www.TheCIE.com.au
274 Proposal to include minimum accessibility standards for housing in the National Construction Code
B Approach to estimating the safety impacts
People at risk of falls due to inaccessible housing
There is no comprehensive source of data on the extent to which accessibility needs are
being met in existing dwellings. The SDAC does not explicitly ask respondents with
mobility limitation whether their current residence meets their accessibility needs.
Nevertheless, there are some relevant indicators.
One relevant indicator on the extent to which accessibility needs are being met is the
level of assistance required moving around the residence. This question is relevant to
accessibility features within the home, but not necessarily features relating to entering
and leaving the residence (such as level access).
■ The 2018 SDAC suggests that around 78 per cent of those identifying as having
mobility limitation report having no difficulty moving around the residence
(table B.1).
– In some cases, the disability may not be severe enough to restrict movement
around the residence.
– Alternatively, this could reflect the home environment already meeting any
accessibility needs.
■ There are around 653 400 people that either require assistance moving around the
residence, or have some difficulty.
– Of these, around 163 100 live in establishments (including aged care facilities,
retirement villages or hospitals).
– The remaining 490 700 live in households.
… Of these, around 167 900 live in dwellings that have been modified because of
the resident’s condition or age. This could indicate that the dwelling is
accessible, but the disability is severe enough that they require assistance or
have difficulty anyway. Alternatively, it is possible that the modifications were
inadequate, such that the dwelling did not meet the resident’s accessibility
needs.
… The remaining 322 300 live in dwellings that have not been modified.

www.TheCIE.com.au
Proposal to include minimum accessibility standards for housing in the National Construction Code 275
B.1 Assistance required moving around residence
Assistance required Living in households Total
requiring
assistance
Share of
total
Dwelling
modified
Dwelling
not
modified
Total
'000 ‘000 ‘000 '000 '000 Per cent
Always needs help 121.6 32.8 40.1 71.3 194.2 6.5
Sometimes needs help 35.1 58.0 113.0 171.0 205.7 6.9
Does not need help, but has
difficulty
6.4 77.1 169.2 248.4 253.5 8.5
Total requiring help or has
difficulty
163.1 167.9 322.3 490.7 653.4 21.9
Does not move around
residence
9.5 0.0 7.2 4.8 15.6 0.5
Has no difficulty 11.7 309.9 1 992.3 2 301.9 2 313.9 77.6
Total 184.3 477.8 2 321.8 2 797.4 2 982.9 100.0
Source: ABS, Survey of Disabilities, Ageing and Carers, 2018, TableBuilder.
The SDAC survey suggests that for most people with mobility limitation, their residence
meets their accessibility needs (at least internally).
A Council on the Ageing (COTA) survey of people over the age of 50 provides some
support for these findings. An unpublished analysis of the survey data suggests the
following:444
■ 27.6 per cent of respondents did not think their home would meet their needs in the
future (although close to 20 per cent indicated that they did not know)
■ of the people who indicated that their home would not meet their needs, around
44 per cent indicated that poor access/accessibility was a reason why
■ this implies that only around 12 per cent of people believed their house would not
meet their future needs due to poor access/accessibility.
As these survey results are based on future expectations, rather than actual experience
they need to be treated with some caution. Many people may not be able to accurately
foresee their future accessibility needs.
■ It is assumed that the population at greater risk of falling due to housing that lacks
accessibility features are those people that:
– have mobility limitation
– live in households
– live in a dwelling that has not been modified as a result of their age or condition
– either require assistance or have trouble moving around their residence.
444 Bringolf, J. 2015, Let’s Talk About Where You Live, Incomplete draft based on COTA NSW
2014 survey data for the 50+ Report with a focus on how and where older people are living,
unpublished, p. 10.

www.TheCIE.com.au
276 Proposal to include minimum accessibility standards for housing in the National Construction Code
■ Based on these criteria, the 2018 SDAC survey suggests there were around
325 100 people445 that are at higher risk of falls due to inaccessible housing.
Impact of accessible housing on safety outcomes
Based on the results of several studies on the impact of home modifications (and other
interventions) on the number of falls in older people, in the Consultation RIS CIE
assumed that the number of falls is between 27 per cent and 46 per cent higher in housing
without accessibility features, with a central case estimate of around 37 per cent.
However, CIE also noted the following caveats.
■ The results in these studies are driven by occupational therapy interventions in general
(which includes home modifications) and not home modifications specifically.
■ Some studies find no effect. For example, Day et al (2002)446 finds that “home hazard
reduction” reduces falls in combination with exercise and vision improvement, but
does not have a significant impact in isolation.
There were also several relevant comments from submissions, including the following.
■ The submission from the Home Modification Information Clearinghouse noted that
unlike universal design features, home modifications are tailored to meet specific
needs. Therefore, the results from studies showing the benefits of home modifications
are not necessarily a good indicator of the benefits of universal design.
■ The HIA submission also questioned the assumptions in relation to safety on several
grounds.
– Excluding studies showing no impact may have introduced bias to the estimate.
– There is limited evidence to support the assumption that the incidence of falls
among those with limited mobility that are younger than 65 are the same as for the
65-74 age bracket.
– The NCC proposals do not include the installation of handrails in bathrooms (only
the reinforcement of walls).
Linking design features to falls
As noted in the HIA submission the features typically provided in home modifications do
not necessarily directly align with the features covered by the NCC proposal. The
accessible design features included in the NCC proposal could potentially reduce falls:
445 Note this differs slightly from the number reported above (322 300). This reflects the procedure
whereby TableBuilder randomly adjusts cells to minimise the risk of identifying individuals in
aggregate statistics. This means that estimates derived from TableBuilder are not always
identical.
446 Day, L. Fildes, B. Gordon, B. Fitzharris, M. Flamer, H. and Lord, S. 2002, Randomised
factorial trial of falls prevention among older people living in their own homes, BMJ, 325:128,
https://www.bmj.com/content/325/7356/128

www.TheCIE.com.au
Proposal to include minimum accessibility standards for housing in the National Construction Code 277
■ directly by reducing potential tripping hazards — the main features that would reduce
tripping hazards are:
– step-free access
– hobless shower
■ indirectly by allowing the use of aids that reduce falls — for example, allowing use of
– a wheelchair in the dwelling,
– showering aids (where the shower is too small), or
– other aids.
The AIHW reports various data on hospitalised falls (a subset of total falls). In 2016-17,
the AIHW reports that:
■ around 12 per cent of all hospitalised falls that occurred in the home, occurred in the
bathroom447
■ around 6.3 per cent of all falls were on or from stairs or steps (this is equivalent to
around 12 per cent of all falls within the home, but some falls on or from stairs or
steps may have occurred outside the home).448
This data suggests that it is unlikely that the proposed measures in the NCC proposal
would directly reduce falls by 37 per cent as assumed in the Consultation RIS.
Review of empirical evidence
According to Pynoos et. al. (2010), it is estimated that between 35 per cent and 40 per
cent of falls result from factors that are related to the environment, although the role of
the environment interacts with other factors.449 There are a range of environmental
factors that can contribute to falls in the home.
■ As discussed above, the NCC proposal would remove some environmental risks,
including:
– one or more steps to (and at) the entrance of the dwelling
– the shower hob (or the need to step into a bathtub).
■ Environmental hazards within the home can also include: rugs, worn carpets, clutter
etc. These environmental hazards could still exist within an accessible home.
In general, the evidence on the impact of environmental factors on the incidence of falls
in homes is mixed.450 As noted in the Consultation RIS, the World Health Organisation
(WHO) assessed that the strength of evidence that people with functional impairments
447 AIHW: Pointer, S. 2019, Trends in hospitalised injury due to falls in older people, 2007-08 to
2016-17, Injury research and statistics series no. 126, Cat No. INJCAT 206, Canberra: AIHW,
p. 25.
448 ibid, p. 25.
449 Pynoos, J. Steinman, B.A. and Nguyen, A.Q.D. 2010, Environmental Assessment and
Modification as Falls Prevention Strategies for Older Adults, Clinical Geriatric Medicine,
November 26(4), pp. 633-644.
450 ibid, pp. 633-644.

www.TheCIE.com.au
278 Proposal to include minimum accessibility standards for housing in the National Construction Code
have reduced fall and injury rates in homes that have been modified is moderate based
on a review of the literature.451
An older (2006) review of the evidence for the (then) Australian Government
Department of Health and Ageing by the National Ageing Research Institute concluded
that:
“There is growing evidence that home hazard assessment and modification programs may be
effective in reducing falls, particularly when undertaken by trained health professionals such as
occupational therapists, and when targeting those at increased risk of falls. These approaches
are more likely to be effective when combined with strategies to modify risky behaviours, and
maximise adherence with recommended hazard modifications. To date there is no strong
evidence that modifications to reduce environmental fall hazards within the home or public
areas in isolation are effective in reducing fall rates. [emphasis added]”452
The implication is that there is limited evidence to suggest that the universal design
features would significantly reduce falls. That said, some of the evidence reviewed relates
to the efficacy of home assessment and modification programs, rather than home
modifications per se. One of the reasons why these programs did not significantly reduce
falls is the limited uptake of the recommendations, rather than the effectiveness of the
recommended modifications per se.453
Lord et. al. (2006) reviewed two groups of studies, including the following.454
■ Six case-control studies that examined the association between environmental hazards
and falls.
– Two of these studies found differences in the prevalence of household hazards
between faller and non-faller groups.
– The remaining four studies found no differences in home hazards between faller
and non-faller groups.
■ Five prospective cohort studies, in which household hazards are assessed first and
falls are monitored subsequently over a defined period.
– Of the five studies reviewed, none found household hazards to be associated with
falls in primary analyses.
– However, secondary analyses tended to find that (perhaps counter-intuitively),
household hazards were more likely to contribute to falls in more active older
people.
451 World Health Organization 2018, WHO Housing and health guidelines, chapter seven. Emphasis
is in the WHO report (p.71).
452 Hill, K. Vrantsidis, F., Haralambous, B. Fearn, M. Smith, R. Murray, K. Sims, J. Dorevitch,
M. 2004, An analysis of research on preventing falls and falls injury in older people: Community
residential care and hospital settings, Report to the Australian Government Department of Health
and Ageing, Injury Prevention Section by the National Ageing Research Institute, National
Falls Prevention for Older People Initiative, p. 26.
453 ibid, pp. 22-26.
454 Lord, S.R. Menz, H.B. and Sherrington, C. 2006, “Home environment risk factors for falls in
older people and the efficacy of home modifications”, Age and Ageing 2006; 35-53.

www.TheCIE.com.au
Proposal to include minimum accessibility standards for housing in the National Construction Code 279
■ Five randomised control trials of the impacts of home assessment and modification
interventions. The results were also mixed.
Note that the first two groups of studies do not rely on extrapolating from the impacts of
home modifications. As such, the general concerns set out in the submission from the
Home Modifications Information Clearinghouse are less important for these studies
reviewed by Lord et al (2006).
Table B.2 summarises some key studies on the impact of home modifications (and other
interventions) on the number of falls.
B.2 Key results of randomised controlled trials that establish that home
modifications and other factors reduce falls
Study
(location)
Key result a Comment/note
Cumming et
al 1999
Falls reduce by 44 per cent. ■ Study for 65yo and above
■ Intervention that drives result: visit and follow-up by occupational
therapists, including home modifications
■ Result is for sub-group that had a fall prior to study. No
significant impact for sub-group that did not have a fall prior to
study.
■ Authors attribute reduction in falls to occupational therapy in
general (including home modifications) not to home
modifications specifically, because falls outside home also fell
Palvanen et
al 2014
Falls are estimated to reduce
by 27 per cent.
■ Study for 70yo and above, who have a high risk of falling
■ Intervention that drives result: 12 months, multifactorial falls
prevention program: strength and balance training, medical
review and referrals, medication review, proper nutrition, home
hazard assessment and modifications
Nikolaus &
Bach 2003
Falls are estimated to reduce
by 37 per cent.
■ Study of subjects admitted from home to geriatric hospital
showing functional decline, especially in mobility
■ Intervention that drives result: diagnostic home visit and home
intervention (diagnostic home visit, assessing home for
environmental hazards, advice about possible changes, offer of
facilities for any necessary home modifications, training on the
use of technical and mobility aids); an additional home visit after
3 months to reinforce the recommendations
Pighils et al
2011
Falls are estimated to reduce
by 46 per cent.
■ Study of subject 70yo and above, with a history of falls in the
previous year.
■ Intervention: environmental falls prevention intervention from
occupational therapist
Lord et. al.
(2006)
Studies find no association or
no consistent association
between trip hazards and falls
■ Other factors may be significant, for example, removal of
environmental hazards such as hallway rugs may reduce falls in
older people
■ Notes 3 further studies that do not find a significant reduction in
falls resulting from interventions including home modifications
a The key result taken from each study is the rate of falls in in an environment with home modifications and other factors, relative to
not being such an environment. All noted results are statistically significant. Note: In each RCT, the control group generally receives
‘normal’ treatment, which does not involve occupational therapy and home modifications. The specific interventions that drive the
results are noted.

www.TheCIE.com.au
280 Proposal to include minimum accessibility standards for housing in the National Construction Code
Source: Cumming et al 1999, Home visits by an Occupational Therapist for Assessment and modification of Environmental Hazards: A
Randomised Trial of Falls Prevention; JAGS 47:1397-1402; Palvanen et al 2014, Effectiveness of the Chaos Falls Clinic in preventing
falls and injuries of home-dwelling older adults: a randomised controlled trial, Injury. 2014 Jan;45(1):265-71. doi:
10.1016/j.injury.2013.03.010; Nikolaus T and Bach M 2003, Preventing falls in community-dwelling frail older people using a home
intervention team (HIT): results from the randomised Falls-HIT trial, J Am Geriatr Soc. 2003 Mar;51(3):300-5; Pighills et al 2011,
Envrionmental Assessment and modification to prevent falls in older people, J Am Geriatr Soc. 2011 Jan;59(1):26-33. doi:
10.1111/j.1532-5415.2010.03221; Lord et al 2006, Home environment risk factors for falls in older people and the efficacy of
home modifications, Age and Ageing 35-S2, ii55-ii59, doi: 10.1093/ageing/afl088.
■ In summary, there is limited direct evidence on the extent to which universal
design features would decrease falls in the home for older people and people with
disability.
■ Other related evidence is mixed.
■ For the purposes of the CBA, the following assumptions are made.
– As a significant number of studies suggest that environmental factors have a
minimal impact on falls, a reasonable lower bound would be to assume that the
universal design features on their own could have minimal impact on falls.
– As an upper bound estimate, we use the same impact estimated for the
Consultation RIS (i.e. lack of universal design features increases falls by around
37 per cent).
– For the central case, we assume that the lack of universal design features
increase falls by around 10 per cent. We consider that the impact of the NCC is
more likely to be towards the lower end of the range for the following reasons.
… Most (but not all) studies that look at the number of hazards in the home
(without other interventions) tend to find that the number of environmental
hazards has little to no impact on the number of falls.
… Most studies at the upper end of the range tend to include either home
assessments (which could assist in removing environmental hazards
unrelated to the dwelling design such as rugs, worn carpets, inappropriate
furniture placement etc.); or other types of interventions (such as exercises
and physio treatment). As such, these studies are likely to overstate the
impact of universal design features.
Estimating the health-related cost of falls
Various studies report the prevalence of falls among older people (typically over the age
of 65). At the national level, the AIHW reports the number of hospitalised falls only.
There are also several state-based studies that include all falls (including data from NSW,
Victoria and Queensland).
Although the way the data is reported across the various reports is not always directly
comparable (i.e. based on different time periods, different age brackets etc.), the
hospitalisation rates across age groups appear broadly comparable across states (table
B.3). This suggests that using data from any of these studies should be broadly
representative of national outcomes.

www.TheCIE.com.au
Proposal to include minimum accessibility standards for housing in the National Construction Code 281
B.3 Hospitalisation rates from falls for older Australians
Age group NSW Queensland Victoria
Rate per 100 000 Rate per 100 000 Rate per 100 000
65 to 69 841.7 883.0 984.2 b
70 to 74 1 222.4 1 227.8
75 to 79 2 293.6 2 164.6 2 917.0 c
80 to 84 4 281.4 4 150.1
85 to 89 7 390.1 8 209.0 a 7 951.9 d
90 to 94 11 373.3
95+ 13 582.6 13 279.3
Total 2 744.6 2 548.6 2 597.2
a Relates to 85+ age group. b Relates to 65-74 age group. c Relates to 75-84 age group. d Relates to 85-94 age group.
Source: Stathakis, V. Gray, S. and Berecki-Gisolf, J. 2015, “Fall-related injury profile for Victorians aged 65 years and older”, Hazard,
Edition No. 80, Summer 2015, Victorian Injury Surveillance Unit, Monash University Accident Research Centre; University of NSW, The
Incidence and Cost of Falls Injury Among Older People in New South Wales 2006/07, A Report to NSW Health, September 2010,
Deaths
The approach to estimating the cost to the community of additional deaths from falls due
to people with accessibility needs living in inaccessible housing is set out below.
Additional fall related deaths due to inaccessible housing
It is estimated that there could be between around 15 and 27 additional deaths from falls
per year as a result of people with accessibility needs living in inaccessible housing, with
a central case estimate of around 21 additional deaths per year (table B.4).
These estimates are based on the following.
■ The population at risk of falls due to inaccessible housing is as defined above.
■ The incidence of falls causing death is based on Victorian data from the 2010-12
period reported by the Victorian Injury Surveillance Unit (VISU) within the Monash
University Accident Research Centre (MUARC).455
– Actual data, as reported by VISU, is used for age groups over 65.
– The incidence of falls causing death among people under the age of 65 with
mobility limitations is not reported. It is assumed that the incidence of falls was
around the same as for the broader population in the 65-74 year age bracket, as
reported by VISU. Adults with disabilities reportedly have the same risk of falling
as people in the general population over the age of 65.456
455 Stathakis, V. Gray, S. and Berecki-Gisolf, J. 2015, “Fall-related injury profile for Victorians
aged 65 years and older”, Hazard, Edition No. 80, Summer 2015, Victorian Injury Surveillance
Unit, Monash University Accident Research Centre, p. 6.
456 University of Massachusetts Medical School, Eunice Kennedy Shriver Center,
https://shriver.umassmed.edu/news/2015-07-08-130000/shriver-center-studying-falls-prevention-people-
intellectual-and-developmental-disabilities, accessed 12 February 2020.

www.TheCIE.com.au
282 Proposal to include minimum accessibility standards for housing in the National Construction Code
– As not all falls occur at home, this was adjusted to take into account the fact that
32.8 per cent of falls resulting in death occur in the home.457
B.4 Additional deaths from falls due to inaccessible housing
Age group Population
affecteda
Death rate
from fallsb
Death rate
from falls at
homec
Implied
number of
falls -
baseline
Additional deaths due to inaccessible
housing
Low
estimated
Central casee High
estimatef
'000 Rate per
100,000
Rate per
100,000
No. No. No. No.
0 to 14 19.9 10.6 3.5 0.7 0.0 0.1 0.3
15 to 24 14.2 10.6 3.5 0.5 0.0 0.0 0.2
25 to 34 20.3 10.6 3.5 0.7 0.0 0.1 0.3
35 to 44 28.2 10.6 3.5 1.0 0.0 0.1 0.4
45 to 54 48.4 10.6 3.5 1.7 0.0 0.2 0.6
55 to 64 66.6 10.6 3.5 2.3 0.0 0.2 0.9
65 to 74 58.7 10.6 3.5 2.0 0.0 0.2 0.8
75 to 84 44.1 69.6 22.8 10.1 0.0 1.0 3.7
85 to 94 20.7 345.8 113.4 23.5 0.0 2.3 8.7
95+ 4.0 1 139.2 373.7 14.9 0.0 1.5 5.5
Total 325.1 57.4 0.0 5.7 21.2
a Based on 2018 SDAC data. Population at risk of falls due to inaccessible housing defined as people that: have a mobility limitation;
either require assistance or have trouble moving around their place of residence; live in a household; and live in a dwelling that has
not been modified to meet their needs. b Based on data from Victoria from 2010-12 reported in Stathakis, V. Gray, S. and
Berecki-Gisolf, J. 2015, p. 6. c Adjusted based on 32.8 per cent of falls causing death occurring at home as reported in Stathakis, V.
Gray, S. and Berecki-Gisolf, J. 2015, p. 2. d Assumes falls are not higher in inaccessible housing. e Assumes falls are 10 per cent
higher in inaccessible housing. f Assumes falls are 27 per cent higher in inaccessible housing.
Source: ABS Survey of Disability, Ageing and Carers 2018, TableBuilder; Stathakis, V. Gray, S. and Berecki-Gisolf, J. 2015, “Fall-related
injury profile for Victorians aged 65 years and older”, Hazard, Edition No. 80, Summer 2015, Victorian Injury Surveillance Unit, Monash
University Accident Research Centre, p. 6, CIE.
Valuing deaths and other health-related outcomes
The costs associated with poor health-related outcomes (such as injuries from slips, trips
and falls and depression associated with social isolation), include:
■ the cost of treatment
■ morbidity (and in some cases mortality) costs.
Morbidity costs associated with various health outcomes are typically using the concept
of years lost to disability (YLD). This is a measure of the ‘healthy’ years lost to disability.
This is usually measured by applying a disability weight (a measure of the extent to
which a medical condition affects a person’s quality of life) to the value of a life year
(OBPR recommend using a value of around $213 000 in 2019 dollars — see box B.5)
over the duration of the injury/disability.
457 Stathakis, V. Gray, S. and Berecki-Gisolf, J. 2015, op.cit., p. 2.
www.TheCIE.com.au
Proposal to include minimum accessibility standards for housing in the National Construction Code 283
B.5 Valuing human health outcomes
A key concept in establishing a monetary value for lives lost is the value of a statistical
life (VSL). This is a notional value that individuals place on reducing the risk of death.
A related concept is the value of a life year (VLY), which refers to the notional value
an individual places on each additional year of life. The two concepts are related
because the VSL should reflect the discounted value of expected future life years. This
implies that the VSL will vary depending on age (and other factors), since younger
individuals would be expected to have more life years ahead of them. VSL is usually
assumed to refer to the life of a young adult with at least 40 years of life ahead of
them.
Abelson (2008) reviewed research into VSL and VLY and international guidelines for
life and health values for the Commonwealth Office of Best Practice Regulation.
Based on this review, Abelson (2008) recommended that public agencies in Australia
adopt:
■ a VSL of $3.5 million (in 2007 dollars) for avoiding an immediate death of a
healthy individual in middle age (about 50) or younger
■ a constant VLY of $151 000 (in 2007 dollars) which is independent of age
Inflating to 2019 dollars using the national Consumer Price Index (published by the
ABS) this equates to:458
■ a VSL of $4.9 million, and
■ a VLY of around $213 000.
The VSL recommended by OBPR of around $4.9 million is based on avoiding the death
of a healthy individual in middle age, with around 40 years of life ahead of them.
However, those at risk of falls are generally older and therefore would be expected to
have fewer years of life ahead of them. CIE therefore used lower VSL estimates based on
the expected future years of life for individuals in each age cohort.
The VSL estimates (table B.6) are based on the following.
■ The average life expectancy for males and females in each age bracket are reported by
the ABS.459 They are then averaged across males and females (as females are
over-represented in falls and have longer life expectancy this will slightly understate
the life expectancy and therefore the cost).
■ Each year of future life is valued at $213 000 as recommended by OBPR.
458 Australian Government Department of Prime Minister and Cabinet, Office of Best Practice
Regulation, Best Practice Regulation Guidance Note, Value of statistical life, August 2019.
459 ABS 2019, Life Tables, States, Territories and Australia 2016-2018, Cat. 3302.0.55.001,
https://www.abs.gov.au/AUSSTATS/[email protected]/Lookup/3302.0.55.001Main+Features12016-
2018?OpenDocument, accessed 15 January 2020.

www.TheCIE.com.au
284 Proposal to include minimum accessibility standards for housing in the National Construction Code
■ Future life years are discounted using a discount rate of 3 per cent, consistent with
OBPR advice.
B.6 Estimated value of a statistical life for Australians by age group
Age group Life expectancy -
Male
Life Expectancy -
Female
Average Life -
average
Age group-specific
value of a statistical
lifea
Years Years Years $’000
0 to 14 74.05 78.16 76.11 6 541.9
15 to 24 61.75 65.79 63.77 6 202.6
25 to 34 52.10 55.94 54.02 5 831.8
35 to 44 42.56 46.19 44.38 5 343.0
45 to 54 33.28 36.65 34.96 4 711.3
55 to 64 24.46 27.46 25.96 3 917.5
65 to 74 16.36 18.74 17.55 2 959.8
75 to 84 9.46 11.03 10.24 1 910.1
85 to 94 4.70 5.35 5.02 1 009.2
95+ 2.65 2.74 2.70 559.5
Source: ABS, Life Tables, States, Territories and Australia 2016-2018,
https://www.abs.gov.au/AUSSTATS/[email protected]/Lookup/3302.0.55.001Main+Features12016-2018?OpenDocument, accessed 15
January 2020, CIE.
Estimated cost of additional deaths
Bringing together the estimates on the number of additional deaths per year (by age
bracket) and the VSL estimates, suggests that the cost to the community from fall-related
deaths could range between zero and $33.8 million, with a central case estimate of
$9.1 million (table B.7).
B.7 Estimate cost to the community from additional fall-related deaths
Age group Value of statistical
life by age
Cost of additional
deaths
Cost of additional
deaths
Cost of additional
deaths
Low estimate Central case High estimate
$'000 $ million $ million $ million
0 to 14 6 541.9 0.00 0.45 1.67
15 to 24 6 202.6 0.00 0.31 1.13
25 to 34 5 831.8 0.00 0.41 1.52
35 to 44 5 343.0 0.00 0.52 1.94
45 to 54 4 711.3 0.00 0.79 2.93
55 to 64 3 917.5 0.00 0.91 3.36
65 to 74 2 959.8 0.00 0.60 2.24
75 to 84 1 910.1 0.00 1.92 7.12
85 to 94 1 009.2 0.00 2.37 8.77
95+ 559.5 0.00 0.84 3.09
Total 0.00 9.13 33.77

www.TheCIE.com.au
Proposal to include minimum accessibility standards for housing in the National Construction Code 285
Note: low, central and high estimates are based on the assumption that falls are not higher, 10 per cent higher and 37 per cent
higher, respectively, in inaccessible housing.
Source: CIE estimates.
Cost of medical treatment
Medical treatment costs include the costs associated with:
■ hospital admissions
■ emergency department attendances (that are not ultimately admitted)
■ non-hospital treatment.
Hospital admissions
It is estimated that there could be between an additional zero and 1 431 fall-related
hospital admissions per year due to people with accessibility needs living in inaccessible
housing, with a central case estimate of 387 additional hospital admissions (table B.8).
These estimates are based on the following.
■ The baseline hospital admission rate from falls is based on national-level AIHW data
from 2016-17.460
– Actual data, as reported by AIHW, is used for age groups over 65.
– The incidence of falls resulting in hospital admission among people under the age
of 65 with mobility limitations is not reported. As above, it is assumed that the
incidence of falls was around the same as for the broader population in the
65-69 year age bracket, as reported by AIHW.
– AIHW data showing that 51.2 per cent of falls resulting in hospital admission
occur in the home.461 These hospital admission rates were adjusted accordingly.
■ When people with accessibility needs live in inaccessible housing, the incidence of
falls is estimated to be:
– no higher under the low estimate scenario
– 10 per cent higher under the central estimate scenario
– 37 per cent higher under the high case scenario
460 AIHW website, https://www.aihw.gov.au/reports/injury/trends-in-hospitalised-injury-due-to-
falls/data, accessed 25 January 2021.
461 Australian Institute of Health and Welfare: Pointer, S. 2019, Trends in hospitalised injury due
to falls in older people 2007-08 to 2016-17, Injury research and statistics series no. 126, Cat.
No. INJCAT 206, Canberra: AIHW, p. 25.

www.TheCIE.com.au
286 Proposal to include minimum accessibility standards for housing in the National Construction Code
B.8 Estimated number of additional hospital admissions due to inaccessible
housing
Age
group
Population
affecteda
Hospital
admission
rate from
fallsb
Hospital
admission
rate for falls
at homec
Estimated
hospital
admissions -
baseline
Additional hospital admissions due to
inaccessible housing
Low
estimated
Central case High
estimatef
'000 Rate per 100
000
Rate per 100
000
No. No. No. No.
0 to 4 7.7 1 122.36 574.65 44 0 4 16
5 to 9 6.6 1 122.36 574.65 38 0 4 14
10 to 14 5.6 1 122.36 574.65 32 0 3 12
15 to 19 8.8 1 122.36 574.65 51 0 5 19
20 to 24 5.4 1 122.36 574.65 31 0 3 11
25 to 29 8.4 1 122.36 574.65 48 0 5 18
30 to 34 11.9 1 122.36 574.65 68 0 7 25
35 to 39 11.5 1 122.36 574.65 66 0 7 24
40 to 44 16.7 1 122.36 574.65 96 0 10 36
45 to 49 23.2 1 122.36 574.65 133 0 13 49
50 to 54 25.2 1 122.36 574.65 145 0 14 54
55 to 59 34.8 1 122.36 574.65 200 0 20 74
60 to 64 31.8 1 122.36 574.65 183 0 18 68
65 to 69 35.7 1 122.36 574.65 205 0 21 76
70 to 74 23.0 1 667.52 853.77 196 0 20 73
75 to 79 25.8 2 834.07 1 451.04 374 0 37 139
80 to 84 18.3 5 150.34 2 636.98 483 0 48 179
85 to 89 13.0 9 136.94 4 678.11 608 0 61 225
90 to 94 7.7 13 425.14 6 873.67 529 0 53 196
95+ 4.0 16 453.54 8 424.21 337 0 34 125
Total 325.1 3 868 0 387 1 431
a Based on 2018 SDAC data. Population at risk of falls due to inaccessible housing defined as people that: have a mobility limitation;
either require assistance or have trouble moving around their place of residence; live in a household; and live in a dwelling that has
not been modified to meet their needs. b Based on hospital admission rates from the community (i.e. excluding residential aged care)
in NSW in 2006-07 reported in UNSW, 2010, p. 28. c Adjusted based on 47.6 per cent of falls resulting in hospital admission
occurring at home as reported in Stathakis, V. Gray, S. and Berecki-Gisolf, J. 2015, p. 2. d Based on accessible housing reducing falls
by 0 per cent. e Based on accessible housing reducing falls by 10 per cent. f Based on accessible housing reducing falls by 37 per
cent.
Source: ABS Survey of Disability, Ageing and Carers 2018; University of NSW, The Incidence and Cost of Falls Injury Among Older
People in New South Wales 2006/07, A Report to NSW Health, September 2010; Stathakis, V. Gray, S. and Berecki-Gisolf, J. 2015,
“Fall-related injury profile for Victorians aged 65 years and older”, Hazard, Edition No. 80, Summer 2015, Victorian Injury Surveillance
Unit, Monash University Accident Research Centre; CIE.
Based on the above estimates of the number of additional hospital admissions due to
people with accessibility needs living in inaccessible housing, the estimated cost of
additional hospital admissions is between zero and $31.8 million per year, with a central
case estimate of around $8.6 million per year (table B.9).

www.TheCIE.com.au
Proposal to include minimum accessibility standards for housing in the National Construction Code 287
■ Health care costs are based on the average cost reported in UNSW (2010) inflated to
2019 dollar terms, using the national CPI.462
■ Note that these cost estimates include health care costs only; morbidity costs are not
included.
B.9 Estimated cost of additional hospital admissions due to inaccessible housing
Age group Average cost per
hospital admissiona
Cost of additional hospital admissions due to inaccessible
housing
Low estimate Central case High estimate
$ $ million $ million $ million
0 to 4 17 107 0.00 0.08 0.28
5 to 9 y 17 107 0.00 0.06 0.24
10 to 14 17 107 0.00 0.06 0.20
15 to 19 17 107 0.00 0.09 0.32
20 to 24 17 107 0.00 0.05 0.20
25 to 29 17 107 0.00 0.08 0.31
30 to 34 17 107 0.00 0.12 0.43
35 to 39 17 107 0.00 0.11 0.42
40 to 44 17 107 0.00 0.16 0.61
45 to 49 17 107 0.00 0.23 0.84
50 to 54 17 107 0.00 0.25 0.92
55 to 59 17 107 0.00 0.34 1.27
60 to 64 17 107 0.00 0.31 1.16
65 to 69 17 107 0.00 0.35 1.30
70 to 74 22 517 0.00 0.44 1.64
75 to 79 22 918 0.00 0.86 3.17
80 to 84 26 418 0.00 1.27 4.72
85 to 89 27 217 0.00 1.66 6.12
90 to 94 25 120 0.00 1.33 4.92
95+ 22 296 0.00 0.75 2.78
Total 0.00 8.60 31.84
a Based on average costs reported in UNSW (2010, p. 33) inflate to 2019 dollars using the national CPI.
Note: low, central and high estimates are based on the assumption that falls are not higher, 10 per cent higher and 37 per cent
higher, respectively, in inaccessible housing.
Source: University of NSW, The Incidence and Cost of Falls Injury Among Older People in New South Wales 2006/07, A Report to NSW
Health, September 2010; CIE.
Emergency department attendance
In some cases, people who have a fall attend an emergency department (ED) at a hospital
but are not actually admitted.
462 University of NSW 2010, The Incidence and Cost of Falls Injury Among Older People in New South
Wales 2006/07, A Report to NSW Health, September 2010, p. 33.

www.TheCIE.com.au
288 Proposal to include minimum accessibility standards for housing in the National Construction Code
Using a similar approach as above, it is estimated that there could be between zero and
an additional 821 fall-related ED attendance per year due to people with accessibility
needs living in inaccessible housing, with a central case estimate of 222 additional ED
attendance (table B.10).
These estimates are based on the following.
■ The ED attendance rate from falls is taken from NSW data for people living in the
community from 2006-07 reported in a UNSW report to NSW Health.463
– Actual data, as reported by UNSW, is used for age groups over 65.
– The incidence of falls resulting in ED attendance among people under the age of
65 with mobility limitation is not reported. As above, it is assumed that the
incidence of falls was around the same as for the broader population in the
65-69 year age bracket, as reported by UNSW.
– As not all falls occur at home, these ED attendance rates were adjusted based on
Victorian data showing that 56.3 per cent of falls resulting in ED presentations
occur in the home.464
■ As above, when people with accessibility needs live in inaccessible housing, the
incidence of falls is estimated to be:
– no change under the low estimate scenario
– 10 per cent higher under the central estimate scenario
– 37 per cent higher under the high estimate scenario (see above).
B.10 Estimated number of additional emergency department attendances due to
inaccessible housing
Age
group
Population
affecteda
ED
attendance
rate from
fallsb
ED
attendance
rate from
falls at
homec
Estimated
ED
attendances
- baseline
Additional ED attendances due to
inaccessible housing
Low
estimated
Central
case
High
estimatef
'000 Rate per 100
000
Rate per 100
000
No. No. No. No.
0 to 4 7.7 975.8 549.4 42.3 0.0 4.2 15.7
5 to 9 6.6 975.8 549.4 36.3 0.0 3.6 13.4
10 to 14 5.6 975.8 549.4 30.8 0.0 3.1 11.4
15 to 19 8.8 975.8 549.4 48.3 0.0 4.8 17.9
20 to 24 5.4 975.8 549.4 29.7 0.0 3.0 11.0
25 to 29 8.4 975.8 549.4 46.1 0.0 4.6 17.1
30 to 34 11.9 975.8 549.4 65.4 0.0 6.5 24.2
463 University of NSW 2010, The Incidence and Cost of Falls Injury Among Older People in New South
Wales 2006/07, A Report to NSW Health, September 2010, p. 28.
464 Stathakis, V. Gray, S. and Berecki-Gisolf, J. 2015, “Fall-related injury profile for Victorians
aged 65 years and older”, Hazard, Edition No. 80, Summer 2015, Victorian Injury Surveillance
Unit, Monash University Accident Research Centre, p. 2.

www.TheCIE.com.au
Proposal to include minimum accessibility standards for housing in the National Construction Code 289
Age
group
Population
affecteda
ED
attendance
rate from
fallsb
ED
attendance
rate from
falls at
homec
Estimated
ED
attendances
- baseline
Additional ED attendances due to
inaccessible housing
Low
estimated
Central
case
High
estimatef
'000 Rate per 100
000
Rate per 100
000
No. No. No. No.
35 to 39 11.5 975.8 549.4 63.2 0.0 6.3 23.4
40 to 44 16.7 975.8 549.4 91.7 0.0 9.2 33.9
45 to 49 23.2 975.8 549.4 127.4 0.0 12.7 47.2
50 to 54 25.2 975.8 549.4 138.4 0.0 13.8 51.2
55 to 59 34.8 975.8 549.4 191.2 0.0 19.1 70.7
60 to 64 31.8 975.8 549.4 174.7 0.0 17.5 64.6
65 to 69 35.7 975.8 549.4 196.1 0.0 19.6 72.6
70 to 74 23.0 968.1 545.0 125.4 0.0 12.5 46.4
75 to 79 25.8 1 314.9 740.3 191.0 0.0 19.1 70.7
80 to 84 18.3 1 591.4 896.0 164.0 0.0 16.4 60.7
85 to 89 13.0 2 166.7 1 219.9 158.6 0.0 15.9 58.7
90 to 94 7.7 3 707.6 2 087.4 160.7 0.0 16.1 59.5
95+ 4.0 6 117.0 3 443.9 137.8 0.0 13.8 51.0
Total 325.1 2 219.0 0.0 221.9 821.0
a Based on 2018 SDAC data. Population at risk of falls due to inaccessible housing defined as people that: have a mobility limitation;
either require assistance or have trouble moving around their place of residence; live in a household; and live in a dwelling that has
not been modified to meet their needs. b Based on emergency department attendance rates from the community (i.e. excluding
residential aged care) in NSW in 2006-07 reported in UNSW, 2010, p. 28. c Adjusted based on 56.3 per cent of falls resulting in
emergency department attendance occurring at home as reported in Stathakis, V. Gray, S. and Berecki-Gisolf, J. 2015, p. 2. d Based
on accessible housing reducing falls by 0 per cent. e Based on accessible housing reducing falls by 10 per cent. f Based on accessible
housing reducing falls by 37 per cent.
Source: ABS Survey of Disability, Ageing and Carers 2018; University of NSW, The Incidence and Cost of Falls Injury Among Older
People in New South Wales 2006/07, A Report to NSW Health, September 2010; Stathakis, V. Gray, S. and Berecki-Gisolf, J. 2015,
“Fall-related injury profile for Victorians aged 65 years and older”, Hazard, Edition No. 80, Summer 2015, Victorian Injury Surveillance
Unit, Monash University Accident Research Centre; CIE.
Based on the above estimates of the number of additional emergency attendances due to
people with accessibility needs living in inaccessible housing, an additional cost of
between zero million and $2.6 million per year is estimated, with a central case estimate
of around $0.7 million per year. Health care costs are based on the average cost reported
in UNSW (2010) inflated to 2019 dollar terms, using the national CPI.465
465 University of NSW 2010, The Incidence and Cost of Falls Injury Among Older People in New South
Wales 2006/07, A Report to NSW Health, September 2010, p. 33.

www.TheCIE.com.au
290 Proposal to include minimum accessibility standards for housing in the National Construction Code
B.11 Estimated cost of additional emergency department attendances due to
inaccessible housing
Age group Average cost per
ED attendancea
Cost of additional ED attendance due to inaccessible
housing
Low estimate Central case High estimate
$ $ million $ million $ million
0 to 4 2 832 0.00 0.01 0.04
5 to 9 2 832 0.00 0.01 0.04
10 to 14 2 832 0.00 0.01 0.03
15 to 19 2 832 0.00 0.01 0.05
20 to 24 2 832 0.00 0.01 0.03
25 to 29 2 832 0.00 0.01 0.05
30 to 34 2 832 0.00 0.02 0.07
35 to 39 2 832 0.00 0.02 0.07
40 to 44 2 832 0.00 0.03 0.10
45 to 49 2 832 0.00 0.04 0.13
50 to 54 2 832 0.00 0.04 0.15
55 to 59 2 832 0.00 0.05 0.20
60 to 64 2 832 0.00 0.05 0.18
65 to 69 2 832 0.00 0.06 0.21
70 to 74 4 366 0.00 0.05 0.20
75 to 79 4 237 0.00 0.08 0.30
80 to 84 3 581 0.00 0.06 0.22
85 to 89 3 343 0.00 0.05 0.20
90 to 94 3 522 0.00 0.06 0.21
95+ 3 140 0.00 0.04 0.16
Total 0.00 0.71 2.63
a Based on average costs reported in UNSW (2010, p. 33) inflate to 2019 dollars using the national CPI.
Note: low, central and high estimates are based on the assumption that falls are not higher, 10 per cent higher and 37 per cent
higher, respectively, in inaccessible housing
Source: University of NSW, The Incidence and Cost of Falls Injury Among Older People in New South Wales 2006/07, A Report to NSW
Health, September 2010; CIE.
Non-hospital treatment
There may also be medical costs where people have a fall, but do not attend a hospital.
Using a similar approach as above, it is estimated there could be between zero and an
additional 4 896 fall-related non-hospital treatments provided per year due to people with
accessibility needs living in inaccessible housing, with a central case estimate of 1 323
non-hospital treatments per year (table B.12). These estimates are based on the following.

www.TheCIE.com.au
Proposal to include minimum accessibility standards for housing in the National Construction Code 291
■ The non-hospital treatment rate from falls is taken from NSW data for people living in
the community from 2006-07 reported in a UNSW report to NSW Health.466
– Actual data, as reported by UNSW, is used for age groups over 65.
– The incidence of falls resulting in non-hospital treatment among people under the
age of 65 with mobility limitation is not reported. As above, it is assumed that the
incidence of falls was around the same as for the broader population in the
65-69 year age bracket, as reported by UNSW.
– The proportion of falls in the home resulting in non-hospital medical treatment
was not reported. However, the total non-hospital treatment rate was adjusted
based on the Victorian data showing that 56.3 per cent of falls resulting in ED
presentations occur in the home.467
■ As above, when people with accessibility needs live in inaccessible housing, the
incidence of falls is estimated to be:
– not higher under the low estimate scenario
– 10 per cent higher under the central estimate scenario
– 37 per cent higher under the high estimate scenario (see above).
B.12 Estimated number of additional non-hospital treatments due to inaccessible
housing
Age
group
Population
affecteda
Non-hospital
treatment
rate from
fallsb
Non-hospital
treatment
rate from
falls at
homec
Estimated
non-hospital
treatment -
baseline
Additional non-hospital treatments due to
inaccessible housing
Low
estimated
Central case High
estimatef
'000 Rate per 100
000
Rate per 100
000
No. No. No. No.
0 to 4 7.70 5 480.35 3 085.43 238 0 24 88
5 to 9 6.60 5 480.35 3 085.43 204 0 20 75
10 to 14 5.60 5 480.35 3 085.43 173 0 17 64
15 to 19 8.80 5 480.35 3 085.43 272 0 27 100
20 to 24 5.40 5 480.35 3 085.43 167 0 17 62
25 to 29 8.40 5 480.35 3 085.43 259 0 26 96
30 to 34 11.90 5 480.35 3 085.43 367 0 37 136
35 to 39 11.50 5 480.35 3 085.43 355 0 35 131
40 to 44 16.70 5 480.35 3 085.43 515 0 52 191
45 to 49 23.20 5 480.35 3 085.43 716 0 72 265
50 to 54 25.20 5 480.35 3 085.43 778 0 78 288
466 University of NSW 2010, The Incidence and Cost of Falls Injury Among Older People in New South
Wales 2006/07, A Report to NSW Health, September 2010, p. 28.
467 Stathakis, V. Gray, S. and Berecki-Gisolf, J. 2015, “Fall-related injury profile for Victorians
aged 65 years and older”, Hazard, Edition No. 80, Summer 2015, Victorian Injury Surveillance
Unit, Monash University Accident Research Centre, p. 2.

www.TheCIE.com.au
292 Proposal to include minimum accessibility standards for housing in the National Construction Code
Age
group
Population
affecteda
Non-hospital
treatment
rate from
fallsb
Non-hospital
treatment
rate from
falls at
homec
Estimated
non-hospital
treatment -
baseline
Additional non-hospital treatments due to
inaccessible housing
Low
estimated
Central case High
estimatef
'000 Rate per 100
000
Rate per 100
000
No. No. No. No.
55 to 59 34.80 5 480.35 3 085.43 1 074 0 107 397
60 to 64 31.80 5 480.35 3 085.43 981 0 98 363
65 to 69 35.70 5 480.35 3 085.43 1 102 0 110 408
70 to 74 23.00 5 990.53 3 372.67 776 0 78 287
75 to 79 25.80 7 808.49 4 396.18 1 134 0 113 420
80 to 84 18.30 8 014.45 4 512.14 826 0 83 306
85 to 89 13.00 18 702.50 10 529.51 1 369 0 137 506
90 to 94 7.70 16 130.17 9 081.29 699 0 70 259
95+ 4.00 54 601.06 30 740.40 1 230 0 123 455
Total 325.10 13 232 0 1 323 4 896
a Based on 2018 SDAC data. Population at risk of falls due to inaccessible housing defined as people that: have a mobility limitation;
either require assistance or have trouble moving around their place of residence; live in a household; and live in a dwelling that has
not been modified to meet their needs. b Based on non-hospital treatment rates from the community (i.e. excluding residential aged
care) in NSW in 2006-07 reported in UNSW, 2010, p. 28. c Adjusted based on 56.3 per cent of falls resulting in emergency
department attendance occurring at home as reported in Stathakis, V. Gray, S. and Berecki-Gisolf, J. 2015, p. 2. d Based on
accessible housing reducing falls by 27 per cent. e Based on accessible housing reducing falls by 37 per cent. f Based on accessible
housing reducing falls by 46 per cent.
Source: ABS Survey of Disability, Ageing and Carers 2018; University of NSW, The Incidence and Cost of Falls Injury Among Older
People in New South Wales 2006/07, A Report to NSW Health, September 2010; Stathakis, V. Gray, S. and Berecki-Gisolf, J. 2015,
“Fall-related injury profile for Victorians aged 65 years and older”, Hazard, Edition No. 80, Summer 2015, Victorian Injury Surveillance
Unit, Monash University Accident Research Centre; CIE.
Based on the above estimates of the number of additional non-hospital treatments
avoided due to people with accessibility needs living in inaccessible housing, it is
estimated an additional cost of between zero and $2.2 million per year, with a central
case estimate of around $0.6 million per year (table B.13). Health care costs are based on
the average cost reported in UNSW (2010) inflated to 2019 dollar terms, using the
national CPI.468
468 University of NSW 2010, The Incidence and Cost of Falls Injury Among Older People in New South
Wales 2006/07, A Report to NSW Health, September 2010, p. 33.

www.TheCIE.com.au
Proposal to include minimum accessibility standards for housing in the National Construction Code 293
B.13 Estimated cost of additional non-hospital treatments due to inaccessible
housing
Age group Average cost per
non-hospital
treatmenta
Cost of additional non-hospital treatments due to
inaccessible housing
Low estimate Central case High estimate
$ $ million $ million $ million
0 to 4 years 399 0.00 0.01 0.04
5 to 9 399 0.00 0.01 0.03
10 to 14 399 0.00 0.01 0.03
15 to 19 399 0.00 0.01 0.04
20 to 24 399 0.00 0.01 0.02
25 to 29 399 0.00 0.01 0.04
30 to 34 399 0.00 0.01 0.05
35 to 39 399 0.00 0.01 0.05
40 to 44 399 0.00 0.02 0.08
45 to 49 399 0.00 0.03 0.11
50 to 54 399 0.00 0.03 0.11
55 to 59 399 0.00 0.04 0.16
60 to 64 399 0.00 0.04 0.14
65 to 69 399 0.00 0.04 0.16
70 to 74 469 0.00 0.04 0.13
75 to 79 524 0.00 0.06 0.22
80 to 84 499 0.00 0.04 0.15
85 to 89 576 0.00 0.08 0.29
90 to 94 450 0.00 0.03 0.12
95+ 377 0.00 0.05 0.17
Total 0.00 0.58 2.15
a Based on average costs reported in UNSW (2010, p. 33) inflate to 2019 dollars using the national CPI.
Note: low, central and high estimates are based on the assumption that falls are not higher, 10 per cent higher and 37 per cent
higher, respectively, in inaccessible housing
Source: University of NSW, The Incidence and Cost of Falls Injury Among Older People in New South Wales 2006/07, A Report to NSW
Health, September 2010; CIE.
Morbidity costs
The Consultation RIS did not estimate the morbidity costs associated with falls.
However, some submissions noted that the morbidity costs associated with falls can be
significant. For example, the submission from Occupational Therapy Australia noted
that a fall can impair an older person’s long-term mobility and independence, often
irreversibly and is detrimental to the individual’s quality of life.469
Morbidity costs depend on multiple factors, such as the type of injury and the duration of
disability. An AIHW and Flinders University study on hospitalised injury due to falls in
469 Submission by Madison Silver for Occupational Therapy Australia, p. 6.

www.TheCIE.com.au
294 Proposal to include minimum accessibility standards for housing in the National Construction Code
older people provides information on the types of injuries for hospitalised fall-related
injury cases. Around 52 per cent of hospitalised injuries are fractures and the report also
provides detail on the location of the fracture.470 Putting this information together gives
the share of injuries shown in table B.14. The table includes more than 85 per cent of all
hospitalised injuries (the remaining injuries were not specified).
CIE applies disability weights from a study based on patient-reported data from a
multinational dataset covering injuries from various causes (not just falls).471 Disability
weights were calculated at intervals of 3 months, 6 months and 12 months post injury.
■ An annualised disability weight was based on a weighted-average of the disability
weights at each time period.
■ The study assumed that weights calculated 12 months post injury represented both:
– the degree of residential disability at 12 months; and
– the expected lifelong disability.
Putting this information together and applying OBPR’s preferred VLY estimate of
$213 000 per year472 implies that the weighted average morbidity cost of each
hospitalised fall is around
■ $30 289 in the first year post injury
■ $27 794 per year in subsequent years (table B.14).
Note that extrapolating the composition of injuries from falls around the house from over
65s to younger cohorts could significantly overstate the morbidity of younger cohorts. In
general, it would be reasonable to expect that younger people (either with or without
mobility issues or both compared to older cohorts with similar conditions) could suffer
less severe injuries from falls around the house than older cohorts. However, CIE did not
identify any comparable data for the younger age groups.
B.14 Morbidity costs for fall-related injuries
Injury Share of
injuries
from falls
(%)
Annualised
disability
weight
Long-
term
disability
weight
Annualise
d cost ($
per year)a
Long-term
annual cost
($ per year) a
Head fracture 3.6 0.158 0.143 33 654 30 459
Neck fracture 1.0 0.187 0.170 39 831 36 210
Thorax fracture 5.4 0.185 0.179 39 405 38 127
470 AIHW: Pointer, S. 2019, Trends in hospitalised injury due to falls in older people, 2007-08 to
2016-17, Injury research and statistics series no. 126, Cat. No. INJCAT 206, Canberra: AIHW,
pp. 14-15
471 Gabbe, B.J. Lyons, R.A. Simpson, P.M. Rivara, F.P. Ameratunga, S. Polinder, S., Derrett, S.
and Harrison, J.E. 2016, Disability weights based on patient-reported data from a
multinational injury cohort, World Health Organisation Bulletin, November 2016 94(11):
806-816C.
472 Australian Government Department of Prime Minister and Cabinet, Office of Best Practice
Regulation, Best Practice Regulation Guidance Note, Value of statistical life, August 2019.

www.TheCIE.com.au
Proposal to include minimum accessibility standards for housing in the National Construction Code 295
Injury Share of
injuries
from falls
(%)
Annualised
disability
weight
Long-
term
disability
weight
Annualise
d cost ($
per year)a
Long-term
annual cost
($ per year) a
Abdomen, lower back, lumbar spine and pelvis
fracture
6.5 0.205 0.194 43 665 41 322
Shoulder and upper arm fracture 5.9 0.153 0.142 32 589 30 246
Elbow and forearm fracture 6.3 0.081 0.070 17 253 14 910
Wrist and hand fracture 0.9 0.085 0.070 18 105 14 910
Hip and thigh fracture 16.9 0.281 0.273 59 853 58 149
Knee and lower leg fracture 4.7 0.188 0.172 40 044 36 636
Ankle and foot fracture 0.7 0.163 0.142 34 719 30 246
Dislocation 1.5 0.189 0.170 40 257 36 210
Soft-tissue injury 3.2 0.090 0.058 19 170 12 354
Open wound 12.9 0.091 0.076 19 383 16 188
Intracranial injury 5.9 0.197 0.186 41 961 39 618
Superficial injury 9.7 0.100 0.076 21 300 16 188
Total/weighted average 85.2 30 289 27 794
a Applies a VLY of $213 000 per year based on OBPR guidelines.
Source: AIHW: Pointer, S. 2019, Trends in hospitalised injury due to falls in older people, 2007-08 to 2016-17, Injury research and
statistics series no. 126, Cat. No. INJCAT 206, Canberra: AIHW, pp. 14-15; Gabbe, B.J. Lyons, R.A. Simpson, P.M. Rivara, F.P.
Ameratunga, S. Polinder, S., Derrett, S. and Harrison, J.E. 2016, Disability weights based on patient-reported data from a multinational
injury cohort, World Health Organisation Bulletin, November 2016 94(11): 806-816C; Australian Government Department of Prime
Minister and Cabinet, Office of Best Practice Regulation, Best Practice Regulation Guidance Note, Value of statistical life, August
2019, CIE.
Based on the above disability weights and the average life expectancy for each age
cohort, the lifetime morbidity cost of injuries is shown in table B.15. In general, these
morbidity costs are relatively high, particularly for younger age cohorts. To a large
extent, this reflects:
■ the assumption that the level of residual disability at 12 months post-injury reflects the
expected lifelong disability
■ that the level of permanent disability is estimated to be only slightly lower than the
level of disability in the first-year post-injury.
While these may be reasonable estimates for older age groups, it is less clear that injuries
from falls around the house would cause the same level of permanent disability for
younger age groups.
B.15 Estimated lifetime morbidity cost by age cohort
Age group Life expectancy (years) Lifetime morbidity cost ($)
0 to 4 81.04 872 309
5 to 9 76.13 859 130
10 to 14 71.16 843 670
15 to 19 66.21 825 876
20 to 24 61.33 805 530
25 to 29 56.45 782 095
30 to 34 51.59 755 111

www.TheCIE.com.au
296 Proposal to include minimum accessibility standards for housing in the National Construction Code
Age group Life expectancy (years) Lifetime morbidity cost ($)
35 to 39 46.77 724 199
40 to 44 41.99 688 932
45 to 49 37.28 648 902
50 to 54 32.65 603 805
55 to 59 28.14 553 488
60 to 64 23.77 497 852
65 to 69 19.55 436 909
70 to 74 15.55 371 689
75 to 79 11.87 304 396
80 to 84 8.62 238 572
85 to 89 5.97 180 218
90 to 94 4.08 135 431
95+ 2.70 101 168
Source: ABS, Life Tables, States, Territories and Australia 2016-2018,
https://www.abs.gov.au/AUSSTATS/[email protected]/Lookup/3302.0.55.001Main+Features12016-2018?OpenDocument, accessed 15
January 2020, CIE estimates.
Given the relatively high morbidity costs implied by these estimates, it is assumed that
these are incurred for hospitalised injuries only. Applying these estimates to the estimated
number of additional hospitalisations (see table B.8 above) suggests the morbidity cost
from falls could be in a range between zero and $500 million, with a central case estimate
of around $135.1 million (table B.16).
B.16 Estimated lifetime morbidity cost from falls
Age group Average lifetime
morbidity cost ($)
Lifetime morbidity
cost from
hospitalised falls -
low estimate ($
million)
Lifetime morbidity
cost from
hospitalised falls -
medium estimate
($ million)
Lifetime morbidity
cost from
hospitalised falls -
high estimate ($
million)
0 to 4 872 309 0.00 3.86 14.28
5 to 9 859 130 0.00 3.26 12.06
10 to 14 843 670 0.00 2.71 10.05
15 to 19 825 876 0.00 4.18 15.45
20 to 24 805 530 0.00 2.50 9.25
25 to 29 782 095 0.00 3.78 13.97
30 to 34 755 111 0.00 5.16 19.11
35 to 39 724 199 0.00 4.79 17.71
40 to 44 688 932 0.00 6.61 24.46
45 to 49 648 902 0.00 8.65 32.01
50 to 54 603 805 0.00 8.74 32.35
55 to 59 553 488 0.00 11.07 40.95
60 to 64 497 852 0.00 9.10 33.66
65 to 69 436 909 0.00 8.96 33.16
70 to 74 371 689 0.00 7.30 27.01

www.TheCIE.com.au
Proposal to include minimum accessibility standards for housing in the National Construction Code 297
Age group Average lifetime
morbidity cost ($)
Lifetime morbidity
cost from
hospitalised falls -
low estimate ($
million)
Lifetime morbidity
cost from
hospitalised falls -
medium estimate
($ million)
Lifetime morbidity
cost from
hospitalised falls -
high estimate ($
million)
75 to 79 304 396 0.00 11.40 42.16
80 to 84 238 572 0.00 11.51 42.60
85 to 89 180 218 0.00 10.96 40.55
90 to 94 135 431 0.00 7.17 26.52
95+ 101 168 0.00 3.41 12.61
Total 0.00 135.11 499.92
Note: low, central and high estimates are based on the assumption that falls are not higher, 10 per cent higher and 37 per cent
higher, respectively, in inaccessible housing
Source: CIE estimates.

www.TheCIE.com.au
298 Proposal to include minimum accessibility standards for housing in the National Construction Code
C Approach to estimating the costs of additional care
The impact of accessible housing on care received
Although there is some qualitative evidence of inaccessible housing features increasing
both formal and informal care needs, there is limited quantitative evidence. The main
quantitative evidence on the impact of an accessible home environment is an Australian
study comparing the self-reported amount of formal and informal care received by 157
older people and people with disability (average age of 72) living in the community
before and after home modifications funded through Home and Community Care
(HACC) Program (Carnemolla and Bridge 2019).473
A key issue is whether it is appropriate to extrapolate these findings based on the impacts
of home modifications to the features included in the NCC proposal.
■ Home modifications may not fully meet some accessibility needs,474 as some features
can be difficult (or prohibitively expensive) to retrofit. This implies that estimates
based on home modifications may under-estimate the benefits of universal design.
■ On the other hand, a submission from the Home Modification Information
Clearinghouse (prepared by Professor Catherine Bridge, a leading expert on
accessibility and a co-author of the relevant paper) argued that universal housing
design is not a direct substitute for home modifications because home modifications
are tailored to the specific needs of the individual. It is possible that the benefits of
home modifications that are tailored to the specific needs of the individual may be
more effective than the proposed NCC changes for some people.
The features of modifications HACC participants received in the sample that do not
closely align with the features provided under the NCC proposal are presented in table
C.1. Those modifications that may be a close substitute for the features to be provided
under the NCC proposal are highlighted in blue. Of particular concern, a significant
share of the modifications are grab rails and hand rails, which are not provided under the
NCC proposal.
473 Carnemolla, P. and Bridge, C. 2019, Housing Design and Community Care: How Home
Modifications Reduce Care Needs of Older People and People with Disability, International
Journal of Environmental Research and Public Health.
474 See for example, submission from the Australian Network for Universal Housing Design, p.
36.

www.TheCIE.com.au
Proposal to include minimum accessibility standards for housing in the National Construction Code 299
C.1 Type of modifications
Type of modifications Number of modifications Share of sample receiving
modification
No. Per cent
Bathroom modifications
Major bathroom modification 55 35.0
Grab rail in shower 36 22.9
Grab rail in bath 7 4.5
Hand held shower 16 10.2
Shower screen removed 3 1.9
Grab rail in toilet 17 10.8
Access modifications
Ramp 27 17.2
Step modification 7 4.5
Lift 5 3.2
Widen doorway/remove wall 15 9.6
Front/rear handrail entrance 54 34.4
Kitchen/laundry
Kitchen/laundry modification 7 4.5
Note: Where participants received major bathroom modifications, they were not included in the count for other, itemised bathroom
modifications. Kitchen and laundry modifications refer to cabinet height/design changes, widening of work areas or mounting of
appliances for easier access.
Source: Carnemolla, P. and Bridge, C. 2019, Housing Design and Community Care: How Home Modifications Reduce Care Needs of
Older People and People with Disability, International Journal of Environmental Research and Public Health, p. 7.
Although the relevance of the findings in Carnemolla and Bridge (2019) to the NCC
proposal is questionable, CIE did not identify any other studies that quantify the impact
of accessible housing on the amount of care received.
Formal care
Carnemolla and Bridge (2019) found that there was a statistically significant reduction in
both the amount of formal care and informal care received following home
modifications. The amount of formal care received decreased by around 0.3 hours per
week on average or around 15.6 hours per year (table C.2). Carnemolla (2015) provides a
further disaggregation between time spent assisting with mobility around the house,
showering and bathing, and toileting.
C.2 Additional formal care needs due to inaccessible housing
Before
modification
(Hours per
week)
After
modification
(Hours per
week)
Change (Hours
per week)
Additional care
per year (Hours
per year)
Cost of
additional care
($ per year)a
Moving about the house 1.1 0.9 - 0.2 10.4 676
Bathing and showering 0.9 0.8 - 0.1 5.2 338

www.TheCIE.com.au
300 Proposal to include minimum accessibility standards for housing in the National Construction Code
Before
modification
(Hours per
week)
After
modification
(Hours per
week)
Change (Hours
per week)
Additional care
per year (Hours
per year)
Cost of
additional care
($ per year)a
Toileting 0.1 0.1 0.0 0.0 0
Total 2.1 1.8 - 0.3 15.6 1 014
a Formal care is valued at $65 per hour, based on NDIS rates.
Source: CIE estimates based on: Carnemolla and Bridge (2019) and Carnemolla (2015); NDIS website,
https://www.ndis.gov.au/providers/price-guides-and-pricing, accessed 24 May 2020.
A submission argued that these estimates are based on older Australians with a gradually
deteriorating condition and may significantly under-estimate the benefits of universal
design for people with significant mobility issues.475
■ The submission argued that showering and dressing an individual once per day can
take 2-3 hours and some NDIS packages provide 24 hour per day care.
■ A case study provided in the MDI and Summer Foundation submission also showed
that care costs of around $25 000 per year (funded through the NDIS) could be
avoided through an accessible bathroom rather than a shower over a bathtub (see
summary provided in the main body of the report – box 3.25 on page 86).
CIE broadly shares this concern that Carnemolla and Bridge’s sample may not be
representative of the impacts of a broader cohort. However, the impact of accessible
housing on care needs is an under-researched topic. CIE has not been able to identify any
other studies that quantify these impacts and no stakeholders have provided any
supporting quantitative evidence.
It seems likely that the average estimates from Carnemolla and Bridge (2019) would
under estimate the impact of inaccessible housing on formal care needs in cases such as
those outlined above. On the other hand, it is not clear that specific examples provided in
submissions are any more representative of the average savings that would be achieved
through accessible housing. For example, CIE applies the estimated reduction in formal
care needs to all people that receive assistance with showering/bathing from a formal
care provider once per week or more (excluding those living in modified dwellings) — a
cohort of around 36 700 people (see below). People in wheelchairs (where care needs and
costs may be greater) make up around 19 per cent of this cohort.
Notwithstanding concerns over the representativeness of Carnemolla and Bridge’s
sample, in CIE’s view applying an estimate from a quantitative study based on a sample
of 157 people is a more robust approach than applying the estimated savings from a
single case study.
Under the NDIS Price Catalogue, the hourly rate for assistance with daily life varies
depending on the type of assistance provided, location (non-remote, remote, very remote)
and when the service is provided (time of day, weekend/weekday/ public holiday). At
$65 per hour (broadly representative of the factors of the various NDIS rates476) the
475 Anonymous submission 284174932 https://consultation.abcb.gov.au/engagement/consult-ris-
accessible-housing/consultation/view_respondent?_b_index=60&uuId=284174932
476 NDIS website, https://www.ndis.gov.au/providers/price-guides-and-pricing, accessed 24 May 2020.

www.TheCIE.com.au
Proposal to include minimum accessibility standards for housing in the National Construction Code 301
additional cost of formal care for those undertaking daily care activities, would be around
$1 014 per year for each person (based on accessible housing reducing formal care needs
by 0.3 hours per week or 15.6 hours per year — see above).
Informal care
Carnemolla and Bridge (2019) found that the amount of informal care received decreased
by around six hours per week on average or around 312 hours per year (table C.3). The
largest reduction related to assistance moving around the dwelling. Note that relatively
few of the ‘access features’ aligned with the features that would be provided at
certification under the NCC proposal (see table 4.1 in chapter four for details).
Valuing voluntary labour is inherently subjective as there is no observable market wage
rate. Nevertheless, from a CBA perspective it is important to recognise that voluntary
labour has a value, even though friends and relatives are willing to provide care for no
payment.
In the Consultation RIS, CIE valued informal care at the minimum wage. However,
several stakeholders argued that a higher value should be placed on unpaid labour.477
Conceptually, the task is to measure the ‘opportunity cost’ of the additional time spent
caring for a friend or relative with disability as a result of inaccessible housing. The
‘opportunity cost’ of labour reflects the value of the alternative use of the carer’s time.
Alternative uses of a carer’s time could include: paid employment, other domestic tasks
or leisure activities.
Some submissions argued that care responsibilities prevent some carers from
participating in the labour market.
■ Building Designers Association of Australia argued that the impacts on informal
carers resulting from their reduced opportunity to engage in paid work should be
included in the analysis.
■ Carers WA argued that informal carers may wish to participate in the workforce but
are limited by the care they need to provide to a family member who does not have
access to suitable housing. The Carers WA submission also referred to a recent report
by Carers Australia and Deloitte Access Economics on the value of informal care.
This report notes that there are substantial differences in the employment outcomes
for carers relative to non-caregiving Australians.
Where the alternative use of a carer’s time is paid employment, the opportunity cost of
their time is the wages foregone. As argued in one submission, an average wage rate
would be an appropriate indicator of the opportunity cost of labour in these
circumstances. However, it is not clear that paid employment is the most likely
alternative use of time for a significant proportion of carers. Research found that taking
into account the individual characteristics of caregivers, the impact of caring for an
477 See for example, anonymous submission 284174932, accessed 13 November 2020,
https://consultation.abcb.gov.au/engagement/consult-ris-accessible-
housing/consultation/view_respondent?_b_index=60&uuId=284174932.

www.TheCIE.com.au
302 Proposal to include minimum accessibility standards for housing in the National Construction Code
elderly or disabled person on labour force outcomes is small to non-existent.478 This
implies that paid employment is not necessarily the most likely alternative use of the
additional time spent caring.
Another approach to valuing unpaid labour is the replacement cost approach. Under this
approach, unpaid labour is valued based on the market value of paid labour performing
similar tasks. Consistent with this approach, it is reasonable to value informal care, based
on the wage rate of an aged care worker. This is currently around $22.85 per hour
(Sydney).479 Note that this is significantly lower than NDIS rates, as preferred by some
stakeholders. However, the NDIS rates would include profit on labour costs, and
administrative costs for a service provider which have been considered in the cost of
formal care, but would be inappropriate where care is provided by family and friends.
Under these assumptions, the cost of additional informal care is estimated at around
$7 129 per person per year across all of the below activities (table C.3).
C.3 Additional informal care needs due to inaccessible housing
Activity Before
modification
(Hours per
week)
After
modification
(Hours per
week)
Change (Hours
per week)
Additional care
per year (Hours
per year)
Cost of
additional care
($ per year)
Moving about the house 8.5 5.0 - 3.5 182.0 4 159
Bathing and showering 2.7 1.0 - 1.7 88.4 2 020
Toileting 1.7 0.9 - 0.8 41.6 951
Total 12.9 6.9 - 6.0 312.0 7 129
a Formal care is valued at $22.85 per hour, based on the average wage of an aged care worker.
Source: CIE estimates based on: Carnemolla and Bridge (2019) and Carnemolla (2015); Payscale website,
https://www.payscale.com/research/AU/Job=Aged_Care_Worker/Hourly_Rate/999a3db7/Sydney, accessed 29 October 2020.
How many people require additional care due to inaccessible
housing?
The accessibility features covered by the proposed changes to the NCC are most likely to
benefit people that require assistance (always or sometimes):
■ moving around the house
■ showering and bathing
■ toileting.
As the SDAC survey does not explicitly identify whether dwellings have relevant
accessibility features, CIE infer the relevant population based on their response to various
478 Leigh, A. 2010, “Informal Care and Labor Market Participation”, Labour Economics,17(1), p.
140-149.
479 Payscale website,
https://www.payscale.com/research/AU/Job=Aged_Care_Worker/Hourly_Rate/999a3db7/Sydney,
accessed 29 October 2020.

www.TheCIE.com.au
Proposal to include minimum accessibility standards for housing in the National Construction Code 303
survey questions. CIE also makes the following exclusions in its estimate of people that
may require additional care as a result of inaccessible housing.
■ Those living in housing that has already been modified due to disability or age. This
implicitly assumes that modified housing is already accessible. Although some
submissions suggested that home modifications may not provide all of the features
covered by the NCC proposal, home modifications are more likely to be tailored to
the specific needs of the individual, rather than the generic set of features provided
under the NCC proposal.
■ People who receive the relevant type of care less than once per week — for people
receiving infrequent care, it is less likely that accessible housing would significantly
reduce the amount of care received.
Furthermore, not all assistance with mobility tasks occurs in the home. For example,
some people require assistance with mobility tasks away from the home. It is therefore
appropriate to include only the proportion that indicated they need assistance moving
around the place of residence (either always or sometimes). A significant number of
people who either: ‘do not need assistance moving around the place of residence, but
have difficulty’ or ‘has no difficulty moving around the place of residence’ also receive
assistance with mobility tasks. However, the assistance received mostly relates to
mobility away from home. It is therefore less likely that an accessible home would
significantly reduce the amount of assistance these people receive.
Table C.4 summarises the criteria used to estimate the number of people that could be
receiving additional care due to inaccessible housing.
C.4 Estimating the number of people affected
Assistance received Formal care Informal care
Moving around the house ■ People with mobility limitation
■ Always or sometimes require
assistance moving around the
house
■ Live in a household
■ Excludes people living in modified
housing
■ Receives formal assistance with
mobility tasks once per week or
more frequently
■ People with mobility limitation
■ Always or sometimes require
assistance moving around the
house
■ Live in a household
■ Excludes people living in modified
housing
■ Receives informal assistance with
mobility tasks once per week or
more frequently
Showering and bathing ■ Always or sometimes require
assistance showering or bathing
■ Live in a household
■ Excludes people living in modified
housing
■ Receives formal assistance with
self-care tasks once per week or
more frequently
■ Always or sometimes require
assistance showering or bathing
■ Live in a household
■ Excludes people living in modified
housing
■ Receives informal assistance with
self-care tasks once per week or
more frequently
Toileting ■ Always or sometimes require
assistance toileting
■ Always or sometimes require
assistance toileting

www.TheCIE.com.au
304 Proposal to include minimum accessibility standards for housing in the National Construction Code
Assistance received Formal care Informal care
■ Live in a household
■ Excludes people living in modified
housing
■ Receives formal assistance with
self-care tasks once per week or
more frequently
■ Live in a household
■ Excludes people living in modified
housing
■ Receives informal assistance with
self-care tasks once per week or
more frequently
Source: CIE.
Based on these criteria, the number of people estimated to be receiving additional care
(by activity) is shown in table C.5. Note that some people receive multiple types of care
and therefore some people may be double-counted in the measures shown below.
However, as the additional care being received across each activity is to be estimated
separately, this approach will not double-count the additional care being received (i.e. the
amount of additional care received by activity is additive).
C.5 Number of people receiving care
Type of care People receiving informal
care ('000)
People receiving formal care
('000)
Moving about the house 111.5 21.3
Bathing and showering 182.7 36.1
Toileting 83.3 18.5
Source: CIE based on ABS, 2018 Survey of Disabilities, Ageing and Carers, TableBuilder

www.TheCIE.com.au
Proposal to include minimum accessibility standards for housing in the National Construction Code 305
D Approach to estimating the avoidable cost of home
modifications
Avoidable home modifications
Not all home modifications would be avoidable if dwellings were built to comply with
universal design principles. Under universal design principles, dwellings are designed to
meet a broad range of needs, rather than the specific needs of people with disability.
The ABS’s SDAC provides data on the types of modifications made to the dwellings of
people with disability. However, not all of the modifications identified in the SDAC
could be avoided if the dwelling is designed to comply with universal design principles. It
is assumed that a sub-group of these modifications (structural modifications, ramps,
toilets, baths and laundries, kitchens and doors widened) would not be needed if
dwellings had been designed to comply with universal design principles (table D.1).
D.1 Avoidable modifications
Modifications that could be avoided if dwellings
complied with universal design principles
Modifications that would still be needed even if the
dwelling complied with universal design principles
■ Structural changes
■ Ramps
■ Toilet bath or laundry, kitchen
■ Doors widened
■ Hand rails & Grab rails
■ Remote controls
■ New or changed heating/air conditioning
■ Install home automation
■ Telemonitoring system
■ Other change to dwelling,
Note: Modification types are taken form SDAC survey.
Source: CIE.
Number of avoidable home modifications
To estimate the number of dwellings that have avoidable modifications annually, CIE
compares the number of people who live in dwellings with avoidable modifications in
2018 with 2015, based on SDAC data (table D.2).
■ The 2015 SDAC does not report the number of dwellings with kitchen modifications.
However, 2018 data suggests there are relatively few dwellings with a kitchen
modification only (i.e. most dwellings with a kitchen modification have also had other
modifications).
■ The SDAC data suggests that there were around 33 000 more people living in
modified dwellings in 2018, compared to 2015. However, this does not take into
account the fact that over the 3 year period between surveys, some people that were

www.TheCIE.com.au
306 Proposal to include minimum accessibility standards for housing in the National Construction Code
living in accessible housing may have moved out of a modified dwelling, due to death
or other reasons (i.e. the churn). Furthermore, when a modified dwelling is vacated, it
is unlikely that the new resident will have the same accessibility needs. A simple
comparison between the survey periods is therefore likely to understate the number of
home modifications over the period. To take this into account, the following
adjustments are made.
– It is assumed that 3.6 per cent of people living in modified dwellings die every year
(based on the average mortality rates for the age profile living in modified
dwellings). It is assumed that all others remain in their modified dwelling.
– It is assumed that when a modified dwelling becomes vacant, the new residents do
not have the same accessibility needs.
■ With these adjustments, it is estimated that around 22 000 dwellings are modified
annually to meet the accessibility needs of the resident(s) (table D.2).
D.2 Number of dwellings modified
Number of dwellings
modified
Number of
modified
dwellings –
2015
(‘000)
Number
remaining in
previously
modified
dwellinga
(‘000)
Number of
modified
dwellings –
2018
(‘000)
Estimated
number of
modified
dwellings over
period
(‘000)
Estimated
number of
dwellings
modified
annually
(‘000)
Total 311.60 279.1 346.20 67.06 22.35
Total (ex kitchens) 311.60 279.1 344.50 65.36 21.79
a Assumes a mortality rate of 3.6 per cent per year.
Source: CIE based on ABS Survey of Disabilities, Ageing and Carers 2015 and 2018, TableBuilder.
The unit cost of avoidable home modifications
Key factors that will drive the cost of home modifications include:
■ the type of dwelling (i.e. Class 1a or Class 2)
■ the type of modifications (i.e. what aspects of the dwelling are modified)
■ the extent of the modifications (i.e. to what standard the dwelling is modified).
DCWC has estimated cost of retro-fitting accessible design features, in line with
requirements for Option 1 and Option 2, for both Class 1a (separate houses and
townhouses) and Class 2 dwellings (apartments).480 These estimates are used to derive
unit costs for each of the potentially avoidable modifications.
For each element, DCWC estimate scenarios which includes homes that require no
modification to meet LHDG standards (for some elements) and homes where retrofitting
is not practicable. As the aim is to calculate the average cost of modifications that
actually proceed, these scenarios are ignored.
480 DCWC 2020, NCC Accessible Housing Sundry Cost Advice, Letter to Kieran O’Donnell, 15
December 2020 and associated spreadsheets

www.TheCIE.com.au
Proposal to include minimum accessibility standards for housing in the National Construction Code 307
DCWC’s cost estimates vary significantly depending on whether a dwelling is modified
to meet Option 1 or Option 2. It is assumed that:
■ the modifications made by non-wheelchair users would meet Option 1 costs
■ the modifications made by wheelchair users would meet Option 2 costs.
Based on the above information, it is estimated that the weighted average cost of home
modifications made to Class 1a dwellings is around $18 281 for non-wheelchair users and
around $49 706 for wheelchair users (table D.3).
D.3 Weighted average cost of modifications for Class 1a dwellings
Modification Non-wheelchair
users:
Share of
modifications
with relevant
feature a
(per cent)
Non-wheelchair
users:
Unit cost b
($)
Wheelchair
users:
Share of
modifications
with relevant
feature c
(per cent)
Wheelchair
users:
Unit cost d
($)
Structural changes 16 27 483 29 34 504
Ramps 29 10 500 72 10 800
Toilet, bath or laundry
modifications
78 13 412 87 31 822
Kitchen modifications 5 7 500 17 7 500
Doors widened 4 12 670 24 13 070
Weighted average n.a. 18 821 n.a. 49 706
a Based on the modifications made by non-wheelchair users living in Class 1a dwellings reported in SDAC (2018). Weights add to
more than 100 per cent because many dwellings have multiple modifications. b Based on DCWC’s estimates of the cost of relevant
changes to meet Option 1. c Based on the modifications made by wheelchair users living in Class 1a dwellings reported in SDAC
(2018). Weights add to more than 100 per cent because many dwellings have multiple modifications. d Based on DCWC’s estimates
of the cost of relevant changes to meet Option 2.
Note: It is assumed that the modifications made by non-wheelchair users meet Option 1 for the relevant design elements and the
modifications made by wheelchair users meet Option 2 for the relevant design elements.
Source: CIE estimates based on: ABS, 2018 Survey of Disabilities, Ageing and Carers, TableBuilder; DCWC 2020, NCC Accessible
Housing Sundry Cost Advice, 15 December 2020 and associated spreadsheets
For Class 2 dwellings, it is estimated that the weighted average cost of home
modifications for non-wheelchair users is around $20 260 and around $36 292 for
wheelchair users (table D.4).
D.4 Weighted average cost of modifications for Class 2 dwellings
Modification Non-wheelchair
users:
Share of
modifications
with relevant
feature a
(per cent)
Non-wheelchair
users:
Unit cost b
($)
Wheelchair
users:
Share of
modifications
with relevant
feature c
(per cent)
Wheelchair
users:
Unit cost d
($)
Structural changes 12 25 492 50 31 692
Ramps 50 10 500 0 10 800
Toilet, bath or laundry
modifications
92 10 221 57 29 464
Kitchen modifications 5 7 500 50 7 500
Doors widened 16 13 000 0 13 550

www.TheCIE.com.au
308 Proposal to include minimum accessibility standards for housing in the National Construction Code
Modification Non-wheelchair
users:
Share of
modifications
with relevant
feature a
(per cent)
Non-wheelchair
users:
Unit cost b
($)
Wheelchair
users:
Share of
modifications
with relevant
feature c
(per cent)
Wheelchair
users:
Unit cost d
($)
Weighted average n.a. 20 260 n.a. 36 292
a Based on the modifications made by non-wheelchair users living in Class 2 dwellings reported in SDAC (2018). Weights add to more
than 100 per cent because many dwellings have multiple modifications. b Based on DCWC’s estimates of the cost of relevant changes
to meet Option 1. c Based on the modifications made by wheelchair users living in Class 2 dwellings reported in SDAC (2018). Weights
add to more than 100 per cent because many dwellings have multiple modifications. d Based on DCWC’s estimates of the cost of
relevant changes to meet Option 2.
Note: It is assumed that the modifications made by non-wheelchair users meet Option 1 for the relevant design elements and the
modifications made by wheelchair users meet Option 2 for the relevant design elements.
Source: CIE based on: ABS, 2018 Survey of Disabilities, Ageing and Carers, TableBuilder; and DCWC 2020, NCC Accessible Housing
Sundry Cost Advice, 15 December 2020 and associated spreadsheets
According to Young People in Nursing Homes National Alliance (YPINH), retrofitting
homes with basic visitability, adaptability and accessible features would cost $19 400,481
which is in line with the estimated costs of retrofitting to Option 1 (Silver) ($18 821 for
Class 1a and $20 260 for Class 2 – see tables D.3 and D.4).
481 Young People In Nursing Homes National Alliance, Monash University Department of
Architecture 2015, Shaping the Future Today: Transforming Housing Policy for Australians with
Disability, Melbourne, p.20

www.TheCIE.com.au
Proposal to include minimum accessibility standards for housing in the National Construction Code 309
E Approach to estimating the avoidable cost of moving
house
The cost of moving home
In the Consultation RIS, it is assumed that the cost of each avoidable move was around
$2 500, based on the estimated cost of removalists (stamp duties were explicitly excluded
because these are a transfer between a home purchaser and the government).
In general, most of these costs are only incurred where the move involves selling the
previous home and buying a new one. Where a move involves moving between rental
properties, most of these costs are not incurred.
One indicator of whether a move involved buying and selling a home is whether the
mover is an owner-occupier or a renter, although this is an imperfect measure because
people can move between these groups (i.e. a renter can become an owner-occupier or
vice versa). Nevertheless, it is assumed that:
■ moves involving owner-occupiers involved buying and selling a home
■ moves involving renters do not involve buying and selling a home.
Indicative costs of moving home for owner-occupiers and renters are shown in table E.1.
E.1 Cost of each additional move
Estimated cost for
owner-occupier ($)
Estimated cost for
renter ($)
Agent's commissiona 16 149 0
Marketing fees 6 000 0
Auctioneer costs 800 0
Conveyancing feesb 3 000 0
Removalist costs 2 500 2 500
Total 28 449 2 500
a Assumes agent’s commission of 2 per cent of the weighted average median price across capital cities (around $807 471). b
Includes conveyancing fees for both the sale of the previous home and the purchase of the new home.
Source: CIE estimates
The estimated agent’s commission is based on an average 2 per cent commission482
applied to the weighted average house price across capital cities, which is around
482 See: https://www.realestate.com.au/advice/how-much-does-it-cost-to-sell-a-house/, accessed 18
November 2020; and https://www.realestate.com.au/advice/hidden-costs-buying-home/, accessed
18 November 2020.
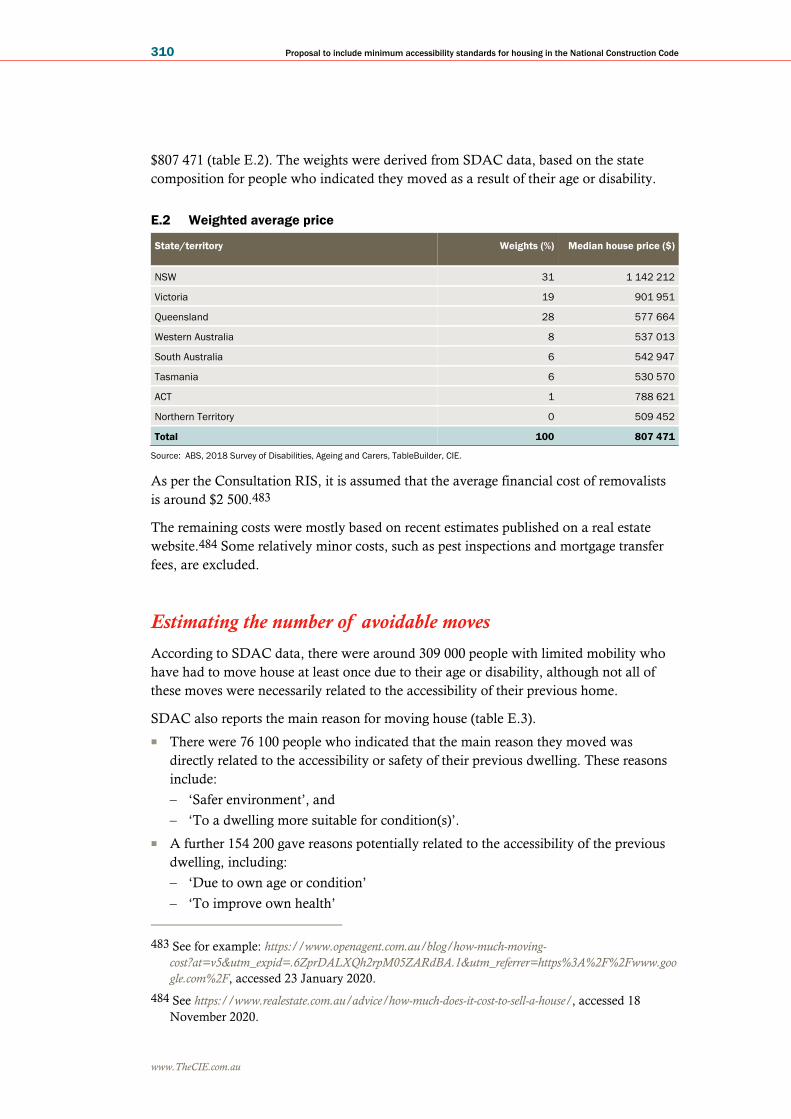
www.TheCIE.com.au
310 Proposal to include minimum accessibility standards for housing in the National Construction Code
$807 471 (table E.2). The weights were derived from SDAC data, based on the state
composition for people who indicated they moved as a result of their age or disability.
E.2 Weighted average price
State/territory Weights (%) Median house price ($)
NSW 31 1 142 212
Victoria 19 901 951
Queensland 28 577 664
Western Australia 8 537 013
South Australia 6 542 947
Tasmania 6 530 570
ACT 1 788 621
Northern Territory 0 509 452
Total 100 807 471
Source: ABS, 2018 Survey of Disabilities, Ageing and Carers, TableBuilder, CIE.
As per the Consultation RIS, it is assumed that the average financial cost of removalists
is around $2 500.483
The remaining costs were mostly based on recent estimates published on a real estate
website.484 Some relatively minor costs, such as pest inspections and mortgage transfer
fees, are excluded.
Estimating the number of avoidable moves
According to SDAC data, there were around 309 000 people with limited mobility who
have had to move house at least once due to their age or disability, although not all of
these moves were necessarily related to the accessibility of their previous home.
SDAC also reports the main reason for moving house (table E.3).
■ There were 76 100 people who indicated that the main reason they moved was
directly related to the accessibility or safety of their previous dwelling. These reasons
include:
– ‘Safer environment’, and
– ‘To a dwelling more suitable for condition(s)’.
■ A further 154 200 gave reasons potentially related to the accessibility of the previous
dwelling, including:
– ‘Due to own age or condition’
– ‘To improve own health’
483 See for example: https://www.openagent.com.au/blog/how-much-moving-
cost?at=v5&utm_expid=.6ZprDALXQh2rpM05ZARdBA.1&utm_referrer=https%3A%2F%2Fwww.goo
gle.com%2F, accessed 23 January 2020.
484 See https://www.realestate.com.au/advice/how-much-does-it-cost-to-sell-a-house/, accessed 18
November 2020.

www.TheCIE.com.au
Proposal to include minimum accessibility standards for housing in the National Construction Code 311
– ‘To live with family or friends’.
■ The remaining reasons appear unrelated to the accessibility of the previous dwelling,
including:
– ‘To save money or cheaper’
– ‘To live closer to family’
– ‘For more or better personal care at new home’
– ‘To be closer to medical or support services of facilities’
– ‘To be closer to other services or facilities (e.g. work, services, leisure)
– ‘Family changes or house too big’
– ‘Carer move or different carer’
– ‘For other reasons’
E.3 Main reasons for moving
Reasons for moving Profound Severe Moderat
e
Mild Total
'000 '000 '000 '000 '000
Reasons directly related to accessibility of previous
dwelling
Safer environment 4.5 3.5 1.4 7.2 16.8
To a dwelling more suitable for condition(s) 16.3 17.1 10.4 15.6 59.3
Total directly related 20.8 20.6 11.8 22.8 76.1
Reasons potentially related to accessibility of previous
dwelling
Due to own age or condition 40.9 29.7 15.0 30.9 116.4
To improve own health 4.8 4.3 5.4 10.3 21.9
To live with family or friends 5.3 2.7 0.0 5.6 15.9
Total potentially related 51.0 36.7 20.4 46.8 154.2
Total directly or potentially related 71.8 57.3 32.2 69.6 230.3
Reasons unrelated to accessibility of previous dwelling
To save money or cheaper 1.1 1.9 2.3 2.7 7.3
To live closer to family 1.2 1.7 1.1 1.4 8.6
For more or better personal care at new home 1.2 0.0 1.4 3.2 5.0
To be closer to medical or support services or facilities 3.9 4.9 2.8 4.9 14.2
To be closer to other services or facilities (eg work, services,
leisure)
3.2 1.5 0.7 2.2 8.4
Family changes or house too big 3.4 3.1 1.6 7.6 13.7
Carer moved or different carer 0.0 0.0 0.0 0.0 1.7
For other reasons 5.2 6.9 4.6 4.5 22.0
Other reasons for moving 19.2 20.0 14.5 26.5 80.9
Total 91.0 77.3 46.7 96.1 311.2
Source: ABS, Survey of Disabilities, Ageing and Carers, 2018, TableBuilder.

www.TheCIE.com.au
312 Proposal to include minimum accessibility standards for housing in the National Construction Code
Unpublished analysis of the COTA survey also found that 9.5 per cent of respondents
over the age of 50 indicated that the main reason for their most recent move was ‘My
property was not accessible/no longer suited’.485
■ For the purposes of the CBA,
– a conservative assumption would be based on the number of people who
reported moving for reasons directly related to the accessibility of their previous
residence. This is around 76 100 people (and in many cases their families).
– A less conservative assumption would be based on the number of people who
reported moving for reasons either directly or potentially related to the
accessibility of their previous residence. This is around 230 300 people (and in
many cases their families).
As some of these people have had to move more than once, the number of additional
moves will be greater than the number of people who have had to move as a result of
their disability or age. The average number of times these people have moved is not
known.
Around 75-80 per cent of the people who have had to move as a result of disability or age
have moved only once. In general, one would expect that the proportion of people would
decline with each additional move, suggesting that most of the remaining people are
likely to have moved 2 or 3 times as a result of disability or age.
■ To estimate the number of additional moves, it seems reasonable to assume that
on average, people who have moved more than once due to disability or age have,
on average, moved 2.5 times (i.e. 2-3 times on average).
Furthermore, not all of the additional moves happen every year. SDAC does not report
the year since the last move. However, of those people with limited mobility who had
had to move as a result of their disability or age, the average time period since the
accident happened or main condition occurred is around 16.6 years (table E.4).
■ To estimate the average number of avoidable moves per year, the estimated
number of additional moves is therefore divided by the average time since the
accident happened or main condition occurred (around 16.6 years).
E.4 Number of years since accident happened or main condition occurred
Age range Number of
people ('000)
Weight (%)a Mid-point of
range (years)
0 to 4 59.9 20.2 2.0
5 to 9 56.7 19.1 7.0
10 to 14 42 14.1 12.0
15 to 19 32.5 10.9 17.0
20 to 24 30.4 10.2 22.0
485 Bringolf, J. 2015, Let’s Talk About Where You Live, Incomplete draft based on COTA NSW
2014 survey data for the 50+ Report with a focus on how and where older people are living,
unpublished, p. 14.

www.TheCIE.com.au
Proposal to include minimum accessibility standards for housing in the National Construction Code 313
Age range Number of
people ('000)
Weight (%)a Mid-point of
range (years)
25 to 29 15.2 5.1 27.0
30 to 34 18.9 6.4 32.0
35 to 39 11.3 3.8 37.0
40 + 30.1 10.1 42.0
Don't know 7.2 n.a. n.a.
Total/weighted average 308.9 16.6
a Weightings exclude the number of people who don’t know the number of years since accident happened or main condition occurred.
Source: ABS, 2018 Survey of Disabilities, Ageing and Carers, TableBuilder, CIE.
Based on the assumptions outlined above, a lower bound estimate of the number of
additional moves per year due to inaccessible housing is around 6 400 (table E.5).
E.5 Estimated number of additional moves per year — lower bound estimate
People Moved once
(‘000)
Moved more
than once
(‘000)
Total avoidable
movesa
(‘000)
Avoidable
moves per
yearb
(‘000)
Owner-occupiers 30.5 4.6 42.0 2.5
Renters 25.3 15.6 64.3 3.9
Total 55.8 20.2 106.3 6.4
a Assumes that those that have moved more than once have moved 2.5 times on average. b Total avoidable moves divided by 16.6
(reflecting the average number of years since the accident happened or main condition occurred (see table E.4 above).
Source: ABS, 2018 Survey of Disabilities, Ageing and Carers, TableBuilder, CIE.
The upper bound estimate suggests that there could be an additional 17 300 moves per
year as a result of inaccessible housing (table E.6).
E.6 Estimated number of additional moves per year — upper bound estimate
People Moved once
(‘000)
Moved more
than once
(‘000)
Total avoidable
movesa
(‘000)
Avoidable
moves per
yearb
(‘000)
Owner-occupiers 97.9 11.9 127.7 7.7
Renters 76.6 33.1 159.4 9.6
Total 174.5 45.0 287.0 17.3
a Assumes that those that have moved more than once have moved 2.5 times on average. b Total avoidable moves divided by 16.6
(reflecting the average number of years since the accident happened or main condition occurred (see table E.4 above).
Source: ABS, 2018 Survey of Disabilities, Ageing and Carers, TableBuilder, CIE.

www.TheCIE.com.au
314 Proposal to include minimum accessibility standards for housing in the National Construction Code
F Longer stays in hospital or transition care
Evidence on delayed discharge from hospital
There are various international studies that examine various reasons and consequences of
delayed discharge from hospitals. The National Health Service systematically reports
data on delayed transfers of care in English hospitals, including the reason for the delay.
However, given differences in health systems and the characteristics of the housing stock,
English and other international data is unlikely to be a good indicator of the extent of the
problem in Australia. CIE is not aware of any similar datasets for Australia.
There are a small number of Australian studies that identify the causes of delayed
discharge from various types of care (summarised in table F.1).
F.1 Summary of Australian literature on the causes of delayed discharge
Study Approach Key findings relevant to the RIS
New et. al. (2013) Sample of 360 patients
admitted into two inpatient
rehabilitation units in
Melbourne to examine the
occurrence of discharge
barriers, their causes and the
duration of unnecessary
hospitalisation
■ Over the study period, 21 per cent of all bed days were
occupied by patients deemed to have a discharge barrier.
■ The causes of the discharge barrier included the following
causes that are directly related to the accessibility of the
dwelling, including:
– Accommodation (patient has no available suitable
accommodation options), which accounted for 9.1 per
cent of all additional unnecessary days in hospital.
– Home modifications (patient waiting for home
modifications that are essential to ensure safe access
and care at home after discharge), which account for
22.6 per cent of all additional unnecessary days in
hospital.
Salonga-Reyes and
Scott (2016)
Sample of 406 patients
admitted into non-acute
maintenance care in a
tertiary hospital in Brisbane
was used to examine causes
and effects of discharge
delays.
■ Delays accounted for 90 per cent of non-acute occupied
bed days.
■ Among the causes of delay most relevant to this RIS were:
– Wait for beds in residential aged care facility (43.8 per
cent of occupied bed days)
– Wait for delivery of home equipment (2.0 per cent of
occupied bed days)
– Wait for home modifications (0.5 per cent of occupied
bed days)
Ou, Chen and
Santiano (2009)
A sample of 1958 in a tertiary
referral hospital in NSW was
used to estimate the reasons
and determinants of delay in
acute care general ward
patients.
Causes listed were mostly not relevant to accessible housing.
Identified causes most relevant included:
■ Post-hospital problem (8.2 per cent), including:
– Awaiting equipment (1.1 per cent)
– Lack of carer support (3.0 per cent)
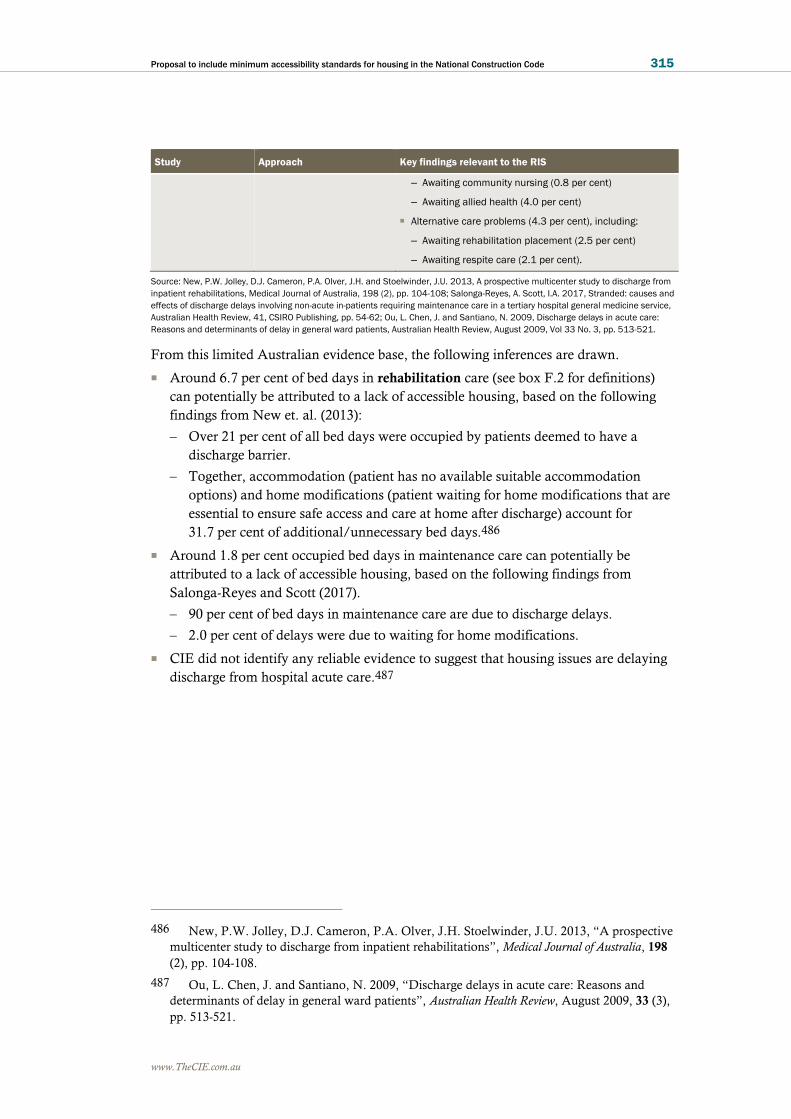
www.TheCIE.com.au
Proposal to include minimum accessibility standards for housing in the National Construction Code 315
Study Approach Key findings relevant to the RIS
– Awaiting community nursing (0.8 per cent)
– Awaiting allied health (4.0 per cent)
■ Alternative care problems (4.3 per cent), including:
– Awaiting rehabilitation placement (2.5 per cent)
– Awaiting respite care (2.1 per cent).
Source: New, P.W. Jolley, D.J. Cameron, P.A. Olver, J.H. and Stoelwinder, J.U. 2013, A prospective multicenter study to discharge from
inpatient rehabilitations, Medical Journal of Australia, 198 (2), pp. 104-108; Salonga-Reyes, A. Scott, I.A. 2017, Stranded: causes and
effects of discharge delays involving non-acute in-patients requiring maintenance care in a tertiary hospital general medicine service,
Australian Health Review, 41, CSIRO Publishing, pp. 54-62; Ou, L. Chen, J. and Santiano, N. 2009, Discharge delays in acute care:
Reasons and determinants of delay in general ward patients, Australian Health Review, August 2009, Vol 33 No. 3, pp. 513-521.
From this limited Australian evidence base, the following inferences are drawn.
■ Around 6.7 per cent of bed days in rehabilitation care (see box F.2 for definitions)
can potentially be attributed to a lack of accessible housing, based on the following
findings from New et. al. (2013):
– Over 21 per cent of all bed days were occupied by patients deemed to have a
discharge barrier.
– Together, accommodation (patient has no available suitable accommodation
options) and home modifications (patient waiting for home modifications that are
essential to ensure safe access and care at home after discharge) account for
31.7 per cent of additional/unnecessary bed days.486
■ Around 1.8 per cent occupied bed days in maintenance care can potentially be
attributed to a lack of accessible housing, based on the following findings from
Salonga-Reyes and Scott (2017).
– 90 per cent of bed days in maintenance care are due to discharge delays.
– 2.0 per cent of delays were due to waiting for home modifications.
■ CIE did not identify any reliable evidence to suggest that housing issues are delaying
discharge from hospital acute care.487
486 New, P.W. Jolley, D.J. Cameron, P.A. Olver, J.H. Stoelwinder, J.U. 2013, “A prospective
multicenter study to discharge from inpatient rehabilitations”, Medical Journal of Australia, 198
(2), pp. 104-108.
487 Ou, L. Chen, J. and Santiano, N. 2009, “Discharge delays in acute care: Reasons and
determinants of delay in general ward patients”, Australian Health Review, August 2009, 33 (3),
pp. 513-521.

www.TheCIE.com.au
316 Proposal to include minimum accessibility standards for housing in the National Construction Code
F.2 Relevant types of care
■ Acute care — care in which the intent is to perform surgery, diagnostic or
therapeutic procedures in the treatment of illness or injury.488
■ Sub-acute care — specialised multidisciplinary hospital-based care in which the
primary need for care is optimisation of the patient’s functioning and quality of
life. A person’s functioning may relate to their whole body or a body part, the
whole person, or the whole person in a social context, and to impairment of a body
function or structure, activity limitation and/or participation restriction and
comprises the following care types:489
– Rehabilitation care — care to improve the functioning of a patient with an
impairment, activity limitation or participation restriction due to a health
condition.
– Palliative care — care to optimise the quality of life of a patient with an active
and advanced life-limiting illness.
– Geriatric evaluation and management care — care to improve the functioning
of a patient with multi-dimensional needs, associated with age related medical
conditions. Some examples of conditions in GEM care patients include a
tendency to fall, incontinence, reduced mobility and cognitive impairment. The
patient may also have complex psychosocial problems.
– Psychogeriatric care — care to improve the functional status, behaviour
and/or quality of life for an older patient with significant psychiatric or
behavioural disturbance. The disturbance is caused by mental illness, age
related organic brain impairment or a physical condition.
■ Non-acute care (also referred to as maintenance care) — hospital-based care to
support patients with an impairment, activity limitation or participation restriction
due to a health condition.
■ Transition care — care to help patients recover after a hospital stay. It provides
short-term specialised care and support to help the patient regain functional
independence and confidence sooner, and avoid the need for longer term care and
support services. Care is tailored to the patient’s specific needs and goals, and can
be delivered in an aged care home, the patient’s own home, out in the community,
or a mix of these locations, as the needs change with your recovery.490
488 Australian Institute of Health and Welfare website, https://www.aihw.gov.au/reports-
data/myhospitals/content/glossary, accessed 21 January 2020.
489 IHPA website, https://www.ihpa.gov.au/what-we-do/subacute-and-non-acute-care, accessed 20
January 2020.
490 Australian Government, My aged care website, https://www.myagedcare.gov.au/short-term-
care/transition-care, accessed 20 January 2020.

www.TheCIE.com.au
Proposal to include minimum accessibility standards for housing in the National Construction Code 317
Estimating the size of the problem
To estimate the size of the problem, the following approach is used.
■ Estimate the total cost of the relevant types of care. This includes:
– Sub-acute care (excluding palliative care)
– Non-acute hospital care
– Transition care.
■ It is then assumed that the following proportions of these costs can be attributed to the
problem of a lack of accessible housing.
– 6.7 per cent of sub-acute care based on the findings of New et. al. 2013 (although
this study only related to rehabilitation care)
– 1.8 per cent of maintenance care based on the findings of Salonga-Reyes and Scott
(2017)
– As there are no studies on the extent to which lack of accessible housing increases
the need for transition care, CIE applies the estimate relating to maintenance care.

www.TheCIE.com.au
318 Proposal to include minimum accessibility standards for housing in the National Construction Code
G Approach to estimating the costs associated with
inability to visit family and friends
Estimated incidence of loneliness due to inaccessible housing
A lack of accessible housing contributes to social isolation and loneliness where people
with a mobility limitation are unable to visit friends and family because their homes are
inaccessible. Housing accessibility issues could also contribute to loneliness in people
with limited mobility where their own dwelling does not meet their accessibility needs.
However, here the focus is only on loneliness caused by an inability to visit family and
friends. To the extent that their own dwelling does not meet their accessibility needs and
contributes to loneliness in people with limited mobility, these impacts would be broadly
included in the general quality of life impacts.
The SDAC data also provides some insights into the number of people affected by an
inability to access the houses of family and friends.
■ In 2018, there were around 113 700 people who reported having difficulty accessing
another person’s house over the past year. This is the most direct measure of the
number people that may have been unable to visit friends and/or relatives due to
inaccessible housing. However, this measure would understate the true impact, as
many people with mobility limitation would avoid visiting friends and relatives if they
know (or suspect) they will be unable to access the house.
■ There were a further 309 000 people who reported avoiding visiting family and friends
due to their disability (this excludes the overlap between those that also had difficulty
accessing another person’s house). However, it is not clear that they avoided visiting
family and friends because their housing was inaccessible or for some other reason
related to their disability.
■ In total, up to 422 400 people were not able to access the home of a friend or relative.
As noted above, this is likely to be an upper bound estimate because some people may
have avoided visiting family or friends for reasons related to their disability, but
unrelated to the accessibility of the house.
A relevant indicator of social isolation is the frequency of contact with family/friends
living outside the dwelling. Despite having had trouble accessing someone else’s house
and/or avoiding visiting friends and relatives, most people within this group nevertheless
see family and friends that live outside the household relatively frequently.
■ More than 60 per cent of people who had difficulty accessing another person’s house
or avoided visiting other people because of their disability still saw a family member
or friend who lived outside the house in the last week.

www.TheCIE.com.au
Proposal to include minimum accessibility standards for housing in the National Construction Code 319
■ More than 80 per cent of these people had contact with family and friends in the last
month.
■ Around 60 400 people had not had contact with family/friends not living in the same
household in the last month (table G.1). Although there does not appear a formal
definition of social isolation based on the frequency of contact with family and
friends, this group appears to have minimal contact with people outside the dwelling.
G.1 Frequency of contact with family or friends
Frequency People who had
difficulty
accessing another
person's house
People who
avoided visiting
other people
Total Share
'000 '000 '000 Per cent
Every day 14.7 27.3 40.3 9.5
In the last week 58.8 177.2 219.0 51.8
In the last month 19.1 84.0 95.3 22.6
In the last quarter 8.8 36.6 42.4 10.0
Has not seen family or friends not
living in same household in the last 3
months 3.2 12.7 15.9 3.8
Has no family or friends 0.0 2.1 2.1 0.5
Not applicable 7.4 0.0 7.4 1.8
Total 113.7 339.9 422.4 100.0
Source: ABS, Survey of Disabilities, Ageing and Carers, 2018, TableBuilder.
As noted above, feelings of loneliness are not necessarily directly related to the frequency
with which people see their social networks. Feelings of loneliness are subjective and
some people can feel lonely even if they see their family and friends frequently. Perhaps a
better (albeit still imperfect) measure of loneliness is whether people want more contact
with their family and friends.
Of the people who were identified as either having had trouble accessing someone else’s
house and/or had avoided visiting family and friends, around 191 500 (or around 45 per
cent) wanted more contact with their family and friends (table G.2).
G.2 Share of identified population who would like to see family and friends more
often
Level of mobility
limitation
Want more contact with
family/friends
Total identified population Share wanting more
contact with
family/friends
'000 '000 Per cent
Profound 43.0 100.0 43.0
Severe 50.1 114.6 43.7
Moderate 43.8 82.5 53.1
Mild 61.6 127.7 48.2
Total 191.5 423.0 45.3
Source: ABS, Survey of Disabilities, Ageing and Carers, 2018, TableBuilder.

www.TheCIE.com.au
320 Proposal to include minimum accessibility standards for housing in the National Construction Code
The proportion of people that want more contact with family and friends (and may
therefore be vulnerable to loneliness) is higher among people who may have been unable
to visit family and friends due to access issues, compared with the broader population of
people with limited mobility. The proportion is around 26.5 per cent for others with
mobility limitation (i.e. those that did not report that they had difficulty accessing the
house of another person, did not report that they had avoided visiting a friend), which is
consistent with the proportion of Australians that feel lonely, as reported above (around
25 per cent).
G.3 Share of people with a mobility limitation that want more contact with
family/friends
People with a mobility limitation Want more
contact with
family/friend
s
Total Share
'000 '000 Per cent
Relevant people 191.5 423.0 45.3
Others with mobility limitation 677.8 2 559.3 26.5
All people with mobility limitation 869.3 2 982.3 29.1
Source: ABS, Survey of Disabilities, Ageing and Carers, 2018, TableBuilder.
This data supports the proposition that inaccessible housing may be contributing to
loneliness by preventing people from visiting family and friends. Noting that some in this
group may have been lonely even if they had been able to access the home of their friends
or relatives.
■ Using the 25 per cent of the population (see above) as a benchmark implies that
around 105 800 may have suffered from loneliness anyway.
■ This implies that approximately an additional 85 800 people with limited mobility
may be suffering from loneliness as a result of an inability to visit family and friends
due to inaccessible housing (table G.4).
G.4 Estimated cost of loneliness due to a lack of accessible housing
Identified
population a
Share that want
more contact with
family/friends
People that want
more contact with
family/friends
'000 Per cent '000
Actual estimates 423.0 45.3 191.5
Implied baseline 423.0 25.0 105.8
Cost due to lack of accessible housing 85.8
a The identified population is based on 2018 SDAC data using TableBuilder. The identified population includes: people with a mobility
limitation; and indicated they did not leave the house as often as they would like due to their own condition or age; or indicated they
had difficult accessing another person’s house over the past year; or had avoided visiting people due to their condition. b Based on
the share of the identified population that indicated they want more contact with family/friends. c The baseline share of the population
that suffer from loneliness is based on a 2018 survey by the Australian Psychological Society and Swinburne University of Technology.
Source: ABS Survey of Disabilities, Ageing and Carers, 2018, TableBuilder data; Australian Pyschological Society and Swinburne
University of Technology, 2018, Australian Loneliness Report: A survey exploring the loneliness levels of Australians and the impact on
their health and wellbeing, p. 5; McDaid, D. Park, A.L. and Fernandez, J.L. Reconnections Evaluation Interim Report, Personal Social
Services Research Unit (PSSRU), London School of Economics, June 2016, p. 30; CIE.

www.TheCIE.com.au
Proposal to include minimum accessibility standards for housing in the National Construction Code 321
The cost of loneliness
Loneliness is associated with a range of health impacts, including:
■ an increase in GP consultations
■ unplanned hospital admissions
■ increased attendance at an Emergency Department
■ an increase in self-harm
■ an increase in depression
■ an increase in coronary heart disease
■ an increase in stroke
■ an increase in dementia.
One way the cost of loneliness to the community has been measured in the literature is
through these health impacts. Although CIE did not identify any Australian studies
estimating the economic costs of loneliness, there are several UK studies. In particular:
■ McDaid et. al. estimated the avoidable costs of loneliness could be around £1 700
(2015 values) per person in net present value terms over ten years.491
– The discount rate used in the net present value calculation is not reported.
However, using a 7 per cent discount rate, this equates to around £226 per year.
– Converted to 2019 Australian dollar terms, this is around $417 per year.
■ For those who are lonely most of the time, these costs are estimated at around £6 000
per person in net present value terms over ten years. 492
– Assuming a 7 per cent discount rate, this equates to around 798 per year.
– Converting to 2019 Australian dollar terms, this is around $1 471 per year.
The above estimates are used as low and high estimates, with the midpoint used as the
central case estimate.
491 McDaid, D., Park, A.L. and Fernandez, J.L. 2016, Reconnections Evaluation Interim Report,
Personal Social Services Research Unit (PSSRU), London School of Economics, June 2016, p.
30.
492 McDaid, D., Park, A.L. and Fernandez, J.L. 2016, Reconnections Evaluation Interim Report,
Personal Social Services Research Unit (PSSRU), London School of Economics, June 2016, p.
30.

www.TheCIE.com.au
322 Proposal to include minimum accessibility standards for housing in the National Construction Code
H Premature or inappropriate entry into residential aged
care
Incidence of people inappropriately or prematurely admitted to
aged care
There were:
■ around 176 300 people with mobility impairment in residential aged care in 2018
(including homes for the aged and cared retired/aged accommodation) according to
SDAC data
■ 182 705 permanent aged care places funded by the Australian Government as at
June 2019, according to AIHW data.493
Entry into residential care can be a complex decision, taking into account a range of
factors. There is limited evidence on the incidence of people being admitted to residential
aged care inappropriately or prematurely. Residential aged care is generally to address
care needs beyond accessibility. However, it is possible that some proportion of these
aged care residents may have prematurely entered aged care, where their previous home
no longer meets their changing accessibility needs and they are unable to secure
alternative accommodation that meets their needs. Even where an individual has some
care needs, home-based care may be possible with accessible housing.
Based on the limited information available, it is estimated that there could be between
2 660 and 6 023 additional people in residential aged care due to a lack of accessible
housing, with a central case estimate of 4 140 (table G.1). Details of the approach to
estimating the number of additional people in residential aged care is provided below.
H.1 Additional people in residential aged care due to a lack of accessible housing
Age group Low estimate Central case High estimate
No. No. No.
Older people (65+ years) 2 660 4 140 6 023
Younger people (<65 years) 107 137 176
Total 2 767 4 277 6 199
Source: CIE estimates.
493 Australian Institute of Health and Welfare website, https://www.gen-
agedcaredata.gov.au/Resources/Access-data/2019/September/Aged-care-data-
snapshot%E2%80%942019, accessed 22 December 2019.

www.TheCIE.com.au
Proposal to include minimum accessibility standards for housing in the National Construction Code 323
Older people inappropriately or prematurely admitted to aged care
Some stakeholders suggested it was unlikely that there would be a large number of
inappropriate or premature entrants into residential aged care.
■ Prospective entrants into government-funded residential aged care places undergo an
assessment by an Aged Care Assessment Team (ACAT). ACATs assess the physical,
psychological, medical, restorative, cultural and social needs of frail older people to
help them and their carers to access appropriate levels of support. Evidence suggests
that a range of factors influence the ACAT’s recommended long-term care setting,
including age, availability of informal care, health conditions and assistance needs.494
■ There has also been a policy shift towards assisting people to stay at home, rather than
enter aged care.
The AIHW reports that in 2018-19, there were 163 047 aged care assessments.495 Among
the issues considered as part of these assessments are any difficulties completing daily
tasks and activities around the home and any issues relating to home and personal safety
(i.e. issues relating to the accessibility of the home).
■ In around 75 per cent of cases, the recommended long-term living arrangement was
the private residence or other residential arrangements within the community
(including independent living within a retirement village, supported community
accommodation, boarding houses and other community settings) (chart H.2). This
implies that the client’s existing dwelling was assessed as being generally suitable
(although it is still possible that more accessibility features could improve the ease of
entering/leaving or moving around the dwelling and reduce the risk of falls and care
needs).
■ In most of the remaining cases, the recommended long-term living arrangement was
residential aged care. However, it is not clear to what extent lack of accessibility
features within the existing dwelling contributed to that recommendation.
Although the number of places in residential aged care has grown over the past decade,
the number of places per 1 000 people aged 70 years and over declined from around 87 to
around 76 over the same timeframe (chart H.3). This reflects the greater focus on
home-based care, rather than residential care.
There have been several studies that have modelled the extent to which factors contribute
to entry into residential aged care, using Australian data. These studies provide useful
insights because they use statistical techniques to estimate the impact of each relevant
factor, with all other factors held constant.
494 Jukic, M. and Temple, J.B. 2018, Recommended long term care settings following aged care
assessments in Australia, PLOS One.
495 Australian Institute of Health and Welfare website, https://www.gen-
agedcaredata.gov.au/Resources/Access-data/2019/September/Aged-care-data-
snapshot%E2%80%942019, accessed 22 December 2019.

www.TheCIE.com.au
324 Proposal to include minimum accessibility standards for housing in the National Construction Code
H.2 Recommended long-term living arrangement from aged care assessments
Data source: Australian Institute of Health and Welfare website, https://www.gen-agedcaredata.gov.au/Resources/Access-
data/2019/September/Aged-care-data-snapshot%E2%80%942019, accessed 22 December 2019.
H.3 Operational number of residential aged care places, Australia-wide
Source: PC Report on Government Services 2019, Chapter 14: Aged Care, Tables 14A.13-14.
Of most relevance, Jukic (2017)496 used SDAC (2012) data to estimate the extent to
which various factors (including age, assistance needs and specific conditions) affect the
probability (or odds) of being in residential aged care. Jukic (2017) and Jukic and Temple
(2018)497 also used similar models with alternative data sources (such as ACAT
assessment data) to estimate the extent to which various factors contribute to the
recommended long-term care setting. However, the model using SDAC data is most
496 Jukic, M. 2017, Modelling Residential Aged Care in Australia: Entry and Exit, A thesis
submitted for the degree of Doctor of Philosophy of the University of Melbourne
497 Jukic, M. and Temple, J.B. 2018, Recommended long term care settings following aged care
assessments in Australia, PLOS One.
Private residence67.6%
Other community6.5%
Residential aged care
25.4%
Other0.1%
No long-term plan made0.3%
70
72
74
76
78
80
82
84
86
88
150 000
160 000
170 000
180 000
190 000
200 000
210 000
2009 2010 2011 2012 2013 2014 2015 2016 2017 2018
Number of places (LHS) Number of places per 1000 people aged 70 & over (RHS)

www.TheCIE.com.au
Proposal to include minimum accessibility standards for housing in the National Construction Code 325
relevant for the CBA because it focuses on the number of people in residential aged care,
rather than number of new admissions.
The odds ratio for each variable represents the odds that a person will be in aged care
with the relevant variable (i.e. when a person has a particular need or condition),
compared to the odds of being in residential aged care without the relevant need or
condition (table H.4).
■ An odds ratio of 1 would imply that a person experiencing this variable has the same
likelihood of being in residential aged care as those without the relevant need or
condition, holding other characteristics constant.
■ An odds ratio of less than 1 implies that it is less likely that those with the relevant
need or condition will be in residential aged care.
■ An odds ratio greater than 1 implies that it is more likely that those with the relevant
need or condition will be in residential aged care.
H.4 Logistic model of probability of being in aged care — 2012
95% confidence interval
Variable Odds ratio P>z Lower bound Upper bound
Age 1.204 0.000 1.136 1.276
Age square 0.999 0.003 0.998 0.999
Married 0.206 0.000 0.165 0.257
Needs help with emotional/cognitive tasks 2.888 0.000 2.112 3.948
Needs help to cope with emotions 2.105 0.000 1.525 2.906
Needs help with understanding 1.955 0.002 1.281 2.985
Needs help with communication 4.310 0.000 3.148 5.901
Needs help with dressing 1.781 0.001 1.275 2.487
Needs help with mobility about residence 2.684 0.000 2.076 3.468
Needs help with toileting 4.371 0.000 3.273 5.836
Head injury 0.580 0.003 0.404 0.831
Dementia 2.541 0.000 1.818 3.551
Diabetes 0.719 0.043 0.522 0.989
Schizophrenia 3.859 0.002 1.612 9.241
Depression 3.172 0.000 2.392 4.206
Retardation 0.433 0.094 0.162 1.154
Epilepsy 2.853 0.013 1.244 6.541
Multiple Sclerosis 2.167 0.028 1.087 4.321
Paralysis 4.786 0.000 2.591 8.841
Heart Disease 1.653 0.000 1.283 2.130
Urinary 1.593 0.052 0.996 2.549
Constant 1.115 0.000 1.420 9.340
Number of resident records 9 787
Pseudo R2 0.799
Source: Jukic, M. 2017, Modelling Residential Aged Care in Australia: Entry and Exit, A thesis submitted for the degree of Doctor of
Philosophy of the University of Melbourne, p. 132.

www.TheCIE.com.au
326 Proposal to include minimum accessibility standards for housing in the National Construction Code
The accessibility of the residence (or previous residence for those that have already
moved into aged care) is not one of the variables included in the various models. The
variable that is mostly closely related to housing accessibility is whether an individual
‘needs help with mobility about residence’.
One submission argued that the focus on people who need help moving around their
place of residence excludes conditions that would be assisted by the propose provisions
(such as toileting, dementia, multiple sclerosis, paralysis and heart disease). The proposed
NCC provisions would help with the functional need (i.e. ‘needs help with mobility
about residence’), rather than the underlying condition per se. The conditions identified
in the submission (such as dementia, multiple sclerosis, paralysis and heart disease) may
in many cases co-exist with ‘needs help with mobility about residence’. The statistical
model disentangles the impact of the functional need (i.e. ‘needs help with mobility about
residence’) from the underlying condition.
The modelling results suggest that ‘needs assistance moving around a residence has a
statistically significant impact on the odds of being in residential aged care. All else being
equal, for those that need assistance moving around the residence, the odds of being in
residential aged care are around 2.7 times higher than for those without a need for
assistance moving around the residence. This could be interpreted as evidence that
inaccessible housing is contributing to additional people being in residential aged care.
Based on 2018 SDAC data, the probability/odds of being in residential aged care are
relatively low (less than 1 per cent) for those over the age of 65 that do not need
assistance moving around the residence, but much higher for those that need assistance
(including those that do not move around the residence) (table H.5). However, as noted
above, those that need assistance moving around the residence often have a range of
other risk factors, unrelated to the dwelling, that also contribute to being in residential
aged care.
H.5 Probability/odds of being in residential aged care — 2018
Assistance required In residential
aged care
Total Probability of
being in aged
care
Odds of being in
aged care
'000 '000 Per cent
Does not need assistance 15.9 1 676 0.95 0.0096
Needs assistance 154.4 266 58.11 1.3872
Total 170.3 1 941.2 8.77 0.0962
Source: ABS, 2018 Survey of Disabilities, Ageing and Carers, TableBuilder.
The SDAC data and the modelling results can be used to infer the number of additional
people that may be in residential aged care as a result of the need for help with moving
around the residence as follows (see table G.6).
■ The odds (0.0096) of being in residential aged care for those that do not need
assistance moving around the residence are used as a baseline. This implies a baseline
of around 2 500 people (out of the 266 000 people in total) who need assistance with
mobility would have been in residential aged care anyway (i.e. even if they did not
need assistance with mobility). This is less than 1 per cent of the total.

www.TheCIE.com.au
Proposal to include minimum accessibility standards for housing in the National Construction Code 327
■ The odds ratio reported above is then applied to estimate the odds of being in
residential aged care for those who need assistance moving around the residence, all
other variables being equal. The central case odds ratio (2.684), as well as the lower
(2.076) and upper (3.468) bounds of the 95 per cent confidence interval are applied.
■ The difference between the number of people estimated to be in residential aged care
implied by the odds estimated above and the baseline can be interpreted as the impact
of needing help with mobility around the place of residence.
– This implies that there are between 2 660 and 6 023 additional older Australians in
residential aged care as a direct result of needing help with mobility around the
place of residence, with a central case estimate of 4 140 additional people.
– Note that this estimate is far less than the 154 400 people with mobility needs that
were reported to be in residential aged care in 2018. This implies that the
remaining people were in residential aged care due to other factors unrelated to
their need for help moving around the place of residence.
H.6 Estimated number of people in residential aged care due to needing help with
mobility
Level of mobility limitation Odds Probability (Per
cent)
Estimated
number of people
(Persons)
Attributable to
mobility needs
(Persons)
Baseline (people without mobility
needs) 0.0096 0.9490 2 521 n.a.
Lower bound estimate (People with
mobility needs) 0.0199 1.9501 5 182 2 660
Central case (People with mobility
needs) 0.0257 2.5070 6 661 4 140
Upper bound estimate (People with
mobility needs) 0.0332 3.2157 8 544 6 023
Source: CIE estimates
■ Many people who need help moving around their place of residence can remain at
home if their home has the necessary accessibility features. One possible
interpretation of the fact that some people are estimated to be in residential aged
care as a direct result of their need for assistance moving around their home is
that this is due to their residence lacking relevant accessibility features.
■ Under this interpretation, the additional people that are in residential aged care as
a result of their need for help moving around their place of residence can be
attributed to a lack of accessible housing.
■ This implies that between 2660 and 6023 additional people — with a central case
estimate of 4140 additional people — are in residential aged care as a result of
inaccessible housing.
Younger people in residential aged care
According to the COAG Disability Reform Council Quarterly report there were 5 468
people under the age of 65 living in residential aged care in the December quarter 2019.

www.TheCIE.com.au
328 Proposal to include minimum accessibility standards for housing in the National Construction Code
Some stakeholders believe it is inappropriate for anyone under the age of 65 to be in
residential aged care. According to the Royal Commission into the Quality and Safety of
Aged Care:
“For younger people with disability, their friends stop dropping by and rarely visit over time. It
is an isolating and daunting experience. It is not a life.”498
Minimising the number of younger people in residential aged care is an important focus
of the Australian Government.499 In March 2019, the Government announced it had
developed a national action plan that included a target of halving the number of younger
people under the age of 65 entering aged care by 2025. A new strategy to support this
target is currently being finalised.500
The number of people under the age of 65 in residential aged care (and new entrants
under the age of 65) has been declining over recent years as the number of NDIS
participants has increased (chart H.7).501
■ The number of residents under the age of 65 has decreased from 6 243 at 31 March
2017 to 5 468 at 30 September 2019, a 12 per cent decrease.
■ The number of new entrants into residential aged care under the age of 65 has
decreased from 536 in the June quarter 2017 to 386 in the September quarter 2019, a
decrease of around 28 per cent.
498 Royal Commission into Aged Care Quality and Safety 2019, Interim Report: Neglect, Volume 1,
October 2019, p. 4.
499 Department of Social Services website, https://www.dss.gov.au/disability-and-carers/programmes-
services/for-people-with-disability/younger-people-with-disability-in-residential-aged-care-initiative,
accessed 17 February 2020.
500 NDIA 2019, COAG Disability Reform Council Quarterly Report, December 2019, p. 27.
501 ibid, pp. 26-27.

www.TheCIE.com.au
Proposal to include minimum accessibility standards for housing in the National Construction Code 329
H.7 Number of people under the age of 65 in residential aged care
Data source: COAG Disability Reform Council Quarterly Report, December 2019, pp. 26-27.
The national action plan, Younger People in Residential Aged Care – Action Plan, notes
that younger people with disability often have complex health needs and identifies the
following reasons why younger people are living in aged care facilities:
■ difficulty in accessing appropriate health supports in other settings
■ the lack of suitable housing - the national action plan identifies a significant gap in the
market for highly specialised disability accommodation.
The national action plan also notes:
“Younger people with a disability have been directed to aged care due to a lack of suitable
alternative housing and supports. One support that may accommodate the needs of younger
people in aged care is SDA…[However, there] is currently a shortfall in the availability of SDA
for younger people who require this level of support. The SDA market is not yet mature, with
limited supply, lack of demand data for potential investors, and significant lead-time required
for construction of new stock.”502
Key elements of the national action plan are to:
■ improve the ability of younger NDIS participants in aged care to access SDA; and
■ to encourage the development of a vibrant SDA market.
It is therefore reasonable to expect that the number of younger people in residential aged
care will decline as the SDA market develops.
■ There are no data specifically on the number of younger people in residential aged
care that would have been able to remain living in the community if more private
(non SDA) accessible housing were available.
■ In the absence of better information, similar shares as for older people, implied by
the modelling studies outlined above, are assumed. Under this assumption,
between 1.95 per cent and 3.22 per cent of younger people in residential aged
502 Australian Government, Younger People in Residential Aged Care – Action Plan, pp. 4-5.
0
1000
2000
3000
4000
5000
6000
7000
Jun-17 Sep-17 Dec-17 Mar-18 Jun-18 Sep-18 Dec-18 Mar-19 Jun-19 Sep-19 Dec-19
Nu
mb
er
Residents under 65 years in residential aged care
NDIA participants (under 65 years)

www.TheCIE.com.au
330 Proposal to include minimum accessibility standards for housing in the National Construction Code
care may have been able to live in the community if more accessible housing were
available, with a central case estimate of 2.51 per cent.
■ Based on 5 468 younger Australians currently in residential aged care (as at
September 2019) this implies between 107 and 176 of these people may have
been able to live in the community if more accessible housing were available, with
a central case estimate of 137.
Impact of inappropriate or premature entry into residential aged
care
The impact of inappropriate or premature or inappropriate entry into residential aged
care incudes:
■ reduced wellbeing for those people inappropriately or prematurely entering residential
aged care
■ additional financial costs associated with residential aged care (relative to other care
models).
Reduced wellbeing for premature or inappropriate entrants
As noted above, residential aged care is not the preferred outcome for many older
Australians (as well as younger people that are admitted to residential aged care). The
ongoing Royal Commission into Aged Care Quality and Safety (see box H.8) noted that:
“People do not usually enter aged care willingly. They often do so with great trepidation. They
fear loss of autonomy, of individuality, of control over their own lives.”503
H.8 Royal Commission into Aged Care Quality and Safety
A Royal Commission into Aged Care Quality and Safety was established on
8 October 2018. The Royal Commission has gathered evidence through a range of
methods including: public hearings; notices requiring the production of documents,
things, information or statements in writing; public submissions; community forums;
expert roundtable discussions; service visits; and research conducted by both the
Royal Commission staff and commissioned from external providers.
The Commissioners delivered an interim on 31 October 2019 a will provide a final
report by 26 February 2021.504.
503 Royal Commission into Aged Care Quality and Safety 2019, Interim Report: Neglect, Volume 1,
October 2019, p. 4.
504 Royal Commission into Aged Care Quality and Safety website,
https://agedcare.royalcommission.gov.au/Pages/default.aspx, accessed 23 December 2020.

www.TheCIE.com.au
Proposal to include minimum accessibility standards for housing in the National Construction Code 331
The wellbeing of people in residential aged care (relative to remaining at home) is likely
to be at least partly related to the quality of the care received. In the interim report of the
Royal Commission, the Commissioners stated:
“The Royal Commission has heard compelling evidence that the system designed to care for
older Australians is woefully inadequate. Many people receiving aged care services have their
basic human rights denied. Their dignity is not respected and their identity is ignored. It most
certainly is not a full life. It is a shocking tale of neglect.”505
The Royal Commission concluded that sub-standard care (care that does not meet
relevant quality standards or other legislative obligations, or which otherwise does not
meet community expectations) is widespread and is more serious than had been
anticipated.506 Discussions with the Disability Discrimination Commissioner also
highlighted that people in closed care systems are vulnerable to neglect, abuse and
exploitation.
It is reasonable to expect further reforms to address the safety and quality issues in
response to the Royal Commission’s recommendations (although the specific
recommendations are not yet known).
One study from AIHW on consumer experiences with residential aged care presents a
much more positive view of the quality of care provided in residential aged care
facilities.507 For most questions, more than 90 per cent of responses were positive,
although responses across all questions were slightly less positive for those with restricted
mobility. The responses for the remaining questions were mostly more than 80 per cent
positive. Responses from people with restricted mobility on ‘staff to talk to’ was the only
question with a positive response rate less than 80 per cent.
The findings of the Royal Commission suggest that there may nevertheless be a
significant number of people that receive sub-standard care. However, there is currently
no publicly available data from the Royal Commission on the proportion of residential
aged care users that have receive sub-standard care. The impact of inappropriate or
premature entry into residential aged care could be very high for people who receive
sub-standard care (and even higher for those that are the victim of violence or abuse).
CIE also notes recent aged care reforms, including:508
■ a new set of 8 Aged Care Quality Standards that became effective in July 2019
■ the establishment of the Aged Care Quality and Safety Commission to protect and
enhance the safety, health, well-being and quality of life of people receiving aged care.
That a significant number of people in residential aged care receive sub-standard care
(including instances of neglect, violence and abuse) is clearly an important issue.
However, this reflects current failings of the aged care system, rather than residential
505 Royal Commission into Aged Care Quality and Safety 2019, Interim Report: Neglect, Volume 1,
October 2019, p. 12.
506 ibid, p. 5.
507 Australian Institute of Health and Welfare, 2019, Consumers’ experience of residential aged
care Australia 2017-19, p. 30.
508 Australian Institute of Health and Welfare, 2019, op.cit., p. 1.

www.TheCIE.com.au
332 Proposal to include minimum accessibility standards for housing in the National Construction Code
aged care as a type of care. Changes to the NCC can address this issue only to the extent
that it may forestall some people entering residential aged care.
Furthermore, one would hope that the issues identified by the Royal Commission are
addressed in the years ahead. CIE has therefore not tried to specifically quantify the costs
associated with sub-standard care (although sub-standard care may be partly reflected in
the increased incidence of depression — see below).
That said, even if the quality of care is of an acceptable standard in all residential aged
care facilities, many older Australians in residential aged care would have preferred to
have remained at home if that were possible.
In the Consultation RIS, the loss of wellbeing associated with inappropriate or premature
entry into residential aged care, based on reported higher rates of depression among
permanent aged care residents relative to older Australians living in the community was
estimated.509 However, as acknowledged by the AIHW, this could reflect people in
residential aged care generally having more complex care needs.510
Since the Consultation RIS was completed, the Royal Commission released a report that
estimates the ‘willingness to pay’ a co-contribution to facilitate remaining in their own
home using a stated preference survey. This was interpreted as a ‘willingness to pay’ to
avoid moving into residential care.511 This is a more direct estimate of the loss of
wellbeing associated with moving into residential aged care and is used in the RIS.
■ The average co-contribution amount respondents were willing to pay to avoid
moving into residential aged care was $184 per week, equating to $9 568 per
year. 512
Cost impact of inappropriate or premature entry into residential aged care
The cost impacts estimated below relate specifically to older people in residential aged
care. Cost impacts may be somewhat different for younger people, reflecting the different
services available to different age groups and possibly some other impacts. However,
younger people make up a relatively small share of the total.
Government subsidies associated with residential aged care are significantly higher than
other types of care.
■ AIHW reports that the average annual Australian Government subsidy per client for
residential aged care was estimated at $69 114 in 2018-19.
■ By contrast, the average cost for Home Care is around $23 140 in 2018-19.
509 Australian Institute of Health and Welfare 2013, Depression in residential aged care
2008-2012, Aged Care Statistics Series Number 39, p. 6.
510 Australian Institute of Health and Welfare 2013, op.cit., p. 6.
511 Ratcliffe, J. Chen, G. Cleland, J. Kaambwa, B.Khadka, J. Hutchison, C. and Milte, R.
Australia’s aged care system: assessing the views and preferences of the general public for
quality of care and future funding: A research study for the Royal Commission into Aged Care
Quality and Safety, Research Paper 6, July 2020, p. 3.
512 ibid.

www.TheCIE.com.au
Proposal to include minimum accessibility standards for housing in the National Construction Code 333
However, this does not take into account client contributions. This could significantly
distort the relative cost of different types of care. Furthermore, if someone is
inappropriately or prematurely admitted into residential aged care, it is not clear:
■ what their care needs would be if they remained at home (i.e. it is not clear if they
would need a Home Care Package)
■ the extent to which residential aged care costs substitute for other costs or are
additional (for example, if a partner or other family members of the person
inappropriately or prematurely admitted into residential aged care remain in the
family home, accommodation-related costs in residential aged care are additional).
Estimating the additional resource costs of inappropriate or premature entry into
residential aged care is therefore not straightforward. It is estimated that these costs could
be around $33 645 per person per year (table H.9).
H.9 Estimated additional financial cost of residential aged care per person
Estimated additional costs
$ per person
Total annual cost of residential aged care per person 96 951a
Less: accommodation and daily living-related expenses 33 152 b
Less: Home care package 23 141 c
Less: Informal care 7 013
Additional cost of residential aged care 33 645
a See ACFA (2019, p. 77). b See ACFA (2019, p. 78). c Data published by AIHW.
Source: Aged Care Financing Authority, Seventh report on the Funding and Financing of the Aged Care Industry, July 2019, pp. 77-78;
AIHW, CIE.
The Aged Care Funding Authority reports that in 2017-18, total expenses per resident per
day in residential aged care is $265.62.513 This equates to $96 951 per year (based on 365
days).
Based on estimates from the University of Queensland for the Royal Commission, this is
below the efficient cost of meeting the highest level of quality currently available
(achieved by the top 11 per cent of facilities) for a small-sized facility (less than 30 beds),
but broadly consistent with meeting the current standard. It is, however, well above the
efficient cost of providing the highest level of quality currently available in a large facility
(table H.10).514
513 Aged Care Financing Authority 2019, Seventh report on the Funding and Financing of the Aged
Care Industry, July 2019, p. 77.
514 University of Queensland 2020, The cost of residential aged care, Royal Commission into Aged
Care Quality and Safety, Research Paper 9, August 2020, pp. 3-5.

www.TheCIE.com.au
334 Proposal to include minimum accessibility standards for housing in the National Construction Code
H.10 Efficient costs of residential aged care by level of quality
Quality level Small-sized facility
($ per bed day)
Larger facility ($ per
bed day)
Q1: Met all accreditation standards, had no issues or complaints,
higher customer experience rating, and a lower utilisation of high-risk
medicines (around 11 per cent of facilities)
274 235
Q2: Low failure of meeting accreditation standards, a moderate level
of customer experience ratings, potentially suboptimal use of high-
risk medicines and a low number of complaints and issues (78 per
cent of facilities)
267 224
Q3: Lower customer experience rating, a higher failure of meeting
accreditation standards, and higher number of complaints and issues
(11 per cent of facilities)
261 234
Source: University of Queensland, The cost of residential aged care, Royal Commission into Aged Care Quality and Safety, Research
Paper 9, August 2020, pp. 3-5.
The distribution across small and large facilities is not known, but on average, it seems
likely that current costs would be sufficient to provide the highest level of quality
currently available (assuming the facility operates efficiently). Nevertheless, the report
notes that if the Australian community and the Royal Commission aspire to achieve a
higher quality in the future than even the highest quality facilities have achieved
historically, funding levels may need to be much higher.515
The above estimate includes all costs associated with care, accommodation, food and
other daily living expenses. As some costs would have been incurred had the aged care
resident remained in their home, not all of these costs are additional. In the Consultation
RIS, it was assumed that accommodation and daily living expenses in residential aged
care (amounting to around $32 102 per year) would be broadly the same as at home.
One submission suggested that this may overstate the cost of staying at home because
family members may continue to live in the family home (implying that the residential
aged care costs are all additional); and it is unlikely that daily living costs are broadly the
same in a residential aged care facility as they are at home.
There is no data on the living arrangements of aged care residents prior to entering aged
care. It is therefore not known whether people entering aged care left other family
members living in the family home. The marital status of aged care residents may be a
reasonable (albeit imperfect) indicator of their living arrangements prior to entering aged
care.
■ Only around 20 per cent of aged care residents are married.516 This could suggest that
these aged care residents left their spouse living in the family home, implying that
residential aged care costs are all additional.
■ The remaining 80 per cent of aged care residents were mostly widowed (53 per cent),
single (10 per cent), divorced (7 per cent), had unknown marital status (7 per cent) or
515 University of Queensland, The cost of residential aged care, Royal Commission into Aged
Care Quality and Safety, Research Paper 9, August 2020, p. 5.
516 Borotkanics, R. Rowe, C. Georgious, A. Douglas, H. Makeham, M. and Westbrook, J. 2017,
Changes in the profile of Australians in 77 residential aged care facilities across New South
Wales and the Australian Capital Territory, Australian Health Review, 41, p. 615.

www.TheCIE.com.au
Proposal to include minimum accessibility standards for housing in the National Construction Code 335
were separated (2 per cent).517 This could suggest that these aged care residents came
from single person households, implying reduced accommodation costs at home will
offset accommodation costs in aged care and other related expenses (at least partly).
This information suggests that it is reasonable to assume that residential aged care costs
will be offset by reduced home-based accommodation and other expenses for most aged
care residents.
To test the assumption that accommodation and other daily expenses are broadly similar
in residential aged care and the home, CIE reviewed the available evidence on expenses
incurred by single person households over the age of 65. Based on the information
available, it is estimated that annual living expenses would be around $33 000 per year,
broadly consistent with the cost in residential aged care (table H.11).
■ Although many older Australians own their own home outright (i.e. are not paying
off a mortgage or paying rent), median rents are used as a proxy for accommodation
costs. The weighted average rent for a house across capital cities is around $443 per
week or around $23 052 per year.
■ The remaining expenses reflect only weekly living expenses that would be avoided by
living in residential aged care based on the ABS Household Expenditure Survey for a
single person household over the age of 65.518
H.11 Estimated annual expenses
Expenses Weekly expenses ($ per
week)
Annual expenses ($ per
year)
Rent 443 23 052
Food and non-alcoholic beverages 87 4 549
Rate payments 29 1 525
House and content insurance 14 718
Repairs and maintenance 16 837
Energy 25 1 323
Household consumables 22 1 148
Total 638 33 152
Source: ABS, Household Expenditure Survey, 2015-16, https://www.abs.gov.au/statistics/economy/finance/household-expenditure-
survey-australia-summary-results/latest-release#data-download, accessed 13 November 2020.
The remaining costs were as per the Consultation RIS.
■ It is assumed that someone entering residential aged care would have required home
support had they remained at home and accordingly $23 141 is subtracted based on
the average cost of a Home Care Package. Data from AIHW indicates that very few
people enter residential aged care without first using other aged care programs.
■ It is also assumed that people remaining in the home require some informal care.
These costs were estimated at around $7 000 per year based on:
517 ibid.
518 ABS website, https://www.abs.gov.au/statistics/economy/finance/household-expenditure-survey-
australia-summary-results/latest-release#data-download, accessed 13 November 2020.

www.TheCIE.com.au
336 Proposal to include minimum accessibility standards for housing in the National Construction Code
– an estimated 6.92 hours of informal care per week, based on the estimates from
Carnemolla and Bridge (2019)519, received by people in accessible homes
(although it is not clear whether these estimates are representative of the amount of
formal care provided to people at risk of entering residential aged care)
– consistent with CIE’s estimates of the cost of additional informal care, this is
valued at the average wage rate for an aged care worker of around $22.90 per hour.
519 Carnemolla, P. and Bridge, C. 2019, Housing Design and Community Care: How Home
Modifications Reduce Care Needs of Older People and People with Disability, International
Journal of Environmental Research and Public Health.

www.TheCIE.com.au
Proposal to include minimum accessibility standards for housing in the National Construction Code 337
I Quality of life impacts
Quantifying quality of life impacts through willingness to pay
The stated preference survey conducted for the Consultation RIS was used to estimate
the likely quality of life impacts, taking into consideration the double counting with other
elements of the size of problem identified and quantified separately.
WTP for accessible housing
A stated reference survey was conducted as part of the Consultation RIS of a
representative sample of 2 062 Australian households. See appendix K for more details in
the survey design and data analysis.
The survey included a component designed to estimate willingness to pay (WTP) for
accessibility features at the point of purchasing or renting a new home. Statistical models
were estimated using the full survey samples. Estimates of average WTP derived from
these models are reported in table I.1.
I.1 Average WTP for accessibility features
Accessibility feature Silver Gold
$ $
Getting in and out 1,050 1,050
Moving around indoors 813 1,230
Living with limited mobility on same level as an entrance 57 297
Minimal modification required for ageing in place 0 875
Total 1,919 3,451
Source: CIE.
Number of people with reduced quality of life due to inaccessible housing
The number of people who may be impacted by inaccessible housing is derived from
SDAC data.
People living in dwellings that have been modified to meet their accessibility needs are
excluded on the basis that their inclusion would risk double-counting (i.e. the cost of the
modifications have been included separately, and for those people the size of the problem
is about the cost of modifying their homes rather than the poor quality of life).
The accessibility features are helpful for people who have difficulty with one or more
relevant activities (i.e. mobility around the home, showering and bathing and toileting).
CIE therefore uses TableBuilder to identify the number of people that always require

www.TheCIE.com.au
338 Proposal to include minimum accessibility standards for housing in the National Construction Code
assistance with the activity, sometimes needs assistance, and do not need assistance but
have difficulties. Using this approach, it is estimated that around 554 400 people could
experience improved quality of life from accessible housing (table I.2).
I.2 Estimated number of people experiencing reduced quality of life
Number ('000)
Always needs assistance with mobility around dwelling, showering/bathing, or toileting 149.9
Sometimes needs assistance with showering and bathing, showering/bathing, or
toileting
171.7
Do not need assistance, but has difficulty 232.8
Total 554.4
Source: ABS, 2018 Survey of Disabilities, Ageing and Carers, TableBuilder, CIE.
Quantifying quality of life impacts
The stated preference survey and analysis are household based. Assuming that each
household has only one person with difficulties in these activities, it is estimated that the
total benefit of making their home accessible could be between $1.1 billion and $1.9
billion per year (table I.3).
I.3 Willingness to pay for accessible housing
Silver Gold
WTP ($ per year per household) 1,919.0 3,451.0
Number of households impacted ('000) a 554.4 554.4
Total impact ($ million) 1,063.9 1,913.2
a Assuming each household has only one family member having difficulty in moving about home, toileting or showering
Source: CIE estimates based on WTP survey and SDAC data
It should be noted that this estimate of WTP for accessible housing includes a range of
impacts which have been identified and quantified separately to avoid overlapping. For
example, as suggested by Dalton and Carter in their supplementary report, privately
borne costs and inconvenience (or disutility) such as costs associated with loneliness, care
related costs, home modifications and moving may overlap with the WTP estimates.520
These items amount to $1.6 billion and $1.9 billion per year (see table I.4), implying there
is no additional quality of life impact.
520 Dalton, A. and R. Carter 2020b, Economic advice prepared to assist with responses to the Consultation
Regulation Impact Statement on minimum accessibility standards for housing in the National
Construction Code: Supplementary information prepared for the Melbourne Disability Institute,
University of Melbourne and the Summer Foundation, p.4, in Melbourne Disability Institute and
Summer Foundation, Accessible Housing the Way Forward: Supplementary information provided to
the Australian Building Codes Board Consultation RIS.

www.TheCIE.com.au
Proposal to include minimum accessibility standards for housing in the National Construction Code 339
I.4 Private cost due to inaccessibility
Low Central High
$m $m $m
Costs associated with unable to visit 35.7 80.9 126.1
Home modification cost 599.6 599.6 599.6
Informal carer related costs 911.9 911.9 911.9
Cost of moving 81.5 161.9 242.3
Sub-total 1,628.8 1,754.4 1,879.98
Source: CIE.
Dalton and Carter (2020a, b) also argue that there is possibly no overlap between WTP
and the problem reduction approach. If no overlap is assumed, the above WTP estimate
could be viewed as a maximum upper bound measurement of the quality of life impact.
Quantifying quality of life impacts through QALYs
A common way that ‘quality of life’ changes are incorporated into economic analysis is
through estimating changes in quality-adjusted life years (QALYs). QALYs are
calculated by multiplying life years by an index of utility, also referred to as health-related
quality of life (HRQoL) or multi-attribute utility (MAU) instrument. Utility represents
the strength of a person’s preference for a health state on a scale from 0 (representing
death) to 1 (representing good health).521 There are various MAU instruments that have
been developed and validated for use with specific populations.
Various studies have established a qualitative link between accessible housing (mostly
based on home modifications, rather than universal design) and quality of life and
wellbeing. However, Carnemolla and Bridge (2016)522 is the only study identified that
directly measures the changes in the quality of life.
Carnemolla and Bridge (2016) used the same sample to estimate the change in care
received (see above). As such, the same caveats apply in relation to:
■ the representativeness of the sample for people with disability in the broader
community
■ the appropriateness of extrapolating the improvements in HRQoL achieved by home
modifications (which were specifically targeted at meeting the individual’s needs) to
universal housing design.
The recipients of home modifications completed a questionnaire to assess their current
HRQoL (i.e. after home modifications) and were also asked to recall their quality of life
before home modification. HRQoL was measured using the AQoL-4D instrument, one
521 Assessment of Quality of Life website, https://www.aqol.com.au/index.php/allfaqs, accessed 1
November 2020.
522 Carnemolla, P. 2015, Measuring non-shelter effects of housing design: A mixed-methods exploration of
home modifications, care-giving and health-related quality of life, PhD thesis, University of New
South Wales,
www.TheCIE.com.au
340 Proposal to include minimum accessibility standards for housing in the National Construction Code
of several Assessment of Quality of Life (AQoL) instruments developed by the Centre for
Health Economics and Monash University. AQoL-4D is the shortest AQoL instrument
(based on 12 questions) covering the following dimensions:523
■ Independent living (including: self-care, household tasks and mobility)
■ Relationships (including: friendships, isolation and family role)
■ Mental health (including: sleeping, worrying and pain)
■ Senses (including: seeing, hearing and communication).
AQoL-4D is based on Australian populations and has been validated for older
community-dwelling Australians.524
■ Carnemolla and Bridge (2016) found that on average, the home modifications
improved the AQoL-4D index from 0.30 to 0.42, an improvement of 0.12.
Note that despite the significant improvement in the AQoL-4D index, the quality of life
of the sample of home modification recipients remained well below the national average
and the average for the relevant age cohort.
Valuing quality of life improvements
There are different views on whether it is appropriate to monetise changes in HRQoL
based on changes in utility indexes. For example, the AQoL website argues that the
approaches used to convert life years or lives into dollar benefits (typically either the
‘human capital’ or ‘willingness to pay’ approach) are problematic.525
Nevertheless, the AQoL website acknowledges that in principle, a dollar value could be
attached to each QALY [derived from the AQoL instrument] for the purposes of
cost-benefit analysis.526 Furthermore, OBPR guidance material encourages these impacts
to be incorporated into cost-benefit analysis in RISs by assigning a monetary value to
lives lost and the impacts of injury, disease and disability.527
As discussed in appendix B, the Value of a Life Year (VLY) represents the value of a year
of life free of injury, disease and disability. OBPR recommends using VLY of $213 000 in
2019 dollars in RISs.528
523 Assessment of Quality of Life website, https://www.aqol.com.au/documents/charts/equation-aqol-
4d-structures.pdf, accessed 1 November 2020.
524 Carnemolla, P. 2015, Measuring non-shelter effects of housing design: A mixed-methods exploration of
home modifications, care-giving and health-related quality of life, A thesis in fulfilment of the
requirement for the degree of Doctor of Philosophy, Faculty of Built Environment, University
of New South Wales, pp. 83-84.
525 Assessment of Quality of Life website, https://www.aqol.com.au/index.php/allfaqs, accessed 1
November 2020.
526 ibid.
527 Australian Government, Office of Best Practice Regulation, Best Practice Regulation
Guidance Note: Value of statistical life, August 2019.
528 ibid.

www.TheCIE.com.au
Proposal to include minimum accessibility standards for housing in the National Construction Code 341
■ The above information implies that the quality of life impacts of living in
inaccessible housing could be valued at around $25 560 per person (i.e. 0.12 x
$213 000).
Using a VLY of $213 000 implies that each QALY is also valued at $213 000. It is
important to note that this is significantly higher than the benchmarks often used in cost
utility analysis.
Number of people with reduced quality of life due to inaccessible housing
As discussed previously, there is no definitive data on the number of people with reduced
quality of life because their housing does not meet their accessibility needs. The number
of people affected are therefore inferred from SDAC data.
Carnemolla (2015) suggested that the main improvement in the HRQoL of recipients of
home modifications was related to improved independence. This is also consistent with
Andrich et. al. (1998), which found that home modifications led to quality of life
improvements and attributed the direct cause to a reduction in care needed.529
It is therefore assumed that those most likely to be experiencing reduced HRQoL as a
result of living in housing that does not meet their accessibility needs are those currently
requiring assistance with either:
■ mobility around the home
■ showering and bathing
■ toileting.
It also seems likely that those most likely to be experiencing a significantly reduced
HRQoL due to their home not meeting their accessibility needs are those requiring the
most assistance. The focus is therefore on those always requiring assistance who live in
households. Those ‘sometimes requiring assistance’ and who “do not require assistance,
but have difficulty’ could also potentially experience lower quality of life if their home
does not meet their accessibility needs. However, the fact they do not always require
assistance suggests the dwelling itself has less of an impact on their independence.
People living in dwellings that have been modified to meet their needs have also been
excluded on the basis that their inclusion would risk double-counting (i.e. the cost of the
modifications have been included separately).
As some people require assistance with more than one relevant activity (i.e. mobility
around the home, showering and bathing and toileting), it is important to avoid
double-counting. TableBuilder was therefore used to identify the number of people that
always require assistance with each activity. Double-counting was avoided by then
subtracting those that would have been counted twice (i.e. those that always require
assistance with multiple relevant activities. Using this approach, there were around
147 500 always requiring assistance with either: mobility around the house, showering
and bathing or toileting (table I.5).
529 Carnemolla, P. 2015, op.cit., p. 67.

www.TheCIE.com.au
342 Proposal to include minimum accessibility standards for housing in the National Construction Code
I.5 Estimated number of people experiencing reduced quality of life
Number ('000)
Always needs assistance with mobility around dwelling 40.1
Always needs assistance with showering and bathing 51.0
Always needs assistance with toileting 122.5
Total (including double-counting) 213.6
Less: Always needs assistance with mobility and showering/bathing 24.9
Less: Always needs assistance with mobility and toileting 15.3
Less: Always needs assistance with showering/bathing and toileting 41.2
Add: Always needs assistance with mobility, showering/bathing and toileting 15.3
Total 147.5
Source: ABS, 2018 Survey of Disabilities, Ageing and Carers, TableBuilder, CIE.
Mental health impacts
As a cross check for the estimates of overall quality of life impacts, a separate estimate for
the mental health impacts of inaccessible housing, which is a component of the quality of
life impacts, is presented.
In their joint submission, the MDI and the Summer Foundation presented results from a
survey of people with disability and older people. The survey found different outcomes of
mental health and wellbeing between people living in accessible and inaccessible homes
(table I.6).
I.6 Mental health and wellbeing impacts of accessibility
Outcome People with low
support needs
living in
accessible home
People with low
support needs
living in
inaccessible home
People with high
support needs
living in
accessible home
People with high
support needs
living in
inaccessible home
Worsened (%) 15.6 50.0 16.6 71.7
No impact (%) 24.4 34.7 23.3 16.2
Improved (%) 60.0 15.3 60.1 12.1
Total (%) 100.0 100.0 100.0 100.0
Count (person) 45 176 163 414
Source: MDI and Summer Foundation submission, appendix 2, Table 19
The survey suggests that on average accessible housing could avoid worsening mental
health conditions for about 49 per cent of people with accessibility needs living in
inaccessible homes, or improve conditions for about 47 per cent of people.
It should be noted that the survey was not conducted based on random sampling and
thus the statistical inference (that is the representativeness and statistical significance)
could not be established. Moreover, the mental health outcome was a subjective,
qualitative assessment (that is worsening or improving) rather than a quantified
measurement.

www.TheCIE.com.au
Proposal to include minimum accessibility standards for housing in the National Construction Code 343
With these limitations in mind, the survey results may be used to calculate some
indicative impacts on mental health of inaccessible housing, with additional information
drawn from other sources.
To support this qualitative assessment of mental health situation, findings from
Carnemolla and Bridge (2016) is used. Carnemolla and Bridge (2016) found that the
mental health dimension of Assessment of Quality of Life (AQoL) index changed from
0.82 pre-home modification to 0.87 post-modification.530
Several studies suggest that the average mental health cost in Australia is around $4 000
per capita per year, for example:
■ A report commissioned by the Royal Australian & New Zealand College of
Psychiatrists (RANZCP) and the Australian Health Policy Collaboration estimated in
2014 that the cost of severe mental illness in Australia was $56.7 billion per year,
including the direct economic costs of severe mental illness arising from the use of
health and other services, as well as indirect costs due to lost productivity because
people are unable to work.531
■ In December 2016, the National Mental Health Commission stated that the cost of
mental ill-health in Australia each year was around $4 000 per person, or $60 billion
in total.532
■ The 2018 KPMG and Mental Health Australia report, Investing to Save, estimated that
mental ill-health in the workplace costs an average of $3 200 per employee with
mental illness, and up to $5 600 for employees with severe mental illness. Overall, it
was estimated that the cost of workplace mental ill-health in Australia was $12.8
billion in 2015–16.533
It is noted that some studies measure severe mental illness, implying that the average
mental health cost might be overstated for the general population. With this in mind, the
average mental health cost of $4 000 per person per year suggests the accessible housing
could avoid mental health costs of around $1 111 per person.534
530 Carnemolla, P. and C. Bridge 2016, ‘Accessible housing and health-related quality of life:
Measurements of wellbeing outcomes following home modification’, International Journal of
Architectural Research, 10(2), p.38-51. Table 3, p.46
531 Victoria Institute of Strategic Economic Studies 2016, The economic cost of serious mental illness
and comorbidities in Australia and New Zealand, report prepared for the Royal Australian & New
Zealand College of Psychiatrists and the Australian Health Policy Collaboration,
https://www.ranzcp.org/files/resources/reports/ranzcp-serious-mental-illness.aspx
532 The National Mental Health Commission 2016, Economics of Mental Health in Australia, 08
December 2016, https://www.mentalhealthcommission.gov.au/news/2016/december/economics-of-
mental-health-in-australia
533 KPMG and Mental Health Australia 2018, Investing to Save: The economic benefits for Australia of
investment in mental health reform, 1 May 2018, https://mhaustralia.org/publication/investing-save-
kpmg-and-mental-health-australia-report-may-2018
534 Using the change in mental health index in Carnemolla and Bridge (2016) study and the
average mental health cost: $4,000 x (0.87–0.82)/(1-0.82)

www.TheCIE.com.au
344 Proposal to include minimum accessibility standards for housing in the National Construction Code
It could be argued that people with disability and older Australians have worse mental
health conditions than the general Australian population, implying that the average
mental health cost for these people may be higher than $4 000 per year.
Compared to Australian norms, the AQoL for people with mobility disability and older
people in the Carnemolla and Bridge (2016) study is 0.30 and 0.42, respectively, before
and after home modification, which is significantly lower than the Australian population
norm (0.81) and other categories of people, for example:535
■ Australian population norm for age 70 to 79 (0.78)
■ Australian population with ‘Poor’ general mental health condition (0.35) and people
with 3 or more current mental health conditions (0.47), and
■ Australian population with ‘Poor’ general physical health condition (0.41) and people
with 3 or more current health conditions (0.59).
However, there is no data on the average mental health cost for people with mobility
disability and older Australians. One way is to scale the average mental health cost using
the mental health dimension of the AQoL score (uDmental health) for people with mobility
disability and older Australians and for the Australian population. The former could be
provided by the Carnemolla and Bridge (2016) study, but the latter is not available from
the Australian population norms study.
Another scaling could be to use the overall AQoL score for people with mobility
disability and older Australians and for the Australian population.
As mentioned above, the Australian population norm AQoL score is 0.81 and the AQoL
score for people with mobility disability and older Australians before home modification
is 0.30. The difference suggests that the average mental health cost could be as high as
$14 736.8 per year on average.536
This average mental health cost is certainly an overestimate for people with mobility
disability and older Australians as it is higher than the annual cost for most categories of
mental disorder except two – major depressive disorder ($15 700) and suicide attempt
($14 950).537 As shown in chart I.7, it is also higher than the average cost for people with
any mental disorder ($10 805).
It is therefore more reasonable to assume the average cost for people with mental health
disorders as the upper bound estimate of mental health cost for people with accessibility
needs. This suggests that the upper bound mental health impact of accessible housing is
$3 014 per year.
535 Hawthorne, G., S. Korn and J. Richardson 2013, ‘Population norms for the AQoL derived
from the 2007 Australian National Survey of Mental Health and Wellbeing’, Australian and
New Zealand Journal of Public Health, 37(1), p.7-16.
536 $4,000 * (1-0.30)/(1-0.81) = $14,736.8
537 McCallum, S.M., P.J. Batterham, A.L. Calear, M. Sunderland and N. Carragher 2019,
‘Reductions in quality of life and increased economic burden associated with mental disorders
in an Australian adult sample’, Australian Health Review, 2019, 43, p.644-652, Table 3.

www.TheCIE.com.au
Proposal to include minimum accessibility standards for housing in the National Construction Code 345
1.7 Annual mental health cost for different conditions
Note: AUD – alcohol use disorder; SUD – substance use disorder; PD – panic disorder; OCD – obsessive-compulsive disorder; ADHD –
attention deficit hyperactivity disorder; GAD – generalised anxiety disorder; SAD – social anxiety disorder; PTSD – post-traumatic stress
disorder; MDD – major depressive disorder; PwD – people with disability and OP – older people.
Data source: McCallum et al (2019), Table 3.
As discussed previously, there is no definitive data on the number of people with reduced
mental health and wellbeing because their housing does not meet their accessibility
needs. CIE therefore infers the number of people affected from SDAC data.
Carnemolla (2015) suggests that the main improvement in the HRQoL of recipients of
home modifications was related to improved independence. This is also consistent with
Andrich et. al. (1998), which found that home modifications led to quality of life
improvements and attributed the direct cause to a reduction in care needed.538
It is therefore assumed that those most likely to be experiencing poorer mental health and
wellbeing as a result of living in housing that does not meet their accessibility needs are
those currently requiring assistance with either:
■ mobility around the home
■ showering and bathing
■ toileting.
Specifically, it is assumed that those always requiring assistance in table I.2 have a higher
average mental health cost equivalent to the average of people with mental health
538 Carnemolla, P. 2015, Measuring non-shelter effects of housing design: A mixed-methods exploration of
home modifications, care-giving and health-related quality of life, PhD thesis, University of New
South Wales, p. 67.
0
2,000
4,000
6,000
8,000
10,000
12,000
14,000
16,000
18,000
AU
D
Au
str
alia
n
ave
rag
e
SU
D
PD
An
y d
iso
rde
r
OC
D
AD
HD
GA
D
SA
D
2 o
r m
ore
dis
ord
ers
Su
icid
al
Idea
tio
n
PT
SD
Sca
led
up
fo
r
Pw
D a
nd
OP
Su
icid
e
Att
em
pt
MD
D
An
nu
al
co
st
($/ye
ar)
Average for
people with
mental health
conditions
Australian
average

www.TheCIE.com.au
346 Proposal to include minimum accessibility standards for housing in the National Construction Code
conditions, while others (i.e. those ‘sometimes requiring assistance’ and ‘do not require
assistance, but have difficulty’) have a lower average mental health cost than the general
public.
With these assumptions, it is then estimated that the total mental health impact of
accessible housing is between $423.7 million and $440.9 million per year (table I.8).
I.8 Estimated mental health impact of accessible housing
Outcome Number of
People with
needs
Avoided
worsening
Gained
improvement
Difference in people with/without accessible housing
(%, %)
48.93 47.02
People sometimes need assistance or have difficulty
(person, $/person, $/person)
404,500 1,111 1,111
Subtotal of mental health impact for people
sometimes need assistance or have difficulty ($
million)
219.9 211.3
People always need assistance (person, $/person,
$/person
149,000 3,014 3,014
Subtotal of mental health impact for people always
need assistance ($ million)
221.0 212.4
Total mental health impact ($ million) 440.9 423.7
Source: CIE estimate.
The following qualification for these estimates should be noted:
■ These estimates are indicative as the data on which they are based are indirect and
subject to statistical scrutiny and the calculations are made through scaling and
adjustment, and
■ They tend to overestimate the impact because the average mental health cost for
people who always need assistance is assumed to be the same for people with mental
health conditions.

www.TheCIE.com.au
Proposal to include minimum accessibility standards for housing in the National Construction Code 347
J The impacts of accessible housing on employment
outcomes
This appendix focuses on the employment and productivity impacts of inaccessible
housing on people with mobility-related disability. The assessment of employment and
productivity impact on carers has been discussed in appendix C.
Employment outcomes for people with mobility-related disability
If people with mobility-related disability had the same employment outcomes as the
broader economy, there would have been around an additional 300 000 people employed
full-time and an additional 18 000 people employed part-time in 2018 (table J.1). The
lower employment rate for those with mobility limitation is mostly (around 95 per cent of
the total) related to lower participation rates, rather than the higher unemployment rate.
J.1 Potential increase in employment
Level of employment Actual
employment
outcomes for
people with
mobility
limitations
('000)
Hypothetical
scenario based
on same labour
market
outcomes as
the broader
community
('000)
Difference
('000)
Employed full-time 267.0 566.3 299.3
Employed part-time 232.8 250.5 17.7
Unemployed 63.5 47.1 - 16.4
Not in labour force 765.9 465.2 - 300.7
Total 1 329.2 1 329.2 0.0
Source: CIE estimates.
From a CBA perspective, the net benefits of additional employment would reflect the
value-added by the additional labour resources, less the opportunity cost of that
additional labour.
■ The value-added from the additional labour is likely to be reflected in wages. Average
weekly total cash earnings for all employees reported in the May 2018 release of the
ABS Employee Earnings and Hours publication converted to an annual rate is used as
an indicative estimate of wages.539
539 Data from 2018 was used to align with 2018 data used elsewhere. This is also the most recent
release of this publication.
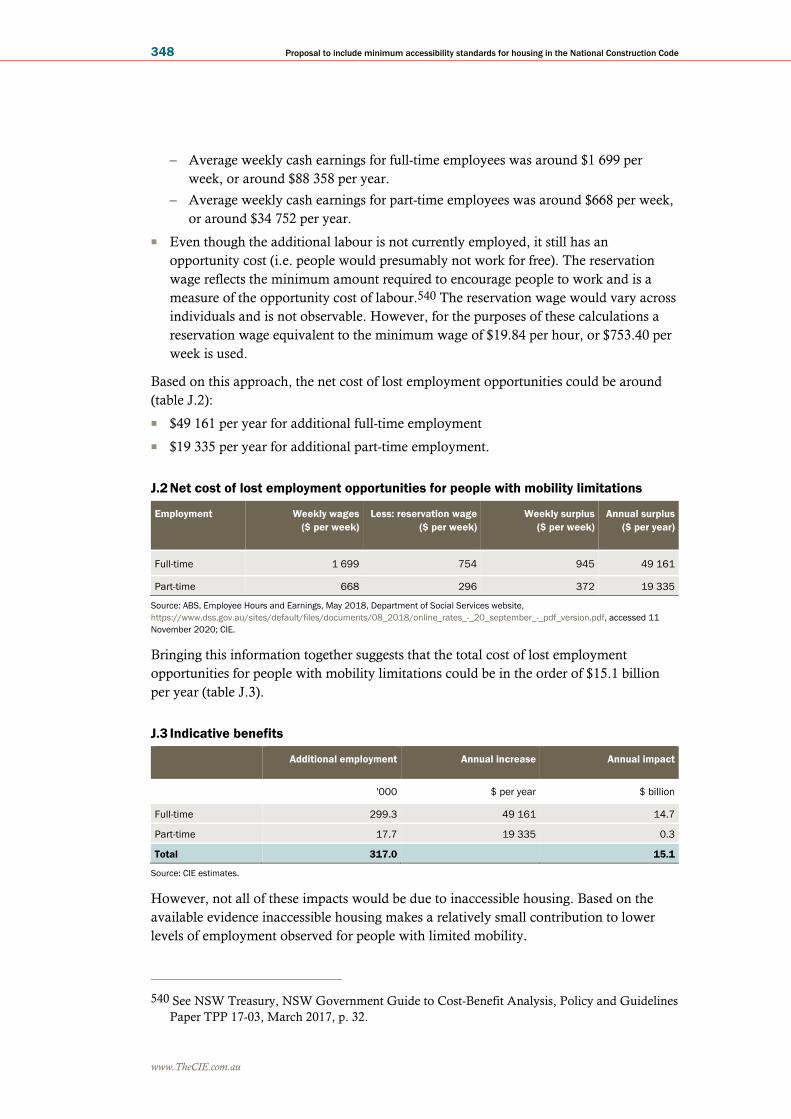
www.TheCIE.com.au
348 Proposal to include minimum accessibility standards for housing in the National Construction Code
– Average weekly cash earnings for full-time employees was around $1 699 per
week, or around $88 358 per year.
– Average weekly cash earnings for part-time employees was around $668 per week,
or around $34 752 per year.
■ Even though the additional labour is not currently employed, it still has an
opportunity cost (i.e. people would presumably not work for free). The reservation
wage reflects the minimum amount required to encourage people to work and is a
measure of the opportunity cost of labour.540 The reservation wage would vary across
individuals and is not observable. However, for the purposes of these calculations a
reservation wage equivalent to the minimum wage of $19.84 per hour, or $753.40 per
week is used.
Based on this approach, the net cost of lost employment opportunities could be around
(table J.2):
■ $49 161 per year for additional full-time employment
■ $19 335 per year for additional part-time employment.
J.2 Net cost of lost employment opportunities for people with mobility limitations
Employment Weekly wages
($ per week)
Less: reservation wage
($ per week)
Weekly surplus
($ per week)
Annual surplus
($ per year)
Full-time 1 699 754 945 49 161
Part-time 668 296 372 19 335
Source: ABS, Employee Hours and Earnings, May 2018, Department of Social Services website,
https://www.dss.gov.au/sites/default/files/documents/08_2018/online_rates_-_20_september_-_pdf_version.pdf, accessed 11
November 2020; CIE.
Bringing this information together suggests that the total cost of lost employment
opportunities for people with mobility limitations could be in the order of $15.1 billion
per year (table J.3).
J.3 Indicative benefits
Additional employment Annual increase Annual impact
'000 $ per year $ billion
Full-time 299.3 49 161 14.7
Part-time 17.7 19 335 0.3
Total 317.0 15.1
Source: CIE estimates.
However, not all of these impacts would be due to inaccessible housing. Based on the
available evidence inaccessible housing makes a relatively small contribution to lower
levels of employment observed for people with limited mobility.
540 See NSW Treasury, NSW Government Guide to Cost-Benefit Analysis, Policy and Guidelines
Paper TPP 17-03, March 2017, p. 32.

www.TheCIE.com.au
Proposal to include minimum accessibility standards for housing in the National Construction Code 349
Linkages between accessible housing and employment outcomes
As discussed in the Consultation RIS, there is limited evidence on the impacts of
accessible housing on employment outcomes. Several government reports note the
importance of housing to support employment and wellbeing and assist people on their
path to self-reliance.541 These comments have been generally made in relation to housing
assistance more generally, rather than specifically to accessible housing for people with
disability, although the observation is clearly as relevant to people with disability as it is
to recipients of housing assistance.
A submission542 referred to a paper by the London School of Economics, which reported
that “people with unmet need for accessible housing are estimated to be four times more
likely to be unemployed or not seeking work due to sickness/disability than disabled
people without needs or whose needs are being met”.543 This finding was based on
analysis of data from the English Housing Survey taking into account the following
characteristics: age, gender, type of impairment, household composition, educational
qualifications, savings and geographical region.
This finding suggests an association between accessible housing and employment
outcomes. However, this study does not establish whether unmet accessibility needs
causes poor employment outcomes (i.e. correlation is not causation). While it is possible
that a causative relationship does exist, there are also other plausible explanations as
follows.
■ The authors report that they held constant the type of impairment, household
composition, educational qualifications, savings and geographical region). However,
it is not clear whether they have been able to hold constant the severity of the
impairment with the data available. Someone with a more severe impairment may
have greater accessibility needs and therefore more likely to have unmet needs and
also may be less likely to be employed (i.e. more severe impairments may cause both
poor employment outcomes and unmet accessibility, rather than unmet accessibility
needs causing poor employment outcomes).
■ Alternatively, the causation may run the other way; people that are employed may be
better able to afford to meet their own accessibility needs (such as through
modifications) and therefore may be less likely to have unmet needs.
A submission from the MDI and Summer Foundation included a survey by Dr Wiesel. A
significantly higher proportion of respondents living in inaccessible housing indicated
541 See for example, Commonwealth of Australia, 2015, A New System for Better Employment and
Social Outcomes, Report of the Reference Group on Welfare Reform to the Minister for Social
Services, Final Report, p. 24.
542 Anonymous submission 284174932, accessed 13 November 2020,
https://consultation.abcb.gov.au/engagement/consult-ris-accessible-
housing/consultation/view_respondent?_b_index=60&uuId=284174932
543 Provan, B. Burchardt, T. and Suh, E. No Place Like Home, Quality of life and opportunity for
disabled people with accessible housing needs, London School of Economics and Political
Science and Centre for Analysis of Social Exclusion, CASE Report 109, p. 14.

www.TheCIE.com.au
350 Proposal to include minimum accessibility standards for housing in the National Construction Code
that housing design limited their ability to work, study and volunteer, compared with
respondents living in accessible housing (chart J.4).
J.4 Share of respondents indicating design of home limits ability to study and work
Data source: Wiesel, I. Lived experience and social, health and economic impacts of inaccessible housing, prepared for the Melbourne
Disability Institute, University of Melbourne and the Summer Foundation, 18 August 2020, as Appendix 2 of the submission by
Melbourne Disability Institute (MDI) and Summer Foundation. p. 21.
More than one-third of respondents indicated that a lack of accessible housing had:
prevented them from taking a job; reduced their hours of work; reduced their productivity
at work; or led to losing or giving up a job (table J.5).
J.5 Accessible housing and employment outcomes
Has a lack of accessible housing ever: Count Share of sample
(%)a
Prevented you from taking a job 160 16.9
Reduced your hours of work 168 17.7
Reduced your productivity at work 194 20.5
Led to losing or giving up a job 120 12.7
Total 327 34.5
a Presented as a share of the total sample, rather than the share of the subset of respondents that indicated a positive response to
one of the four questions as in the report.
Note: Based on a sample of 948 respondents with sufficient data.
Data source: Wiesel, I. Lived experience and social, health and economic impacts of inaccessible housing, prepared for the Melbourne
Disability Institute, University of Melbourne and the Summer Foundation, 18 August 2020, as Appendix 2 of the submission by
Melbourne Disability Institute (MDI) and Summer Foundation. p.21.
Although the survey evidence suggests a link between accessible housing and
employment outcomes, it is not clear what inferences on the broader population of
people with accessibility needs can be drawn from this survey evidence (see discussion in
chapter two).
The MDI and Summer Foundation submission identified four primary ways through
which housing design features can reduce productivity and work opportunities for people
with mobility restrictions.
0
10
20
30
40
50
60
70
Study (low support
needs)
Paid employment
(low support
needs)
Volunteer work
(low support needs
Study (high
support needs)
Paid employment
(high support
needs)
Volunteer work
(high support
needs)
Pe
r ce
nt
Accessible housing Inaccessible housing

www.TheCIE.com.au
Proposal to include minimum accessibility standards for housing in the National Construction Code 351
■ Housing design features can limit the ability of some people with disability to work
from home.
■ A lack of accessible housing limited the ability of some people with disability to move
closer to employment opportunities.
■ Fatigue from living in an inaccessible home and the additional time and energy spent
on self-care and homecare reduces productivity, motivation, self-confidence and
capacity to work, study and volunteer.
■ Inaccessible housing increases reliance on paid and unpaid support with personal and
domestic activities, limiting ability to take on employment.
These mechanisms broadly aligned with the qualitative evidence presented in the LSE
paper mentioned above.
Ability to work from home
With a greater proportion of the workforce working from home due to the COVID-19
pandemic, the ability to work from home has recently become a more important
consideration for many people.
The survey by Dr Wiesel suggested a link between accessible housing design and an
ability to work from home. In particular, a significantly higher share of people living in
inaccessible housing indicated that the design of their home limited their ability to work
from home, compared with people living in accessible housing (chart J.6).
J.6 Extent to which housing design limits ability to work from home
Data source: Wiesel, I. Lived experience and social, health and economic impacts of inaccessible housing, prepared for the Melbourne
Disability Institute, University of Melbourne and the Summer Foundation, 18 August 2020, as Appendix 2 of the submission by
Melbourne Disability Institute (MDI) and Summer Foundation.
A number of submissions provided insights into the lived experience of the challenges
that people with disability face in working from home (see box J.7). This evidence
suggests that some people with disability require additional space to enable them to work
0
10
20
30
40
50
60
Low support needs High support needs
Pe
r ce
nt
Accessible home Inaccessible home

www.TheCIE.com.au
352 Proposal to include minimum accessibility standards for housing in the National Construction Code
from home. Having insufficient space appears to have been a key barrier that has
prevented some people from working productively at home.
J.7 Lived experiences — ability to work from home
■ A case study from the Summer Foundation and Melbourne Disability Institute —
Jack’s story — provides evidence of housing features restricting the ability to work
from home. Jack lives in a group home that has been purpose built for people with
spinal injuries and is therefore fully accessible. Jack needs a high, adjustable table,
multiple computer screens, a microphone for dictation and adequate space for his
wheelchair to enable him to work from home. As his bedroom is too small, this is
set up in a shared space. Jack worries about the impact on his flatmates and is
looking at options to live on his own. However, he has not been able to find a SDA
home close to his workplace.544
■ Other comments on housing accessibility impacts on work and study include the
following.545
– Limited facilities to provide room for study materials, laptop etc.
– Study rooms not modified in any way.
– Lack of desk and physical space limits ability to work.
– Lack of space for ergonomic accessible work desk.
Although people with disability have faced challenges working from home, it is unclear
to what extent the design features covered by the NCC proposal would directly improve
the capacity to work from home. As discussed above, a lack of sufficient space appears to
have been a key barrier.
■ The NCC proposal does not explicitly provide for workspaces.
■ The NCC proposal requires additional space in some areas of a home, but generally
not the areas where people are working from home. In some cases, additional space
requirements in ‘functional areas’ of the house (such as bathrooms, hallways, kitchens
and laundries) could reduce the space available in the sorts of areas where people
work (such as living spaces and bedrooms), where the constraints of the lot (and
potentially planning restrictions) prevent the footprint of the dwelling expanding to
comply with the proposed NCC requirements.
Mobility constraints and location effects
The MDI and Summer Foundation identified the inability of people with limited
mobility to move closer to employment opportunities as one of the ways that a lack of
accessible housing contributes to poor employment outcomes.
544 Wiesel, I. Lived experience and social, health and economic impacts of inaccessible housing, prepared
for the Melbourne Disability Institute, University of Melbourne and the Summer Foundation,
18 August 2020, as Appendix 2 of the submission by Melbourne Disability Institute (MDI) and
Summer Foundation to the public consultation. p. 25.
545 Wiesel, I. op.cit., p. 23.

www.TheCIE.com.au
Proposal to include minimum accessibility standards for housing in the National Construction Code 353
There is qualitative evidence from submissions that a lack of accessible housing close to
work has restricted some people’s ability to work or the hours they have been able to
work. Box J.8 reports the lived experiences of people with disability associated with
finding accessible housing close to work.
J.8 Lived experiences — accessible housing close to work
■ One submission noted that living in a home with proper access reduces the time to
get ready and gives her more employment options further from home.546
■ One of the case studies from the Summer Foundation and Melbourne Disability
Institute — Andrea’s story — provides evidence of the location of housing that met
her accessibility needs restricting her ability to study or work. Andrea’s family was
forced to move home to meet her accessibility needs. However, their new home
was further away from public transport, which will restrict her ability to travel
independently to study or work.547
■ Respondents to the Melbourne Disability Institute survey identified a lack of
accessible housing close to employment opportunities as an issue affecting some
people with a disability. Reported comments included the following.548
“I chose a house that was accessible but when work relocated the drive was quite far.
Expensive by taxi but to find another accessible housing precluded a desire to move closer
to work”
“Due to a lack of even minimal accessible housing I have to spend all my disposable
income travelling to work in a taxi because no accommodation was closer”
“Location of houses a long distance away from my work, 1 hour for travel so I need to live
closer to the city where my work is. Not enough property close to work.”
“Having limited accessible housing available means it is not easy to find a suitable living
arrangement that is close to work, which causes me to have to travel long distances to my
parent’s home, limiting the number of hours I can work each week.”
“I found it hard to find housing without stairs very limited, as I have had a few falls from
being unsteady on my feet. Spent over two months not being able to work while looking for
accommodation.”
“I couldn’t take internships that would have been excellent because all rental housing was
either luxury or inaccessible.”
The Productivity Commission refers to the ability to move closer to employment as a
‘mobility constraint’ (albeit in the context of social housing).549 As illustrated in some of
the examples in box J.8, a corollary of the ‘mobility constraint’ is a ‘location effect’,
where some people with mobility impairments may not be located close to employment
opportunities. This also limits the ability of some people to work.
546 Jane Scott, op.cit.
547 Wiesel, I., op.cit., p. 19
548 Wiesel, I., op.cit., p. 24.
549 Productivity Commission, Housing Assistance and Employment in Australia, Productivity
Commission Research Paper — Volume 1: Chapters, April 2015, pp. 50-51.
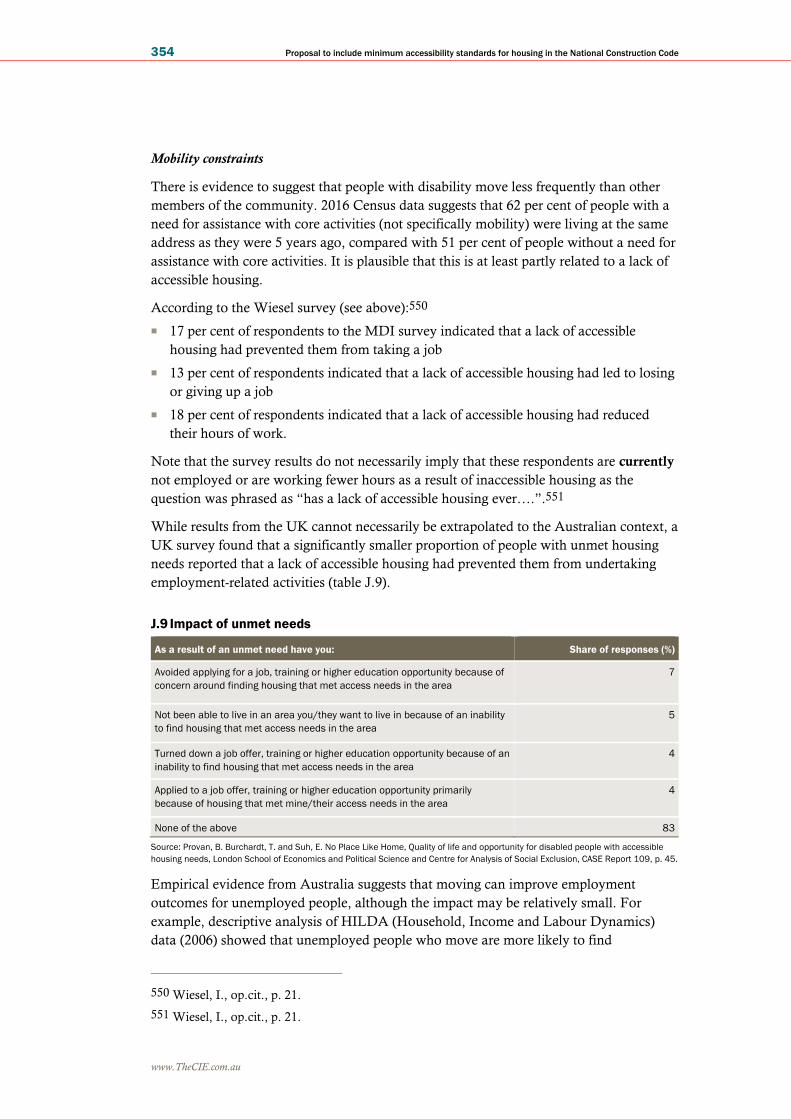
www.TheCIE.com.au
354 Proposal to include minimum accessibility standards for housing in the National Construction Code
Mobility constraints
There is evidence to suggest that people with disability move less frequently than other
members of the community. 2016 Census data suggests that 62 per cent of people with a
need for assistance with core activities (not specifically mobility) were living at the same
address as they were 5 years ago, compared with 51 per cent of people without a need for
assistance with core activities. It is plausible that this is at least partly related to a lack of
accessible housing.
According to the Wiesel survey (see above):550
■ 17 per cent of respondents to the MDI survey indicated that a lack of accessible
housing had prevented them from taking a job
■ 13 per cent of respondents indicated that a lack of accessible housing had led to losing
or giving up a job
■ 18 per cent of respondents indicated that a lack of accessible housing had reduced
their hours of work.
Note that the survey results do not necessarily imply that these respondents are currently
not employed or are working fewer hours as a result of inaccessible housing as the
question was phrased as “has a lack of accessible housing ever….”.551
While results from the UK cannot necessarily be extrapolated to the Australian context, a
UK survey found that a significantly smaller proportion of people with unmet housing
needs reported that a lack of accessible housing had prevented them from undertaking
employment-related activities (table J.9).
J.9 Impact of unmet needs
As a result of an unmet need have you: Share of responses (%)
Avoided applying for a job, training or higher education opportunity because of
concern around finding housing that met access needs in the area
7
Not been able to live in an area you/they want to live in because of an inability
to find housing that met access needs in the area
5
Turned down a job offer, training or higher education opportunity because of an
inability to find housing that met access needs in the area
4
Applied to a job offer, training or higher education opportunity primarily
because of housing that met mine/their access needs in the area
4
None of the above 83
Source: Provan, B. Burchardt, T. and Suh, E. No Place Like Home, Quality of life and opportunity for disabled people with accessible
housing needs, London School of Economics and Political Science and Centre for Analysis of Social Exclusion, CASE Report 109, p. 45.
Empirical evidence from Australia suggests that moving can improve employment
outcomes for unemployed people, although the impact may be relatively small. For
example, descriptive analysis of HILDA (Household, Income and Labour Dynamics)
data (2006) showed that unemployed people who move are more likely to find
550 Wiesel, I., op.cit., p. 21.
551 Wiesel, I., op.cit., p. 21.

www.TheCIE.com.au
Proposal to include minimum accessibility standards for housing in the National Construction Code 355
employment than unemployed persons who do not move (54.5 per cent of unemployed
people who moved found employment, compared with 48.7 per cent of unemployed
people who did not move).552 Bill and Mitchell (2006) found that moving is not
especially beneficial for the unemployed.553
It should also be noted that people looking for work (i.e. the unemployed) make up a
relatively small share of those with mobility-related disability that are not employed
(around 7.6 per cent). A much larger share does not participate in the labour market at
all.
Overall, it is plausible that a lack of accessible housing is making some contribution to
poorer employment among people with mobility limitation through the ‘mobility
constraint’. However, there is limited supporting evidence and the impacts are unlikely to
be large.
Location effects
Although there is qualitative evidence of people with mobility limitations having trouble
finding accessible housing close to employment opportunities (see box J.10 above), there
is little quantitative evidence. Furthermore, the evidence that is available suggests these
impacts are likely to be small.
Previous Productivity Commission research found little evidence of links between
location and employment, although this was a general finding, not specifically related to
people with mobility-related disability.554 It is possible that location effects have a more
significant impact on employment for people with mobility-related disability than for the
general community given the need for accessible transport.
The evidence from SDAC also suggests that location effects are unlikely to be significant.
According to 2018 data:
■ there were around 7 200 working age people with a mobility-related disability for
whom transport problems (or too far to travel) is given as a reason why they have
difficulty finding work (around 0.9 per cent of the working age people with mobility-
related disability who were not employed), and
■ transport problems (or too far to travel) was the main reason for having difficulty
finding work for around 1 500 people (0.2 per cent of the total number of working age
people with a mobility-related disability who were not employed).
If transport problems (or distance, e.g. too far to travel) are identified as the main reason
for having difficulty finding work, then the extent to which the NCC proposal would
552 Mitchell, W. Labour 2008, Mobility and Low-paid Workers, Report commissioned by the
Australian Fair Pay Commission, Centre for Full Employment and Equity, December 2008, p.
46.
553 Bill, A. and Mitchell, W. 2006, Great Expectations – migration and labour market outcomes in
Australia, Working Paper No. 06-08, Centre of Full Employment and Equity, University of
Newcastle, p. 24.
554 Productivity Commission, Housing Assistance and Employment in Australia, Productivity
Commission Research Paper — Volume 1: Chapters, April 2015, pp. 50-51.
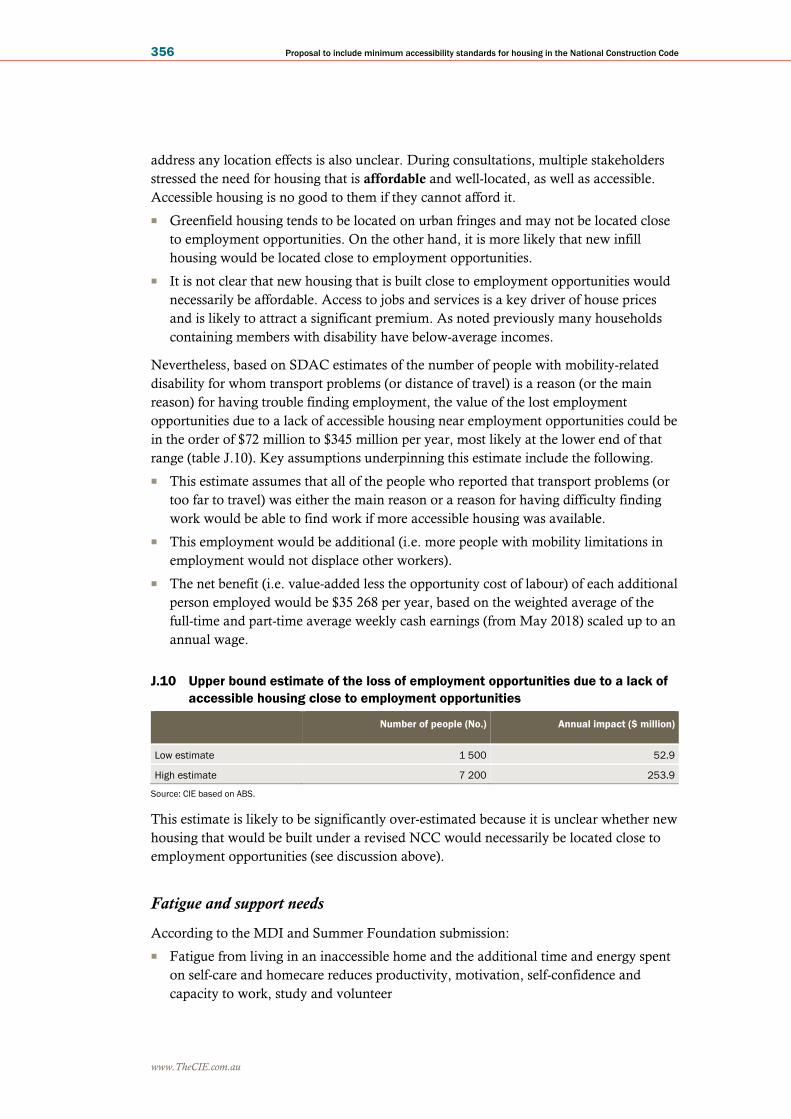
www.TheCIE.com.au
356 Proposal to include minimum accessibility standards for housing in the National Construction Code
address any location effects is also unclear. During consultations, multiple stakeholders
stressed the need for housing that is affordable and well-located, as well as accessible.
Accessible housing is no good to them if they cannot afford it.
■ Greenfield housing tends to be located on urban fringes and may not be located close
to employment opportunities. On the other hand, it is more likely that new infill
housing would be located close to employment opportunities.
■ It is not clear that new housing that is built close to employment opportunities would
necessarily be affordable. Access to jobs and services is a key driver of house prices
and is likely to attract a significant premium. As noted previously many households
containing members with disability have below-average incomes.
Nevertheless, based on SDAC estimates of the number of people with mobility-related
disability for whom transport problems (or distance of travel) is a reason (or the main
reason) for having trouble finding employment, the value of the lost employment
opportunities due to a lack of accessible housing near employment opportunities could be
in the order of $72 million to $345 million per year, most likely at the lower end of that
range (table J.10). Key assumptions underpinning this estimate include the following.
■ This estimate assumes that all of the people who reported that transport problems (or
too far to travel) was either the main reason or a reason for having difficulty finding
work would be able to find work if more accessible housing was available.
■ This employment would be additional (i.e. more people with mobility limitations in
employment would not displace other workers).
■ The net benefit (i.e. value-added less the opportunity cost of labour) of each additional
person employed would be $35 268 per year, based on the weighted average of the
full-time and part-time average weekly cash earnings (from May 2018) scaled up to an
annual wage.
J.10 Upper bound estimate of the loss of employment opportunities due to a lack of
accessible housing close to employment opportunities
Number of people (No.) Annual impact ($ million)
Low estimate 1 500 52.9
High estimate 7 200 253.9
Source: CIE based on ABS.
This estimate is likely to be significantly over-estimated because it is unclear whether new
housing that would be built under a revised NCC would necessarily be located close to
employment opportunities (see discussion above).
Fatigue and support needs
According to the MDI and Summer Foundation submission:
■ Fatigue from living in an inaccessible home and the additional time and energy spent
on self-care and homecare reduces productivity, motivation, self-confidence and
capacity to work, study and volunteer

www.TheCIE.com.au
Proposal to include minimum accessibility standards for housing in the National Construction Code 357
■ Inaccessible housing increases reliance on paid and unpaid support with personal and
domestic activities, limiting ability to take on employment.
This implies that these factors could potentially:
■ reduce the number of people with mobility limitations that are employed, and
■ reduce the productivity of those that are employed.
Submissions provided examples of the lived experience of people who were restricted in
their ability to work due to fatigue and/or support needs associated with living in
inaccessible housing or for whom living in inaccessible housing had affected their
productivity (box J.11).
J.11 Lived experiences — limitations on ability to work from inaccessible housing
■ A case study from the Summer Foundation and Melbourne Disability Institute —
Rowena’s story — provides evidence of housing features contributing to fatigue
and limiting her ability to work.555 Rowena suffers from chronic fatigue syndrome
and various features of her home sap her energy and limit her ability to work. The
features specifically referred to include:
– one flight of stairs at the entry/exit
– the height of shelves in the kitchen.
■ The submission from the Summer Foundation and Melbourne Disability Institute
also provides various relevant quotes from survey respondents that provide
evidence that inaccessible housing increases fatigue and limits the ability of some
people with disability to work.556
“Time and energy spent getting prepared for work can take an overall toll on energy left to
get to/from work and around the workplace.”
“When the house is inaccessible time it takes to access the shower and toilet prevented me
from taking on paid employment.”
“Suitable private rental housing was much further away from work/study so lost 2 hours a
week to travel time. Energy required to live/clean/cook/shower in rental housing that
didn’t meet my access needs meant I decided to work part-time (4 days a week). So I lost 1
day a week wages + associated superannuation, leave entitlements + missed promotion
opportunities at work due to being part time employee.”
“Accessibility directly affects my physical emotional and mental wellbeing and health. Bad
design means extra effort which means less capacity for work or study.”
“My apartment has incredibly limiting space in the bathroom in particular, and this has
meant that I have been late for things, especially when work was still in an office. The space
between the wall, my wheelchair and bed is narrow. My closet is largely inaccessible.
Getting ready for anything, but work especially, takes a long time.”
“The energy which navigating these stairs takes is something which I have to factor into
every day….That is not even considering the energy needed to cook dinner or perform
555 Wiesel, I., op.cit., p. 25.
556 Wiesel, I., op.cit., pp. 23-24.

www.TheCIE.com.au
358 Proposal to include minimum accessibility standards for housing in the National Construction Code
other typical household chores once I get inside after work. This takes a significant toll on
the extent to which I can be productive during a workday.”
Potential impacts on labour force participation
A low participation rate for working age people with limited mobility is the main factor
leading to low levels of employment. As shown in chapter three, the participation rate for
working age people with limited mobility is around 42 per cent, compared with
67 per cent among the broader community.
It is not clear to what extent inaccessible housing contributes to low participation rates
among working age people with limited mobility, compared with other barriers to
employment. According to the Australian Human Rights Commission, some possible
barriers Australians with disability may experience in gaining and keeping employment
include:557
■ discriminatory attitudes and behaviours during recruitment, and in the workplace,
from employers and others
■ low levels of awareness of rights at work
■ lack of availability of jobs
■ lack of assistance in finding, securing and maintaining employment
■ difficulty in accessing skills training and education
■ potential reduction or loss of the Disability Support Pension as a result of increased
employment
■ difficulty experienced in accessing flexible work arrangements
■ health issues
■ difficulty in negotiating reasonable adjustments/accommodation in the workplace
■ lack of availability of accessible transport, technology in the workplace and workplace
design.
SDAC provides data on specific employment restrictions and the reasons why people are
not looking for work; however, none of the restrictions/reasons given relate specifically
to housing (this in itself could be indicative that accessibility of housing may not be a
significant factor).
Nevertheless (as noted above), around 467 400 people are reported as being permanently
unable to work. It seems unlikely that more accessible housing would increase
participation in the labour force for this group of people.
Excluding people who are reported as being permanently unable to work, the
participation rate for working age people with limited mobility is close to the
participation rate for the broader community. This suggests that accessible housing is
unlikely to be having a significant impact on the participation rate.
557 Australian Human Rights Commission website, https://humanrights.gov.au/our-work/9-barriers-
employment, accessed 23 December 2020.

www.TheCIE.com.au
Proposal to include minimum accessibility standards for housing in the National Construction Code 359
Potential impacts on hours worked
SDAC data shows that a significantly higher share of those with limited mobility who are
employed work part time (around 47 per cent) relative to the broader population (around
31 per cent). If the proportion of people employed with limited mobility was consistent
with the broader population, there would be an additional 79 500 people working full-
time (table J.12).
J.12 Additional people that could potentially work full-time
Employment Actual number ('000) Implied number
based on proportions
in the broader
population ('000)
Difference ('000)
Full-time 267.0 346.5 79.5
Part-time 232.8 153.3 -79.5
Total 499.8 499.8 0.0
Source: CIE estimates.
Evidence on the number of people that have reduced their hours due to inaccessible
housing includes the following.
■ The Wiesel survey reported that around 18 per cent of respondents had reduced their
hours of work due to inaccessible housing. However, as noted above, this is likely to
be a significant over-estimate of the proportion of people for whom inaccessible
housing is currently reducing their hours of work for the following reasons.
– The survey asked whether inaccessible housing had ever reduced hours worked
(rather than whether inaccessible housing was currently reducing hours worked)
– The survey sample could potentially be biased towards people experiencing greater
accessibility problems due to the sampling method.
■ SDAC suggests that only around 12 per cent of people employed part-time with
limited mobility are not able to move around their place of residence without
difficulty (or assistance). This suggests a maximum of around 12 per cent may have
reduced their hours due to inaccessible housing. This implies up to 9 540 people may
have reduced their hours due to inaccessible housing
There is no clear evidence on the extent to which people reduced their hours of work due
to inaccessible housing. As a potential indicator of the impact of fatigue due to
inaccessible housing on the hours worked, CIE applies the difference between the net
surplus for a full-time worker and a part-time worker estimated above (around $29 826 —
see table J.2 above).
■ This information implies a net cost of people working fewer hours due to
inaccessible housing could be up to $284.5 million per year. This is based on:
– 9 540 working age people with limited mobility working fewer hours due to
inaccessible housing (based on 12 per cent of people with limited mobility who
work part-time but do not work full-time due to inaccessible housing — the
upper bound suggested by SDAC data); and
– a net cost of $29 826 per person.

www.TheCIE.com.au
360 Proposal to include minimum accessibility standards for housing in the National Construction Code
This is an indicative estimate only and is likely to be a significant over-estimate for the
following reasons.
■ As noted above, the assumed 12 per cent of working aged people with limited
mobility is likely to be an upper bound estimate.
■ The extent to which people reduced their hours due to inaccessible housing is not
known. CIE’s assumption implicitly assumed they reduced their hours from full-time
to less than half the time, which is likely to be the upper end of a plausible range.
Potential impact on productivity
As reported above, 20 per cent of respondents to the Wiesel survey reported that a lack of
accessible housing had reduced their productivity at work.558 This could potentially be a
significant over-estimate of the number of people currently experiencing reduced
productivity due to inaccessible housing because the survey question was phrased as:
“Has a lack of accessible housing ever…”. (and due to CIE’s concerns over the
representativeness of the survey sample).
According to the SDAC survey close to 90 per cent of employed people with mobility
limitation had no trouble moving around their place of residence. It seems unlikely that
home accessibility issues would be affecting work productivity of these people. This
leaves a maximum of around 11 per cent for whom a lack of accessible housing could
potentially be affecting their productivity at work.
With around 500 000 people with mobility limitation employed in 2018 (based on the
SDAC survey), this implies up to around 50 000 people for whom inaccessible housing is
hampering their productivity.
CIE is not aware of any quantitative evidence of the extent to which inaccessible housing
reduces productivity at work. For this reason, as an indicator of the potential scale of the
productivity impacts, CIE estimates the potential benefits of an assumed 10 per cent
productivity improvement. Note that there is no basis for this 10 per cent productivity
improvement so this estimate is indicative of the potential scale only.
Assuming that the value-added of the people with mobility limitation reflects average
weekly cash earnings for all rates of pay, this implies that:
■ The value-added of each affected full-time worker would be lower by around $8 836
per year (based on 10 per cent of the annual wage of $88 360)
■ The value-added of each affected part-time worker would be lower by around
$3 475 per year (based on 10 per cent of the annual part-time wage of $34 750)
This information suggests that the benefits of a 10 per cent productivity improvement
could be around $350 million per year (table J.13). However, this is likely to be an
over-estimate of the actual impacts for the following reasons:
558 Wiesel, I., op.cit., p. 21.

www.TheCIE.com.au
Proposal to include minimum accessibility standards for housing in the National Construction Code 361
■ 10 per cent is likely to be an implausibly large productivity impact given the fact that
the average labour productivity growth in Australia is around 2 per cent with the
highest being 5 per cent in 1998-99.559
■ 11 per cent of all employed people with a mobility limitation is likely to be an upper
bound estimate of the proportion of people for whom inaccessible housing is currently
reducing their productivity for the following reasons.
■ It is not clear that the features provided under the various NCC options would address
all of the fatigue issues currently being experienced. For example, those fatigue issues
experienced in Rowena’s case study in box J.11.
■ The features specifically referred to in Rowena’s case study may still be a feature of
many homes, even under the NCC proposal:
– Rowena’s case study refers to stairs being a feature that saps her energy. However,
many dwellings will still have internal stairs under the NCC proposal. Dwellings
that currently have a flight of stairs to the entrance (including apartments above the
ground floor in 3-storey walk-up blocks and houses on steeply sloping lots) are
likely to be exempt from the step-free access requirement.
– Rowena’s case study also refers to the height of shelves in the kitchen. However,
shelf height is not covered by the NCC proposal.
■ Another case study refers to features that drain the energy of someone with chronic
fatigue syndrome and limit her ability to work.560
J.13 Indicative estimate of the impact of a 10 per cent productivity improvement
Employment Number of people
employed ('000)
Estimated number with
lower productivity
('000)a
Impact of 10%
productivity
improvement
Total impact ($
million)
Full-time 267.0 29.4 8 836 259.5
Part-time 232.8 25.6 3 475 89.0
Total 499.8 55.0 348.5
a Based on 20 per cent of the total as implied by the Melbourne Disability Institute Survey.
Source: CIE estimates.
Interpretation of available evidence
Some submissions provided qualitative evidence that a lack of accessible housing may be
reducing employment opportunities and productivity for some working aged people with
limited mobility. The impact of accessible housing appears to be under-researched and
there is little specific quantitative evidence on the potential magnitude of these impacts.
559 ABS 2019, Estimates of Industry Multifactor Productivity: Updates estimates of multifactor productivity
(MFP) for the 16 industries defined to comprise the market sector from 1994-95,
https://www.abs.gov.au/statistics/industry/industry-overview/estimates-industry-multifactor-
productivity/latest-release
560 See the case study of domestic and work trade-offs for CFS sufferer in MDI and Summer
Foundation submission (p.20)

www.TheCIE.com.au
362 Proposal to include minimum accessibility standards for housing in the National Construction Code
As such, CIE was unable to estimate with any certainty the potential employment and
productivity impacts.
Submissions identified several ways that a lack of accessible housing could be leading to
relatively poor employment outcomes among working age people with mobility-related
disabilities, as well as reducing productivity.
■ Based on qualitative evidence presented in submissions, people with mobility
limitations appeared to face challenges working from home due mostly to limited
space. CIE was generally not convinced that the NCC proposal would materially
address this issue.
■ Qualitative evidence also suggested a lack of accessible housing close to employment
opportunities is another way inaccessible housing reduces employment. The objective
evidence available suggests that these impacts are likely to be relatively modest.
■ Finally, qualitative evidence provided in submissions suggests that fatigue and
additional care needs as a result of inaccessible housing features is reducing
productivity for some people with limited mobility.
Overall, and with the caveats above, these employment-related impacts could be quite
significant, possibly in the order of several hundred million dollars per year, suggesting a
similar magnitude to some of the other cost categories.

www.TheCIE.com.au
Proposal to include minimum accessibility standards for housing in the National Construction Code 363
K Willingness to pay survey method and results
Introduction
This stated preference study was undertaken for the Australian Building Codes Board
(ABCB) for the purpose of informing cost-benefit analysis (CBA) of options for
increasing the accessibility of residential buildings in Australia. CBA is a systematic
approach to weighing up the costs and benefits of alternative policy options in a common
metric. Key steps in a CBA of changes in the accessibility of residential buildings include
developing an understanding of the values placed by Australians on accessibility features
in their own home as well as altruistic values placed on improvements in outcomes for
people with limited mobility. These values, which correspond to the maximum amount
that individuals would be willing to pay for an improvement or the minimum amount
they would be willing to accept as compensation for a degradation, can be used to inform
estimates of the economic benefits of policy options as part of the CBA. The purpose of
this study is to estimate these values.
Professor Riccardo Scarpa from University of Waikato was engaged in a peer review role
to provide technical advice in relation to the survey method, estimation of willingness to
pay (WTP) and application of those estimates to the cost-benefit analysis. The approach
set out in this appendix was informed by Professor Scarpa’s advice.
Research method
Community preferences for accessible housing features are expressed at least to an extent
through their home purchasing and renting decisions. A lack of data on accessibility
features for past property sales means it is difficult to use these decisions to understand
preferences. Furthermore, these decisions may not reveal the community’s willingness to
pay for the provision of accessible housing features for other members of the community.
One approach to quantifying the values members of the community place on accessibility
features in their own home and in the wider housing stock is through a stated preference
survey designed to measure the WTP of different members of the community for
different outcomes. This is the approach taken in this study.
CIE conducted two choice exercises consecutively within the same questionnaire:
■ asking the respondent to imagine they are at the point of purchasing or renting their
next home and asking the respondent to choose between dwellings with differing
combinations of accessibility features at different prices/rents, and
■ asking the respondent to choose between sets of housing outcomes for people with
limited mobility generally.

www.TheCIE.com.au
364 Proposal to include minimum accessibility standards for housing in the National Construction Code
The former exercise used a choice modelling (also known as a conjoint analysis or
discrete choice experiment) approach. Under this technique, consumers respond to a
carefully constructed survey instrument designed to elicit preferences. The overall choice
modelling technique is well established in marketing and economic research fields. To
date, however, there has not been a comprehensive national choice modelling study of
demand for accessible housing in Australia that allows consideration of the policy issues
now at hand. This component of the study captures the net private benefits or costs of:
■ if the respondent has a person with limited mobility in their household, the
accessibility and useability of the dwelling
■ if the respondent does not have a person with limited mobility in their household, the
ability to remain in the home if someone in their household suffers from limited
mobility in the future
■ any disamenity from accessibility features, and
■ ability to entertain visits from friends and family with limited mobility.
The second exercise captures altruism and WTP for better outcomes for others. CIE used
a single ‘contingent valuation’ question for each respondent, offering an improved
accessible housing outcome at a specified increase in rates/taxes. The increases in
rates/taxes would be varied across respondents, allowing CIE to identify the distribution
of WTP across the population.
The survey instrument was designed to meet best-practice in stated preference research. It
comprised the following:
■ a welcome, with instructions and information about privacy
■ screening questions to ensure representative samples that exclude respondents with
potential conflicts of interest
■ questions about mobility limitations within the respondent’s household
■ factual information about accessibility features and questions about the accessibility
features of the respondent’s current home
■ questions about attitudes towards accessibility features
■ questions about the nature of the respondent’s next home
■ instructions about the choice questions
■ six discrete choice experiment (DCE) questions – discussed in further detail below
■ description of a proposed policy option and a ‘cheap talk’ script to limit hypothetical
bias by reminding respondents of the consequentiality of the survey and their budget
constraint
■ a contingent valuation (CV) question – discussed in further detail below
■ debriefing questions about the motivation behind and approach taken by the
respondent to the DCE and CV questions, and
■ further questions about the respondent’s characteristics.
The questionnaire was developed through several stages of review and testing, including:
■ review and input from the ABCB office and stakeholder consultations in response to
the questionnaire structure included in the Issues Paper, and

www.TheCIE.com.au
Proposal to include minimum accessibility standards for housing in the National Construction Code 365
■ a pilot wave of survey fieldwork.
Discrete choice experiment questions
There are several important decisions that must be made when designing a DCE. These
include:
■ the features or attributes to be included in the choice tasks and how those attributes
should be defined
■ the number of alternatives to be included in each choice task
■ the number of questions to be answered by each respondent
■ the levels that the attributes can take in the questions
■ the combinations of attribute levels in each question (that is, the experimental design),
and
■ the information, instructions and/or questions used to prepare respondents for the
choice.
Housing attributes
The attributes included in the DCE were:
■ Price/rent
■ Getting in and out
■ Moving around indoors
■ Living with limited mobility on same level as an entrance
■ Modification that would be needed to make home suitable for ageing in place
■ Total size of home compared to similar homes
■ Amount of space used for: corridors, bathroom, kitchen, laundry
■ Amount of space used for: living areas and bedrooms
These attributes were chosen to focus on the outcomes for people with or concerned
about limited mobility.
For respondents indicating they would be likely to buy their next home, the cost attribute
was defined as the purchase price. For other respondents, the cost attribute was defined
as the weekly rent.
Alternatives per task
Each DCE question comprised two alternative homes. Although decision making is often
reference-dependent, CIE decided against including the current home as a status quo
option, as it would introduce the added complication of the value placed on sentimental
attachment and avoided moving costs. These values, along with the fact that many
respondents consider a move within the next five years as unlikely, mean that a status
quo option would likely attract a large number of choices, which would detract from the
experiment’s ability to isolate the trade-offs respondents are willing to make between

www.TheCIE.com.au
366 Proposal to include minimum accessibility standards for housing in the National Construction Code
price and accessibility features. To isolate these trade-offs, the survey asked respondents
to imagine they were choosing between two homes at the point of their next home
purchase/rent decision. Feedback from pretesting indicated that larger choice tasks
involving three or more homes would be too complex.
Number of questions per respondent
The questionnaire included six choice tasks. The risk of respondents dropping out of self-
administered questionnaires increases with the number of choice tasks presented. The
number of respondents required to obtain statistically significant estimates of WTP
reduces with the number of choice tasks presented to each respondent. A sequence of six
choice tasks per respondent was judged to strike an appropriate balance between these
two considerations.
Attribute levels
The attribute levels used in the DCE questions are set out in table K.1. Prices/rents were
calculated using a reference price calculated as the midpoint of the price range that the
respondent indicated they would expect to pay for their next home. Most of the price
levels were designed below the reference price to ensure they lay within the respondent’s
budget constraint. In Wave 2 of the survey fieldwork, different price levels were used
depending on whether the respondent had indicated in a qualitative question they would
prefer a home with at least some accessibility features. Analysis of data from Wave 1
indicated that WTP varied considerably with the response to this qualitative question. To
improve the efficiency of the experimental design, this qualitative question was used as a
filtering question to allocate respondents to one of two different designs, each with price
levels that covered the range of WTP estimated from Wave 1 data for the best and worst
combinations of attribute levels.
K.1 Attribute levels used in discrete choice experiment
Attribute Levels
Price / Rent Wave 1:
Reference price/rent x 0.868, 0.884, 0.892, 0.896, 0.898, 0.899, 0.9,
0.901, 0.902, 0.904, 0.908, 0.916, 0.932, 0.964, 1.028
Wave 2:
Respondents indicating a preference for at least some accessibility
features:
Reference price/rent x 0.7, 0.85, 0.89, 0.897, 0.903, 0.91, 0.95, 1.1
Other respondents:
Reference price/rent x 0.902, 0.938, 0.947, 0.949, 0.951, 0.953,
0.962, 0.998
Getting in and out Several steps
Single step
Step-free
Moving around indoors Regular spaces – Suitable for some mobility aids
Wide spaces – Suitable for most mobility aids, but not wheelchairs

www.TheCIE.com.au
Proposal to include minimum accessibility standards for housing in the National Construction Code 367
Attribute Levels
Extra-wide spaces – Suitable for all mobility aids, including wheelchairs
Living with limited mobility on same
level as an entrance
Unsuitable – No toilet or shower on entry level
Suitable for short visits – Toilet, but no shower on entry level
Suitable for living or overnight visits – Toilet, shower and bedroom on
entry level
Modification that would be needed to
make home suitable for ageing in
place
Significant
Minimal
Total size of home compared to similar
homes
Same
5% larger
Amount of space used for: Corridors,
bathroom, kitchen, laundry
40%
45%
50%
Amount of space used for: Living areas
and bedrooms
Calculated as 100% minus the level for the attribute above
Source: CIE.
Experimental design
To conduct a DCE, the analyst needs to assign combinations of attribute levels to the
various alternatives and questions. These combinations are referred to as the
experimental design. The experimental design has a direct impact on the statistical
significance of estimates of WTP. If some information about preferences is known, it is
possible to generate an experimental design that can elicit statistically significant
estimates of WTP from a smaller number of respondents than a randomly generated
design.
The experimental design used in the first wave of fieldwork comprised two separate four-
block designs – one in which the ‘total size of home’ attribute was held constant across
alternatives and one in which it was not. This approach was taken for the initial design to
manage risks raised in pretesting that the total size attribute would dominate the choice
decision process.
Information on preferences gathered in the first wave of fieldwork was used to generate a
design for the second and main wave of fieldwork. The approach minimised the
statistical confidence intervals around the estimates of WTP derived from responses to
the questions in the design.561
561 Two designs were combined for the main wave of fieldwork – one for blocks 1-8 and
another for blocks 9-16. The designs were generated to minimise D-error (Scarpa and Rose
2008). The prior parameter estimates used to generate the efficiency criteria were based on
estimates of WTP from basic multinomial logit models run on the data collected in the first
wave of fieldwork. Constraints were included in the design search to preclude illogical
alternatives and to set ranges for the number of times each attribute level could appear in the
design.

www.TheCIE.com.au
368 Proposal to include minimum accessibility standards for housing in the National Construction Code
The second and main wave of fieldwork used a design with 16 blocks of six questions,
with each respondent answering only one block assigned using least-fill logic. The reason
for using multiple blocks was to improve design efficiency and limit the impact of any
single choice task on the results.
K.2 Example of choice question
Source: CIE.
Contingent valuation question
Respondents were shown an accessibility standard, described in terms of the attributes
used in the DCE, and told that the proportion of the housing stock meeting this standard
is currently very low and is expected to remain low and that it is not enough to provide
accessible homes for all Australians with disability who use a mobility aid (around 5 per
cent of households). Respondents were also told:
As a result, some people with limited mobility have difficulty finding an accessible home and
instead live in unsuitable housing with a carer. This can lead to health risks from slips, trips and
falls and places extra demands on carers.
Some people with limited mobility also experience social isolation due to difficulty visiting
homes of friends and family.
Without additional government action, the proportion of housing in Australia that meets the
accessibility standard is expected to remain below 5%.
Governments have a range of ways to increase the amount of accessible housing, including
building regulations, incentives schemes, land-use planning and public housing. The share of
accessible housing could be increased to 15% of overall housing by 2035, which would greatly
improve the chances of Australians with limited mobility finding suitable homes.
However, this would come at a cost that would need to be covered by an increase in rates and
taxes.

www.TheCIE.com.au
Proposal to include minimum accessibility standards for housing in the National Construction Code 369
Respondents were then asked a closed-ended, dichotomous-choice contingent valuation
question, the form of which is shown in figure K.3. The cost level shown in the question
varied across respondents. In Wave 1 fieldwork, the cost levels were $5, $20, $50 and
$200. Analysis of Wave 1 data suggested there could be a ‘fat tail’ problem, with 17 per
cent (5 of 41) of respondents shown the $200 cost indicating they would definitely vote
for the policy. In Wave 2 fieldwork, the vector of levels was revised to $5, $20, $100 and
$500 to manage the risk of this problem. A certainty scale was used to mitigate yea-
saying bias in accordance with best-practice from the field of environmental valuation.
Reminders (a ‘cheap talk’ script) about consequentiality and budget constraints were
included to mitigate hypothetical bias.
K.3 Example of contingent valuation question
Source: CIE.
The cost attribute was defined as an ongoing payment to reflect the ongoing nature of the
costs involved in the policy options. The survey chose a broad payment vehicle of taxes
and rates. Alternative, more specific vehicles, such as an increase in the price of new
homes, were problematic since they are seen to be avoidable by significant proportions of
the population.
Debriefing
Respondents were asked, on a scale of 1 to 10, how much their decision was based on
outcomes for other people. The purpose of this question is to enable WTP to be scaled to
the altruism-only component to avoid double-counting with WTP for accessibility
features in the respondent’s own home.
Debriefing questions were also included on the reasons for their answer to the CV
question and the extent to which they believed the survey would affect government
action on accessible housing and on the rates and taxes they pay.

www.TheCIE.com.au
370 Proposal to include minimum accessibility standards for housing in the National Construction Code
The sample
Recruitment
The fieldwork was conducted in December 2019 and January 2020. All respondents were
sampled through the Pureprofile online panel and were compensated for their time
through Pureprofile’s rewards system.
Overall, 2 062 respondents completed the questionnaire. There were 66 incomplete
responses. Other respondents were screened out because either:
■ they did not hold an Australian citizenship or permanent resident visa;
■ they or someone else in their household work for the Australian Building Codes
Board; or
■ the quotas for their age, gender or location categories had already been filled.
Quotas were set using Australian Bureau of Statistics data Cat. No. 3235.0 Table 3 and
Cat. No. 3101.0 Table 8.
Characteristics
The sample was representative of the national population of people aged 18 years and
over in terms of age, gender and location. People speaking languages other than English
at home and the highest-income households were under-represented, while households
with income in the range $78 000 to $104 000 per year were over-represented. CIE used
raking to generate poststratification weights based on the language, income and age
characteristics of the target population. The reweighted sample characteristics are very
close to those of the target population, which provides confidence that results can be
generalised to the population.
K.4 Characteristics of sample, reweighted sample and target population
Indicator/Question Item/Answer Sample No.
(No.)
Sample
(per cent)
Reweighted
sample
(per cent)
Target
population
(per cent)
Survey duration Median (minutes) 10.77
Wave of fieldwork Wave 1 163
Wave of fieldwork Wave 2 1 899
Age 18 to 19 years 64 3.1% 3.2% 3.2%
Age 20 to 29 years 373 18.1% 18.6% 18.6%
Age 30 to 39 years 397 19.3% 18.5% 18.5%
Age 40 to 49 years 320 15.5% 16.8% 16.8%
Age 50 to 59 years 326 15.8% 15.8% 15.7%
Age 60 to 69 years 282 13.7% 13.2% 13.2%
Age 70 to 79 years 199 9.7% 8.8% 8.8%
Age 80 years or over 101 4.9% 5.1% 5.1%
Gender Male 1 043 50.6% 50.6% 49.6%

www.TheCIE.com.au
Proposal to include minimum accessibility standards for housing in the National Construction Code 371
Indicator/Question Item/Answer Sample No.
(No.)
Sample
(per cent)
Reweighted
sample
(per cent)
Target
population
(per cent)
Gender Female 1 009 48.9% 49.0% 50.4%
Gender Non-binary 6 0.3% 0.2% 0.0%
Gender Prefer not to say 4 0.2% 0.2% 0.0%
Location NSW Metro 425 20.6% 22.1% 20.9%
Location VIC Metro 407 19.7% 21.3% 19.9%
Location QLD Metro 202 9.8% 9.9% 9.9%
Location SA Metro 120 5.8% 5.4% 5.4%
Location WA Metro 175 8.5% 8.4% 8.2%
Location TAS Metro 24 1.2% 0.9% 0.9%
Location ACT Metro 36 1.7% 1.8% 1.7%
Location NT Metro 6 0.3% 0.3% 0.6%
Location NSW Regional 233 11.3% 10.0% 11.0%
Location VIC Regional 125 6.1% 6.0% 6.0%
Location QLD Regional 214 10.4% 9.6% 10.2%
Location SA Regional 34 1.6% 1.6% 1.6%
Location WA Regional 32 1.6% 1.4% 2.1%
Location TAS Regional 26 1.3% 1.2% 1.2%
Location ACT Regional
0.0% 0.0% 0.0%
Location NT Regional 2 0.1% 0.1% 0.4%
Language other than
English spoken at
home?
No, English only 1 763 85.5% 72.7% 72.7%
Language other than
English spoken at
home?
Yes 299 14.5% 27.3% 27.3%
Tenure type Owned outright or with
a mortgage
1 355 65.7% 66.2% 67.3%
Tenure type Being rented or
occupied rent-free
678 32.9% 32.4% 31.8%
Tenure type Other (please specify) 29 1.4% 1.4% 1.0%
Household composition Couple/family without
children at home
667 32.3% 31.5% 27.0%
Household composition Couple/family with
children at home
612 29.7% 30.8% 31.9%
Household composition One parent family 124 6.0% 5.7% 11.3%
Household composition Group household 167 8.1% 8.0% 4.3%
Household composition Single person
household
426 20.7% 20.4% 24.4%
Household composition Cared accommodation
(e.g. nursing home,
aged care hostel)
5 0.2% 0.2%
Household composition Other 61 3.0% 3.4% 1.2%
Income Less than $41,600 per
year (less than $800
per week)
528 25.6% 27.3% 27.3%

www.TheCIE.com.au
372 Proposal to include minimum accessibility standards for housing in the National Construction Code
Indicator/Question Item/Answer Sample No.
(No.)
Sample
(per cent)
Reweighted
sample
(per cent)
Target
population
(per cent)
Income $41,600 - $78,000 per
year ($800 - $1,500
per week)
499 24.2% 22.1% 22.1%
Income $78,000 - $104,000
per year ($1,500 -
$2,000 per week)
353 17.1% 11.3% 11.3%
Income $104,000 - $156,000
per year ($2,000 -
$3,000 per week)
304 14.7% 16.0% 16.0%
Income More than $156,000
per year (more than
$3,000 per week)
186 9.0% 13.9% 13.9%
Income Do not wish to answer 192 9.3% 9.3%
a Sample characteristic is gender, whereas population characteristic is sex.
b Income is household income, except for respondents in group households or cared accommodation. In those cases, income is
personal income. Population targets are adjusted to account for this distinction and proportion of respondents not reporting income.
Source: CIE.
Roughly 30 per cent of respondents’ households included at least one person with
temporary or permanent mobility limitation.
K.5 Mobility limitation characteristics
Question Answer Reweighted sample
(per cent)
Q1 Yes, I have a temporary (fewer than 6 months) mobility limitation 4.6%
Q1 Yes, I have an ongoing mobility limitation 11.9%
Q1 Yes, another person in my household has a temporary (fewer than 6 months)
mobility limitation
6.5%
Q1 Yes, another person in my household has an ongoing mobility limitation 11.8%
Q1 No 69.5%
Q1 Prefer not to say 0.9%
Q2 Yes, I have a temporary (fewer than 6 months) personal care limitation 3.5%
Q2 Yes, I have an ongoing personal care limitation 8.7%
Q2 Yes, another person in my household has a temporary (fewer than 6 months)
personal care limitation
5.5%
Q2 Yes, another person in my household has an ongoing personal care limitation 9.2%
Q2 No 76.3%
Q2 Prefer not to say 1.2%
Q3 Cane 6.0%
Q3 Crutches 6.3%
Q3 Walking frame 9.1%
Q3 Walking stick 10.6%
Q3 Wheelchair (manual) 4.7%
Q3 Wheelchair (electric) 3.1%

www.TheCIE.com.au
Proposal to include minimum accessibility standards for housing in the National Construction Code 373
Question Answer Reweighted sample
(per cent)
Q3 Scooter/gopher 2.9%
Q3 Modified car or car aid 2.5%
Q3 Other 3.1%
Q3 None 3.3%
Q3 Prefer not to say 0.2%
Q4 Has no difficulty moving around with the use of a mobility aid, but cannot easily
walk 200 metres, cannot use stairs wit
12.4%
Q4 Has difficulty moving around, even with the use of a mobility aid, but doesn't
need assistance from a carer
8.1%
Q4 Sometimes needs assistance from a carer to move around, even with the use of
a mobility aid
6.3%
Q4 Always needs assistance from a carer to move around, even with the use of a
mobility aid
2.3%
Q4 Prefer not to say 0.4%
Q5 Yes 29.6%
Q5 No 63.8%
Q5 Unsure 6.6%
Note:
■ Q1: Does anybody in your household have difficulty, use aids or require assistance with moving around the home,
moving away from home, or getting into or out of a bed or chair?
■ Q2: Does anybody in your household have difficulty, use mobility aids or require assistance with personal care,
including tasks such as showering, bathing, dressing or eating?
■ Q3: Which aids, if any, are used by people in your household?
■ Q4: Thinking about the person in your household whose mobility is most limited, what is the extent of their mobility
limitation?
■ Q5: Do you have a family member or friend with limited mobility who visits you or would visit you if your home was
accessible?
Source: CIE.
Attitudes towards accessible housing
Around half of respondents indicated they considered accessibility to some extent when
choosing their current home and 70 per cent indicated they would prefer their next home
to have at least some accessibility features.
K.6 Attitudes towards accessible housing
Question Answer Reweighted sample
(per cent)
Q1 It was an important consideration 20.2%
Q1 It was a minor consideration 28.5%
Q1 I did not consider it at all 51.3%
Q2 Prefer homes with all accessibility features described in this survey 29.7%
Q2 Prefer homes with some accessibility features described in this survey 40.3%

www.TheCIE.com.au
374 Proposal to include minimum accessibility standards for housing in the National Construction Code
Question Answer Reweighted sample
(per cent)
Q2 Prefer homes without accessibility features 5.3%
Q2 Have no preference 24.8%
Q3 The ease of access and use now 36.7%
Q3 To avoid/delay the need to move later 33.3%
Q3 To receive visits from family and friends with limited mobility 23.7%
Q3 The look and feel of the features 13.1%
Q3 Other (please specify) 2.1%
Q4 I dislike the look and feel of the features 2.4%
Q4 I prefer larger living areas and bedrooms 2.1%
Q4 I prefer steeply sloped blocks 0.9%
Q4 Other (please specify) 0.1%
Note:
■ Q1: To what extent did you consider accessibility when choosing your current home?
■ Q2: If you were buying/renting a new home now, would you...
■ Q3: What is your main reason for preferring accessibility features?
■ Q4: What is your main reason for preferring homes without accessibility features?
Source: CIE.
Households containing someone with mobility limitation were more likely than other
households to prefer a home with all of the accessibility features described in the survey.
However, more than half of households that do not contain a person with mobility
limitation indicated they would prefer their next home to include at least some
accessibility features.
K.7 Preference for accessibility features by current mobility limitation status
Source: CIE.

www.TheCIE.com.au
Proposal to include minimum accessibility standards for housing in the National Construction Code 375
Characteristics of the existing housing stock
Most existing homes have a toilet (85 per cent) and a shower (75 per cent) on the same
level as an entrance. Around 80 per cent of homes have either no stairs or a straight
stairway. Other accessibility features are less common. A step-free entrance and a step-
free shower are both reported by around one third of respondents. Roughly one fifth of
respondents thought there would be sufficient space for turning a wheelchair in all
corridors, bathroom, kitchen and laundry spaces in their home. Around 13 per cent
thought that their door openings were wider than most other homes.
K.8 Accessibility features in the existing housing stock
Feature
question
Specification/Answer Reweighted sample
(per cent)
Q1 no steps between street/parking and the entrance 31.6%
Q1 a single step between street/parking and the entrance 34.1%
Q1 several steps between street/parking and the entrance 34.2%
Q2 door openings similar to other homes 82.1%
Q2 door openings wider than most other homes 12.6%
Q2 Don’t know 5.3%
Q3 All of these spaces are large enough 20.7%
Q3 Some of these spaces are large enough 54.3%
Q3 None of these spaces are large enough 20.4%
Q3 I can't make an educated guess 4.7%
Q4 Step-free shower entry 28.9%
Q4 Hob/kerb shower entry 36.1%
Q4 Stepped shower entry 24.8%
Q4 Shower over bath 13.9%
Q4 Don’t know 1.5%
Q5 Yes 84.8%
Q5 No 13.4%
Q5 Don’t know 1.7%
Q6 Yes 74.6%
Q6 No 23.2%
Q6 Don’t know 2.2%
Q7 Straight stairs 12.4%
Q7 Stairs with a half/quarter turn 17.7%
Q7 Curved/spiral stairs 4.4%
Q7 No stairs 67.6%
Note:
■ Q1: Path to entrance
■ Q2: Door opening width
■ Q3: Would you say your current home has enough space for turning a wheelchair in corridors, bathrooms, kitchen
and laundry? (If unsure, please make an educated guess)

www.TheCIE.com.au
376 Proposal to include minimum accessibility standards for housing in the National Construction Code
■ Q4: Shower entry
■ Q5: Does your current home have a toilet on the same level as an entrance?
■ Q6: Does your current home have a shower on the same level as an entrance?
■ Q7: Which type of indoor stairs, if any, does your current home have?
Source: CIE.
Willingness to pay for accessibility features in own home
In consultation with the peer reviewer, Professor Riccardo Scarpa, CIE tested a range of
models for different techniques and specifications, which were not ultimately used in the
final model, including:
■ Models estimated in WTP-space, which would not achieve convergence due to flat
log-likelihood functions
■ Mixed logit models, which did not appear to capture the bi-modal nature of the
distribution of preferences, despite the inclusion of interactions with respondent
characteristics to shift the means of random parameters
■ Interactions between the price variable and various thresholds related to the
respondent reference price and to price itself (a quadratic term), some of which were
significant but caused sign reversals and outliers when calculating WTP at an
individual respondent level
■ Pooling buyers and renters in the same model, with appropriate interaction terms,
which was abandoned given the likelihood of differences in scale between the two
groups
■ Interactions between the accessibility features, which tended to be insignificant,
noting that the ‘modifications’ feature is effectively an interaction indicating the
provision of all three of the other accessibility features in the model.
The choice questions included prices calculated as a function of the midpoint of the price
range in which the respondent indicated they would be shopping for a new home. To
overcome concerns about endogeneity, CIE used an instrumental variable. The price
variable included in the final model measures the prices shown in the choice options as a
proportion of the reference price midpoint predicted for each respondent using the
ordinary-least squares regressions shown in table K.9. The upper and lower bounds of the
95 per cent confidence intervals of the predictions were used to test sensitivity. CIE use
the upper bound in the central model as a conservative approach given the potential for
hypothetical bias to inflate WTP estimates.
K.9 Models for predicting respondent reference prices
Variable Renters
(Coef.)
Renter
(Z value)
Buyers
(Coef.)
Buyers
(Z value)
Age 2.09 4.17 -1 056 -1.31
Age squared -0.02 -4.46 22 2.75
NSW regional -47.58 -8.07 -273 329 -29.73
Victoria metropolitan -30.24 -5.75 -149 886 -20.27

www.TheCIE.com.au
Proposal to include minimum accessibility standards for housing in the National Construction Code 377
Variable Renters
(Coef.)
Renter
(Z value)
Buyers
(Coef.)
Buyers
(Z value)
Victoria regional -101.03 -13.69 -354 320 -30.83
Queensland metropolitan -57.34 -9.29 -272 443 -28.31
Queensland regional -51.56 -8.29 -321 848 -34.95
South Australia metropolitan -78.48 -9.56 -264 691 -24.43
South Australia regional -93.89 -7.47 -404 450 -20.16
Western Australia metropolitan -108.55 -15.28 -295 817 -31.45
Western Australia regional -95.10 -7.31 -397 572 -19.52
Tasmania metropolitan 1.67 0.10 -337 678 -15.59
Tasmania regional -119.77 -7.98 -490 538 -22.47
Australian Capital Territory -30.29 -2.33 -292 504 -15.84
Northern Territory -128.59 -6.46 -310 902 -6.57
Owner-occupier -59.38 -16.74 118 978 17.08
Detached dwelling 17.71 5.14 56 183 9.56
Couple with children 42.69 8.25 -10 756 -1.77
Single parent 3.80 0.57 -67 950 -5.28
Group household 6.40 1.07 6 048 0.50
Single person household -24.36 -5.16 -20 454 -2.74
Other household -32.45 -3.91 -45 962 -2.72
Income: $41,600 - $78,000 per year 62.85 14.80 79 840 10.14
Income: $78,000 - $104,000 per year 142.94 24.91 177 760 20.82
Income: $104,000 - $156,000 per year 103.74 15.35 260 590 29.12
Income: More than $156,000 per year 254.94 28.58 460 690 46.88
Income: Do not wish to answer 43.36 7.55 224 918 20.99
Constant 268.70 21.14 522 572 26.01
Model fit: Individuals 10 680
14 064
Model fit: R-squared 0.228
0.344
Note: Dependent variable in the renters model is the midpoint of the range in weekly rent indicated by the respondent. Dependent
variable in the buyer model is the midpoint of the range in purchase price indicated by the respondent.
Source: CIE.
The distribution of preferences for accessibility features across respondents appears to be
bi-modal, with some people liking the features and others being neutral towards or even
disliking the features. To capture this distribution, CIE use latent class multinomial logit
models, which estimate indirect utility functions for a user-specified number of classes
along with class membership probabilities.
CIE’s central models estimated on the full samples of buyers and renters respectively are
set out in table K.10 and table K.11. Respondents carefully considered the attributes
described in the questions, as evidenced by the relatively large Z values (a Z value of
around 2 indicates that at the 95 per cent confidence level one can say the coefficient is
statistically different from zero).
A high-level examination of the two classes suggests that Class 1 represents respondents
who prefer accessibility features and Class 2 represents respondents who do not. Class 2
is much more price sensitive and prefers a smaller share of floor space to be used for

www.TheCIE.com.au
378 Proposal to include minimum accessibility standards for housing in the National Construction Code
corridors, kitchen, bathroom and laundry. The average class probabilities are roughly 50-
50.
Consistent with CIE’s expectations, the class membership parameters indicate that older
respondents and respondents from households containing a person with a permanent
mobility limitation more likely hold Class 1 preferences.
K.10 Renter model of housing choice
Variable Class 1
(Coef.)
Class 1
(Z value)
Class 2
(Coef.)
Class 2
(Z value)
Price/rent as proportion of predicted reference value -0.9159 -1.69 -10.670 -8.15
Price/rent * low income (dummy =1 if household
income <$41 600 p.a.)
-1.7835 -2.60 -27.127 -3.10
Getting in and out: Single step (dummy) 0.6358 5.99 0.189 1.79
Getting in and out: Step-free (dummy) 1.0035 8.58 0.205 1.83
Moving around indoors: Wide spaces (dummy) 0.2412 3.27 0.208 2.54
Moving around indoors: Extra-wide spaces (dummy) 0.4389 4.92 0.092 1.00
Living on same level as entrance: Suitable for short
visits (dummy)
0.9266 10.72 0.082 0.87
Living on same level as entrance: Suitable for living or
overnight visits (dummy)
1.5161 11.04 -0.150 -1.31
Modification that would be needed: Minimal (dummy) 0.1840 0.87 0.404 1.91
Total size of home compared to similar homes: 5%
larger (dummy)
0.1104 1.89 0.093 1.46
Space used for corridors, bathroom, kitchen, laundry:
45% (dummy)
-0.0205 -0.27 -0.092 -1.12
Space used for corridors, bathroom, kitchen, laundry:
50% (dummy)
-0.0808 -1.02 -0.152 -1.75
Class membership parameters: Age (years) 0.0581 9.27
Class membership parameters: Household with
permanent mobility limitation (dummy)
1.1912 4.85
Class membership parameters: Constant -2.6752 -7.68
Model fit: Log likelihood -3229
Model fit: Choice observations 5334
Model fit: Individuals 889
Source: CIE.
K.11 Buyer model of housing choice
Variable Class 1
(Coef.)
Class 1
(Z value)
Class 2
(Coef.)
Class 2
(Z value)
Price/rent as proportion of predicted reference value -1.5597 -2.61 -5.320 -9.38
Price/rent * low income (dummy =1 if household
income <$41 600 p.a.)
-2.0394 -2.18 -5.388 -2.66
Getting in and out: Single step (dummy) 1.1819 8.83 0.123 1.53
Getting in and out: Step-free (dummy) 1.6405 10.99 0.270 3.14
Moving around indoors: Wide spaces (dummy) 0.3749 4.39 0.229 3.73

www.TheCIE.com.au
Proposal to include minimum accessibility standards for housing in the National Construction Code 379
Variable Class 1
(Coef.)
Class 1
(Z value)
Class 2
(Coef.)
Class 2
(Z value)
Moving around indoors: Extra-wide spaces (dummy) 0.5377 5.35 0.140 2.05
Living on same level as entrance: Suitable for short
visits (dummy)
1.4574 13.70 0.133 2.00
Living on same level as entrance: Suitable for living or
overnight visits (dummy)
2.6255 15.19 0.037 0.41
Modification that would be needed: Minimal (dummy) 0.4764 1.80 0.415 2.71
Total size of home compared to similar homes: 5%
larger (dummy)
0.1677 2.49 0.141 3.03
Space used for corridors, bathroom, kitchen, laundry:
45% (dummy)
-0.0225 -0.25 -0.135 -2.33
Space used for corridors, bathroom, kitchen, laundry:
50% (dummy)
0.0367 0.43 -0.195 -3.13
Class membership parameters: Age (years) 0.0594 10.48
Class membership parameters: Household with
permanent mobility limitation (dummy)
0.8085 3.92
Class membership parameters: Constant -2.9803 -9.67
Model fit: Log likelihood -4092
Model fit: Choice observations 7032
Model fit: Individuals 1172
Source: CIE.
Estimates of average WTP were derived from this model by calculating WTP at a
respondent level using unconditional class probabilities and taking a weighted average
accounting for the poststratification weights. The estimates from the models suggest that
buyers are willing to pay a higher proportion of housing costs for accessibility features
than are renters. The attributes that matter most to Australians are having amenities on
the same floor as an entrance (noting that this feature is present in most of the existing
housing stock) and a step-free entrance.
K.12 Average willingness to pay as a proportion of reference price
Change in housing features Renter
model
(per cent)
Buyer
model
(per cent)
Getting in and out: 'Several steps' to 'Single step' 8.2 18.9
Getting in and out: 'Several steps' to 'Step-free' 12.4 27.5
Moving around indoors: 'Regular space' to 'Wide spaces' 3.9 8.4
Moving around indoors: 'Regular space' to 'Extra-wide spaces' 5.5 9.7
Living on same level as entrance: 'Unsuitable' to 'Suitable for short visits' 10.9 23.1
Living on same level as entrance: 'Unsuitable' to 'Suitable for living or overnight visits' 16.2 39.0
Modification that would be needed: 'Significant' to 'Minimal' 4.4 12.3
Total size of home compared to similar homes: 'Same' to '5% larger' 1.8 4.3
Space used for corridors, bathroom, kitchen, laundry: 40% to 45% -0.8 -2.0
Space used for corridors, bathroom, kitchen, laundry: 40% to 50% -1.8 -1.9
Source: CIE.

www.TheCIE.com.au
380 Proposal to include minimum accessibility standards for housing in the National Construction Code
Estimates of WTP for accessibility features are higher than CIE’s prior expectations,
particularly for buyers (as distinct from renters). It is prudent to check the results against
reference points from real markets, particularly given the hypothetical and
inconsequential nature of the choice exercise and the fact that it focused on a relatively
small subset of features for a very high-priced and infrequently purchased good.
CIE checked the WTP estimates for owner-occupiers with estimated costs of retrofitting
the features. The WTP estimates for single step or step-free access, relative to several
steps, and the estimates for amenities at entrance level were significantly (in some cases,
an order of magnitude) higher than the estimated cost of retrofitting the features.
This result could be caused by:
■ respondents failing to consider the possibility of purchasing a home without these
features at a relatively low price and undertaking a retrofitting exercise
■ respondents over-estimating the costs of retrofitting
■ respondents rationally factoring in high non-financial costs of retrofitting associated
with time, emotional stress and risk, or
■ respondents over-stating their true WTP.
The home purchase choice appears more susceptible than rental home choice to potential
hypothetical bias, since it involves large sums of money and is a transaction that is
conducted infrequently. It is also linked to the enhanced social status associated with
home ownership. Home purchase decisions involve not only consideration of one’s own
use value, but also speculative expectation on capital gains, expectations about others’
preferences and future supply and demand and how those factors may impact on the
future sale price of the property. It is not possible for CIE to disentangle these
confounding effects on the implied value estimates.
For these reasons, CIE’s view is the renter model provides the best estimates of the use
value of the accessibility features because it is less confounded by other effects. CIE
derive use values for owner-occupiers from the renter estimation results by accounting for
the impact of demographic differences between owners and renters on both the reference
price and WTP as a proportion of the reference price. In particular, CIE calculate a
reference price for owner-occupiers by applying the rental reference price model to each
respondent’s characteristics and calculate unconditional class membership probabilities
(and WTP) using their age, mobility and income characteristics. Their WTP is estimated
to be higher than renters’ WTP because they tend to be older and shopping for more
expensive rental properties (an average reference price of $337 per week compared to
$307 per week).
The estimates of average use values for accessibility features for buyers and renters are
provided in table K.13. The table also provides estimates of the estimated values for
respondents in a household with at least one person with permanent mobility limitation.

www.TheCIE.com.au
Proposal to include minimum accessibility standards for housing in the National Construction Code 381
K.13 Estimates of average willingness to pay by tenure type and mobility status
Change in housing features Buyers
($ per
week)
Renters
($ per
week)
Buyers
with
mobility
limitation
($ per
week)
Renters
with
mobility
limitation
($ per
week)
Getting in and out: 'Several steps' to 'Single step' 32.63 25.22 42.96 39.74
Getting in and out: 'Several steps' to 'Step-free' 49.02 37.96 65.65 60.99
Moving around indoors: 'Regular space' to 'Wide spaces' 15.94 12.21 19.39 17.57
Moving around indoors: 'Regular space' to 'Extra-wide spaces' 21.51 16.66 28.78 26.73
Living on same level as entrance: 'Unsuitable' to 'Suitable for
short visits'
42.45 32.97 58.18 54.35
Living on same level as entrance: 'Unsuitable' to 'Suitable for
living or overnight visits'
62.01 48.42 88.72 83.72
Modification that would be needed: 'Significant' to 'Minimal' 18.59 14.08 20.39 17.90
Total size of home compared to similar homes: 'Same' to '5%
larger'
7.23 5.54 8.82 8.00
Space used for corridors, bathroom, kitchen, laundry: 40% to
45%
-3.30 -2.48 -3.33 -2.85
Space used for corridors, bathroom, kitchen, laundry: 40% to
50%
-7.49 -5.68 -8.36 -7.39
Source: CIE.
Willingness to pay to improve housing outcomes for others
Responses to the CV question resulted in a downward-sloping demand curve, with
around 37 per cent of respondents asked at the $5 cost level indicating they would
definitely vote for the policy, compared with 9 per cent of respondents asked at the $500
cost level.
K.14 Responses to contingent valuation question
Source: CIE.
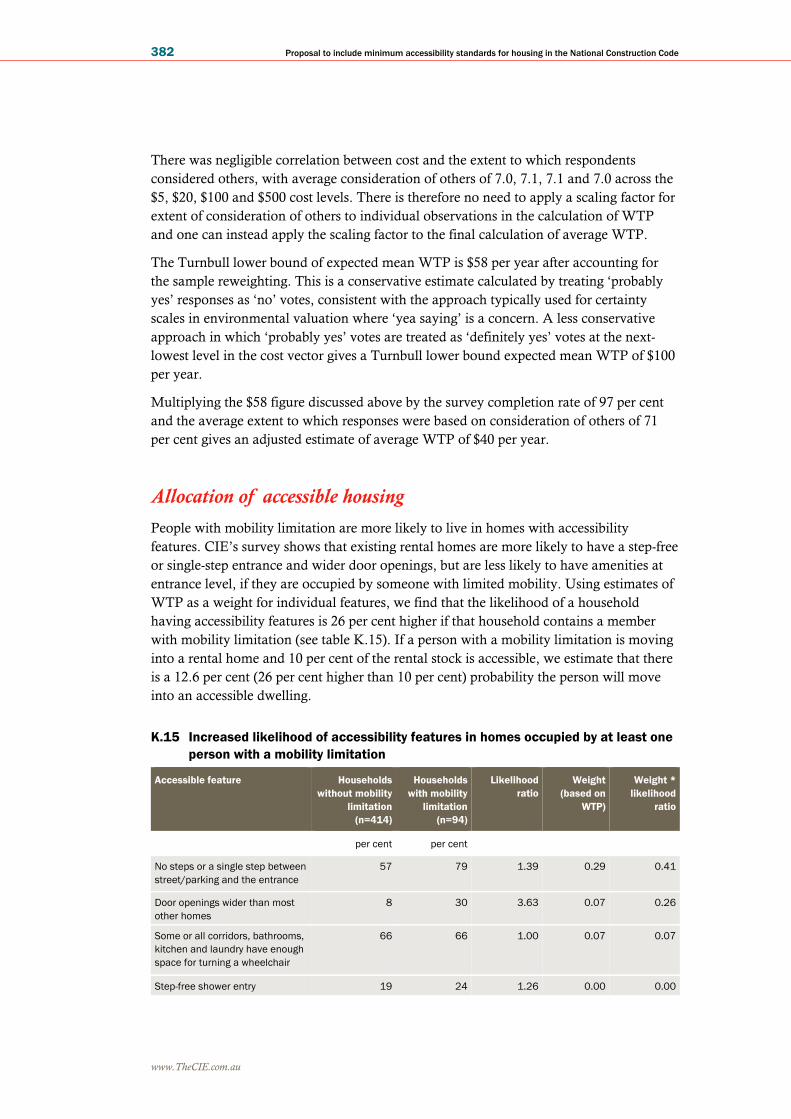
www.TheCIE.com.au
382 Proposal to include minimum accessibility standards for housing in the National Construction Code
There was negligible correlation between cost and the extent to which respondents
considered others, with average consideration of others of 7.0, 7.1, 7.1 and 7.0 across the
$5, $20, $100 and $500 cost levels. There is therefore no need to apply a scaling factor for
extent of consideration of others to individual observations in the calculation of WTP
and one can instead apply the scaling factor to the final calculation of average WTP.
The Turnbull lower bound of expected mean WTP is $58 per year after accounting for
the sample reweighting. This is a conservative estimate calculated by treating ‘probably
yes’ responses as ‘no’ votes, consistent with the approach typically used for certainty
scales in environmental valuation where ‘yea saying’ is a concern. A less conservative
approach in which ‘probably yes’ votes are treated as ‘definitely yes’ votes at the next-
lowest level in the cost vector gives a Turnbull lower bound expected mean WTP of $100
per year.
Multiplying the $58 figure discussed above by the survey completion rate of 97 per cent
and the average extent to which responses were based on consideration of others of 71
per cent gives an adjusted estimate of average WTP of $40 per year.
Allocation of accessible housing
People with mobility limitation are more likely to live in homes with accessibility
features. CIE’s survey shows that existing rental homes are more likely to have a step-free
or single-step entrance and wider door openings, but are less likely to have amenities at
entrance level, if they are occupied by someone with limited mobility. Using estimates of
WTP as a weight for individual features, we find that the likelihood of a household
having accessibility features is 26 per cent higher if that household contains a member
with mobility limitation (see table K.15). If a person with a mobility limitation is moving
into a rental home and 10 per cent of the rental stock is accessible, we estimate that there
is a 12.6 per cent (26 per cent higher than 10 per cent) probability the person will move
into an accessible dwelling.
K.15 Increased likelihood of accessibility features in homes occupied by at least one
person with a mobility limitation
Accessible feature Households
without mobility
limitation
(n=414)
Households
with mobility
limitation
(n=94)
Likelihood
ratio
Weight
(based on
WTP)
Weight *
likelihood
ratio
per cent per cent
No steps or a single step between
street/parking and the entrance
57 79 1.39 0.29 0.41
Door openings wider than most
other homes
8 30 3.63 0.07 0.26
Some or all corridors, bathrooms,
kitchen and laundry have enough
space for turning a wheelchair
66 66 1.00 0.07 0.07
Step-free shower entry 19 24 1.26 0.00 0.00

www.TheCIE.com.au
Proposal to include minimum accessibility standards for housing in the National Construction Code 383
Accessible feature Households
without mobility
limitation
(n=414)
Households
with mobility
limitation
(n=94)
Likelihood
ratio
Weight
(based on
WTP)
Weight *
likelihood
ratio
per cent per cent
Toilet on the same level as an
entrance
83 74 0.90 0.38 0.35
Shower on the same level as an
entrance
70 67 0.96 0.18 0.17
No indoor stairs or straight indoor
stairs
85 72 0.85 0.00 0.00
Total
1.00 1.26
Source: CIE.
Features provided in the baseline
In order to account for the accessibility features provided in the baseline, WTP for
different features under different options are weighted by the non-impact scenario
weightings assumed by DCWC (2020).
DCWC (2020) provides weightings of zero impact scenario for each accessible feature for
the following archetypes:
■ volume built house
■ custom built house
■ townhouse
■ three-storey or less apartment with walkups, and
■ apartments with four- or more storeys.
These archetypes account for 32 per cent, 24 per cent, 15 per cent, 2 per cent and 27 per
cent, respectively, of total new built dwellings. Applying these shares to the zero-impact
weightings of each feature for relevant archetypes gives the average shares of features
provided in the baseline (table K.16).
K.16 Average share of accessible features provided in the baseline
Accessible feature Silver
(%)
Gold
(%)
Gold+
(%)
Step free access path 45.1 28.2 28.2
Step free access to outdoor area 0.0 0.0 18.4
Dwelling entrance 26.1 6.2 6.2
Internal doors and corridors 20.0 2.8 2.8
Toilet 9.8 1.2 1.2
Shower 8.5 2.7 2.7
Reinforcement of bathroom and toilet walls 5.0 5.0 5.0
Internal stairways 0.0 1.5 1.5
Kitchen space 0.0 53.0 38.1

www.TheCIE.com.au
384 Proposal to include minimum accessibility standards for housing in the National Construction Code
Accessible feature Silver
(%)
Gold
(%)
Gold+
(%)
Laundry space 0.0 30.8 14.8
Space on entry level suitable for bedroom 0.0 0.0 0.0
Light switches 0.0 0.0 0.0
Door handles 0.0 0.0 0.0
Window sills 0.0 0.0 5.0
Source: CIE estimate based on DCWC weightings.
The WTP study has estimated WTP for some broader features – getting in and out,
moving around indoors, living on same level as entrance. The WTP for these broad
features are then mapped into the 13 proposed features in the NCC using the weighted
construction cost of providing each feature estimated by DCWC. Table K.17 presents the
average WTP ($ per week) for each of the accessible features.
K.17 Average WTP for accessible features
Accessible feature Silver
($/week)
Gold
($/week)
Gold+
($/week)
Step free access path 48.3 50.6 21.0
Step free access to outdoor area 0.0 0.0 37.5
Dwelling entrance 15.0 12.7 4.9
Internal doors and corridors 5.4 28.6 23.8
Toilet 9.0 32.3 26.3
Shower 1.5 29.2 23.8
Reinforcement of bathroom and toilet walls 2.5 4.2 3.4
Internal stairways 0.0 2.9 2.4
Kitchen space 0.0 9.6 18.0
Laundry space 0.0 7.3 14.4
Space on entry level suitable for bedroom 0.0 0.0 0.0
Light switches 0.0 0.0 0.0
Door handles 0.0 0.0 0.0
Window sills 0.0 0.0 1.9
Total 81.8 177.3 177.3
Source: CIE estimates.
Multiplying the shares in table K.16 by the average WTP in table K.17 and summing up,
gives the weighted average share of accessible features provided in the baseline:
■ 34.1 per cent of Silver features on average have been provided in the baseline
■ 13.9 per cent of Gold features on average have been provided in the baseline, and
■ 13.6 per cent of Gold+ features on average have been provided in the baseline.

www.TheCIE.com.au
Proposal to include minimum accessibility standards for housing in the National Construction Code 385
Debriefing questions
Respondents that did not indicate they would definitely or probably vote for the policy to
increase accessible housing were asked the reason for their decision. The most common
reasons given were that governments should deliver the outcomes without imposing a
cost on the respondent and a concern that governments may not deliver the outcomes.
There is a question as to whether the responses to the valuation question by these
respondents should be excluded as ‘protest responses’ that are not a true measure of the
respondent’s preferences over delivered outcomes. CIE prefers to retain these responses,
as excluding them may bias the results where there is correlation between underlying
WTP and mistrust of governments.
K.18 Reasons for not voting for the policy to increase accessible housing
Answer to question: What were the main reasons for your decision? Sample
reweighted
(per cent)
I would prefer to spend my money on something else 27.4%
The question was confusing 6.5%
I didn’t have enough information about the policy 21.5%
I’m concerned that governments might put taxes up without improving accessible housing 37.3%
I think governments should improve accessible housing without increasing taxes 41.5%
Other peoples’ housing should not be my problem 15.7%
Other (Please specify:) 6.3%
Source: CIE.
Roughly six in ten respondents believed the survey would be at least somewhat likely to
affect government action on accessible housing and the rates and taxes they pay. Models
run with and without the respondents that did not believe the survey would be
consequential did not find a dramatic difference in stated preferences. The estimated
mean WTP was slightly higher for respondents indicating they believed the survey would
be at least somewhat likely to affect the rates and taxes they pay.
K.19 Consequentiality of the survey
Question Answer Sample
reweighted
(per cent)
Q1 I believe it is very likely the survey will affect government action 13.3%
Q1 I believe it is somewhat likely the survey will affect government action 42.4%
Q1 I don’t think the survey will affect government action 44.3%
Q2 I believe it is very likely the survey will affect my rates and taxes 13.9%
Q2 I believe it is somewhat likely the survey will affect my rates and taxes 44.2%
Q2 I don’t think the survey will affect my rates and taxes 41.9%
Note:
■ Q1: To what degree do you expect the results of this survey will affect government action on accessible housing?
■ Q2: To what degree do you expect the results of this survey will affect your rates and taxes?
Source: CIE.

www.TheCIE.com.au
386 Proposal to include minimum accessibility standards for housing in the National Construction Code
Peer review of stated preference research
The expert peer reviewer of the survey method and data analysis, Professor Riccardo
Scarpa, provided the following statement on the research.
K.20 Expert statement from Professor Riccardo Scarpa


www.TheCIE.com.au
2 Proposal to include minimum accessibility standards for housing in the National Construction Code
THE CENTRE FOR INTERNATIONAL ECONOMICS
www.TheCIE.com.au