proposal to introduce a meps and alternative … · regulatory proposal. the cba and stakeholder...
TRANSCRIPT

Equipment Energy Effi ciency Committee
Cost-Benefi t Analysis
Proposal to Introduce aMinimum Energy Performance Standards and Alternative Strategies for Chillers
Discussion draft for stakeholder comment issued under the auspices of the Ministerial Council on Energy
Report No 2007/08
AUGUST 2007
Prepared by EnergyConsult for AGO

E3 Committee CBA: MEPS and Alternative Strategies for Chillers August 2007
This Cost-Benefit Analysis was prepared by EnergyConsult Pty Ltd for the Australian Greenhouse Office, representing the Equipment Energy Efficiency Committee (E3 Committee) under the Ministerial Council on Energy of the Australian federal, state and territory governments and the New Zealand Government.
Shane Holt Chair, Equipment Energy Efficiency Committee Australian Greenhouse Office
Please address your written submissions to: Australia New Zealand
Ms Eva Oberender Equipment Energy Efficiency Team Australian Greenhouse Office Department of the Environment and Water Resources GPO Box 787 CANBERRA ACT 2601
Or via email to: [email protected]
Chiller Submissions Products Programme Energy Efficiency and Conservation Authority PO Box 388 WELLINGTON Or via email to [email protected]
655 Jacksons Track Jindivick, Victoria 3818 Australia ABN: 18 090 579 365 Tel: +613 5628 5449 Fax: +613 9923 6175 Email: [email protected]

E3 Committee CBA: MEPS and Alternative Strategies for Chillers August 2007
Contents 1 Scope 1
1.1 Cost-Benefit Analysis 1 1.2 Australian and New Zealand Policy Responses to Global Warming 1 1.3 Chiller Products 5 1.4 Australian/New Zealand Policies and Programs 6 1.5 Chiller Market 7 1.6 Australia and New Zealand Market Players 9
2 The Problem 10 2.1 Energy and Greenhouse Gas Emissions 10 2.2 Contribution of Chillers to Energy Use and Emissions 11 2.3 Chiller Technologies and Energy Efficiencies 16 2.4 Assessment of Market Deficiencies and Failures 20
3 Objectives of Strategies 22 3.1 Objective 22
4 Proposed Strategies 23 4.1 Status Quo (BAU) 23 4.2 Voluntary Efficiency Standards 24 4.3 Voluntary Certification Program 25 4.4 Dis-endorsement Label 26 4.5 Levies and Emissions Trading 26 4.6 Mandatory Energy Labelling 28 4.7 Mandatory Minimum Energy Performance Standards 28 4.8 Conclusions 29
5 Cost-Benefit and Other Impacts 31 5.1 Costs to the Taxpayer 31 5.2 Business Compliance Costs 31 5.3 Industry, Competition and Trade Issues 33 5.4 Consumer Costs and Benefits 37 5.5 Impact on Energy Use and Greenhouse Gas Emissions 40 5.6 National and State Costs and Benefits 49
6 Consultations and Comments 55 6.1 Summary of Comments 56 6.2 Responses to Comments 56
7 Evaluation and Recommendations 57 7.1 Assessment 57 7.2 Recommendations (Draft) 58
8 Implementation and Review 59

E3 Committee CBA: MEPS and Alternative Strategies for Chillers August 2007
Appendices Appendix 1: References A-2 Appendix 2: Australian Energy Efficiency Policy Background A-4 Appendix 3: Review of International Approaches A-6 Appendix 4: Stock and Sales A-11 Appendix 5: Energy Prices and Factors A-22 Appendix 6: Calculation Methodology A-23 Appendix 7: Australian ETS Provisional Benefits to Be Included in Future A-26 Appendix 8: Greenhouse Gas Emissions Factors A-28 Appendix 9: Population and Household Numbers A-29 Appendix 10: Cooling Capacity, BAU & MEPS COPs and Input Power by Chiller Categories A-30 Appendix 11: Annual Benefit and Cost Data A-33

E3 Committee CBA: MEPS and Alternative Strategies for Chillers August 2007
List of Tables Table 1: Net annual BAU energy consumption of Chillers by States, Australia as a whole and New
Zealand (GWh) 13 Table 2: Chiller Efficiency in Australia (estimated from surveys 2006-07) 18 Table 3: Building Code of Australia and Proposed NZ Building Code MEPS 19 Table 4: Proposed Australian Chiller MEPS Levels 29 Table 5: Business Cost Calculation Inputs 32 Table 6: Business Compliance Costs for Chiller MEPS (AUD) 33 Table 7: Incremental Price Increase (AUD) Due to MEPS Requirements by Year 34 Table 8: Present Value Costs and Savings – Chiller MEPS, 7.5% Disc Rate 39 Table 9: Present Value Costs and Savings: Varying Usage - MEPS, 7.5% Disc Rate 40 Table 10: Financial Analysis – Australia Base Sales Growth for a Range of Discount Rates 50 Table 11: Financial Analysis – Australia Low Sales Growth for a Range of Discount Rates 51 Table 12: Financial Analysis – NZ Base Sales Scenario for a Range of Discount Rates 52 Table 13: Financial Analysis – NZ Low Sales Scenario for a Range of Discount Rates 52 Table 14: Benefit-Cost Ratio for States by Discount Rate: Base Sales Scenario 52 Table 15: Benefit-Cost Ratio for States by Discount Rate: Low Sales Scenario 53 Table 16 Summary Data for Alternative BAU Sales Australia – 7.5% Discount Rate 54 Table 17 Summary Data for Alternative BAU Sales New Zealand – 10% Discount Rate 54 Table 18: ASHRAE 90.1-1999, 2001 & 2004 Chiller Performance Standards A-7 Table 19: Canada Minimum COP and IPLV of Packaged Water Chilling Packages A-9 Table 20 - Chinese Taipei MEPS for Commercial Air Conditioning Chillers A-10 Table 21: Market Shares by technology and cooling capacities (2000) A-11 Table 22: Total annual sales of chillers 2000-2020, by States, Australia as a whole and New Zealand –
Base sales scenario A-15 Table 23: Stock of chillers 2000-2020, by States, Australia as a whole and New Zealand (base sales
scenario) A-20 Table 24: Marginal Commercial Electricity Tariffs 2005-06 A-22 Table 25: Avoided Marginal Costs of Electricity A-22 Table 26: Example of calculation of NET IPLV COP A-24 Table 27: Hours of Operation by IPLV loading intervals as percentage of total time (8,666 hours in a
year) (Base Usage Scenario) A-24 Table 28: Hours of Operation by IPLV loading intervals as percentage of total time (8,666 hours in a
year) (Low Usage Scenario) A-25 Table 29: Hours of Operation by IPLV loading intervals as percentage of total time (8,666 hours in a
year) (High Usage Scenario) A-25 Table 30: Carbon Permit Sensitivity Analysis – Australia Base Sales Growth A-27 Table 31: Projected Marginal Emissions Factors: Electricity by State 2000-2020 A-28 Table 32: Annual Consumer Energy, Benefits and Costs by State for Australia & New Zealand: Base
Sales Scenario A-33 Table 33: Annual Consumer Energy, Benefits and Costs by State for Australia & New Zealand: Low
Sales Scenario A-35

E3 Committee CBA: MEPS and Alternative Strategies for Chillers August 2007
List of Figures Figure 1 - Chiller Sales by Type & Range 8 Figure 2: Australian Greenhouse Gas Emissions by Sector 2005 (Source: NGGI 2007) 11 Figure 3: Net annual BAU energy consumption by Product Categories - Australia 14 Figure 4: Net annual BAU energy consumption by Product Categories – New Zealand 14 Figure 5: Annual BAU GHG emissions by Product Categories – Australia 15 Figure 6: Annual BAU GHG emissions by Product Categories – New Zealand 15 Figure 7: Share of net annual BAU energy consumption by Product Categories: 2006 Australia 16 Figure 8: Chiller Efficiency (COP) of Air-Cooled Units by Capacity 18 Figure 9: Consumer Cost-Benefit of MEPS (Aus) 37 Figure 10: Consumer Cost-Benefit of MEPS (NZ) 38 Figure 11: Forecast Sales of Chillers - Base Sales Scenario Australia 41 Figure 12: Forecast Sales of Chillers - Base Sales Scenario New Zealand 42 Figure 13: Forecast Sales of Chillers - Low Sales Scenario Australia 43 Figure 14: Forecast Sales of Chillers - Low Sales Scenario New Zealand 43 Figure 15: Net Annual Energy - BAU and MEPS: Australia Base Sales Scenario 44 Figure 16: Net Annual Energy - BAU and MEPS: NZ Base Sales Scenario 45 Figure 17: Net Annual Energy - BAU and MEPS: Australia Low Sales Scenario 45 Figure 18: Net Annual Energy - BAU and MEPS: New Zealand Low Sales Scenario 46 Figure 19: GHG Emissions - BAU and MEPS: Australia Base Sales Scenario 47 Figure 20: GHG Emissions - BAU and MEPS: NZ Base Sales Scenario 47 Figure 21: GHG Emissions - BAU and MEPS: Australia Low Sales Scenario 48 Figure 22: GHG Emissions - BAU and MEPS: NZ Low Sales Scenario 49 Figure 23: Benefit-Cost Ratio as a Function of Incremental Price Increase (Australia) 51 Figure 24: Annual Net Benefit $M: Base Sales Growth Scenario 53 Figure 25: Annual Net Benefit $M: Low Sales Growth Scenario 54 Figure 26: Forecast Sales of chillers - Base Sales Scenario Australia A-12 Figure 27: Forecast Sales of chillers - Low Sales Scenario Australia A-13 Figure 28: Forecast Sales of chillers - Base Sales Scenario New Zealand A-14 Figure 29: Forecast Sales of chillers - Low Sales Scenario New Zealand A-14 Figure 30: Annual sales of chillers by State, Australia and NZ – Base sales scenario A-16 Figure 31: Survival Function of water-cooled chillers for Australia and New Zealand A-17 Figure 32: Survival Function of air-cooled chillers for Australia and New Zealand A-17 Figure 33: Forecast Stock of chillers - Base Sales Scenario Australia A-18 Figure 34: Forecast Stock of chillers - Low Sales Scenario Australia A-18 Figure 35: Forecast Stock of chillers - Base Sales Scenario New Zealand A-19 Figure 36: Forecast Stock of chillers - Low Sales Scenario New Zealand A-19 Figure 37: Trend - Stock of chillers 2000 – 2020 by States, Australia as a whole and New Zealand
(base sales scenario) A-21
E3 Committee CBA: MEPS and Alternative Strategies for Chillers August 2007
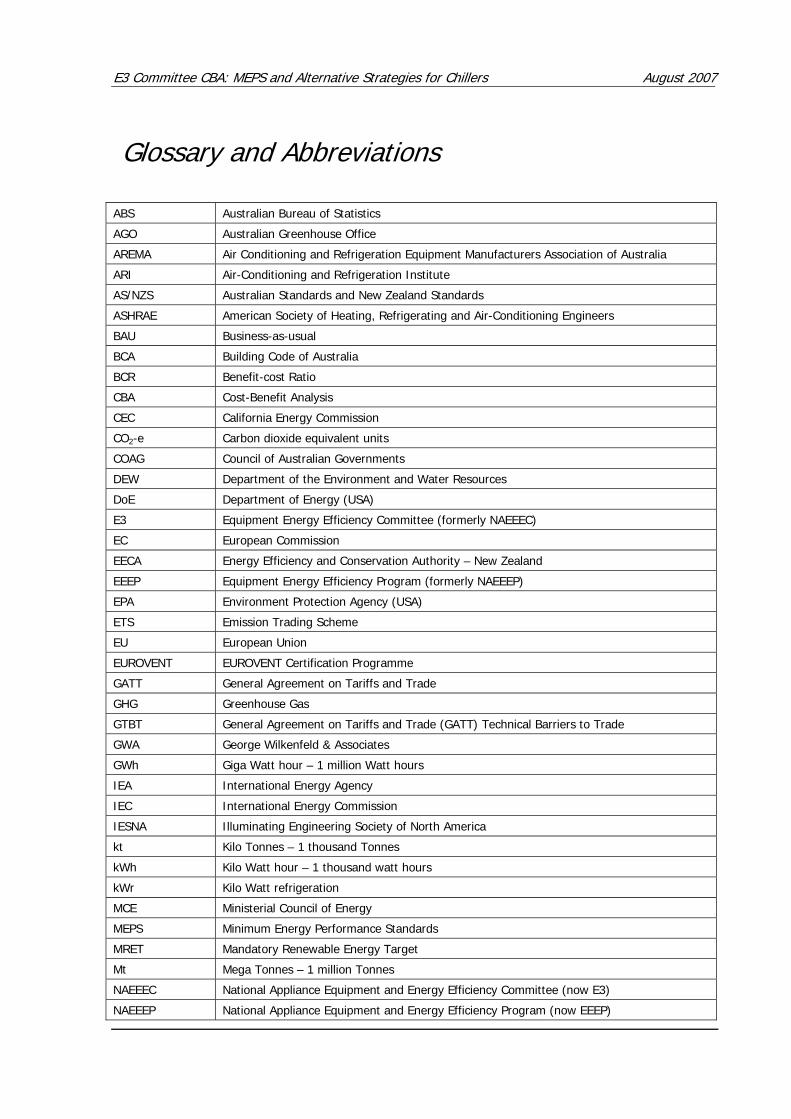
Glossary and Abbreviations ABS Australian Bureau of Statistics
AGO Australian Greenhouse Office
AREMA Air Conditioning and Refrigeration Equipment Manufacturers Association of Australia
ARI Air-Conditioning and Refrigeration Institute
AS/NZS Australian Standards and New Zealand Standards
ASHRAE American Society of Heating, Refrigerating and Air-Conditioning Engineers
BAU Business-as-usual
BCA Building Code of Australia
BCR Benefit-cost Ratio
CBA Cost-Benefit Analysis
CEC California Energy Commission
CO2-e Carbon dioxide equivalent units
COAG Council of Australian Governments
DEW Department of the Environment and Water Resources
DoE Department of Energy (USA)
E3 Equipment Energy Efficiency Committee (formerly NAEEEC)
EC European Commission
EECA Energy Efficiency and Conservation Authority – New Zealand
EEEP Equipment Energy Efficiency Program (formerly NAEEEP)
EPA Environment Protection Agency (USA)
ETS Emission Trading Scheme
EU European Union
EUROVENT EUROVENT Certification Programme
GATT General Agreement on Tariffs and Trade
GHG Greenhouse Gas
GTBT General Agreement on Tariffs and Trade (GATT) Technical Barriers to Trade
GWA George Wilkenfeld & Associates
GWh Giga Watt hour – 1 million Watt hours
IEA International Energy Agency
IEC International Energy Commission
IESNA Illuminating Engineering Society of North America
kt Kilo Tonnes – 1 thousand Tonnes
kWh Kilo Watt hour – 1 thousand watt hours
kWr Kilo Watt refrigeration
MCE Ministerial Council of Energy
MEPS Minimum Energy Performance Standards
MRET Mandatory Renewable Energy Target
Mt Mega Tonnes – 1 million Tonnes
NAEEEC National Appliance Equipment and Energy Efficiency Committee (now E3)
NAEEEP National Appliance Equipment and Energy Efficiency Program (now EEEP)
E3 Committee CBA: MEPS and Alternative Strategies for Chillers August 2007
NFEE National Framework on Energy Efficiency
NGS National Greenhouse Strategy
NPV Net Present Value
NZ New Zealand
RIS Regulatory Impact Statement
TTMRA Trans Tasman Mutual Recognition Arrangement
UNFCCC United Nations Framework Convention on Climate Change

E3 Committee CBA: MEPS and Alternative Strategies for Chillers August 2007
This Document Seeks Industry Comments & Data Australian and New Zealand government agencies responsible for product energy efficiency are currently investigating whether to mandate the energy performance of Chillers that are imported or manufactured and sold in Australia and New Zealand.
This document aims to communicate to stakeholders the most important issues and questions relating to the regulatory proposal and to seek stakeholder comment and industry/market data to better inform the development of the regulatory proposal.
This document is called a “Cost-Benefit Analysis” (CBA) and has been issued by the Equipment Energy Efficiency Committee (E3 Committee) reporting to the Ministerial Council on Energy of the Australian federal, state and territory governments and the New Zealand Government. The CBA is a discussion draft providing the rationale for the regulatory proposal. The CBA and stakeholder responses to it will be used to prepare a regulatory impact statement (RIS) (see http://www.obpr.gov.au for RIS requirements) on the introduction of Minimum Energy Performance Standards (MEPS) for chillers imported and sold in Australia and New Zealand. The proposal will be considered by the Ministerial Council on Energy and, if endorsed, will result in Australian state and territory legislation and New Zealand legislation being amended to prohibit from sale chillers that do not meet the standards.
Stakeholders are invited to make written comments on the proposal. The Australian Greenhouse Office (AGO) in Australia and the Energy Efficiency and Conservation Authority (EECA) in New Zealand are managing the process of obtaining stakeholder views and data on the regulatory proposal. The AGO and EECA will accept written submissions from stakeholders until close of business Friday 14 September 2007 on any of the issues raised in the document. If required, public meetings addressing the proposal will be held in Sydney, Melbourne and Auckland at dates to be determined.
In particular, this CBA document contains various assumptions on chiller technologies, sales, industry and market structure, etc. In the absence of other data from stakeholders, these assumptions will form the basis of the next phase in the regulatory process, which is the Consultation RIS. The Consultation RIS and any further stakeholder responses will then be used to prepare the Decision RIS considered by the Ministerial Council on Energy.

E3 Committee CBA: MEPS and Alternative Strategies for Chillers August 2007
Please address your written submissions to: Australia New Zealand
Ms Eva Oberender Equipment Energy Efficiency Team Australian Greenhouse Office Department of the Environment and Water Resources GPO Box 787 CANBERRA ACT 2601
Or via email to: [email protected]
Chiller Submissions Products Programme Energy Efficiency and Conservation Authority PO Box 388 WELLINGTON Or via email to [email protected]

E3 Committee CBA: MEPS and Alternative Strategies for Chillers August 2007
E-1
Executive Summary This is a Cost-Benefit Analysis (CBA) of a proposal to introduce Minimum Energy Performance Standards (MEPS) for liquid-chilling packages using the vapour compression cycle (commonly called chillers in this document) that are imported or manufactured and sold in Australia and New Zealand. It has been prepared and issued by the Equipment Energy Efficiency Committee (E3 Committee) under the Ministerial Council on Energy of the Australian federal, state and territory governments and the New Zealand Government.
Chillers were identified for policy action in the National Appliance & Equipment Energy Efficiency Program (NAEEEP), today the Equipment Energy Efficiency Program, from 2003. A plan was published by NAEEEP in October 2004 for improving the efficiency of chillers which proposed that mandatory regulations might better meet the Australian and New Zealand governments’ efficiency goals. Since this time, significant industry and government consultation has occurred to provide a suitable framework for the introduction of MEPS.
The Problem
Chillers produce cooled water that is used by building space cooling equipment and many industrial processes. Chillers remove heat from a circulating cold water loop and discharge that heat to the outside air through a cooling tower in the case of water-cooled chillers and through the air-cooled condenser of the chiller in the case of air-cooled chillers. Chillers within the scope of this CBA are generally used for commercial air conditioning, though chillers of the type specified in the report can also be used for industrial purposes. The sales of these products have been steadily increasing at around 3% pa from around 1,400 in 2000 to over 1,700 in 2006. In addition, the installed stock of all types of chillers is estimated at around 21,000 in Australia and 4,200 in New Zealand in 2006.
The annual direct electricity consumption of all these products for the year 2006 has been estimated to be 4,800 GWh/yr in Australia and 860 GWh/yr in New Zealand. The net energy resulting from the use of chillers is projected to grow to over 8,380 GWh in Australia and 1,460 GWh in New Zealand by the year 2020. Currently the overall electricity used by chillers accounts for nearly 9% of total commercial electricity usage. The share of chiller energy use of overall commercial energy consumption is expected to rise to 10% by 2020. Similarly the share of chillers of overall electricity-related greenhouse gas (GHG) emissions is expected to grow from 2.6% in 2006 to 3.3% in 2020 in Australia. The figure following provides the estimated annual BAU GHG emissions by chillers in Australia and New Zealand to 2020.

E3 Committee CBA: MEPS and Alternative Strategies for Chillers August 2007
E-2
NET Annual BAU GHG Emissions - Australia and New Zealand
0
1,000
2,000
3,000
4,000
5,000
6,000
7,00020
00
2001
2002
2003
2004
2005
2006
2007
2008
2009
2010
2011
2012
2013
2014
2015
2016
2017
2018
2019
2020
Year
kt C
O 2
-e AUS All Chillers
NZ All Chillers
The choice of a chiller can affect the energy usage requirements of a building, with case studies showing $10,000s of saving due to the replacement of inefficient chillers. As the installation of more energy efficient chillers need not lead to higher initial installation costs, it would appear the market should automatically move towards the installation of more efficient chillers. However, there are several factors which contribute to deficiencies in the chiller market and make this outcome less likely, these being:
• Many commercial buildings are tenanted, so their developer or owner may have no direct financial motivation to choose the most efficient technologies for the building, and tenants may have no influence over chiller decisions (Energy Strategies 2006).
• Chillers may be chosen and installed by sub-contractors who may not be required to choose the most energy efficient chiller.
• A lack of knowledge in the market of the energy and cost impact of choosing efficient versus inefficient chillers.
The result of this disconnection between the rewards of choosing energy efficient chillers, i.e. lower energy costs, and the authority to select the chiller, means cost efficiencies alone will not be sufficient to drive the uptake of more efficient chillers.
The Objective
The objective of the proposed strategies for chillers is to bring about reductions in Australia’s and New Zealand’s greenhouse gas emissions below what they are otherwise projected to be (i.e. the “business-as-usual” case), in a manner that is in the broad community’s best interests. Within the objective, it must also provide a broad positive

E3 Committee CBA: MEPS and Alternative Strategies for Chillers August 2007
E-3
financial benefit to end consumers, without compromising equipment quality or functionality.
The Proposal
The proposed strategy involves introducing mandatory MEPS for chillers of 350 kWr or greater, from October 2008. The regulation would stipulate the minimum efficiency levels for these products in order to be sold in the Australian and New Zealand market. MEPS aims to remove the worst performing products from the marketplace, rather than promoting the best. This Australian/ New Zealand MEPS is tailored to mirror international requirements, while being moderated to address local industry technical issues. In this regard, the proposed MEPS has been developed in close consultation with the chiller supply industry over the period 2004 to 2007.
The proposed MEPS includes minimum requirements for full load Coefficient of Performance (COP) and importantly, minimum requirements for part load (called Integrated Part Load Values or IPLV). The proposed MEPS does not differentiate between types of chiller compressor technologies, but does vary depending on the size and the type of heat rejection (water-cooled or air-cooled).
Assessment
In the analysis, two annual sales growth scenarios have been analysed: • a base sales scenario that is used for the CBA with product sales increasing at
approximately 3.5% pa from 2007; and • a low sales scenario with sales increasing at only 0.5% pa from 2007.
Australia
The following table summarises the analyses for Australia for the period 2007 to 2020. The data presented is based upon Net Present Value calculations at a discount rate of 7.5%.
Summary Data for Alternative BAU Sales Australia – 7.5% Discount Rate Scenario Base Sales Low Sales Energy Saved (cumulative) 3,891 GWh 3,376 GWh GHG Emission Reduction (cumulative) 3.6 Mt CO2-e 3.1 Mt CO2-e Total Benefit $113M $99M Total Investment $51M $45M Benefit-Cost Ratio 2.2 2.2
Even at a higher discount rate of 10%, for the base and low sales scenario, benefit-cost ratios are positive at 2.0. If the incremental costs of improved product to meet the MEPS are increased by 20% from the values assumed in the CBA analysis, the benefits are still approximately two times the costs under the base sales scenario.

E3 Committee CBA: MEPS and Alternative Strategies for Chillers August 2007
E-4
Although the future carbon price under the forthcoming Australian emissions trading scheme (ETS) is uncertain at present, emissions trading will mean the estimated benefits will always be higher than without emissions trading (i.e., the benefits will always be higher when the carbon price is above zero). The benefit-cost ratio increases to 3.1 for the base sales scenario if the benefits of reducing GHG emissions under the ETS are included from 2012 (see Appendix 6).
New Zealand
The following table summarises the analyses for New Zealand for the period 2007 to 2020. The data presented is based upon Net Present Value calculations at a discount rate of 10%.
Summary Data for Alternative BAU Sales New Zealand – 10% Discount Rate Scenario Base Sales Low Sales Energy Saved (cumulative) 629 GWh 545 GWh GHG Emission Reduction (cumulative) 377 kt CO2-e 327.2 kt CO2-e Total Benefit $13M $11.7M Total Investment $9M $7.9M Benefit-Cost Ratio 1.5 1.5 Note that NZ Govt requires analysis of alternative proposals with 10% discount rate
At the individual application level, the mix of benefits and costs depends on usage patterns. The analysis indicates that, in all usage cases, end-users will benefit from the proposed regulation.
Alternative Options
The other options considered for achieving the objective were: • voluntary efficiency standards; • levies and emissions trading; • a certification program; • dis-endorsement labelling; • mandatory energy labelling.
Voluntary efficiency standards rely on equipment suppliers being effectively encouraged to meet certain minimum energy efficiency levels voluntarily, i.e. in the absence of regulation. As there are few commercial incentives for doing so, it is unlikely that suppliers would willingly make these changes without significant government incentives. Stakeholder feedback was that suppliers would not participate as this would affect their competitiveness and may perversely encourage the use of poorer performing lower cost products.

E3 Committee CBA: MEPS and Alternative Strategies for Chillers August 2007
E-5
Levy options are not currently government policy and would require extensive consultation at the highest levels of government. Hence these options cannot be considered until such time as government policy changes to favour levy schemes.
The Australian Government has announced that a domestic ETS will be implemented no later than 2012. This could eventually lead to the full cost of GHG emissions impacts being reflected in energy prices, but it is unlikely that an ETS alone and the energy price rises that might flow from it in the future would quickly lead to purchasers being concerned about the energy efficiency of chillers.
Certification is unlikely to succeed as the program is likely to cover only a proportion of the chillers available.
A dis-endorsement labelling scheme is very unlikely to be effective for chillers, as chillers are not a retail item but are sold on the basis of their technical specifications and price. It would therefore appear to be unjustified and inappropriate in Australia and New Zealand.
As chillers are not sold to consumers but are a business product, sold on the basis of their technical specifications and price, an energy rating label is highly unlikely to affect the market for more efficient chillers.
The implication is that the impact of the other non-MEPS options for Australia and New Zealand would be negligible in comparison to the BAU case.
Recommendations (draft)
It is recommended that the Ministerial Council on Energy (MCE) agree: 1. To implement mandatory energy performance standards for liquid-chilling
packages using the vapour compression cycle in regulation. 2. That products covered by this CBA include all those chillers with output capacity
of 350kWr or greater, included in the scope of AS/NZS 4776, Part 1.1. 3. To use the test method AS/NZS 4776.1.2 which specifies the method of testing
liquid-chilling packages using the vapour compression cycle to verify the capacity, power and efficiency requirements at a specific set of conditions.
4. That liquid-chilling packages must meet or surpass the energy performance requirements that are proposed in this document and will be set down in Australian and New Zealand Standard AS/NZS 4776.2 (MEPS requirements for liquid-chilling packages using the vapour compression cycle).
5. That the amendments take effect not earlier than 1 October 2008. 6. To have all jurisdictions take the necessary administrative actions to ensure that
the suite of regulations can take effect from not earlier than 1 October 2008.

E3 Committee CBA: MEPS and Alternative Strategies for Chillers August 2007
1
1 Scope 1.1 Cost-Benefit Analysis
This Cost-Benefit Analysis (CBA) has been prepared to demonstrate the benefits of regulating mandatory energy performance standards (MEPS) for liquid-chilling packages using the vapour compression cycle (commonly called chillers in this document) that are imported or manufactured and sold in Australia and New Zealand.
The CBA has been issued by the Equipment Energy Efficiency Committee (E3 Committee) reporting to the Ministerial Council on Energy of the Australian federal, state and territory governments and the New Zealand Government. It aims to communicate the most important issues and questions relating to the regulatory proposal and to seek stakeholder comment and industry/market data to better inform the development of the regulatory proposal. Stakeholders are invited to make written comments on the proposal, as described above under “This Document Seeks Industry Comments & Data”.
This document is a precursor to a Regulatory Impact Statement (RIS) on the introduction of MEPS for chillers. A RIS is required whenever new or more stringent mandatory measures are proposed by government. Under the guideline agreed by all Australia jurisdictions and New Zealand, product regulation is undertaken only where the benefits outweigh the costs to the community; and the cost of improving appliance efficiency is outweighed by the energy and greenhouse gas emissions savings made over the lifetime of the product.
1.2 Australian and New Zealand Policy Responses to Global Warming
This regulatory proposal cannot be assessed in isolation; it forms part of a coordinated response by Governments to undertaking regulatory measures for any energy-using product that are cost-effective and meet agreed environmental and energy goals.
Australia’s Response to Climate Change
The development of Australia’s climate change policies has followed a consistent policy direction for more than 15 years or since the National Greenhouse Response Strategy was released producing bi-partisan support for Australia-wide energy efficiency measures. Appendix 2 records some of the more important stages in that development.
Most recently, in July 2007, the Prime Minister released Australia’s Climate Change Policy – our economy, our environment, our future. The policy again reasserted that energy efficiency regulation remains a key element of cost effective greenhouse abatement:
“Energy efficiency is an important way to reduce greenhouse gas emissions cheaply. Demand for electricity in Australia is expected to more than double by 2050. Improvements in energy efficiency

E3 Committee CBA: MEPS and Alternative Strategies for Chillers August 2007
2
have the potential to lower that projected growth, and avoid greenhouse gas emissions. They can also deliver a net financial gain for firms and consumers. The scale of these savings, both in emissions and outlays, is often underestimated. For example, in June 2007 the IEA published energy efficiency recommendations which, if adopted globally by 2030, would save 5,700 million tonnes of CO2 – the equivalent of the United States total emissions in 2004. (IEA, Energy Efficiency Policy Recommendations to the G8 2007 Summit, Heiligendamm, June 2007, p 2) … The MEPS programme is one of the main success stories of the National Framework for Energy Efficiency (NFEE). The NFEE was developed cooperatively across jurisdictions and covers a range of policy measures, designed to overcome market barriers to energy efficiency.” (pp 16-17)
New Zealand’s Response to Climate Change
New Zealand energy efficiency policies have a similar history of long-term support by government. New Zealand ratified the Kyoto Protocol in 2002, and has committed to reducing its greenhouse gas emissions back to 1990 levels, on average, over the period 2008 to 2012 (or to take responsibility for any emissions above this level if it cannot meet this target). The introduction of minimum energy performance standards for household appliances continues to form part of New Zealand’s climate change strategy, as part of implementing the National Energy Efficiency and Conservation Strategy (NEECS).
A NEECS review in 2007 concluded a replacement Strategy was both necessary and timely. In December 2007 the New Zealand Minister of Energy released the Draft New Zealand Energy Efficiency and Conservation Strategy (NZEECS), which proposes ways to promote energy efficiency, energy conservation and the use of renewable sources of energy. It includes measures to reduce electricity demand, address energy use in transport, buildings and industry, and promote greater consideration of sustainable energy in the development of land, settlements and energy production. The strategy is available at http://www.eeca.govt.nz/about/national-strategy/release-of-draft-nzeecs.html
The draft strategy is a key part of the Government’s response to global climate change, the need for enhanced security of energy supply and rising energy prices. The draft NZEECS is being developed within the framework of the Draft New Zealand Energy Strategy.
It presents sector-based action plans that would support the energy efficiency, energy conservation and renewable energy objectives set out in the draft New Zealand Energy Strategy, which are: 1. maximising how efficiently we use our energy to safeguard affordability, economic productivity and our environment; and 2. maximising the proportion of energy that comes from our abundant renewable energy sources.
The MCE Moves beyond “No Regrets” Energy Efficiency Measures
In October 2006, the Ministerial Council on Energy (MCE) of Australian federal, state and territory and New Zealand government energy ministers agreed to new criteria for assessing new energy efficiency measures. The MCE replaced its previous “no regrets” test (that a measure have private benefits excluding environmental benefits which are greater

E3 Committee CBA: MEPS and Alternative Strategies for Chillers August 2007
3
than its costs) with the criteria that the MCE would consider “new energy efficiency measures which deliver net public benefits, including low cost greenhouse abatement measures that do not exceed the cost of alternate measures being undertaken across the economy”.
This policy means the MCE will consider new regulatory measures that may have net up-front costs but have greater private economic and greenhouse benefits over the long term. The policy is based on the principle that prudent investment now may avoid more costly intervention later. This bipartisan agreement demonstrates the on-going commitment of all participating jurisdictions to using regulatory measures that deliver effective, measurable abatement.
IEA Sees Improving Energy Efficiency as Top Priority
Australian and New Zealand policy is in accord with international endeavours in this field.
“The IEA estimates that under current policies, global emissions will increase 50% by 2030 and more than double by 2050. However, if we act now, this unsustainable and dangerous pattern can be curbed. IEA findings show that emissions could be returned to current levels by 2050 and even reduced thereafter, while an ever-growing demand for energy services, notably in developing countries, can be fully satisfied. Improving energy efficiency in the major consuming sectors – buildings and appliances, transport and industry – must be the top priority. While alleviating the threat of climate change this would also improve energy security and have benefits for economic growth.” – Claude Mandil, Executive Director, International Energy Agency (IEA), Paris, February 2007.
Australian and New Zealand policies are at the forefront of international work to improve the energy efficiency of globally traded equipment, which lower trading costs while still delivering environmental and economic benefits.
Equipment Energy Efficiency Program
In Australia, regulatory intervention in the market for energy-using products was first introduced with mandatory appliance energy labelling by the NSW and Victorian Governments in 1986. Between 1986 and 1999 most state and territory governments introduced legislation to make energy labelling mandatory, and agreed to co-ordinate labelling and minimum energy performance standards (MEPS) decision making through the MCE. New Zealand has participated in monitoring the Australian program for more than a decade and has been a partner in decision-making for several years. Regulatory interventions have consistently met the requirements to demonstrate the actual benefit increasing energy efficiency standards, which address market failure relating to life-time energy cost information for appliances and equipment.
The proposed regulation is an element of the Equipment Energy Efficiency Program (E3), formerly known as National Appliance and Equipment Energy Efficiency Program (NAEEEP). E3 embraces a wide range of measures aimed at increasing the energy efficiency of products used in the residential, commercial and manufacturing sectors in
E3 Committee CBA: MEPS and Alternative Strategies for Chillers August 2007
4
Australia and New Zealand. E3 is an initiative of the MCE comprising ministers responsible for energy from all jurisdictions, and is an element of both Australia’s National Framework for Energy Efficiency (NFEE) and New Zealand’s National Energy Efficiency and Conservation Strategy. It is organised as follows:
• Implementation of the program is the direct responsibility of the Equipment Energy Efficiency Committee (referred to as the “E3 Committee”), which comprises officials from Australian federal, state and territory government agencies and representatives from New Zealand. These officials are responsible for implementing product energy efficiency initiatives in the various jurisdictions.
• The E3 Committee reports through the Energy Efficiency Working Group (E2WG) to the MCE and is ultimately responsible to the MCE.
• The MCE has charged E2WG to manage the overall policy and budget of the national program.
• The Australian and New Zealand members of the E3 Committee work to develop mutually acceptable labelling requirements and MEPS. New requirements are incorporated in Australian and New Zealand Standards and developed within the consultative machinery of Standards Australia.
• The program relies on State and Territory legislation for legal effect in Australia, enforcing relevant Australian Standards for the specific product type. National legislation performs this task in New Zealand.
The broad policy mandate of E3 has been regularly reviewed over the last decade and was most recently refreshed in 2004. Not only is any energy-using equipment type potentially included in resulting work plans for possible regulation but external power supplies were specifically nominated for regulatory impact assessment.
To be included in the program, appliances and equipment must satisfy certain criteria relating to the feasibility and cost effectiveness of intervention. These include potential for energy and greenhouse gas emissions savings, environmental impact of the fuel type, opportunity to influence purchase, the existence of market barriers, access to testing facilities, and considerations of administrative complexity. Policy measures are subject to a cost-benefit analysis and consideration of whether the measures are generally acceptable to the community.
E3 provides stakeholders with opportunities to comment on specific measures as they are developed by issuing reports (including fact sheets, technical reports, cost-benefit analyses and regulatory impact statements) and by holding meetings. Regulation of external power supplies have been a topic of discussion with key industry leaders for many years.

E3 Committee CBA: MEPS and Alternative Strategies for Chillers August 2007
5
1.3 Chiller Products
This report focuses on chillers for commercial air conditioning, though chillers of the type specified in the report can also be used for industrial purposes. However, generally an industrial chiller is a refrigeration system that cools water or some other fluid to provide a constant stream of coolant for cold storage (including cool rooms), manufacturing and laboratory processes. These industrial chillers are not generally used in air conditioning, but may be used for food processing and storage, process cooling, plastic moulding, solvent coolers, milk coolers, aerospace production, medical facilities etc. Hence the majority of the chillers that are the focus of this report are used for air conditioning in the commercial sector.
Chiller Product Description
Chillers produce water that is used by building space cooling equipment and many industrial processes. Chillers remove heat from a circulating cold water loop and discharge that heat to the outside air through a cooling tower in the case of water-cooled chillers and through the air-cooled condenser of the chiller in the case of air-cooled chillers.
Chillers are generally used in commercial buildings to provide chilled-water. The chiller is usually located on in the plant room of the building. It cools water to between 4 and 9°C. This chilled water is then piped throughout the building and connected to air handlers as needed.
The chiller is part of a system that is called “applied” air conditioning, where the system is usually specified by the building designer/ engineer. This is compared to unitary (all-in-one) systems where the air conditioners are “packaged” and cool air is ducted around the building.
The product type included in this CBA is based on the draft standard produced by Standards Australia committee ME-086. This document (currently called DR 07278) will become AS/NZS 4776.1 Liquid-chilling Packages Using the Vapour Compression Cycle. In general this broad product description will include chillers with the following characteristics:
• Factory assembled vapour compression units designed to cool water using an evaporator, with an integral water or air-cooled condenser and controls
• Cooling only units • The components of chillers such as motor, compressor, evaporator,
economiser, condenser, receiver, water connections and passes, control panel,

E3 Committee CBA: MEPS and Alternative Strategies for Chillers August 2007
6
purge equipment, fastenings and couplings, refrigerant charge oil and pump if included
• Different types of compressors including reciprocating, screw, scroll and centrifugal
• The heat rejection process is via air-cooled or water-cooled condensers.
Energy consumption from chillers is estimated to be over 4,800 GWh/yr in Australia and over 860 GWh/yr in New Zealand in 2006. In addition, cooling functions are estimated to result in about 28% of greenhouse gas emissions from the average commercial buildings (ES 2005).
1.4 Australian/New Zealand Policies and Programs
National product regulation can only be justified where the benefits outweigh the costs to the community; where the costs of improving efficiency are outweighed by the energy savings made over the lifetime of the product. To date, the cooling cycle of three phase air conditioners and single phase (domestic) air conditioners are regulated for MEPS and energy labelling. In addition, the Building Code of Australia has been updated to include Minimum Energy Performance Standards for chillers in new non-residential buildings.
Package Air Conditioners
Since 1 October 2001, three phase air conditioners with a cooling capacity of up to 65kW manufactured in or imported into Australia must comply with Minimum Energy Performance Standards (MEPS) requirements which are set out in AS 3823.2-2001. MEPS covers three phase non-ducted or ducted room air conditioners of the vapour compression type of up to 65kW cooling (commercial or residential). It covers only those units with a single compressor with a single indoor control such as single packaged units, packaged ducted units, double and triple split systems and single split systems. It does not cover multi-split systems, portable systems without an exhaust duct or evaporative coolers. Manufacturers can choose to label three phase air conditioners, but this is not mandatory.
Packaged Air conditioning MEPS introduced in 2001 are projected to save 14.6 Mt CO2e from 2000 to 2015 and save the community $400 million (NPV - 10% discount ). The benefits exceed costs by 6:1. These MEPS levels are due to increase in October 2007.
Single Phase Air Conditioners
From 1 October 2004, all single phase air conditioners manufactured in or imported into Australia must comply with Minimum Energy Performance Standards (MEPS) requirements which are set out in AS/NZS 3823.2-2003. MEPS covers single phase non-ducted or ducted room air conditioners of the vapour compression type (commercial or residential) within the scope of AS/NZS 3823.1.1 or AS/NZS 3823.1.2. These MEPS

E3 Committee CBA: MEPS and Alternative Strategies for Chillers August 2007
7
levels were further increased for many non-ducted single phase models effective from April 2006 and for other units from October 2007.
Building Code of Australia and New Zealand Building Code
The development of the Building Code of Australia (BCA) energy efficiency provisions for commercial buildings has proceeded in two stages. Firstly, provisions for Class 2, 3 and 4 buildings (e.g., apartments and hotels) were included in BCA 2005. Secondly, provisions for Class 5, 6, 7, 8 and 9 buildings (e.g., offices, shops, warehouses, factories, health care buildings, auditoriums and schools) were included in BCA 2006. These provisions include MEPS for chillers installed in new buildings only.
The New Zealand Building Code includes provisions for energy efficiency under clause H1 Energy Efficiency, which was last revised in 2001. The NZ Department of Building and Housing (DBH) has proposed changes to the heating, ventilating and air-conditioning (HVAC) systems be covered by the energy efficiency requirements of Clause H1 of the New Zealand Building Code, leading to more stringent energy efficiency standards and lower energy use for such systems in commercial buildings (DBH NZ 2007). A proposal was released for discussion in April 2007, with submissions closing on 29 June 2007. After considering the submissions, the DBH will report its recommendations back to Government in October 2007. These provisions include MEPS for chillers installed in new buildings only and are identical to those in the Australian BCA 2006.
1.5 Chiller Market
In research undertaken by the UK’s Building Research and Information Association (BSRIA), the world air conditioning market was estimated to be in the vicinity of AUD$50 billion in 2002. Approximately 10% of this market value has been attributed to air conditioning water chillers. With the Australian air conditioning water chiller market estimated at AUD$125M, this represents around 2.5% of the total world market and is considered modest compared to the room and unitary air conditioning market of over AU$800M (Informark 2004). Information is not available on the New Zealand market.
There is little or no published data on the energy performance characteristics Australian/New Zealand chillers. Therefore, information in this section is primarily derived from personnel interviews with major suppliers of chillers to Australia and New Zealand.
Current Installed Base and Sales
There are no Australian Bureau of Statistics data on the installed number of commercial chillers in Australia. In addition, the data contained in other studies (Burbank 2002, AGO 1999) of the commercial market do not appear to detail the number of installed chillers. To estimate the number of installed chillers, extensive consultation was conducted with key organisations representing the majority of sales of chillers in Australia. Many of the organisations were members of the Air Conditioning and

E3 Committee CBA: MEPS and Alternative Strategies for Chillers August 2007
8
Refrigeration Equipment Manufacturers Association of Australia (AREMA) and these companies also sell chillers into New Zealand. From these consultations, it is estimated that there were some 21,000 chillers in 2006 of varying technology types, efficiencies and refrigerants are currently installed in Australian commercial buildings, entertainment complexes and retails facilities. Approximately half of these chillers are believed to be air-cooled. In New Zealand the estimated stock of chillers is 4,200, with a similar proportion of air-cooled.
Chiller Capacity Range
The capacity range of chillers available in today’s Australian and New Zealand market can range from 10kW up to 4,000 kW in cooling capacity. In large installations it is not unusual to have multiple chillers, with different capacities and different compressor types.
Figure 1 - Chiller Sales by Type & Range
0%
20%
40%
60%
80%
100%
<530 kWR >530 kWR but< 1055kWR
> 1055 kWR
Recip/Scroll Rotary/Screw Centrifugal
Source: EnergyConsult 2004
Figure 1 shows the range of sales by type of chiller. Applications with cooling requirements below 250 kW are mainly dominated by scroll compressors, with other applications up to 1,000 kW using a mixture of helical rotary (screw) and reciprocating compressors. Cooling capacity requirements above 1,000 kW is usually managed by the use of screw and centrifugal compressors.
Sales Trends
Chiller sales vary from year to year and correlate closely with building industry activity. The chiller market varies depending on the influence of many factors that include:

E3 Committee CBA: MEPS and Alternative Strategies for Chillers August 2007
9
economic downturn; oversupply of commercial office space; outbreaks of SARS, global conflicts and uncertainty in both Australian and US economies. In 2006 the market was estimated to be 1700 units per annum1 in Australia and 330 in New Zealand. Of these sales, it is estimated that around 40% are for replacement of existing equipment. Total sales growth is estimated at around 3% pa.
There has been a trend towards greater installations of air-cooled chillers over the past decade and it is estimated that these chillers represent about 75% of chiller sales, mainly influenced by increasing range of available air-cooled chillers and regulations surrounding cooling towers, waste water management, chemical treatment costs and escalating maintenance costs.
Expected Chiller Service Life
Service life is based around the time in which a particular system or component remains in its original service application. Estimated service life of new equipment can be obtained from manufactures. For consistency the datum for chiller service life has traditionally been based on American Society of Heating, Refrigerating and Air-Conditioning Engineers (ASHRAE) “Estimates of Service Life” where chiller life is between 20 to 23 years. The changes in design, design standards, manufacturing standards, materials and installation conditions has raised a re-estimate amongst industry that believes air-cooled chillers now have a life of 15 years, with water-cooled chillers between 20 and 30 years. It is important to note that the energy efficiency of air-cooled chillers decreases much faster that water-cooled chillers over time. This is due to the corrosion that can attack the air-cooled condenser fins.
1.6 Australia and New Zealand Market Players
Almost all chillers supplied in Australia and New Zealand are imported from such companies as Trane, Carrier, McQuay, York, Airwell, Cooline, Matsu, MTA, and Daikin. Fluid Chillers, Sharpe & Rendry and PowerPax manufacture chillers in Australia.
It would appear, with the exception of PowerPax the local manufacturers focus on the lower capacity market (< 300 kWr). It is estimated that chillers under 350 kWr represent about 10% of the water chillers to the commercial sector. Many of the smaller chillers are used in industrial applications.
1 From presentation by Greg Groppenbacher, November 2006.

E3 Committee CBA: MEPS and Alternative Strategies for Chillers August 2007
10
2 The Problem Climate change is a serious global challenge, requiring an effective global response (Intergovernmental Panel on Climate Change (IPCC) Working Group I, II and III reports at http://www.ipcc.ch/).
The United Nations Framework Convention on Climate Change (UNFCCC) was agreed in 1992 and came into force in 1994. It places much of the responsibility for taking action to limit greenhouse gas emissions on the developed countries, which are collectively referred to as Annex 1 countries, including Australia and New Zealand. Annex 1 countries are required to report each year on the total quantity of their greenhouse gas emissions and on the actions they are taking to limit those emissions.
The Kyoto Protocol to the UNFCCC was agreed in December 1997, and came into force in 2005. The Australian Government has decided not to ratify the Protocol as it does not require all countries to act – only developed countries were required to reduce their emissions. Nevertheless, the Australian Government committed to meet its Kyoto target of 108% of 1990 emissions, on average, over 2008 to 2012.
New Zealand ratified the Kyoto Protocol on 19 December 2002, and has committed to reducing its greenhouse gas emissions back to 1990 levels, on average, over 2008 to 2012 or to take responsibility for any emissions above this level if it cannot meet this target.
The introduction of minimum energy performance standards for inefficient energy-consuming equipment continues to form part of Australia’s and New Zealand’s climate change strategies as described in Section 1.2.
2.1 Energy and Greenhouse Gas Emissions
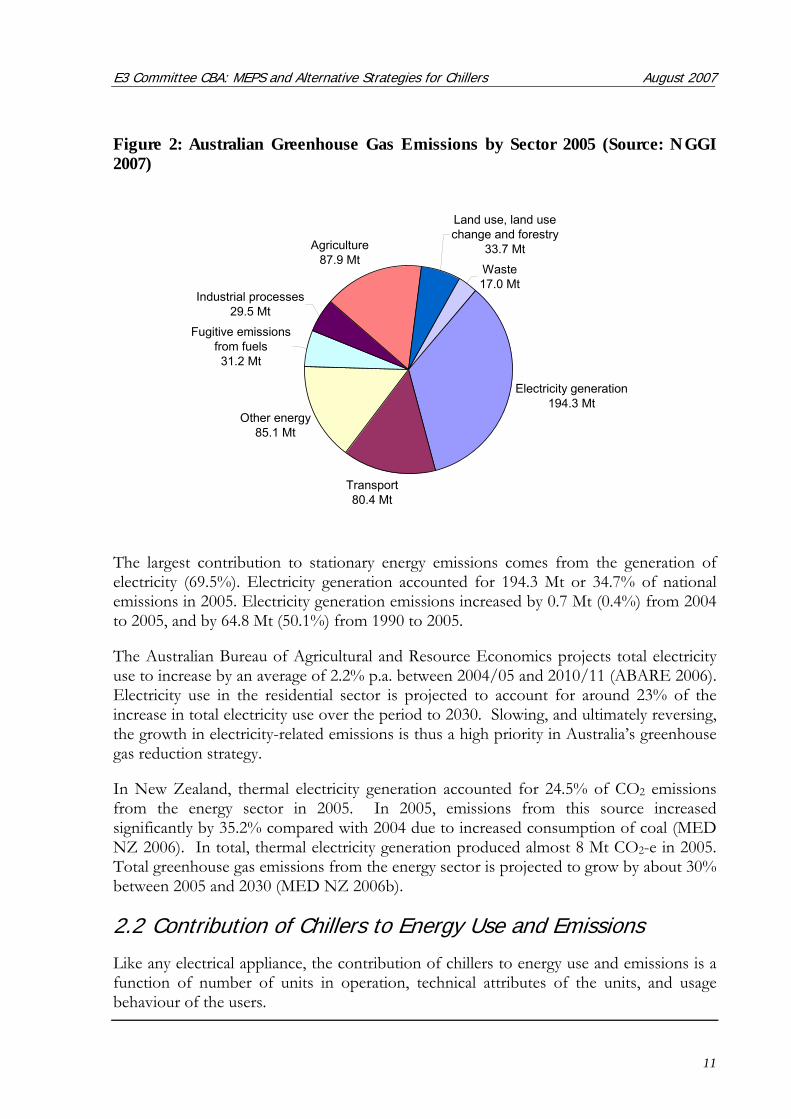
Figure 2 shows estimated Australian greenhouse gas emissions by sector for 2005. The estimated total greenhouse gas emissions for 2005 are 559.1 million tonnes of CO2-e (NGGI 2007). The electricity sector represents the greatest contribution to Australia’s greenhouse gas emissions, as illustrated in Figure 2.
E3 Committee CBA: MEPS and Alternative Strategies for Chillers August 2007
11
Figure 2: Australian Greenhouse Gas Emissions by Sector 2005 (Source: NGGI 2007)
Electricity generation 194.3 Mt
Transport80.4 Mt
Other energy85.1 Mt
Fugitive emissions from fuels 31.2 Mt
Industrial processes29.5 Mt
Agriculture87.9 Mt
Land use, land use change and forestry
33.7 Mt
Waste17.0 Mt
The largest contribution to stationary energy emissions comes from the generation of electricity (69.5%). Electricity generation accounted for 194.3 Mt or 34.7% of national emissions in 2005. Electricity generation emissions increased by 0.7 Mt (0.4%) from 2004 to 2005, and by 64.8 Mt (50.1%) from 1990 to 2005.
The Australian Bureau of Agricultural and Resource Economics projects total electricity use to increase by an average of 2.2% p.a. between 2004/05 and 2010/11 (ABARE 2006). Electricity use in the residential sector is projected to account for around 23% of the increase in total electricity use over the period to 2030. Slowing, and ultimately reversing, the growth in electricity-related emissions is thus a high priority in Australia’s greenhouse gas reduction strategy.
In New Zealand, thermal electricity generation accounted for 24.5% of CO2 emissions from the energy sector in 2005. In 2005, emissions from this source increased significantly by 35.2% compared with 2004 due to increased consumption of coal (MED NZ 2006). In total, thermal electricity generation produced almost 8 Mt CO2-e in 2005. Total greenhouse gas emissions from the energy sector is projected to grow by about 30% between 2005 and 2030 (MED NZ 2006b).
2.2 Contribution of Chillers to Energy Use and Emissions
Like any electrical appliance, the contribution of chillers to energy use and emissions is a function of number of units in operation, technical attributes of the units, and usage behaviour of the users.

E3 Committee CBA: MEPS and Alternative Strategies for Chillers August 2007
12
Total Chiller Market
As previously discussed, there are an estimated 21,000 chillers operating in Australia and 4,200 in New Zealand, with an annual growth in stock of around 1000 units pa in Australia and 200 units pa in New Zealand.
The net annual energy consumption of all chillers for the in 2006 is estimated at 4,800 GWh/yr in Australia and 860 GWh/yr in New Zealand. The net energy resulting from the use of chillers is projected to grow to over 8,380 GWh/yr in Australia and 1,460 GWh/yr in New Zealand by 2020.
Table 1 provides the estimated net energy consumption for all Australian states and territories, Australia as a whole, and New Zealand for the years 2000 to 2020 under the BAU conditions. The total estimated net energy consumption by size category and type of chiller is shown in Figure 3 for Australia and Figure 4 for New Zealand. Figure 5 provides the estimated GHG emissions by product category in Australia and Figure 6 for New Zealand.

E3 Committee CBA: MEPS and Alternative Strategies for Chillers August 2007
13
Table 1: Net annual BAU energy consumption of Chillers by States, Australia as a whole and New Zealand (GWh)
YEAR NSW & ACT
NT QLD SA TAS VIC WA AUST NZ
2000 998 43 1,012 514 57 661 504 3,790 709
2001 1,035 45 1,049 523 59 690 527 3,928 728
2002 1,075 48 1,091 534 61 722 552 4,083 751
2003 1,119 50 1,136 547 63 756 579 4,252 777
2004 1,168 53 1,186 563 66 793 608 4,436 805
2005 1,219 55 1,238 580 68 832 639 4,633 835
2006 1,274 58 1,295 599 71 874 671 4,842 868
2007 1,332 61 1,354 620 74 917 705 5,063 904
2008 1,393 64 1,416 642 77 962 740 5,295 941
2009 1,456 68 1,481 666 80 1,009 777 5,537 980
2010 1,522 71 1,547 691 84 1,057 814 5,786 1,021
2011 1,589 74 1,616 717 87 1,107 853 6,043 1,063
2012 1,658 78 1,686 743 91 1,156 891 6,304 1,106
2013 1,727 81 1,757 771 94 1,207 930 6,567 1,150
2014 1,796 85 1,827 798 98 1,256 969 6,829 1,194
2015 1,864 88 1,896 826 102 1,305 1,007 7,087 1,237
2016 1,930 91 1,963 853 105 1,353 1,044 7,339 1,280
2017 1,996 94 2,030 881 109 1,400 1,080 7,590 1,323
2018 2,063 97 2,098 909 112 1,448 1,117 7,844 1,366
2019 2,132 101 2,169 938 116 1,497 1,155 8,108 1,411
2020 2,205 104 2,243 968 120 1,549 1,195 8,385 1,458

E3 Committee CBA: MEPS and Alternative Strategies for Chillers August 2007
14
Figure 3: Net annual BAU energy consumption by Product Categories - Australia
0
1,000
2,000
3,000
4,000
5,000
6,000
7,000
8,000
9,000
2000
2001
2002
2003
2004
2005
2006
2007
2008
2009
2010
2011
2012
2013
2014
2015
2016
2017
2018
2019
2020
Year
GW
h
Air Cooled < 350 kWAir Cooled >350 - < 500 kWAir Cooled >500 - < 700 kWAir Cooled >700 - < 1000 kWAir Cooled >1000Water Cooled < 350 kWWater Cooled >350 - < 500 kWWater Cooled >500 - < 700 kWWater Cooled >700 - < 1000 kWWater Cooled >1000 - < 1500 kWWater Cooled >1500ALL
Figure 4: Net annual BAU energy consumption by Product Categories – New Zealand
0
200
400
600
800
1,000
1,200
1,400
1,600
2000
2001
2002
2003
2004
2005
2006
2007
2008
2009
2010
2011
2012
2013
2014
2015
2016
2017
2018
2019
2020
Year
GW
h
Air Cooled < 350 kWAir Cooled >350 - < 500 kWAir Cooled >500 - < 700 kWAir Cooled >700 - < 1000 kWAir Cooled >1000Water Cooled < 350 kWWater Cooled >350 - < 500 kWWater Cooled >500 - < 700 kWWater Cooled >700 - < 1000 kWWater Cooled >1000 - < 1500 kWWater Cooled >1500ALL
It is evident from Figure 3 and Figure 4 that the growth in net annual energy, which is closely related to annual sales, is relatively constant from 2000 to 2020.

E3 Committee CBA: MEPS and Alternative Strategies for Chillers August 2007
15
Figure 5: Annual BAU GHG emissions by Product Categories – Australia
0
1,000
2,000
3,000
4,000
5,000
6,000
7,000
8,00020
00
2001
2002
2003
2004
2005
2006
2007
2008
2009
2010
2011
2012
2013
2014
2015
2016
2017
2018
2019
2020
Year
kt C
O 2
-e
Air Cooled < 350 kWAir Cooled >350 - < 500 kWAir Cooled >500 - < 700 kWAir Cooled >700 - < 1000 kWAir Cooled >1000Water Cooled < 350 kWWater Cooled >350 - < 500 kWWater Cooled >500 - < 700 kWWater Cooled >700 - < 1000 kWWater Cooled >1000 - < 1500 kWWater Cooled >1500ALL
Figure 6: Annual BAU GHG emissions by Product Categories – New Zealand
0
100
200
300
400
500
600
700
800
900
1,000
2000
2001
2002
2003
2004
2005
2006
2007
2008
2009
2010
2011
2012
2013
2014
2015
2016
2017
2018
2019
2020
Year
kt C
O 2
-e
Air Cooled < 350 kWAir Cooled >350 - < 500 kWAir Cooled >500 - < 700 kWAir Cooled >700 - < 1000 kWAir Cooled >1000Water Cooled < 350 kWWater Cooled >350 - < 500 kWWater Cooled >500 - < 700 kWWater Cooled >700 - < 1000 kWWater Cooled >1000 - < 1500 kWWater Cooled >1500ALL
Currently the overall electricity used by chillers accounts for nearly 9% of total commercial electricity usage in Australia (EMET 2004). The share of chiller energy use of

E3 Committee CBA: MEPS and Alternative Strategies for Chillers August 2007
16
overall commercial sector energy consumption is expected to rise to 10% by 2010. Similarly, for Australia the share of chillers of overall electricity-related GHG emissions is expected to grow from 2.6% in 2006 to 3.3% in 2020.
In New Zealand the overall electricity used by chillers accounts for 20% of total commercial/storage sector electricity usage in 2002 (EECA 2007). Therefore, the share of total electricity related GHG emissions in New Zealand from chillers is approx 2.3% in 2002.
Chiller Energy Consumption by Size and Type
The focus of the proposals to improve the energy efficiency of chillers is for those of large capacity where the vast majority are installed in commercial buildings. Therefore it is important to examine the contribution to the total energy consumption of chillers by size range. Figure 7 shows the estimated share of total BAU energy consumption by category of chiller in 2006. The figure shows that chillers of less than 350 kWr contribute to only 13% of the total energy consumption for chillers in Australia, which justifies the focus of potential policy options on the larger units ( <350 kWr).
Figure 7: Share of net annual BAU energy consumption by Product Categories: 2006 Australia
Air Cooled >350 - < 500 kW23%
Air Cooled >500 - < 700 kW12%
Air Cooled >700 - < 1000 kW4%
Air Cooled >1000 kW4%
Water Cooled < 350 kW1%
Water Cooled >350 - < 500 kW8%
Water Cooled >500 - < 700 kW12%
Water Cooled >700 - < 1000 kW13%
Water Cooled >1000 - < 1500 kW
6%
Water Cooled >1500 kW3%
All < 350 kW13%
Air Cooled < 350 kW12%
2.3 Chiller Technologies and Energy Efficiencies
Preliminary research of the Australian market shows that chillers being sold in Australia and New Zealand are generally of lower efficiency than the USA and other countries

E3 Committee CBA: MEPS and Alternative Strategies for Chillers August 2007
17
where a MEPS applies. Internationally, the range of efficiency for commercial chillers is wide and there is scope for improvements to energy efficiency.
Range of Chiller Efficiencies
Chiller efficiency is measured as Coefficient of Performance (COP). COP is defined as “the ratio of the rate of heat removal to the rate of energy input”. This measurement is also quoted at Full Load capacity of the chiller or at Part Load conditions. The development of the Integrated Part Load Value (IPLV) when assessing the performance and efficiency of chillers is significant especially considering that operation is usually at ‘off design(99%)’ rather than ‘design conditions (1%)’ for a majority of its operating time. The IPLV provides a single measure of efficiency weighted by the amount of time operating at full and part load conditions.
It would appear that a majority of chillers now benchmark their ratings, capacity and efficiency, against current international test procedures and standards. The main driver for this process has been the need to assure consistent treatment for ratings of similar products by the industry in general. The majority of chiller equipment is rated and tested according Air-Conditioning and Refrigeration Institute (ARI) 550/590 or the EUROVENT Certification Programme (EUROVENT2) procedures. In the USA their efficiency levels are benchmarked against ASHRAE Standard 90.1 which is a “proxy” MEPS for Chillers in the USA, and applies to new building construction.
In Australia, based on surveys of major suppliers, the estimated average efficiency for Australian chillers are shown in Table 2. This data reveals that in comparison with the ASHRAE Standard 90.1 benchmark (see Table 18 page A-7), Australian chillers are consistently less efficient than the de facto benchmark.
2 EUROVENT is an organisation to representing the European ventilating, air conditioning and refrigeration manufacturers and national trade associations on international and European issues.

E3 Committee CBA: MEPS and Alternative Strategies for Chillers August 2007
18
Table 2: Chiller Efficiency in Australia (estimated from surveys 2006-07)
Chiller Type Capacity (kWR) COP of Australian Units < 350 kWr 2.47 >350 - < 500 kWr 2.55 >500 - < 700 kWr 2.55 >700 - < 1000 kWr 2.63
Air-Cooled
>1000 kWr 2.63 < 350 kWr 4.23 >350 - < 500 kWr 4.63 >500 - < 700 kWr 4.77 >700 - < 1000 kWr 5.07 >1000 - < 1500 kWr 5.23
Water-Cooled
>1500 kWr 5.50
The range of efficiency for chillers is large with COP for air-cooled chillers ranging from 2 to 3.2. Figure 8 shows the range of efficiency by capacity for air-cooled units registered on the EUROVENT database in Europe. The chiller suppliers in Australia and New Zealand have confirmed that many of the units registered in Europe are available in Australia.
Figure 8: Chiller Efficiency (COP) of Air-Cooled Units by Capacity
1.8
2
2.2
2.4
2.6
2.8
3
3.2
3.4
0 200 400 600 800 1000 1200 1400 1600 1800 2000
Cooling Capacity (kWr)
CO
P
Source: EUROVENT 2006

E3 Committee CBA: MEPS and Alternative Strategies for Chillers August 2007
19
Chiller Efficiency and Australian and New Zealand Building Standards
In order to improve the overall energy efficiency of commercial buildings, a MEPS for chillers has been introduced into the Building Code of Australia and proposed in the New Zealand Building Code (NZBC). The MEPS levels for Australia and New Zealand are the same and are shown in Table 3.
Table 3: Building Code of Australia and Proposed NZ Building Code MEPS
Chillers Capacity (KWr) Min COP Min IPLV >125- < 525 kWr 2.20 3.05 Air-Cooled >525 kWr 2.50 3.10 >125- < 525 kWr 4.20 5.20 >525- < 1000 kWr 4.50 5.60
Water-Cooled
>1000 kWr 5.50 6.10
The use of MEPS for chillers in the Building Code of Australia (BCA) and the NZBC will help to improve the efficiency level of some Australian/NZ chillers, but the use of the Standards has some limitations. The Building Code of Australia (ABCB 2006) and the NZBC is applicable to new buildings, and so will not affect the replacement of chillers in existing buildings which constitute about 40% of annual chiller sales. The impact of the BCA is further reduced due to not all jurisdictions in Australia using and enforcing the Building Standards.
A further difficulty is that the BCA/NZBCA MEPS is not set at current regulatory best practice levels, the ASHRAE Standard 90.1. This suggest that though the existence of the Building Standard should eliminate the worst of the inefficient chillers being installed in new buildings, greater efficiencies could still be achieved in this market.
Chiller Cost versus Efficiency
For chillers with capacity between 350 and 1000 kW, the additional cost of choosing a higher efficiency unit over standard efficiency is between 12% and 20%. This is estimated based on the results of interviews with industry representatives. This implies that energy savings over the life of the chiller would need to produce energy cost savings greater than 12-20% of the cost of the chillers to produce a positive net cost-benefit.
On the basis of overseas markets, particularly Canada and the USA, studies have found cost effective efficiency improvements are achievable. In Canada (NRCan 2003), a benefit-cost analysis was undertaken to determine the economic attractiveness of improving the energy efficiency of packaged water chillers. The net present value, calculated by subtracting the present value of the incremental costs from the present value of the incremental savings over the life of the product, is chosen as the indicator of economic attractiveness. The base case analysis used a 7% social discount rate, as prescribed by Treasury Board Secretariat of Canada. The NRCan market study revealed that most chillers already meet the proposed efficiency levels. Only two categories were

E3 Committee CBA: MEPS and Alternative Strategies for Chillers August 2007
20
analysed in greater detail because there were a significant number of units that are below the proposed efficiency levels. These categories were:
• air-cooled with condenser, less than 528 kW (150 tons) • water-cooled centrifugal, greater than 1055 kW (300 tons)
For air-cooled units of less than 528 kW, the net financial result was slightly negative if the proposed levels were implemented. Since most equipment in this category meets the proposed minimums, NRCan decided to go ahead and adopt the proposed minimum level. For centrifugal chillers of more than 300 tons, the analysis shows a significant economic benefit in adopting the proposed minimum.
Testing Standards for Chillers
A new standard is under development that defines the methods of measuring and rating the efficiency of liquid-chilling packages using the vapour compression cycle and will be published as AS/NZS 4776.1.1:200X and AS/NZS 4776.1.2:200X (Standards Australia 2007). This standard is based on ISO document PWD 19298-1. The method of test and rating is also directly comparable to the ARI 550/590 and the method required for registration to the EUROVENT certification program.
2.4 Assessment of Market Deficiencies and Failures
The choice of a chiller can affect the energy usage requirements of a building, with case studies showing $10,000s of saving due to the replacement of inefficient chillers. As the installation of more energy efficient chillers need not lead to higher initial installation costs, it would appear the market should automatically move towards the installation of more efficient chillers. However, there are several factors which contribute to deficiencies in the chiller market and make this outcome less likely (Energy Strategies 2006), these being:
• A developer may manage the construction of the building with the intention of selling it, so they have no direct motivation to choose the most efficient technologies for the building.
• Many commercial buildings are tenanted, so the landlord may have no direct motivation to choose the most efficient technologies for the building, as energy costs will be passed through to the tenants.
• Tenants, who could be motivated to choose efficient chillers, have no influence over building infrastructure decisions.
• Chillers may be chosen and installed by sub-contractors, to meet design specifications, but unless these specifications include energy efficiency requirements the sub-contractors will not be required to choose the most energy efficient chiller.

E3 Committee CBA: MEPS and Alternative Strategies for Chillers August 2007
21
• There may be a lack of knowledge in the market of the energy and cost impact of choosing efficient versus inefficient chillers, reducing the likelihood of more efficient chillers being chosen.
The result of this disconnect between the rewards of choosing energy efficient chillers, i.e. lower energy costs, and the authority to select the chiller, means cost-efficiencies alone will not be sufficient to drive the uptake of more efficient chillers.

E3 Committee CBA: MEPS and Alternative Strategies for Chillers August 2007
22
3 Objectives of Strategies 3.1 Objective
The objective of the proposed strategies for chillers is to bring about reductions in Australia’s and New Zealand’s greenhouse gas emissions below what they are otherwise projected to be (i.e. the “business-as-usual” case), in a manner that is in the broad community’s best interests.
To be effective for manufacturers and suppliers the proposed strategy should be in accord with international test methods and marking requirements as these are internationally traded goods.
Within the objective, it must also provide a broad positive financial benefit to end consumers, without compromising product quality or functionality.

E3 Committee CBA: MEPS and Alternative Strategies for Chillers August 2007
23
4 Proposed Strategies The range of potential strategies considered for achieving the objective of reducing the power consumption of chillers including:
• Status Quo or business as usual; • Voluntary efficiency standards; • Voluntary certification program; • Levies and emissions trading; • Dis-endorsement labelling; • Mandatory energy labelling • Mandatory Energy Performance Standards.
These options will be discussed below.
4.1 Status Quo (BAU)
Net energy consumption from all types of chiller products in Australia is currently estimated to be approximately 4,800 GWh per annum, equivalent to annual greenhouse emissions of 5 Mt CO2-e in 2006. Correspondingly the net energy consumption from all types of chiller products in New Zealand have been estimated to be approximately 860 GWh per annum, equivalent to annual greenhouse emissions of 470 kt CO2-e in 2006.
If the current market and technology trends continue, the net energy resulting from the use of chillers is projected to grow to over 8,380 GWh in Australia and around 1,460 GWh in New Zealand by the year 2020. These estimated BAU projections of energy usage depend on assumptions and data regarding the sales, power consumption and usage characteristics of chillers. Detailed projections of sales are provided in Section 5.5, while Appendix 6 and Appendix 10 provide the power consumption and usage characteristics. In summary, the BAU COP for chillers by category was assumed to be constant over the period of the analysis (2000 – 2020), with the figures shown in Table 2 used for the BAU scenario. Industry sources noted that further technology improvements to chillers will have little effect on improving the efficiency, and that all improvements have now been extracted from these mature technologies. New types of chillers with improved efficiency are available that improve the part load performance. Industry reported that the efficiency of chillers sold has been static for the last 7 years.
Usage of chillers at various loadings is based on consultation with Australian suppliers. Alternative analysis of the usage data is conducted to test the degree of sensitivity these inputs have on the CBA. The BAU scenario assumes that usage does not change over the forecast period and the sensitivity of this variable is tested in Section 5.4. As noted above, BAU power consumption is forecast to remain constant over the period 2000 – 2020 as the BAU efficiency has reached a plateau without any regulatory intervention.

E3 Committee CBA: MEPS and Alternative Strategies for Chillers August 2007
24
Table 1, page 13, provides the estimated net energy consumption for all Australian states and territories, Australia as a whole, and New Zealand for the years 2000 to 2020 under the BAU conditions.
4.2 Voluntary Efficiency Standards
Voluntary efficiency standards are a policy option that encourages equipment suppliers and/or manufacturers to voluntarily meet certain minimum energy efficiency levels, i.e. in the absence of regulation.
This option can be effective when there are a relatively small number of suppliers with highly similar products and they are willing to agree to the introduction of the voluntary efficiency standards for a product. This may occur when the few suppliers perceive there will be advantages in meeting such standards in terms of public relations and brand positioning. However, when there are large numbers of suppliers it is more difficult to obtain agreement to the voluntary efficiency standards from a sufficient number of suppliers for the voluntary efficiency standards to have a significant impact on the energy efficiency of the products entering the market.
It is estimated that there are 15 importers and three local manufacturers of chillers serving the Australian market and 8 importers in New Zealand. Therefore to introduce voluntary efficiency standards, it would be necessary to convince the majority of importers of these chillers to voluntarily impose restrictions on the equipment they will import to Australia. Given that Australia will constitute a very small minority of these suppliers’ overall market, it is not realistic to believe that these suppliers will agree to voluntary standards. Consultation with industry stakeholders from a wide range of supplier companies (both those that supply the larger chillers and those who supply smaller chillers) supported this view. Stakeholders believed:
• Mandatory MEPS should be implemented for Australia • A voluntary program might be effective in raising awareness for energy
efficiency issues. However, it was generally felt that without code and legislative reinforcement there was no ongoing incentive to maintain compliance, especially from what is considered the “bottom end” of the chiller market place.
Compliance with a voluntary approach is an issue as the introduction of the voluntary efficiency standards could result in suppliers being required to decrease their model ranges to eliminate less efficient models, or to upgrade these models to meet the voluntary efficiency standards. There are few or no commercial incentives for suppliers to do this, especially as Australia and New Zealand are such a relatively small market, so it is unlikely that all suppliers would be willingly make these changes without significant government incentives. Also suppliers that agree to meet the standard may be placed at a commercial disadvantage compared to suppliers that do not participate, as non-participants might be able to sell their appliances at a price advantage, thus potentially increasing the net energy consumption of chillers.

E3 Committee CBA: MEPS and Alternative Strategies for Chillers August 2007
25
There appear to be no international examples of voluntary energy efficiency standards relating to chillers.
4.3 Voluntary Certification Program
A voluntary electrical performance certification program involves suppliers submitting their products for objective testing and, if the products perform satisfactorily, then the products can be labelled as ‘certified’ to fulfil the required energy efficiency performance requirements or listed as certified products on a relevant website etc. The intention is that this provides information and encouragement for customers to purchase more efficient products and motivates suppliers to improve the efficiency of their products.
Internationally, manufacturers of chillers have participated in the testing and rating of their products by using standards such as Air-Conditioning and Refrigeration Institute (ARI) who represent the North American suppliers and EUROVENT, who represent the European air conditioning, ventilating and refrigeration manufacturers.
The purpose of these rating or “certification programs” is to create a common set of criteria for rating products. Through specification of certified products, the engineer's tasks are made easier, since there is no need for carrying out detailed comparison and performance qualification testing. Consultants, specifiers and users can select products with the assurance that the catalogue data is accurate.
These international programs do not act as certification programs in the sense of signifying that the products have meet a specific minimum energy efficiency requirement. The program acts to test and rate the performance of the chillers against agreed international standards.
As the majority of chillers installed in Australia/New Zealand are imported, we can assume that these will have been “certified” as the chillers will have been made in or are to be sold in the European or USA markets. Consequently it might be possible to convince all chiller importers to use the “certified” ratings of the chillers to develop a voluntary certification program for the Australian and New Zealand market. “Certified” products could be listed on a website and an education campaign conducted in the industry to raise awareness of the certification program. For Australian manufacturers some method of testing and certifying their chillers would need to be developed but this is probably possible.
The difficulty with the voluntary certification program is that like other voluntary information-type programs, there is a tendency for only the better performing products to participate in the program in an attempt to gain a marketing advantage over cheaper and poorer performing products. There is no market advantage for less efficient products to participate in the program, or even for producers to participate who have products that vary from efficient to less efficient, so any program is likely to cover only a proportion of the chillers available.

E3 Committee CBA: MEPS and Alternative Strategies for Chillers August 2007
26
Another difficulty for a voluntary certification program is that this type of program will work best in a market where consumers are actively looking for efficient products but, as previously discussed, the energy efficiency of chillers is unlikely to be the primary driver in the selection of most chillers. Consequently, there is no strong underlying market driver which a certification program can tap into and use to produce a market transformation towards the use of more efficient chillers.
4.4 Dis-endorsement Label
The principle of a dis-endorsement label is to highlight that a product is energy inefficient. Manufacturers and suppliers will not apply such a negative label on their products voluntarily, so this must be a mandatory scheme. Manufacturers and suppliers would be expected to strongly oppose the introduction of such a scheme.
A dis-endorsement label is very unlikely to be effective for chillers, as chillers are not a retail item but are sold on the basis of their technical specifications and price. Consequently the label would not be seen until the product is being installed, and it would only be seen by the installation contractor and probably not by the end-purchaser, the building owner or developer. The resulting impact of the dis-endorsement label scheme is therefore likely to be minimal.
The introduction of a dis-endorsement label program would therefore appear to be unjustified and inappropriate in Australia and New Zealand.
4.5 Levies and Emissions Trading
One way of increasing the uptake by the market of more energy efficient chillers is to increase the purchase cost or operating costs of the inefficient products from the consumer’s perspective. This can be done by raising the price of the chillers via a levy or by raising the price of the energy the product consumes. Both options will be discussed.
Equipment Levy
The equipment levy involves imposing upon inefficient models a levy which would raise the prices of the chillers. The funds raised could be used to fund programs which would reduce the greenhouse impact of using the chillers. The revenue raised from the levy could be diverted to greenhouse-reduction strategies unrelated to the efficiency improvement of the chillers or used to subsidise the costs of more efficient models of chillers in order to reduce any cost differentials between these and inefficient models.
There are significant issues surrounding the measurement of chillers, the costs of collecting such a levy and the allocation of the resulting funds which would need to be addressed in order to implement this option. It is also unclear how such a levy scheme could be efficiently managed and whether the costs of implementing such as scheme could be justified in terms of its impact. It is also understood that the use of such levies are not currently government policy, so this option will not be considered further.

E3 Committee CBA: MEPS and Alternative Strategies for Chillers August 2007
27
Electricity Levy
At present, electricity prices are sufficiently low that energy efficiency has not been a critical issue in the design of heating and cooling systems for buildings and in the selection of chillers. This is especially true when new buildings are being developed to be sold or for tenanted buildings. The imposition of a government levy on electricity prices or the introduction of emissions trading would raise the developers, building owners and tenants’ consideration of the energy efficiency of buildings and hence chillers and might encourage the uptake of more efficient chillers.
A low level electricity levy is currently already applied in New Zealand. The revenue from this levy is presently used to fund the operations and functions of the Electricity Commission, including some targeted electricity efficiency research and capital upgrade projects. However, none of these projects currently relate to the use or efficiency of chillers.
Carbon Emissions Trading Scheme
On 3 June 2007, the Prime Minister announced that Australia will implement a domestic emissions trading system (ETS) beginning no later than 2012, and that the Government will set a national emissions target in 2008.
The Federal Government’s Mandatory Renewable Energy Target (MRET) program and New South Wales’ Greenhouse Gas Reduction Scheme (GGAS) are examples of programs that have imposed some of the costs of greenhouse gas emission impacts on energy suppliers, which will have flow-on effects on retail energy prices. However, the implementation of a cap and trade greenhouse emissions trading scheme, such as that announced in June 2007, could lead to the full cost of the greenhouse gas emissions impacts being reflected in energy prices.
The nature of the Australian ETS and the impact on the costs and benefits of the proposed policy approach for chillers cannot be determined until the Government has decided operational details of the ETS and until modelling of future electricity prices is available. The impact of an ETS on the CBA analysis is discussed in Section 5.6 and Appendix 7.
However, it is unclear if an ETS alone would impact on the energy efficiency of chillers. The energy price rises that might flow from the introduction of an ETS are unlikely to quickly lead to purchasers being concerned about the energy efficiency of chillers as discussed in earlier sections.
In addition, MEPS will complement the emissions trading scheme, as noted in the Report of the Task Group on Emissions Trading (Australian Government 2007):
“Emissions trading is not a panacea. A comprehensive response will involve complementary measures that address market failures not corrected by the emissions
E3 Committee CBA: MEPS and Alternative Strategies for Chillers August 2007
28
trading scheme. ... There will also be a continuing role for policies that improve information, awareness and adoption of energy-efficient vehicles, appliances and buildings.” (p 12)
“Beyond information-based policies, energy efficiency policies could target areas where market barriers are likely to be more fundamental and enduring. This is likely to be in areas where consumers make infrequent decisions and where it is difficult to judge the energy and emissions implications. There is a good case for continuing the development of well-designed and consistent regulated minimum energy standards for buildings and household appliances. Purchases of energy-efficient products can have a large impact on aggregate emissions over time, and reduce the impact on household budgets of any rise in carbon prices.” (p 135);
Hence it is concluded that an emissions trading scheme on its own is unlikely to affect chiller energy performance or market take-up.
4.6 Mandatory Energy Labelling
Mandatory energy labelling requires the application and display of a comparative energy performance label on products and packaging. It is to provide consumers with a visual display of the performance of one product relative to another. Energy labelling requires the establishment of relative energy levels and a rating system.
As chillers are not sold to consumers but are a business product, sold on the basis of their technical specifications and price, energy labelling is highly unlikely to affect the market for more efficient chillers. Also the label would not be seen until the product is being installed, and it would only be seen by the installation contractor and probably not by the end-purchaser, the building owner or developer. The resulting impact of the mandatory energy labelling scheme is therefore likely to be minimal.
Mandatory Energy labelling for chillers therefore is not considered likely to influence the purchase decision of chillers and so this strategy is not assessed any further.
4.7 Mandatory Minimum Energy Performance Standards
Minimum Energy Performance Standards (MEPS) aim to remove the worst performing products from the marketplace, rather than promoting the best. In Australia and New Zealand, this is achieved by including the energy performance criteria within an Australian/New Zealand Standard which is mandated through legislation. A proposed MEPS that covers all chillers with capacity of ≥ 350 kWr is described in the following section.
As Australia and New Zealand suppliers source product that is typically rated under the USA/EUROVENT test method and the USA now have introduced the most stringent international MEPS levels, it is proposed to match the USA and Canada MEPS levels for chillers in Australia. Table 4 shows the proposed MEPS levels for Australia, based on the

E3 Committee CBA: MEPS and Alternative Strategies for Chillers August 2007
29
USA MEPS and taking into account the simplification of these levels to cover all air-cooled and all water-cooled chillers with capacities greater than or equal to 350 kWr.
Table 4: Proposed Australian Chiller MEPS Levels
Chiller Type Capacity (kWr) Minimum COP Minimum IPLV < 350 kWr N/A* N/A*
≥350 - < 500 kWr 2.70 3.70 >500 - < 700 kWr 2.70 3.70 >700 - < 1000 kWr 2.70 4.10
Air-Cooled
>1000 kWr 2.70 4.10 < 350 kWr N/A* N/A*
≥350 - < 500 kWr 5.00 5.5 >500 - < 700 kWr 5.10 6.0 >700 - < 1000 kWr 5.50 6.2 >1000 - < 1500 kWr 6.00 6.5
Water-Cooled
>1500 kWr 6.20 6.5
* These products may be regulated at a later date.
Like the USA, the proposed MEPS levels apply to both the COP and the Integrated Part Load Value (IPLV).
Based on the USA and other countries such as Canada and Chinese Taipei, and as the market for Australian and New Zealand chillers is generally specified with the ARI, ASHRAE and EUROVENT standards, the Australian and New Zealand MEPS levels will ensure our product matches world best regulatory practice. The E3 Committee’s operating instructions under The National Framework for Energy Efficiency are that Australia will set MEPS at levels “to match world’s best regulatory practice, but with a suitable time-lag to allow local industry to adapt” (AGO 2007).
The USA have issued a revised ASHRAE 90.1-2004 which includes all the addenda issued since 1999 and revised code format. ASHRAE are again revising 90.1 standard and soon will issue a new ASHRAE Standard 90.1-2007. At this stage, the MEPS levels for chillers in the new ASHRAE 90.1-2007 are not known, but these levels could be introduced into the Australian/New Zealand Standard as the “High Efficiency” levels, similar to the levels specified for “Class A” Efficiency of air conditioners in the AS 3823.2. This will be reviewed with the appropriate standards committee as required.
4.8 Conclusions
The voluntary options presented in the earlier sections are either not effective or practical or else they are not appropriate. These alternative options are assessed as less effective at reducing GHG emissions from BAU. In addition, mandatory labelling is not a practical or appropriate for chillers.

E3 Committee CBA: MEPS and Alternative Strategies for Chillers August 2007
30
The proposed MEPS regime for chillers is to be a mandatory scheme, which is in keeping with stakeholder feedback. When industry was consulted there was concern raised that a voluntary scheme would not be effective but a mandatory scheme produces a level playing field.
In conclusion, the most effective way to reduce GHG emissions caused by chillers is to introduce MEPS. This is the option that is subsequently assessed in this study in terms of costs, benefits and impacts on consumers, taxpayers and industry.

E3 Committee CBA: MEPS and Alternative Strategies for Chillers August 2007
31
5 Cost-Benefit and Other Impacts This section presents the costs, benefits and other impacts of the MEPS for chillers. Most of the assumptions that apply to Australia also apply to New Zealand as the products likely to be sold in NZ are similar to Australia. As such, results that are commonly applicable to both Australia and New Zealand do not contain a direct reference to either country. In other cases, results and discussions are provided concurrently for both countries as the analysis reflects the results based on differing conditions specific to each country. The product stock modelling framework is explained in Appendix 4: Stock and Sales.
5.1 Costs to the Taxpayer
The proposed MEPS program will impose costs on governments. Some of these are fixed and some vary from year to year. The government costs comprise:
• Administration of the program by government officials (salaries and overheads, attendance at E3 and Standards meetings etc);
• Cost of maintaining a registration and approval capability; • Random check testing to protect the integrity of the program; • Costs of producing leaflets and other consumer information; and • Consultant costs for standards development, market research and analysis,
Regulatory Impact Statements, etc.
The government costs have been estimated as follows, which are similar to the allocations made for other products regulated by E3:
• Salary and overheads for officials administering the program: $50,000 per year; • Check testing, research and other costs underpinning the program: $75,000
per year, half of it borne by the Commonwealth and the other half by other jurisdictions in proportion to their population, in accordance with long-standing cost-sharing arrangements for E3 activities; and
• Education and promotional activities at $25,000 per year.
Hence total government program costs are estimated to be $150,000 per annum.
These costs have been included in the national cost-benefit analyses in later sections.
5.2 Business Compliance Costs
Responsibility for compliance with the MEPS lies with the importer or supplier of the product. This analysis assumes that any increases in product design and construction costs will be passed on to customers in the form of higher purchase prices. The Business Cost Calculator (OBPR 2006) has been used as a basis to the calculation of the costs for compliance with the MEPS. The costs of compliance were identified as follows:

E3 Committee CBA: MEPS and Alternative Strategies for Chillers August 2007
32
• Education – which involves maintaining awareness of legislation and regulations, and the costs of keeping abreast of changes to regulatory details.
• Permission – which involves applying for and maintaining permission for registration to conduct an activity, usually prior to commencing that activity.
• Record Keeping – which involves keeping statutory documents up-to-date. The Purchase Cost category, which involves the costs of all materials, equipment, etc, purchased in order to comply with the regulation, was not included in the business compliance costs. This cost category was interpreted as the cost of design changes to the products to ensure that they meet the required power levels and these costs are explicitly included in the costs benefits analysis as increased purchase costs to the consumer.
Therefore the tasks, categories and costing assumptions are provided in Table 5.
Table 5: Business Cost Calculation Inputs
Category Task Cost Inputs Source Education Train staff, keep up-to-date
with regulations 80 hours/year per supplier Estimated from other MEPS
programs
Permission Rating to EUROVENT or ARI $500 per model supplied Based on international sources
Permission Complete MEPS registration 8 hours per model supplied Estimated from other MEPS programs
Record Keeping Maintain documents for 5 years
8 hours per 5 years per supplier
Estimated from other MEPS programs
Other inputs: Staff costs $40/hr Australian Jobs 2006
The total costs of business compliance for the MEPS are in proportion to the number of businesses importing/suppling chillers and the number of models supplied. Overall, some 350 unique models are estimated to be currently supplied from approximately 18 suppliers, or an average of approximately 20 models per supplier.
The Business Costs Calculator was used to determine the costs per business, and then these costs were allocated on a “per model” basis for the cost-benefit analysis. The RIS cost-benefit analysis models the costs on the basis of each model supplied to the market in a particular year, as this approach provides a greater certainty to the costing of MEPS. The total costs calculated are shown in Table 6.

E3 Committee CBA: MEPS and Alternative Strategies for Chillers August 2007
33
Table 6: Business Compliance Costs for Chiller MEPS (AUD)
Category Task Costs / business
Costs / model
Education Train staff, keep up-to-date with regulations $3,200 $163 Permission Rating to EUROVENT or ARI (proportion
allocated to Australian supplier) $9,833 $500
Permission Complete MEPS registration $6,293 $320 Record Keeping Maintain documents for 5 years $320 $16 Total $19,647 $999
These costs represent approximately $354,000 to the suppliers in the first year of MEPS, based on 18 chiller suppliers. This cost-benefit assumes that new models are introduced to the market each year and hence are required to be registered. Sensitivity analysis of these estimated costs shows that if these compliance cost increase by 100%, the effect on the cost-benefit is minimal. As the majority of importing companies already rate their chillers to ARI or EUROVENT, the permission cost is likely to be significantly lower than the amount estimated in Table 6.
5.3 Industry, Competition and Trade Issues
Industry Issues
This section reviews the impacts of the proposal/s on suppliers. In the chiller product supply market, there are estimated to be approximately 18 suppliers; some are specific suppliers of particular product categories while others are multi-national air conditioning companies. The vast majority of chillers are imported into Australia/New Zealand. These importers and manufacturers vary in size, however all have some internal capacity to respond to the costs that the proposed regulations will place on them. According to industry representatives, almost all the chillers of ≥ 350 kWr capacity are imported. The majority of the chillers products are typically registered with the ARI or EUROVENT certification programs and hence the costs of efficiency testing are already incorporated in the suppliers pricing structure. There are suppliers who are not registered in either program and they would have an increased cost to their business if they choose to join either program.
Most energy efficiency regulations envisage an increase in average equipment costs due to changes in the design of the product to improve the energy efficiency of the product. This is likely to be the case with chillers. Retail/contractor price increases due to the requirements of the chiller MEPS are modelled in the CBA and range from 12% – 22% for air-cooled chillers and approximately 15% for water-cooled chillers. These incremental price increases are modelled to gradually reduce by 10% pa from 2008 to reflect the improvements in manufacturing processes and increasing competitiveness of the industry due to greater availability of MEPS compliant chillers. This gradual reduction in the incremental costs associated with more efficient MEPS compliant chillers results in an incremental cost increase of 3 – 6% by 2020. Table 7 presents the estimated

E3 Committee CBA: MEPS and Alternative Strategies for Chillers August 2007
34
incremental price increase due to the MEPS requirements by year for the base scenario modelled in the CBA.
Table 7: Incremental Price Increase (AUD) Due to MEPS Requirements by Year
Category 2008 2009 2010 2011 2012 2013 2014 2015 2020 Air-Cooled >350 - < 500 kW
$15,000 $13,500 $12,150 $10,935 $9,842 $8,857 $7,972 $7,174 $4,236
Air-Cooled >500 - < 700 kW
$18,000 $16,200 $14,580 $13,122 $11,810 $10,629 $9,566 $8,609 $5,084
Air-Cooled >700 - < 1000 kW
$15,000 $13,500 $12,150 $10,935 $9,842 $8,857 $7,972 $7,174 $4,236
Air-Cooled >1000 $20,000 $18,000 $16,200 $14,580 $13,122 $11,810 $10,629 $9,566 $5,649 Water-Cooled >350 - < 500 kW
$10,000 $9,000 $8,100 $7,290 $6,561 $5,905 $5,314 $4,783 $2,824
Water-Cooled >500 - < 700 kW
$10,000 $9,000 $8,100 $7,290 $6,561 $5,905 $5,314 $4,783 $2,824
Water-Cooled >700 - < 1000 kW
$15,000 $13,500 $12,150 $10,935 $9,842 $8,857 $7,972 $7,174 $4,236
Water-Cooled >1000 - < 1500 kW
$20,000 $18,000 $16,200 $14,580 $13,122 $11,810 $10,629 $9,566 $5,649
Water-Cooled >1500
$30,000 $27,000 $24,300 $21,870 $19,683 $17,715 $15,943 $14,349 $8,473
Source: Chiller supplier, confidential
The later sections examine the costs and benefits of the MEPS options from the perspective of consumers. It was assumed that all compliance costs incurred by suppliers are eventually passed on to buyers in the normal course of business. Hence, for the purposes of cost-benefit analysis, the cost impact on product suppliers as a group is neutral. The cost-benefit assessment provided in Section 5.4 assumes that the product suppliers recover the costs via an increase in the costs of the product to the consumer. As the benefits of the energy efficiency improvement accrue to the consumer, this approach allows for a consistent treatment of costs-benefits.
The supplier’s ability to use internationally recognised testing standards and certification schemes reduces the need for testing of products for different regions.
Trade
Mandatory energy efficiency regulations apply to all products sold, whether locally manufactured or imported. Nevertheless it is useful for decision-makers to know whether the proposals are likely to impact on the balance between local manufacture and imports, e.g. by affecting one group of suppliers more than another.
There are local manufacturers of chiller products in Australia or New Zealand. However, almost all this product is of capacities of less than 350 kWr, hence it is considered that the impact on local products will be minimal. Where a local supplier does provide chillers with output capacity of 350 kWr or greater that are required to be registered for MEPS,

E3 Committee CBA: MEPS and Alternative Strategies for Chillers August 2007
35
this supplier can either test the unit to the relevant Australian/New Zealand Standard or recognised international equivalent test and provide the details of their certification to the ARI or EUROVENT programs. Industry representatives have reported that they currently have units available that meet the required MEPS and are registered to the ARI or EUROVENT programs.
GATT issues
One of the requirements of the RIS is to demonstrate that the proposed test standards are compatible with the relevant international or internationally accepted standards and are consistent with Australia’s international obligations under the General Agreement on Tariffs and Trade (GATT) Technical Barriers to Trade (GTBT) Agreement. The relevant part of the GTBT Technical Regulations and Standards is Article 2: Preparation, Adoption and Application of Technical Regulations by Central Government Bodies. These are addressed below.
As almost all of the products addressed in the study are currently imported, MEPS would not favour local supplies against imports.
It is a particular concern of the GTBT that where technical regulations are required and relevant international standards exist or their completion is imminent, members should use them, or the relevant parts of them, as a basis for their technical regulations. The energy test procedure adopted by the Australian/New Zealand Standard replicates the ISO test and is comparable to the ARI and EUROVENT certification programs.
The GTBT urges GATT members to give positive consideration to accepting as equivalent the regulations of other Members, even if these regulations differ from their own, provided they are satisfied that these regulations adequately fulfil the objectives of their own regulations.
The design of the compliance program for the MEPS allows for the acceptance of the results of certifications to the ARI and EUROVENT programs.
In summary, the proposed regulations are fully consistent with the GATT Technical Barriers to Trade Agreement, and follow international standards where possible.
TTMRA
The Trans-Tasman Mutual Recognition Agreement (TTMRA) states that any product that can be lawfully manufactured in or imported into either Australia or New Zealand may be lawfully sold in the other jurisdiction. If the two countries have different regulatory requirement for a given product, the less stringent requirement becomes the de facto level for both countries unless the one with the more stringent requirement obtains an exemption under TTMRA.
As the Australia-NZ appliance and equipment markets are closely integrated, TTMRA issues arise if one country proposes to implement a mandatory energy efficiency measure

E3 Committee CBA: MEPS and Alternative Strategies for Chillers August 2007
36
but the other does not, if the planned implementation dates are different, or even if the administrative approaches are different (for example, Australian governments may require products sold locally to be registered with regulators, whereas New Zealand may not, so changing administrative and compliance verification costs).
The TTMRA is an issue that may arise if New Zealand does not implement the MEPS requirements, in accordance with the Standard, at the same time as Australian states and territories. However, the Australian and New Zealand regulators are working together within the E3 Committee and hence this is not envisaged as an issue.
Competition
Implementation of the proposed MEPS requirements is unlikely to affect the competitiveness of one supplier over another. The proposed MEPS addresses the energy efficiency performance of the chiller, not the overall performance of the unit, so consumer choice will not be affected. Industry representatives have reported that chillers that meet the required MEPS are readily available; however the issue of compliance and testing has been raised as a possible impediment to supplying units. If a supplier does not currently have EUROVENT or ARI certification of their products, the supplier would be required to either seek certification to these schemes or provide a test report of the performance of the chiller to the Australian Standard (or ISO/ARI/EUROVENT equivalent). As no known testing facilities are currently available in Australia or New Zealand to test chillers of <350 kWr capacity, the chiller would need to be tested overseas, or in the affiliated supplier laboratories in other countries. This would incur additional costs for the supplier. However the industry have reported that the instance of these cases would be small.
As the proposed MEPS is being applied to chillers with capacity output of 350 kWr or greater, there will be no impact on smaller chiller suppliers, who are mostly small importers and local manufacturers.
It is suggested that the MEPS is implemented as early as possible, but not before October 2008, which provides 4 years since the announcement of the proposal to enable industry to comply with these levels. Government/industry consultation has suggested that a 4-year period is appropriate for MEPS notification, based on product development lifecycles (i.e., the time required to adjust product design to meet the new MEPS levels). However, the industry have reported that MEPS compliant chillers are available for use now and would be easily available by the suggested implementation date of October 2008. The proposed MEPS does not penalise products with additional features, as the MEPS only affect the efficiency, which is not generally dependant on the features or other characteristics available in the product such as output capacity or water temperatures. Consequently, there is unlikely to be any significant impact on the availability and range of models and hence consumer choice in New Zealand and Australia.
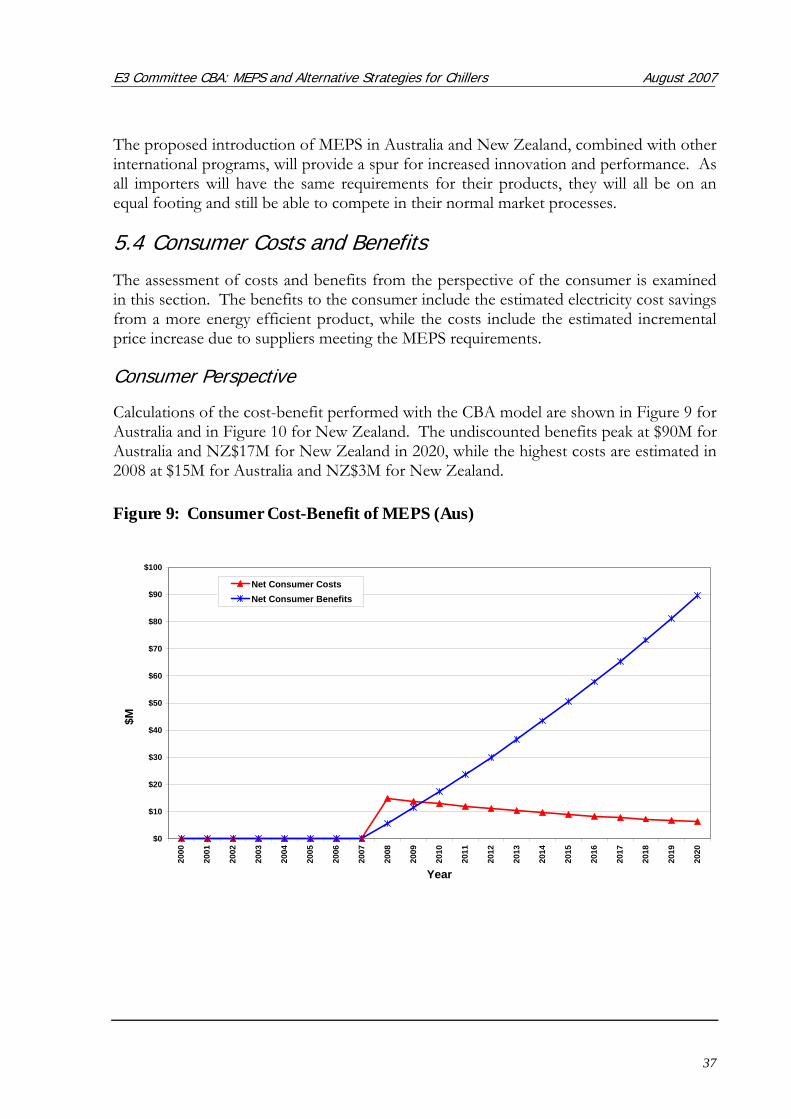
E3 Committee CBA: MEPS and Alternative Strategies for Chillers August 2007
37
The proposed introduction of MEPS in Australia and New Zealand, combined with other international programs, will provide a spur for increased innovation and performance. As all importers will have the same requirements for their products, they will all be on an equal footing and still be able to compete in their normal market processes.
5.4 Consumer Costs and Benefits
The assessment of costs and benefits from the perspective of the consumer is examined in this section. The benefits to the consumer include the estimated electricity cost savings from a more energy efficient product, while the costs include the estimated incremental price increase due to suppliers meeting the MEPS requirements.
Consumer Perspective
Calculations of the cost-benefit performed with the CBA model are shown in Figure 9 for Australia and in Figure 10 for New Zealand. The undiscounted benefits peak at $90M for Australia and NZ$17M for New Zealand in 2020, while the highest costs are estimated in 2008 at $15M for Australia and NZ$3M for New Zealand.
Figure 9: Consumer Cost-Benefit of MEPS (Aus)
$0
$10
$20
$30
$40
$50
$60
$70
$80
$90
$100
2000
2001
2002
2003
2004
2005
2006
2007
2008
2009
2010
2011
2012
2013
2014
2015
2016
2017
2018
2019
2020
Year
$M
Net Consumer CostsNet Consumer Benefits

E3 Committee CBA: MEPS and Alternative Strategies for Chillers August 2007
38
Figure 10: Consumer Cost-Benefit of MEPS (NZ)
$0
$2
$4
$6
$8
$10
$12
$14
$16
$1820
00
2001
2002
2003
2004
2005
2006
2007
2008
2009
2010
2011
2012
2013
2014
2015
2016
2017
2018
2019
2020
Year
$M
Net Consumer CostsNet Consumer Benefits
The benefits increase from 2008 to 2020 in line with the increase of the MEPS compliant product in the overall stock of chillers. The consumer benefits continue to grow as a result of cohorts of new, more efficient products (compared to the BAU) coming into use each year.
As noted earlier in Section 5.3, the estimated cost increase due to the MEPS could be up to 22% in 2008 and then it gradually reduces. The net consumer costs shows this gradual reduction from 2008 to 2020. The data for New Zealand shows a similar result.
The individual consumer costs and benefits of the MEPS in 2008 are shown in Table 8. The present value of the benefits is discounted over an estimated average 15 service year life of the products (see Appendix 4).

E3 Committee CBA: MEPS and Alternative Strategies for Chillers August 2007
39
Table 8: Present Value Costs and Savings – Chiller MEPS, 7.5% Disc Rate
Category Incremental Price Increase
Estimated Annual Energy Savings (MWh/yr)
Energy Costs Savings/year1
Present Value Cost Savings (15yrs)1
Air-Cooled >350 - < 500 kW $15,000 33 $4,863 $36,187 Air-Cooled >500 - < 700 kW $18,000 55 $8,190 $60,951 Air-Cooled >700 - < 1000 kW $15,000 37 $5,566 $41,423 Air-Cooled >1000 $20,000 68 $10,129 $75,380 Water-Cooled >350 - < 500 kW $10,000 18 $2,615 $19,460 Water-Cooled >500 - < 700 kW $10,000 42 $6,208 $46,202 Water-Cooled >700 - < 1000 kW $15,000 31 $4,583 $34,107 Water-Cooled >1000 - < 1500 kW $20,000 51 $7,652 $56,947 Water-Cooled >1500 $30,000 34 $5,132 $38,194
1. The costs savings are based on an Australian average tariff of 14.9c/kWh. In New Zealand, the cost saving would be larger due to the higher electricity tariff of 16 c/kWh.
As Table 8 demonstrates, the value of the benefits are substantially larger (by a factor of at least 1.3) compared to the costs regardless of the product category. Many of the product categories demonstrate benefits that are 3 times greater than the costs.
It is considered that small business do not purchase chillers ( as they are usually installed in large commercial sector buildings) and hence no analysis is required of the specific impacts to small businesses.
Cost of Forgoing Product Features
The design of chillers are controlled by standards/specifications covering areas such as electrical safety, refrigerants and other performance issues. The MEPS does not affect the power consumption of various features of products and hence there is no forgoing of product features due to the MEPS. The improvement to energy efficiency required to meet the MEPS can easily be achieved by changes to the design of the product and will not result in the loss of product features. In fact many chillers already meet the proposed MEPS as demonstrated in the EUROVENT certification program data (see Figure 8).
Distributional Impact
This section provides an analysis of impacts on consumers with respect to patterns of usage different to the base model used for the CBA analysis. These impacts are modelled on Australian data, which provides a more conservative assessment. The results would also be applicable to New Zealand. However the benefits are larger due to the higher electricity tariff. Table 9 shows the impact for usage where the consumer reduces by 20% the time the chiller is used in the low usage scenario. Similarly, the high usage scenario increases the time the chiller is used by 20%. Full details of these scenarios are shown in Appendix 6, Table 27. Data for the base MEPS analysis is as per Table 8, which is the NPV analysis over 15 years at 7.5% discount rate.

E3 Committee CBA: MEPS and Alternative Strategies for Chillers August 2007
40
Table 9: Present Value Costs and Savings: Varying Usage - MEPS, 7.5% Disc Rate
Category Usage Case
Estimated Annual Energy Savings (MWh/yr)
Energy Costs Savings/year1
Present Value Cost Savings (15yrs)1
Air-Cooled >350 - < 500 kW Low 26 $3,890 $28,950 Air-Cooled >500 - < 700 kW Low 44 $6,552 $48,761 Air-Cooled >700 - < 1000 kW Low 30 $4,453 $33,138 Air-Cooled >1000 Low 54 $8,103 $60,304 Water-Cooled >350 - < 500 kW Low 14 $2,092 $15,568 Water-Cooled >500 - < 700 kW Low 33 $4,967 $36,961 Water-Cooled >700 - < 1000 kW Low 25 $3,666 $27,286 Water-Cooled >1000 - < 1500 kW Low 41 $6,122 $45,558 Water-Cooled >1500 Low 28 $4,106 $30,555 Air-Cooled >350 - < 500 kW High 39 $5,835 $43,424 Air-Cooled >500 - < 700 kW High 66 $9,828 $73,141 Air-Cooled >700 - < 1000 kW High 45 $6,679 $49,708 Air-Cooled >1000 High 82 $12,155 $90,456 Water-Cooled >350 - < 500 kW High 21 $3,138 $23,352 Water-Cooled >500 - < 700 kW High 50 $7,450 $55,442 Water-Cooled >700 - < 1000 kW High 37 $5,500 $40,928 Water-Cooled >1000 - < 1500 kW High 62 $9,183 $68,337 Water-Cooled >1500 High 41 $6,159 $45,832
1. The costs savings are based on an Australian average tariff of 14.9c/kWh. In New Zealand, the cost saving would be larger due to the higher electricity tariff of 16 c/kWh.
In general, the low usage case decreases the benefits to the consumer compared to the base scenario, while the high usage case increases the consumer benefit. This is due to the lower energy savings potential if the chiller is operated for less time. Conversely, the benefits increase if the chiller is operated for more time. The lowest benefit is found for water-cooled chillers of > 1500 kWr where the present value benefits are equal to the incremental cost in the low usage case.
5.5 Impact on Energy Use and Greenhouse Gas Emissions
Sales Forecasts
Since the MEPS criteria apply only to new products entering the market, it will be a number of years before these measures impact on the stock of existing products to any major extent. Therefore two scenarios have been modelled in the CBA; a Base Sales scenario with product sales continuing to increase at a rate of approximately 3 – 4% pa and a Low Sales scenario with sales only increasing by 0.5 – 0.7% pa from 2008. Forecast sales of chillers to 2020 by category are shown in Figure 11 for Australia and in Figure 12 for New Zealand.

E3 Committee CBA: MEPS and Alternative Strategies for Chillers August 2007
41
Annual sales by category of product are forecast from trends produced from estimates of sales reported by industry and AREMA. The historical and forecasts sales figures developed for the CBA take into account the mix of effectively competing technologies (air-cooled and water-cooled chillers). Recent trends show that the sales of air-cooled chillers are increasing and will probably continue to increase over the next 10 to 15 years. Detailed assessment of the sales of chillers is provided in Appendix 4: Stock and Sales.
Figure 11: Forecast Sales of Chillers - Base Sales Scenario Australia
y g y
0
200
400
600
800
1,000
1,200
1,400
2000
2001
2002
2003
2004
2005
2006
2007
2008
2009
2010
2011
2012
2013
2014
2015
2016
2017
2018
2019
2020
Year
Uni
ts/Y
ear
Air Cooled < 350 kWAir Cooled >350 - < 500 kWAir Cooled >500 - < 700 kWAir Cooled >700 - < 1000 kWAir Cooled >1000Water Cooled < 350 kWWater Cooled >350 - < 500 kWWater Cooled >500 - < 700 kWWater Cooled >700 - < 1000 kWWater Cooled >1000 - < 1500 kWWater Cooled >1500

E3 Committee CBA: MEPS and Alternative Strategies for Chillers August 2007
42
Figure 12: Forecast Sales of Chillers - Base Sales Scenario New Zealand
0
50
100
150
200
250
300
2000
2001
2002
2003
2004
2005
2006
2007
2008
2009
2010
2011
2012
2013
2014
2015
2016
2017
2018
2019
2020
Year
Uni
ts/Y
ear
Air Cooled < 350 kWAir Cooled >350 - < 500 kWAir Cooled >500 - < 700 kWAir Cooled >700 - < 1000 kWAir Cooled >1000Water Cooled < 350 kWWater Cooled >350 - < 500 kWWater Cooled >500 - < 700 kWWater Cooled >700 - < 1000 kWWater Cooled >1000 - < 1500 kWWater Cooled >1500
The current trends indicate that Base Sales scenario is more likely however many factors can influence these projections. If a slow down in the commercial building sector occurs, the sales growth would also reduce.
To simulate the impact of slowing in commercial sector growth, a forecast for chillers under a Low Sales scenario for Australia and New Zealand were undertaken and are shown in Figure 13 and Figure 14 respectively. It is considered unlikely that this scenario would develop given the historical sales of new product in Australia and New Zealand, so this low sales forecast scenario is utilised for sensitivity analysis of the CBA impact projections.

E3 Committee CBA: MEPS and Alternative Strategies for Chillers August 2007
43
Figure 13: Forecast Sales of Chillers - Low Sales Scenario Australia
0
100
200
300
400
500
600
700
800
900
2000
2001
2002
2003
2004
2005
2006
2007
2008
2009
2010
2011
2012
2013
2014
2015
2016
2017
2018
2019
2020
Year
Uni
ts/Y
ear
Air Cooled < 350 kWAir Cooled >350 - < 500 kWAir Cooled >500 - < 700 kWAir Cooled >700 - < 1000 kWAir Cooled >1000Water Cooled < 350 kWWater Cooled >350 - < 500 kWWater Cooled >500 - < 700 kWWater Cooled >700 - < 1000 kWWater Cooled >1000 - < 1500 kWWater Cooled >1500
Figure 14: Forecast Sales of Chillers - Low Sales Scenario New Zealand
0
50
100
150
200
250
2000
2001
2002
2003
2004
2005
2006
2007
2008
2009
2010
2011
2012
2013
2014
2015
2016
2017
2018
2019
2020
Year
Uni
ts/Y
ear
Air Cooled < 350 kWAir Cooled >350 - < 500 kWAir Cooled >500 - < 700 kWAir Cooled >700 - < 1000 kWAir Cooled >1000Water Cooled < 350 kWWater Cooled >350 - < 500 kWWater Cooled >500 - < 700 kWWater Cooled >700 - < 1000 kWWater Cooled >1000 - < 1500 kWWater Cooled >1500

E3 Committee CBA: MEPS and Alternative Strategies for Chillers August 2007
44
Energy and Greenhouse Impacts
The MEPS impact is based on an implementation date of 2008. For the Base Sales scenario, the net energy impact of the proposed MEPS for each category of chillers is shown in Figure 15, for Australia and in Figure 16 for New Zealand. The estimated impact of MEPS is shown as the “MEPS” line compared to business as usual (BAU). Annual net energy savings are estimated at 600 GWh per year for Australia and 96 GWh per year for New Zealand by 2020 for all products as a result of the MEPS with air-cooled chillers of 350 – 500 kWr representing approximately 37% of the total net energy savings in both Australia and New Zealand.
Figure 15: Net Annual Energy - BAU and MEPS: Australia Base Sales Scenario
0
500
1,000
1,500
2,000
2,500
3,000
2000
2001
2002
2003
2004
2005
2006
2007
2008
2009
2010
2011
2012
2013
2014
2015
2016
2017
2018
2019
2020
Year
GW
h
Air Cooled < 350 kW - BAU Air Cooled < 350 kW - MEPSAir Cooled >350 - < 500 kW - BAU Air Cooled >350 - < 500 kW - MEPSAir Cooled >500 - < 700 kW - BAU Air Cooled >500 - < 700 kW - MEPSAir Cooled >700 - < 1000 kW - BAU Air Cooled >700 - < 1000 kW - MEPSAir Cooled >1000 kW - BAU Air Cooled >1000 kW - MEPSWater Cooled < 350 kW - BAU Water Cooled < 350 kW - MEPSWater Cooled >350 - < 500 kW - BAU Water Cooled >350 - < 500 kW - MEPSWater Cooled >500 - < 700 kW - BAU Water Cooled >500 - < 700 kW - MEPSWater Cooled >700 - < 1000 kW - BAU Water Cooled >700 - < 1000 kW - MEPSWater Cooled >1000 - < 1500 kW - BAU Water Cooled >1000 - < 1500 kW - MEPSWater Cooled >1500 kW - BAU Water Cooled >1500 kW - MEPS

E3 Committee CBA: MEPS and Alternative Strategies for Chillers August 2007
45
Figure 16: Net Annual Energy - BAU and MEPS: NZ Base Sales Scenario
0
50
100
150
200
250
300
350
400
450
2000
2001
2002
2003
2004
2005
2006
2007
2008
2009
2010
2011
2012
2013
2014
2015
2016
2017
2018
2019
2020
Year
GW
h
Air Cooled < 350 kW - BAU Air Cooled < 350 kW - MEPSAir Cooled >350 - < 500 kW - BAU Air Cooled >350 - < 500 kW - MEPSAir Cooled >500 - < 700 kW - BAU Air Cooled >500 - < 700 kW - MEPSAir Cooled >700 - < 1000 kW - BAU Air Cooled >700 - < 1000 kW - MEPSAir Cooled >1000 kW - BAU Air Cooled >1000 kW - MEPSWater Cooled < 350 kW - BAU Water Cooled < 350 kW - MEPSWater Cooled >350 - < 500 kW - BAU Water Cooled >350 - < 500 kW - MEPSWater Cooled >500 - < 700 kW - BAU Water Cooled >500 - < 700 kW - MEPSWater Cooled >700 - < 1000 kW - BAU Water Cooled >700 - < 1000 kW - MEPSWater Cooled >1000 - < 1500 kW - BAU Water Cooled >1000 - < 1500 kW - MEPSWater Cooled >1500 kW - BAU Water Cooled >1500 kW - MEPS
The MEPS impact for the Low Sales scenario is shown in Figure 17, for Australia and in Figure 18 for New Zealand with total net energy savings of 490 GWh per year for Australia and 80 GWh per year for New Zealand by 2020.
Figure 17: Net Annual Energy - BAU and MEPS: Australia Low Sales Scenario
0
500
1,000
1,500
2,000
2,500
2000
2001
2002
2003
2004
2005
2006
2007
2008
2009
2010
2011
2012
2013
2014
2015
2016
2017
2018
2019
2020
Year
GW
h
Air Cooled < 350 kW - BAU Air Cooled < 350 kW - MEPSAir Cooled >350 - < 500 kW - BAU Air Cooled >350 - < 500 kW - MEPSAir Cooled >500 - < 700 kW - BAU Air Cooled >500 - < 700 kW - MEPSAir Cooled >700 - < 1000 kW - BAU Air Cooled >700 - < 1000 kW - MEPSAir Cooled >1000 kW - BAU Air Cooled >1000 kW - MEPSWater Cooled < 350 kW - BAU Water Cooled < 350 kW - MEPSWater Cooled >350 - < 500 kW - BAU Water Cooled >350 - < 500 kW - MEPSWater Cooled >500 - < 700 kW - BAU Water Cooled >500 - < 700 kW - MEPSWater Cooled >700 - < 1000 kW - BAU Water Cooled >700 - < 1000 kW - MEPSWater Cooled >1000 - < 1500 kW - BAU Water Cooled >1000 - < 1500 kW - MEPSWater Cooled >1500 kW - BAU Water Cooled >1500 kW - MEPS

E3 Committee CBA: MEPS and Alternative Strategies for Chillers August 2007
46
Figure 18: Net Annual Energy - BAU and MEPS: New Zealand Low Sales Scenario
gy
0
50
100
150
200
250
300
350
400
2000
2001
2002
2003
2004
2005
2006
2007
2008
2009
2010
2011
2012
2013
2014
2015
2016
2017
2018
2019
2020
Year
GW
h
Air Cooled < 350 kW - BAU Air Cooled < 350 kW - MEPSAir Cooled >350 - < 500 kW - BAU Air Cooled >350 - < 500 kW - MEPSAir Cooled >500 - < 700 kW - BAU Air Cooled >500 - < 700 kW - MEPSAir Cooled >700 - < 1000 kW - BAU Air Cooled >700 - < 1000 kW - MEPSAir Cooled >1000 kW - BAU Air Cooled >1000 kW - MEPSWater Cooled < 350 kW - BAU Water Cooled < 350 kW - MEPSWater Cooled >350 - < 500 kW - BAU Water Cooled >350 - < 500 kW - MEPSWater Cooled >500 - < 700 kW - BAU Water Cooled >500 - < 700 kW - MEPSWater Cooled >700 - < 1000 kW - BAU Water Cooled >700 - < 1000 kW - MEPSWater Cooled >1000 - < 1500 kW - BAU Water Cooled >1000 - < 1500 kW - MEPSWater Cooled >1500 kW - BAU Water Cooled >1500 kW - MEPS
For Australia the resulting estimated GHG emission reduction from the proposed MEPS is shown in Figure 19, with estimated GHG emission reductions for all chillers of 525 kt CO2-e/yr under the Base Sales scenario in 2020. For New Zealand the resulting estimated GHG emission reduction from the MEPS for chillers is shown in Figure 20, with a 58 kt CO2-e/yr emission reduction for the Base Sales scenario.

E3 Committee CBA: MEPS and Alternative Strategies for Chillers August 2007
47
Figure 19: GHG Emissions - BAU and MEPS: Australia Base Sales Scenario
0
500
1,000
1,500
2,000
2,500
2000
2001
2002
2003
2004
2005
2006
2007
2008
2009
2010
2011
2012
2013
2014
2015
2016
2017
2018
2019
2020
Year
kt C
O 2-
e
Air Cooled < 350 kW - BAU Air Cooled < 350 kW - MEPSAir Cooled >350 - < 500 kW - BAU Air Cooled >350 - < 500 kW - MEPSAir Cooled >500 - < 700 kW - BAU Air Cooled >500 - < 700 kW - MEPSAir Cooled >700 - < 1000 kW - BAU Air Cooled >700 - < 1000 kW - MEPSAir Cooled >1000 kW - BAU Air Cooled >1000 kW - MEPSWater Cooled < 350 kW - BAU Water Cooled < 350 kW - MEPSWater Cooled >350 - < 500 kW - BAU Water Cooled >350 - < 500 kW - MEPSWater Cooled >500 - < 700 kW - BAU Water Cooled >500 - < 700 kW - MEPSWater Cooled >700 - < 1000 kW - BAU Water Cooled >700 - < 1000 kW - MEPSWater Cooled >1000 - < 1500 kW - BAU Water Cooled >1000 - < 1500 kW - MEPSWater Cooled >1500 kW - BAU Water Cooled >1500 kW - MEPS
Figure 20: GHG Emissions - BAU and MEPS: NZ Base Sales Scenario
0
50
100
150
200
250
300
2000
2001
2002
2003
2004
2005
2006
2007
2008
2009
2010
2011
2012
2013
2014
2015
2016
2017
2018
2019
2020
Year
kt C
O 2-
e
Air Cooled < 350 kW - BAU Air Cooled < 350 kW - MEPSAir Cooled >350 - < 500 kW - BAU Air Cooled >350 - < 500 kW - MEPSAir Cooled >500 - < 700 kW - BAU Air Cooled >500 - < 700 kW - MEPSAir Cooled >700 - < 1000 kW - BAU Air Cooled >700 - < 1000 kW - MEPSAir Cooled >1000 kW - BAU Air Cooled >1000 kW - MEPSWater Cooled < 350 kW - BAU Water Cooled < 350 kW - MEPSWater Cooled >350 - < 500 kW - BAU Water Cooled >350 - < 500 kW - MEPSWater Cooled >500 - < 700 kW - BAU Water Cooled >500 - < 700 kW - MEPSWater Cooled >700 - < 1000 kW - BAU Water Cooled >700 - < 1000 kW - MEPSWater Cooled >1000 - < 1500 kW - BAU Water Cooled >1000 - < 1500 kW - MEPSWater Cooled >1500 kW - BAU Water Cooled >1500 kW - MEPS
Figure 21 shows the resulting GHG emission reduction for the Low Sales scenario for Australia. It is estimated that greenhouse emissions would be approximately 96 kt CO2-e

E3 Committee CBA: MEPS and Alternative Strategies for Chillers August 2007
48
lower if the MEPS is implemented compared to BAU under this scenario. Figure 22 shows the resulting GHG emission reduction for the Low Sales scenario for New Zealand. It is estimated that greenhouse emissions would be approximately 11 kt CO2-e lower if the MEPS is implemented compared to BAU under this scenario.
Figure 21: GHG Emissions - BAU and MEPS: Australia Low Sales Scenario
0
200
400
600
800
1,000
1,200
1,400
1,600
1,800
2,000
2000
2001
2002
2003
2004
2005
2006
2007
2008
2009
2010
2011
2012
2013
2014
2015
2016
2017
2018
2019
2020
Year
kt C
O 2-
e
Air Cooled < 350 kW - BAU Air Cooled < 350 kW - MEPSAir Cooled >350 - < 500 kW - BAU Air Cooled >350 - < 500 kW - MEPSAir Cooled >500 - < 700 kW - BAU Air Cooled >500 - < 700 kW - MEPSAir Cooled >700 - < 1000 kW - BAU Air Cooled >700 - < 1000 kW - MEPSAir Cooled >1000 kW - BAU Air Cooled >1000 kW - MEPSWater Cooled < 350 kW - BAU Water Cooled < 350 kW - MEPSWater Cooled >350 - < 500 kW - BAU Water Cooled >350 - < 500 kW - MEPSWater Cooled >500 - < 700 kW - BAU Water Cooled >500 - < 700 kW - MEPSWater Cooled >700 - < 1000 kW - BAU Water Cooled >700 - < 1000 kW - MEPSWater Cooled >1000 - < 1500 kW - BAU Water Cooled >1000 - < 1500 kW - MEPSWater Cooled >1500 kW - BAU Water Cooled >1500 kW - MEPS

E3 Committee CBA: MEPS and Alternative Strategies for Chillers August 2007
49
Figure 22: GHG Emissions - BAU and MEPS: NZ Low Sales Scenario
0
50
100
150
200
25020
00
2001
2002
2003
2004
2005
2006
2007
2008
2009
2010
2011
2012
2013
2014
2015
2016
2017
2018
2019
2020
Year
kt C
O 2-
e
Air Cooled < 350 kW - BAU Air Cooled < 350 kW - MEPSAir Cooled >350 - < 500 kW - BAU Air Cooled >350 - < 500 kW - MEPSAir Cooled >500 - < 700 kW - BAU Air Cooled >500 - < 700 kW - MEPSAir Cooled >700 - < 1000 kW - BAU Air Cooled >700 - < 1000 kW - MEPSAir Cooled >1000 kW - BAU Air Cooled >1000 kW - MEPSWater Cooled < 350 kW - BAU Water Cooled < 350 kW - MEPSWater Cooled >350 - < 500 kW - BAU Water Cooled >350 - < 500 kW - MEPSWater Cooled >500 - < 700 kW - BAU Water Cooled >500 - < 700 kW - MEPSWater Cooled >700 - < 1000 kW - BAU Water Cooled >700 - < 1000 kW - MEPSWater Cooled >1000 - < 1500 kW - BAU Water Cooled >1000 - < 1500 kW - MEPSWater Cooled >1500 kW - BAU Water Cooled >1500 kW - MEPS
5.6 National and State Costs and Benefits
National and State Analysis
Table 10 shows the Net Present Value and Benefit-Cost Ratios (BCR) for Australia for a range of discount rates. The national perspective includes:
• Costs: • to the consumer due to the incremental price increases of product due to the
MEPS • to the State and Federal government for implementing and administering the
MEPS program • to the product supply businesses for complying with the requirements of the
MEPS program, i.e., testing, administration, training, etc
• Benefits to the nation due to the avoided electricity generation, distribution and transmission costs.
It is worth noting that only the directly related avoided cost of generating and supplying electricity has been used to calculate the benefits. Several components of the actual cost of electricity, that are not avoidable simply by reducing energy consumption, have not been used in the benefits. Such costs may include cost of metering, general maintenance

E3 Committee CBA: MEPS and Alternative Strategies for Chillers August 2007
50
cost etc. The nature and magnitude of avoidable electricity costs has been estimated in a previous RIS for clothes washers & dishwashers (Syneca 2006). This study estimated the national avoidable cost of electricity at 8 cents/kWh, comprising 7 cents/kWh in avoided cost of generation and 1 cent/kWh in avoided network costs, relative to the marginal tariff of electricity for a normal load (with normal peak to off peak consumption ratio) for residential customers of 12.7 cents/kWh. This avoidable cost is approximately 65% of the marginal tariff.
In this CBA, instead of using a single national avoided cost of electricity for Australia, it is considered more reasonable to estimate the avoidable cost of electricity on the basis of different values of marginal tariffs for each state and territory, and for New Zealand separately. In this way, the avoided costs will more accurately reflect the costs of supplying electricity by state. We have therefore calculated the avoidable cost of electricity as 65% of the marginal tariff in each state and in New Zealand. The estimated value of avoidable cost of electricity are shown in table Table 25 in Appendix 5.
Table 10 shows the Net Present Value and Benefit-Cost Ratios (BCR) for Australia for a range of discount rates. All data tables are based on the incremental real price increase for chillers as per Table 7 for MEPS compliant product, the State and Federal program costs in Section 5.1 and business compliance costs in Section 5.2.
The provisional benefits under an emissions trading scheme (ETS) are discussed in Appendix 7. However, they are not included in the main analysis, as the Australian Government has yet to establish the details of how an ETS will operate or to undertake modelling of future electricity prices under emissions trading. This information will help determine the best approach to including the emissions abatement benefits under the ETS in the CBA.
Table 10: Financial Analysis – Australia Base Sales Growth for a Range of Discount Rates
NPV Nil (0%) NPV Low (5%) NPV Med (7.5%) NPV High (10%) Total Costs $136,724,718 $69,988,540 $51,225,257 $38,005,174 Total Benefits $380,445,336 $166,580,217 $112,846,609 $77,583,503 Net Benefits $243,720,618 $96,591,677 $61,621,352 $39,578,329 Benefit-Cost Ratio 2.8 2.4 2.2 2.0
Table 11 presents the NPV benefits and costs of the proposed MEPS for the Low Sales scenario.

E3 Committee CBA: MEPS and Alternative Strategies for Chillers August 2007
51
Table 11: Financial Analysis – Australia Low Sales Growth for a Range of Discount Rates
NPV Nil (0%) NPV Low (5%) NPV Med (7.5%) NPV High (10%) Total Costs $117,420,517 $61,093,193 $45,043,136 $33,645,574 Total Benefits $330,029,528 $145,577,718 $98,989,592 $68,312,895 Net Benefits $212,609,011 $84,484,525 $53,946,456 $34,667,321 Benefit-Cost Ratio 2.8 2.4 2.2 2.0
To assess the potential sensitivity of the benefit-costs to the estimated incremental price increase for chillers due to the MEPS, a number of options were modelled. The incremental price increase of chillers was increased by 10% and decreased by 10%. Figure 23 shows the change in the national BCR if the price of MEPS-compliant product is up to 10% higher than the price increase estimated in Table 7. As the figure demonstrates, the net present benefits are still significantly higher than the costs under these conditions.
Figure 23: Benefit-Cost Ratio as a Function of Incremental Price Increase (Australia)
0.0
0.5
1.0
1.5
2.0
2.5
3.0
Low Inc Cost Base Inc Cost High Inc Cost
Incremental Price
Ben
efit
Cos
t Rat
io
Base SalesLow Sales
Table 12 shows the Net Present Value and Benefit-Cost Ratios for New Zealand for a range of discount rates under Base Sales scenario. All data tables are based on the incremental real price increase for products as per Table 7 for MEPS compliant products. In addition, part of the program costs is apportioned to NZ in relation to the proportion of NZ sales of chillers to Australian sales. All values are expressed in NZ dollars, converted at 1.1NZD to 1 AUD.

E3 Committee CBA: MEPS and Alternative Strategies for Chillers August 2007
52
Table 12: Financial Analysis – NZ Base Sales Scenario for a Range of Discount Rates
NPV Nil (0%) NPV Low (5%) NPV Med (7.5%) NPV High (10%) Total Costs $32,134,544 $16,439,078 $12,028,400 $8,921,684 Total Benefits $65,368,598 $28,622,088 $19,389,513 $13,330,556 Net Benefits $33,234,055 $12,183,010 $7,361,113 $4,408,872 Benefit-Cost Ratio 2.0 1.7 1.6 1.5
Table 13 presents the NPV benefits and costs of the proposed MEPS for the Low Sales scenario for New Zealand.
Table 13: Financial Analysis – NZ Low Sales Scenario for a Range of Discount Rates
NPV Nil (0%) NPV Low (5%) NPV Med (7.5%) NPV High (10%) Total Costs $27,648,248 $14,371,799 $10,591,675 $7,908,512 Total Benefits $56,707,890 $25,014,150 $17,009,065 $11,737,988 Net Benefits $29,059,643 $10,642,350 $6,417,390 $3,829,476 Benefit-Cost Ratio 2.1 1.7 1.6 1.5
The benefit-cost ratio under the Low Sales scenario is lower than the Base Sales scenario, but still substantially greater than 1.
The benefit-cost ratios for all the Australian states are shown in Table 14 under the Base Sales scenario. In all states the BCR is well above 1. The highest BCR occurs in the Northern Territory, where electricity prices are higher and hence provide greater consumer benefits. State/Territory program costs are apportioned by household numbers in each state.
Table 14: Benefit-Cost Ratio for States by Discount Rate: Base Sales Scenario
State NPV Nil (0%) NPV Low (5%) NPV Med (7.5%) NPV High (10%) NSW & ACT 2.6 2.2 2.1 1.9 NT 4.2 3.6 3.3 3.1 QLD 3.7 3.2 2.9 2.7 SA 2.4 2.0 1.9 1.8 TAS 1.7 1.5 1.4 1.3 VIC 2.4 2.0 1.9 1.8 WA 2.8 2.4 2.2 2.1
The benefit-cost ratios for all the Australian states and territories are shown in Table 15 under the Low Sales scenario. Again, in all states the BCR is well above 1 and shows very little sensitivity to changes in sales growth.

E3 Committee CBA: MEPS and Alternative Strategies for Chillers August 2007
53
Table 15: Benefit-Cost Ratio for States by Discount Rate: Low Sales Scenario
State NPV Nil (0%) NPV Low (5%) NPV Med (7.5%) NPV High (10%) NSW & ACT 2.6 2.2 2.1 1.9 NT 4.3 3.6 3.3 3.1 QLD 3.8 3.2 2.9 2.7 SA 2.4 2.0 1.9 1.7 TAS 1.8 1.5 1.4 1.3 VIC 2.4 2.0 1.9 1.7 WA 2.8 2.4 2.2 2.0
Figure 24 shows the forecast net benefit by state/territory over the period 2000 to 2020 at a discount rate of 7.5% for the Base Sales scenario. There are small negative benefits in 2007 and 2008 which reflect the government costs associated with the establishment of the MEPS program and systems before the implementation date of 2008, however these are minor in the figure due to their size (less than $500,000 for all states).
Figure 24: Annual Net Benefit $M: Base Sales Growth Scenario
-$4
-$2
$0
$2
$4
$6
$8
$10
$12
$14
$16
2000
2001
2002
2003
2004
2005
2006
2007
2008
2009
2010
2011
2012
2013
2014
2015
2016
2017
2018
2019
2020
Year
Net
Ben
efit
($M
)
New South Wales & ACTNorthern TerritoryQueenslandSouth AustraliaTasmaniaVictoriaWestern Australia
Figure 25 shows the forecast net benefit by State over the period 2000 to 2020 at a discount rate of 7.5% for the Low Sales scenario.

E3 Committee CBA: MEPS and Alternative Strategies for Chillers August 2007
54
Figure 25: Annual Net Benefit $M: Low Sales Growth Scenario
-$4
-$2
$0
$2
$4
$6
$8
$10
$12
$14
2000
2001
2002
2003
2004
2005
2006
2007
2008
2009
2010
2011
2012
2013
2014
2015
2016
2017
2018
2019
2020
Year
Net
Ben
efit
($M
)
New South Wales & ACTNorthern TerritoryQueenslandSouth AustraliaTasmaniaVictoriaWestern Australia
Summary Data for Alternative BAU Sales Scenarios
The impact of changes to the forecast sales of chillers is shown for the two scenarios in Table 16 for Australia and in Table 17 for New Zealand.
Table 16 Summary Data for Alternative BAU Sales Australia – 7.5% Discount Rate
Scenario Base Sales Low Sales Energy Saved (cumulative) 3,891 GWh 3,376 GWh GHG Emission Reduction (cumulative) 3.6 Mt CO2-e 3.1 Mt CO2-e Total Benefit $113M $99M Total Investment $51M $45M Benefit-Cost Ratio 2.2 2.2
Table 17 Summary Data for Alternative BAU Sales New Zealand – 10% Discount Rate
Scenario Base Sales Low Sales Energy Saved (cumulative) 629 GWh 545 GWh GHG Emission Reduction (cumulative) 377 kt CO2-e 327.2 kt CO2-e Total Benefit $13M $11.7M Total Investment $9M $7.9M Benefit-Cost Ratio 1.5 1.5 Note that NZ Govt requires analysis of alternative proposals with 10% discount rate

E3 Committee CBA: MEPS and Alternative Strategies for Chillers August 2007
55
6 Consultations and Comments The following consultations have been undertaken in relation to the policy development for chillers:
• Launch of MEPS Proposal – Chillers: October 2004. Almost 100 participants attended the Energy Efficiency Forum in October 2004 representing industry, regulators, Commonwealth and State/Territory government agencies, testing authorities, academia and consultants. The proposal provided details of the product description, efficiency and characteristics of new products, ownership trends, relevant Australian Standards, Australian and international policies for this product, potential MEPS levels, energy consumption, greenhouse emissions and potential savings. Detailed comments where sought from industry, however no formal submissions were made. The timeline for development of this policy option was explained and subsequently an Australian Standards working group was established to develop the technical requirements for both the testing standard and the MEPS for chillers.
• AREMA meeting – Chillers: December 2004. Again at a well attended industry forum, the proposed MEPS for chillers was explained. This presentation was made available to all that attended and requests for comment noted. Again, no formal comments were submitted, however the suppliers at the meeting supported the development of a MEPS for chillers.
• Annual National Air Conditioning & Energy Forum: September 2005. The chiller MEPS proposal was discussed in detail at the National Air Conditioning forum in Sydney. Based on discussions with industry representatives and the USA Air Conditioning and Refrigeration Institute, broad agreement was reached on the use of ARI certification for the means of assessing the performance of chillers in the proposed MEPS program. During the forum, it was also decided to delay the implementation date of the MEPS from October 2007. Discussions continued during and after the forum with the ARI and Australian industry on the compliance methodology. Testing issues were also addressed at the conference and a broad cross-section of the industry was invited to participate in a Steering Committee to be established following the forum.
• MEPS Steering Committee: February 2006 - onwards. Further consultation between the chiller industry and government was conducted in a series of meetings during 2006 and 2007. Agreements were sought on the compliance pathways for suppliers to comply with the MEPS and the MEPS levels were refined to reflect the market conditions in Australia. Several meetings were held as follows: • 13 February 2006 – Sydney • 30 March 2006 – Melbourne

E3 Committee CBA: MEPS and Alternative Strategies for Chillers August 2007
56
• 13 September 2006 – Sydney • 18 October 2006 – Sydney In these meetings, many topics were covered, including the MEPS levels by type/size of chiller, testing methods, rating and compliance pathways to use the ARI and EUROVENT certifications programs, sales data for chillers by size/type, data on efficiency of chillers sold in Australia and the potential costs of implementation. Representatives from all the major chiller suppliers in Australia were present at many of the meetings and all received the meeting notes.
• Australian/New Zealand Standards Committee ME-086: Dec 2006 - onwards. To progress the development of the testing/rating and MEPS for chillers, a new committee of Standards Australia was established in the second half of 2006 called Commercial Airconditioning Equipment. This committee was tasked to develop the measurement and rating of system for chillers, which was based on the ISO standard PWD 19298-2, Liquid-chilling packages using the vapour compression cycle, Part 2: Method for testing for performance and the ARI550/590 standard. Several meetings were held in Sydney as follows: • 21 December 2006 • 12 February 2007 • 14 March 2007 • 17 April 2007 • 22 May 2007 • 27 June 2007
The draft standards developed by this committee have now been published for public comment. These documents were published on 8 June 2007 and comment is required by 10 August 2007.
In addition, the key policy/technical documents were also available on the public website, www.energyrating.gov.au and public comments invited.
6.1 Summary of Comments
To be added after release of the draft for consultation.
6.2 Responses to Comments
To be added after release of the draft for consultation

E3 Committee CBA: MEPS and Alternative Strategies for Chillers August 2007
57
7 Evaluation and Recommendations 7.1 Assessment
Reduce Greenhouse Gas Emissions Below Business-as-Usual
It is expected that, due to their voluntary nature, the non-mandatory policy alternatives will not reduce greenhouse emissions. This is supported by the industry who state that voluntary targets in this market would not provide sufficient incentive for acceptable levels of compliance, and overseas experience.
Based on the modelling of the MEPS, significant greenhouse gas emission reductions are possible.
Due to its non-voluntary nature, the MEPS option has the highest probability of reducing greenhouse gas emissions below business-as-usual with high benefit-cost ratios for end consumers.
Addressing Market Failures
By requiring the removal of low efficiency product from the market, the MEPS will most effectively address market failures, so that the average lifetime costs of products are reduced. All other options rely on voluntary mechanisms and are not as effective in addressing this market failure.
MEPS will not effectively provide buyers with improved access to product performance information, nor will any of the other options, with the exception of mandatory labelling, which would not be effective in this market.
The MEPS option would clearly require importers and suppliers of chillers to provide complying equipment. This is not thought to involve negative impacts on suppliers as the volume of sales would not be substantially affected and compliance costs are low.
Conclusions
After consideration of the policy options it is concluded that: • The MEPS option is likely to be effective in meeting all the stated objectives.
• None of the non-MEPS alternatives examined appear as effective in meeting all objectives. Some would be completely ineffective with regard to some objectives and some do not have industry support.
• Given that the proposal for MEPS has been in the public domain since October 2004 and the Australian/New Zealand Standard will be published in 2007, the program could be implemented in 2008.

E3 Committee CBA: MEPS and Alternative Strategies for Chillers August 2007
58
7.2 Recommendations (Draft)
It is recommended that the Ministerial Council on Energy (MCE) agree: 1. To implement mandatory energy performance standards for liquid-chilling
packages using the vapour compression cycle in regulation. 2. That products covered by this CBA include all those chillers with output capacity
of 350 kWr or greater, included in the scope of AS/NZS 4776, Part 1.1. 3. To use the test method AS/NZS 4776.1.2 which specifies the method of testing
liquid-chilling packages using the vapour compression cycle to verify the capacity, power and efficiency requirements at a specific set of conditions.
4. That liquid-chilling packages must meet or surpass the energy performance requirements that are proposed in this document and will be set down in Australian and New Zealand Standard AS/NZS 4776.2 (MEPS requirements for liquid-chilling packages using the vapour compression cycle).
5. That the amendments take effect not earlier than 1 October 2008. 6. To have all jurisdictions take the necessary administrative actions to ensure that
the suite of regulations can take effect from not earlier than 1 October 2008.

E3 Committee CBA: MEPS and Alternative Strategies for Chillers August 2007
59
8 Implementation and Review The chiller MEPS would be implemented under the same State and Territory regulations as appliance labelling and MEPS, and so subject to the same sunset provisions, if any. Victoria and South Australia have general sunset provisions applying to their labelling/MEPS regulations as a whole, while NSW has sunset provisions applying to the inclusion of some (but not all) items scheduled.
Once the States, Territories and New Zealand agree to mandatory requirements, their removal in any one jurisdiction would undermine the effect in all other jurisdictions, because of the relevant Mutual Recognition agreements. Under the co-operative arrangements for the management of the Equipment Energy Efficiency (E3) Program, States and Territories advise and consult when the sunset of any of the provisions is impending. This gives the opportunity for revised cost-benefit analyses to be undertaken.
Australian/New Zealand Standards called up in State, Territory and New Zealand labelling and MEPS regulations are also subject to regular review. The arrangements between the Commonwealth, State and Territory and New Zealand Governments and Australia/ New Zealand Standards agencies provide that the revision of any Standards called up in energy labelling and MEPS regulations are subject to the approval of the governments.
E3 has adopted the principles that there should be a MEPS ‘stability period’, and that a cost-benefit analysis would be undertaken before any revisions are proposed. The earliest possible timing of any change to the MEPS regulations discussed in this CBA would therefore depend on the date of implementation. If they are implemented in October 2008, the earliest possible revision would be October 2012.

E3 Committee CBA: MEPS and Alternative Strategies for Chillers August 2007
A-1
Appendices A A Appendix 1: References A-2 Appendix 2: Australian Energy Efficiency Policy Background A-4 Appendix 3: Review of International Approaches A-6 Appendix 4: Stock and Sales A-11 Appendix 5: Energy Prices and Factors A-22 Appendix 6: Calculation Methodology A-23 Appendix 7: Australian ETS Provisional Benefits to Be Included in Future A-26 Appendix 8: Greenhouse Gas Emissions Factors A-28 Appendix 9: Population and Household Numbers A-29 Appendix 10: Cooling Capacity, BAU & MEPS COPs and Input Power by Chiller Categories A-30 Appendix 11: Annual Benefit and Cost Data A-33

E3 Committee CBA: MEPS and Alternative Strategies for Chillers August 2007
A-2
Appendix 1: References ABARE 2006 Australian energy national and state projections to 2029-30, Australian Bureau of Agricultural and Resource Economics. ABARE research report 06.26, December 2006
AGO 2007. Equipment Energy Efficiency Programme: Achievements 2006, Report No: 2007/01, Australian Greenhouse Office, Department of the Environment and Water Resources, Canberra, Australia, May 2007
AIRAH Refrigerant Selection Guide 2003
APEC – ESIS (Energy Standards Information System)
ARI 550/590-2003. Air-Conditioning and Refrigeration Institute, ARI Standard 550/590, 2003 Water Chilling Packages using the Vapour Compression Cycle. (http://www.ari.org/std/_individual/550.590-2003.pdf).
ASHRAE 90.1 – 2001. American Society of Heating, Refrigerating and Air-Conditioning Engineers(ASHRAE) Standard 90.1 – 2001 Energy Standard for Buildings Except Low-Rise Residential Buildings. AHREA 2004
Australian Building Codes Board 2006. Building Code of Australia 2006, available from www.abcb.gov.au.
Australian Government 2006, Joint Media Release. Australian Minister for the Environment and Heritage, Senator the Hon. Ian Campbell, & Minister for Industry, Tourism and Resources, The Hon Ian Macfarlane, MP, 8 November 2006
BSRIA Study “The Australian Air Conditioning Study” (Summary Only), January 2002
Burbank 2002, Inventories and Projections of Ozone Depleting and Synthetic Greenhouse Gases used in Montreal Protocol Industries, Burnbank Consulting Pty. Ltd, for the AGO, 2002.
DBH NZ 2007. Energy efficiency of buildings (domestic hot water and commercial heating, ventilating and air-conditioning systems). Consultation on energy efficiency revisions to the New Zealand Building Code and Compliance Documents (Part 2). Department of Building and Housing , Wellington, New Zealand. April 2007
EECA 2007, Energy End Use Database, http://www.eeca.govt.nz/enduse/index.aspx
EnergyConsult 2004, Analysis of the Potential Policy Option: Commercial Building Air Conditioning Chillers (Vapour Compression). EnergyConsult for NAEEEC & AGO, Canberra, Australia, Oct 2004

E3 Committee CBA: MEPS and Alternative Strategies for Chillers August 2007
A-3
Energy Strategies 2005, Climate Control Heating Ventilation, Air-Conditioning and Efficiency, A Discussion Paper, for the National Appliance & Equipment Energy Efficiency Committee, Canberra, Australia, Sep 2005.
Energy Strategies 2006, Climate Control Heating Ventilation, Air-Conditioning and Efficiency, Discussion Paper No 2, for the Equipment Energy Efficiency Committee, Canberra, Australia, May 2006.
EMET 2004, Energy Efficiency Improvement in the Commercial Sub-sectors. For Sustainable Energy Authority of Victoria, by EMET Consultants Pty Ltd, Feb 2004
EUROVENT 2006. EUROVENT Certification Programme database and programme guidelines, (www.eurovent-certification.com)
Informark 2004. AC industry sales data produced by Informark for AGO from Data Supplied by Wholesalers. May 2004
MED NZ 2006, Revised New Zealand Energy Greenhouse Gas Emissions 1990 - 2005, Ministry of Economic Development, Wellington, New Zealand , December 2006
MED NZ 2006b, Future Energy Directions Workshop - New Zealand's Energy Outlook to 2030: Base Case. Ministry of Economic Development, Wellington, New Zealand , 23 Aug 2006.
NGGI 2007, National Greenhouse Gas Inventory 2005, Australian Greenhouse Office, Department of the Environment and Water Resources, Canberra, Australia, March 2007.
NRCan 2003, Office of Energy Efficiency Natural Resources Canada, Proposed Regulations for Packaged Water Chillers, Bulletin – February 2003. http://oee.nrcan.gc.ca/regulations/packaged_water_chillers.cfm.
OBPR 2006, Business Cost Calculator, Version Current at: 26 October 2006, www.industry.gov.au/businesscostcalculator, Office of Best Practice Regulation
Standards Australia 2007. Liquid-chilling packages using the vapour compression cycle, Method of rating and testing for performance—Rating DR 07278, and Method of rating and testing for performance—Testing DR 07277. 8 June 2007, available from Standards Australia.
Syneca Consulting 2006, The Proposal to include standby power in the energy ratings of clothes washers & dishwashers, Consultation Regulatory Impact Statement, 19th May 2006, for Australian Greenhouse Office, by Syneca Consulting.
E3 Committee CBA: MEPS and Alternative Strategies for Chillers August 2007
A-4
Appendix 2: Australian Energy Efficiency Policy Background The Australian Government’s initial response to concerns about the environmental, economic and social impacts of global warming was set out in the Prime Minister’s statement of 20 November 1997, Safeguarding the Future: Australia’s Response to Climate Change. The Prime Minister noted that the Government was seeking “…realistic, cost-effective reductions in key sectors where emissions are high or growing strongly, while also fairly spreading the burden of action across the economy.” He also stated that the Government is “…prepared to ask industry to do more than they would otherwise be prepared to do, that is, go beyond a ‘no regrets’3, minimum cost approach where this is sensible in order to achieve effective and meaningful outcomes.” This “no regrets” test was a key part of the guidelines adopted by the Council of Australian Governments (COAG) in 1997 that any initiative proposed by the MCE, including standards and labelling measures under the Equipment Energy Efficiency Program, must meet.
In 1998 the Australian Government released The National Greenhouse Strategy (NGS) that was endorsed by the Australian Government and state and territory governments and committed them to an effective national greenhouse response. Progress under the NGS was reported to the Council of Australian Governments (CoAG). Many key elements of the NGS were implemented successfully, but, over time, the Australian Government identified a range of emerging climate change priorities that required attention at the federal government level. Similarly, there was acknowledgment that state and territory jurisdictional boundaries necessitated state/territory level climate change action plans and these were developed.
In 2004, the Australian Government released a new climate change strategy as articulated through its Energy White Paper, Securing Australia’s Future, and the 2004-05 Environment Portfolio Budget. Some elements of the earlier NGS were included in the new strategy. As a critical element of the Australian Government’s climate change strategy, the new energy policy represented the refinement of strategic themes pursued in relation to energy under the NGS, including energy market reform, the development of low-emissions and renewable technologies, and improvements to end-use energy efficiency.
Since that time, CoAG has remained the primary forum for progressing Australian, state and territory government collaboration on climate change issues requiring inter-jurisdictional attention. Significant progress has been made under the CoAG climate change agenda since CoAG’s agreement in June 2005 to establish a new Senior Officials
3 The Productivity Commission has defined “No regrets” policy options as measures that … have net benefits (or at least no net cost) in addition to addressing the enhanced greenhouse effect. A more intuitive interpretation of ‘no regrets’ measures could be that they are actions which would still be considered worthwhile even in the absence of concerns about the potential adverse impact of global warming. (PC 1997: page vii). This may involve imposing additional business costs on suppliers if the resulting more efficient products deliver a net benefit to the wider community.
E3 Committee CBA: MEPS and Alternative Strategies for Chillers August 2007
A-5
Group to consider ways to further improve investment certainty for business, encourage renewable energy and enhance cooperation in areas such as technology development, energy efficiency and adaptation. This work culminated in the January 2006 CoAG climate change action plan. In addition, climate change issues requiring national coordination have been managed through a number of inter-governmental ministerial councils including the Ministerial Council on Energy.
The Australian Government’s climate change strategy is the mechanism through which Australia will meet its international commitments as a party to the United Nations Framework Convention on Climate Change (UNFCCC). The Government has an overall target of limiting Australia’s emissions in 2008-2012 to 108% of its 1990 emissions. This is a 30% reduction on the projected “business as usual” (BAU) outcomes in the absence of interventions.
Over 2006, the national policy debate over introducing a carbon price in Australia continued with the state and territory governments proposing an emissions trading scheme, and the Australian Government holding a nuclear energy enquiry and announcing its own emissions trading inquiry by the Task Group on Emissions Trading.
In 2007, emissions trading became a major new plank in the Australian Government’s response to climate change. The Prime Minister, the Hon John Howard MP, announced in June 2007 that Australia will introduce a world-class domestic emissions trading system by 2012. Emissions trading will be the primary mechanism for achieving the long term emissions reduction goal, which will be set in 2008. It will have a strong economic foundation and take account of global developments while preserving the competitiveness of our trade exposed emissions intensive industries. Through emissions trading, the market will help Australia develop the most cost effective technologies for cutting greenhouse emissions.
Emissions trading will complement existing Government actions to reduce greenhouse gases. These include:
• improving end-use energy efficiency;
• investing in the new low emissions technologies Australia and the world will need in the future, including renewable energy technologies and clean coal;
• supporting world-class scientific research to continue to build our understanding of climate change and its potential impacts, particularly on our region; and
• assisting regions and industries to adapt to the impacts of climate change.
An emissions trading scheme will build on the success of past and ongoing measures. These measures include the 2004 Energy White Paper, 2004-05 Climate Change Strategy, earlier measures such as Measures for a Better Environment and Safeguarding the Future, as well as new programs announced in 2006-07.

E3 Committee CBA: MEPS and Alternative Strategies for Chillers August 2007
A-6
Appendix 3: Review of International Approaches USA
The regulatory framework for the US programs consists of the National Energy Policy and Conservation Act (NEPCA) of 1978 (and subsequent amendments), which requires comparative labelling for household appliances and packaging disclosure panels for certain classes of lighting; the National Appliance Energy Conservation Act (NAECA) of 1987 (and subsequent amendments), which requires MEPS for a range of household appliances; and the Energy Policy and Conservation Act (EPC Act) of 1992, which extended MEPS and labelling to certain classes of non-household products. This legislation requires the US Department of Energy (DOE) to set MEPS for a wide range of named products, plus any other products that consume more than a specified amount of energy.
While the USA has equipment based MEPS for many products under the Energy Policy Act of 1992, the efficiency of air conditioning chillers is regulated as part of State building codes. The ASHRAE Standard 90.1 (Energy Standard for Buildings Except for Low Rise Residential Buildings) specifies the test standards and MEPS levels for chillers and this standard then forms the technical basis for the all State building codes.
Testing Standard
The ASHRAE Standard 90.1 was approved by the ASHRAE and IESNA boards in 1993, and then reviewed every three years. It is intended to promote the application of cost-effective design practices and technologies that minimise energy consumption without sacrificing either the comfort or productivity of the occupants. This standard references ARI 550/590.
The test method applies to factory-made vapour compression refrigeration Water-Chilling Packages including one or more hermetic or open drive compressors. These Water-Chilling Packages include:
• Water-Cooled, Air-Cooled, or Evaporatively Cooled Condensers, • Air-Cooled or Water-Cooled Heat Reclaim Condensers, • Packages supplied without a Condenser.
MEPS Levels
The Energy Policy and Conservation Act of 1992 (EPC Act 92) requires state and local governments to update their commercial building energy efficiency codes to be at least as stringent as ASHRAE Standard 90.1-1999 by 2004. To meet this requirement, almost all States have adopted ASHRAE 90.1-1999, eight have adopted 90.1-2001 and many have gone further and adopted ASHRAE 90.1-2004, including California, Iowa, New Jersey, Virginia, Vermont, Georgia, Utah and Ohio (http://www.energycodes.gov/). The chiller

E3 Committee CBA: MEPS and Alternative Strategies for Chillers August 2007
A-7
efficiency levels for ASHRAE 90.1-1999 through to 90.1-2004 are however the same. Table 18 summarises the requirements for Chillers in ASHRAE Standard 90.1-1999 to 2004.
Table 18: ASHRAE 90.1-1999, 2001 & 2004 Chiller Performance Standards
Vapour Compression Chillers Capacity (kWR) Min COP
Min IPLV
Air-Cooled, with Condenser All Capacities 2.80 3.05
Air-Cooled, without Condenser All Capacities 3.10 3.45 Water-Cooled, Reciprocating All Capacities 4.20 5.05 Water-Cooled (Rotary Screw and Scroll) < 528 kW 4.45 5.20 >528 kW and < 1055 kW 4.90 5.60 >1055 kW 5.50 6.15 Water-Cooled, Centrifugal < 528 kW 5.00 5.25 > 528 kW and <1055 kW 5.55 5.90 > 1055 kW 6.10 6.40
Canada
The Canadian economy is the eighth largest in the world (measured in US dollars at market exchange rates) after the US, Japan, Germany, the UK, France, China and Italy. It is highly integrated with the US economy, which absorbs over 85% of its exports. The Energy Efficiency Act passed in 1992 provides for the making and enforcement of regulations concerning minimum energy performance standards (MEPS) for energy-using products, as well as the labelling of energy-using products and the collection of data.
Canada has a MEPS program that covers air and water sourced heat pumps, commercial air conditioning chillers and dehumidifiers. A voluntary comparative labelling program for heat pumps also exists.
In 2004, Canada introduced a MEPS for chillers that are intended for application in the air conditioning of buildings. Products covered include vapour-compression chillers with a capacity less than 7 000kW with water condenser or less than 700kW with air condenser and absorption chillers up to 5 600kW. Energy efficiency was defined as COP and the Integrated Part Load Value (IPLV) for various size and technology combinations. The MEPS was implemented in October 2004 and will operate under the standard CSA-C743-02. This testing standard is equivalent to the American standard of ARI 550/590.
A key difference between the Canadian MEPS regulatory program and that of the USA is the regulation is on the water chillers themselves, as opposed to USA where the Building Codes are used to regulate the chillers to be installed in new buildings.

E3 Committee CBA: MEPS and Alternative Strategies for Chillers August 2007
A-8
Testing Standard
The scope of Canadian Chiller Test Standard CSA-C743-02 is similar to ARI 550/590, and applies to:
• factory-designed and prefabricated absorption or vapour-compression refrigeration chillers equipped with centrifugal or rotary screw and positive displacement (reciprocating or scroll) compressors. The Standard applies to chillers having a cooling capacity under 5600 kW (1590 tons) and intended for application in air-conditioning systems for buildings.
• absorption chillers, single-effect indirect-fired by steam or hot water; double-effect, both indirect and direct-fired; and multiple-effect and multi-loop cycle absorption chiller/heater units. Water is the refrigerant and lithium bromide is the absorbent. It may also be used for rating gas-fired absorption chillers at the discretion of the user.
• hermetic and external-drive centrifugal or rotary-screw chillers with continuous capacity modulation, whether driven by an electric motor, steam turbine, or another prime mover, such as an internal combustion engine.
• hermetic and external-drive positive displacement (reciprocating or scroll) compressor equipped chillers, with either self-contained or remote condensers.
• positive displacement compressor heat reclaim chillers.
The Canadian Standard does not apply to • absorption chillers with air-cooled condensers; • liquid chillers for use with liquids other than water; and • centrifugal or rotary screw heat reclaim chillers.
There are no labelling standards associated with air conditioning water chillers.
MEPS Levels
The MEPS levels are shown in Table 19. These MEPS are listed in CSA-C743-02, Section 6.

E3 Committee CBA: MEPS and Alternative Strategies for Chillers August 2007
A-9
Table 19: Canada Minimum COP and IPLV of Packaged Water Chilling Packages
Type Capacity Range, kW (tons) COP IPLV Vapour Compression -- air-cooled with condenser < 528 (150) 2.80 3.05 >= 528 (150) 2.80 3.05 -- air-cooled without condenser all 3.10 3.45 -- water-cooled, reciprocating all 4.20 5.05 -- water-cooled, rotary screw, scroll < 528 (150) 4.45 5.20 >= 528 (150) and <= 1055 (300) 4.90 5.60 >1055 (300) 5.50 6.15 -- water-cooled, centrifugal < 528 (150) 5.00 5.25 >= 528 (150) and <= 1055 (300) 5.55 5.90 > 1055 (300) 6.10 6.40 Absorption -- single-effect absorption, air-cooled all 0.60 N/A -- single-effect absorption, water-cooled all 0.70 N/A -- double-effect absorption, indirect-fired all 1.00 1.05 -- double-effect absorption, direct-fired all 1.00 1.00
Chinese Taipei
The Energy Commission in the Ministry of Economic Affairs (MOEA) has developed MEPS for a number of products. In most cases the energy tests are detailed in Chinese National Standards (CNS) of Chinese Taipei, and the MEPS requirements are published by MOEA. The Bureau of Commodity Inspection and Quarantine is also involved in the implementation of the program.
Chinese Taipei introduced MEPS for water chillers in January 2003 with the second Phase of the regulations being introduced in January 2005. The regulations cover water-cooled volumetric and centrifugal compressors, as well as air-cooled chillers .
Testing Standard
Test standards are established in CNS 12575 for volumetric-type compressors (screw, scroll, piston, etc) and in CNS 12812 for centrifugal-type compressors. These standards reference test standards, ARI 550/590 and the Japanese Industrial Standard (JIS), as follows:
• B8613 - Chiller standard for displacement type motor compressor, evaporator, condenser, etc., and which have a cooling capacity of 420 kW; and
• B8621 - Centrifugal water chillers to be used for cooling or heating water having not less than 348.8 kW in refrigerating capacity.

E3 Committee CBA: MEPS and Alternative Strategies for Chillers August 2007
A-10
MEPS Levels
The MEPS for commercial air conditioning chillers required different units to attain varying MEPS levels dependent upon the chiller type and capacity. The MEPS level for water-cooled type volumetric compressors will increase in 2005.
The current MEPS levels are shown in Table 20.
Table 20 - Chinese Taipei MEPS for Commercial Air Conditioning Chillers
Chiller Type Min COP 2003 Min COP 2005
Water-Cooled Type, Volumetric Compressors
Cooling Capacity < 150 RT 4.07 4.45 Cooling Capacity > 150 RT< 500 RT 4.19 4.90 Cooling Capacity > 500 RT 4.65 5.50 Water-Cooled Type, Centrifugal Compressors Cooling Capacity < 150 RT 5.0 5.0 Cooling Capacity > 150 RT, < 300 RT 5.55 5.55 Cooling Capacity > 300 RT 6.10 6.10 Air-Cooled Type, All 2.79 2.79 Note: Volumetric compressors are screw, scroll and reciprocating
Summary
The USA, Canada and Chinese Taipei all test chillers to ARI 550/590 or the equivalent. The MEPS levels of the USA and Canada are the most stringent international standards, with Chinese Taipei having come into line with these standards in 2005. The USA and Canadian MEPS is specified in terms of minimum Coefficient of Performance (COP) and Integrated Part Load Value (IPLV), while the Chinese Taipei is applied to the COP only.
The USA uses a building code (ASHRAE Standard 90.1) to enforce the MEPS for chillers and has had standards in place since 1993. The USA have required that state and local governments to update their commercial building energy efficiency codes to be at least as stringent as ASHRAE Standard 90.1-1999 by 2004. Many States have done this, and some have gone to 90.1.2004, but building codes are not mandatory in all States. By using the building code to regulate chillers, the regulation is restricted to the installation of chillers into new buildings and consequently does not affect the replacement market.
In comparison the Canadian and Chinese Taipei MEPS are applied to equipment sold in that country. These regulations therefore affect both replacement chillers and new installations.

E3 Committee CBA: MEPS and Alternative Strategies for Chillers August 2007
A-11
Appendix 4: Stock and Sales
Chillers – Sales Trends
Sales by Category
The sales of air and water-cooled chillers are function of economic growth and more specifically a result of business and industrial activity. The industry sources have suggested that the historically the sales of all types of chillers have increased steadily at an annual growth rate of around 3%. However there have been changes in proportion of technology and size in the annual sales. For example, historically water-cooled chillers have been more popular than air-cooled, especially in larger capacities. However, more recently due to increased concerns about legionnaire’s disease and improvements in air-cooled technology the sales of air-cooled chillers significantly outnumbers the sales of water-cooled chillers.
Annual sales by category of product are forecast from estimated values, as provided by industry sources, for the year 2000 by applying annual growth rate of 3%. The historical and forecasts sales figures developed for the CBA take into account the mix of two technologies and size categories. Using the 2000 estimates as reference point the historical and forecast values have been estimated. In doing so, assumptions have been implied to account for growing sales of air-cooled chillers at the expense of water-cooled counterparts.
The year 2000 estimates provide that of all new chillers sold 75% were air-cooled and remaining 25% were water-cooled. This demonstrates a significant shift from the historic trend, for only 46% of the existing stock of chillers were air-cooled in the year 2000. While there has been a shift from one technology to another, the proportional shares by chiller capacity within each technology is estimated to have remained steady. A large proportion of air-cooled chillers are of smaller capacities, while the reverse is applicable for water-cooled chillers. Table 21 provides the market shares by technology and by cooling capacity in year 2000.
Table 21: Market Shares by technology and cooling capacities (2000)
Market Share (Stock) Market Share (Sales Cooling Capacity (kW) % Air %
Water All % Air % Water All
< 350 55% 6% 28% 55% 6% 43% >350-528 30% 28% 29% 30% 28% 29% > 528-700 11% 31% 22% 11% 31% 16% >700-1055 3% 26% 15% 3% 26% 9% >1055-1500 2% 8% 5% 2% 8% 3% >1500 0% 3% 1% 0% 3% 1% All 46% 54% 100% 75% 25% 100%

E3 Committee CBA: MEPS and Alternative Strategies for Chillers August 2007
A-12
In order to allow for shift in preference for air-cooled technology offset was applied to general annual sales growth rate of 3% for all chillers. In case of air-cooled chillers a +2% offset was applied to general 3% sales growth. In contrast a -2% offset was applied to general 3% annual sales growth rate of water-cooled chillers.
Figure 26 shows the resulting forecast sales of chillers to 2020 in Australia by category for the base sales scenario.
Figure 26: Forecast Sales of chillers - Base Sales Scenario Australia
0
200
400
600
800
1,000
1,200
1,400
2000
2001
2002
2003
2004
2005
2006
2007
2008
2009
2010
2011
2012
2013
2014
2015
2016
2017
2018
2019
2020
Year
Sale
s
Air Cooled < 350 kWAir Cooled >350 - < 500 kWAir Cooled >500 - < 700 kWAir Cooled >700 - < 1000 kWAir Cooled >1000Water Cooled < 350 kWWater Cooled >350 - < 500 kWWater Cooled >500 - < 700 kWWater Cooled >700 - < 1000 kWWater Cooled >1000 - < 1500 kWWater Cooled >1500
The current trends indicate that Base Sales scenario is more likely however many factors can influence these projections. The competing Low sales scenario is shown in Figure 27. Please note that in both cases forecast values start from 2008.

E3 Committee CBA: MEPS and Alternative Strategies for Chillers August 2007
A-13
Figure 27: Forecast Sales of chillers - Low Sales Scenario Australia
0
100
200
300
400
500
600
700
800
900
2000
2001
2002
2003
2004
2005
2006
2007
2008
2009
2010
2011
2012
2013
2014
2015
2016
2017
2018
2019
2020
Year
Sale
s
Air Cooled < 350 kW Air Cooled >350 - < 500 kWAir Cooled >500 - < 700 kW Air Cooled >700 - < 1000 kWAir Cooled >1000 Water Cooled < 350 kWWater Cooled >350 - < 500 kW Water Cooled >500 - < 700 kWWater Cooled >700 - < 1000 kW Water Cooled >1000 - < 1500 kWWater Cooled >1500
Similar forecasts and sales estimates were also made for the New Zealand market, based on the assumption that New Zealand market, both in terms of stock and sales, is about 20% of Australian market. Figure 28 and Figure 29 show the forecast sales of chillers to 2020 by category in New Zealand for the base and low sales scenarios respectively.
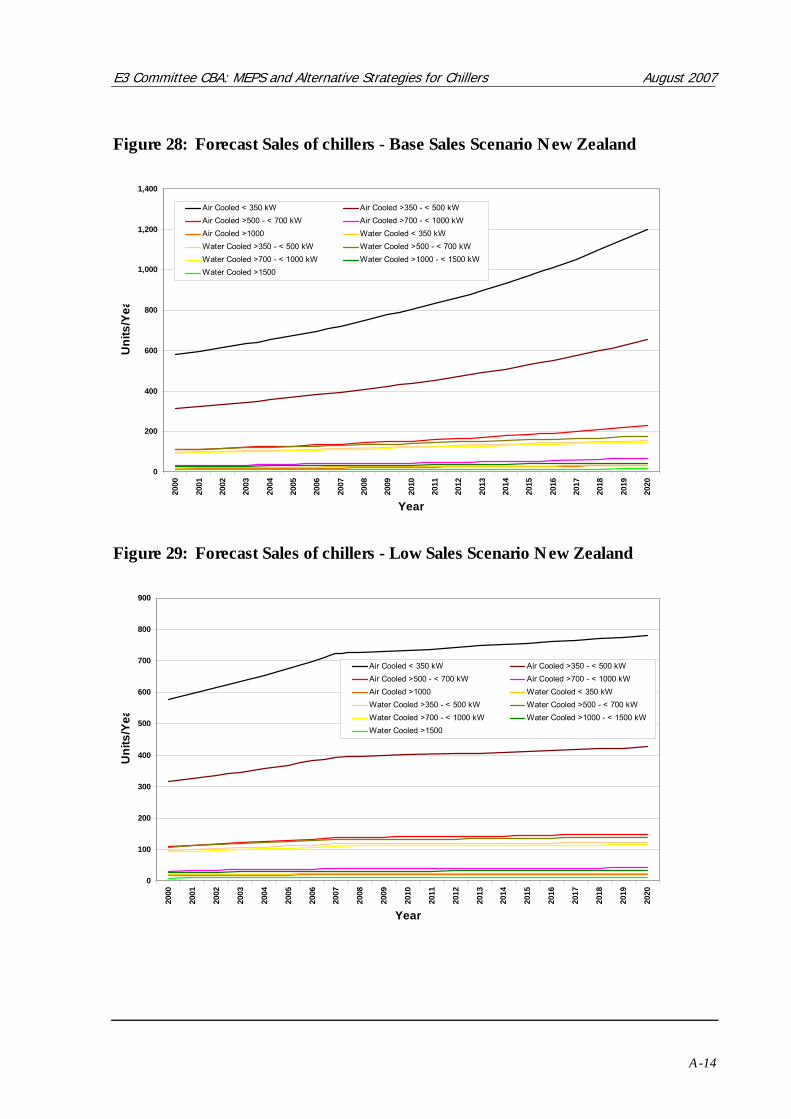
E3 Committee CBA: MEPS and Alternative Strategies for Chillers August 2007
A-14
Figure 28: Forecast Sales of chillers - Base Sales Scenario New Zealand
0
200
400
600
800
1,000
1,200
1,400
2000
2001
2002
2003
2004
2005
2006
2007
2008
2009
2010
2011
2012
2013
2014
2015
2016
2017
2018
2019
2020
Year
Uni
ts/Y
ea
Air Cooled < 350 kW Air Cooled >350 - < 500 kWAir Cooled >500 - < 700 kW Air Cooled >700 - < 1000 kWAir Cooled >1000 Water Cooled < 350 kWWater Cooled >350 - < 500 kW Water Cooled >500 - < 700 kWWater Cooled >700 - < 1000 kW Water Cooled >1000 - < 1500 kWWater Cooled >1500
Figure 29: Forecast Sales of chillers - Low Sales Scenario New Zealand
0
100
200
300
400
500
600
700
800
900
2000
2001
2002
2003
2004
2005
2006
2007
2008
2009
2010
2011
2012
2013
2014
2015
2016
2017
2018
2019
2020
Year
Uni
ts/Y
ea
Air Cooled < 350 kW Air Cooled >350 - < 500 kWAir Cooled >500 - < 700 kW Air Cooled >700 - < 1000 kWAir Cooled >1000 Water Cooled < 350 kWWater Cooled >350 - < 500 kW Water Cooled >500 - < 700 kWWater Cooled >700 - < 1000 kW Water Cooled >1000 - < 1500 kWWater Cooled >1500

E3 Committee CBA: MEPS and Alternative Strategies for Chillers August 2007
A-15
Sales by States and New Zealand
Based on the earlier forecasts of sales, the share of chiller sales by State/Territory for the period 2000 – 2020 are shown in Table 22 while Figure 30 graphically illustrates the sales trends. New Zealand sales are the total sales for New Zealand, where the Australian State and Territory data is based on estimates provided by industry sources.
Table 22: Total annual sales of chillers 2000-2020, by States, Australia as a whole and New Zealand – Base sales scenario
YEAR NSW & ACT NT QLD SA TAS VIC WA AUST NZ
2000 364 14 280 168 28 336 210 1,400 280 2001 375 14 288 173 29 346 216 1,442 288 2002 387 15 297 178 30 357 223 1,487 297 2003 398 15 307 184 31 368 230 1,533 307 2004 411 16 316 190 32 379 237 1,581 316 2005 424 16 326 196 33 391 245 1,631 326 2006 437 17 337 202 34 404 252 1,683 337 2007 452 17 347 208 35 417 261 1,737 347 2008 466 18 359 215 36 431 269 1,794 359 2009 482 19 371 222 37 445 278 1,854 371 2010 498 19 383 230 38 460 287 1,916 383 2011 515 20 396 238 40 476 297 1,982 396 2012 533 21 410 246 41 492 308 2,050 410 2013 552 21 424 255 42 509 318 2,122 424 2014 571 22 440 264 44 528 330 2,198 440 2015 592 23 456 273 46 547 342 2,278 456 2016 614 24 472 283 47 567 354 2,361 472 2017 637 24 490 294 49 588 367 2,450 490 2018 661 25 509 305 51 610 381 2,543 509 2019 687 26 528 317 53 634 396 2,642 528 2020 714 27 549 329 55 659 412 2,746 549

E3 Committee CBA: MEPS and Alternative Strategies for Chillers August 2007
A-16
Figure 30: Annual sales of chillers by State, Australia and NZ – Base sales scenario
0
500
1,000
1,500
2,000
2,500
3,000
2000
2001
2002
2003
2004
2005
2006
2007
2008
2009
2010
2011
2012
2013
2014
2015
2016
2017
2018
2019
2020
Year
No
of U
nit
NSW & ACTNTQLDSATASVICWAAUSTNZ
Chillers – Stock Trends
Stock by Category
Chillers often have very long life. Typically chillers have a life span of between 10 and 20 years. Water-cooled chillers are know to have longer life span than the air-cooled types. The long life of chillers makes it complicated to estimate the number of chillers by their technology, cooling capacity, and age. Identifying the chillers by these three attributes is important from the point of view of having reliable estimates of energy consumption and GHG emissions, as older chillers are considered to be less efficient than new units.
Once again to estimate historic and forecast stock, the values for the year 2000 were used as reference. The estimated stock in 2000 and its breakdown by technology and cooling capacity were provided by the industry sources. It was estimated that in year 2000 around 15,000 chillers were operating in Australia. Of all the operating chillers 54% were estimated to be water-cooled and remaining were the air-cooled types. An estimated breakdown of air and water-cooled chiller stock in 2000 has been shown in Table 21. The resulting breakdown was subjected to backwards distribution across 15 to 20 years on the basis of annual sales estimates and a survival function that reflects the life span of water and air-cooled chillers. Consequently the year 2000 stock was broken down, first by technology and cooling capacity based on values in Table 21, followed by each category broken down into estimated number of units over past several years up to the maximum life of technology (15 years for air-cooled and 20 years for water-cooled). The

E3 Committee CBA: MEPS and Alternative Strategies for Chillers August 2007
A-17
resulting breakdown was subjected to appropriate “survival functions” to re-estimate the year 2000 stock. Please note the chillers stock re-estimated as above, now provides another level of breakdown i.e. the age of chillers, which when applied with relevant energy performance values, was used to estimate more reliable energy and GHG emission estimates.
Because of different operating behaviour and life spans, two different survival functions were generated for water and air-cooled types. The survival functions shown in Figure 31 and Figure 32 provide a graphical view of the percentage of chillers (Rt) in useful service over the life in years from purchase (t).
Figure 31: Survival Function of water-cooled chillers for Australia and New Zealand
Survival Function (Water Cooled)
0%10%20%30%40%50%60%70%80%90%
100%
0 5 10 15 20t
R(t)
Figure 32: Survival Function of air-cooled chillers for Australia and New Zealand
Survival Function (Air Cooled)
0%10%20%30%40%50%60%70%80%90%
100%
0 5 10 15 20t
R(t)

E3 Committee CBA: MEPS and Alternative Strategies for Chillers August 2007
A-18
The resulting estimated stock of chillers by category for Australia over the period 2000 – 2020 is shown in Figure 33 for the base sales scenario and Figure 34 for the low sales scenario.
Figure 33: Forecast Stock of chillers - Base Sales Scenario Australia
y g y
0
2,000
4,000
6,000
8,000
10,000
12,000
14,000
16,000
18,000
2000
2001
2002
2003
2004
2005
2006
2007
2008
2009
2010
2011
2012
2013
2014
2015
2016
2017
2018
2019
2020
Year
Uni
ts
Air Cooled < 350 kW Air Cooled >350 - < 500 kWAir Cooled >500 - < 700 kW Air Cooled >700 - < 1000 kWAir Cooled >1000 Water Cooled < 350 kWWater Cooled >350 - < 500 kW Water Cooled >500 - < 700 kWWater Cooled >700 - < 1000 kW Water Cooled >1000 - < 1500 kWWater Cooled >1500
Figure 34: Forecast Stock of chillers - Low Sales Scenario Australia
0
2,000
4,000
6,000
8,000
10,000
12,000
14,000
16,000
2000
2001
2002
2003
2004
2005
2006
2007
2008
2009
2010
2011
2012
2013
2014
2015
2016
2017
2018
2019
2020
Year
Uni
ts
Air Cooled < 350 kW Air Cooled >350 - < 500 kWAir Cooled >500 - < 700 kW Air Cooled >700 - < 1000 kWAir Cooled >1000 Water Cooled < 350 kWWater Cooled >350 - < 500 kW Water Cooled >500 - < 700 kWWater Cooled >700 - < 1000 kW Water Cooled >1000 - < 1500 kWWater Cooled >1500

E3 Committee CBA: MEPS and Alternative Strategies for Chillers August 2007
A-19
Similarly in NZ, the stock of chillers by category for the period 2000 – 2020, for the base sales scenario is shown in Figure 35 and Figure 36 for the low sales scenario.
Figure 35: Forecast Stock of chillers - Base Sales Scenario New Zealand
0
500
1,000
1,500
2,000
2,500
3,000
3,500
2000
2001
2002
2003
2004
2005
2006
2007
2008
2009
2010
2011
2012
2013
2014
2015
2016
2017
2018
2019
2020
Year
Uni
ts .
.
Air Cooled < 350 kW Air Cooled >350 - < 500 kW
Air Cooled >500 - < 700 kW Air Cooled >700 - < 1000 kW
Air Cooled >1000 Water Cooled < 350 kW
Water Cooled >350 - < 500 kW Water Cooled >500 - < 700 kW
Water Cooled >700 - < 1000 kW Water Cooled >1000 - < 1500 kW
Water Cooled >1500
Figure 36: Forecast Stock of chillers - Low Sales Scenario New Zealand
0
500
1,000
1,500
2,000
2,500
3,000
3,500
2000
2001
2002
2003
2004
2005
2006
2007
2008
2009
2010
2011
2012
2013
2014
2015
2016
2017
2018
2019
2020
Year
Uni
ts .
.
Air Cooled < 350 kW Air Cooled >350 - < 500 kW
Air Cooled >500 - < 700 kW Air Cooled >700 - < 1000 kW
Air Cooled >1000 Water Cooled < 350 kW
Water Cooled >350 - < 500 kW Water Cooled >500 - < 700 kW
Water Cooled >700 - < 1000 kW Water Cooled >1000 - < 1500 kW
Water Cooled >1500

E3 Committee CBA: MEPS and Alternative Strategies for Chillers August 2007
A-20
Stock by States and New Zealand
The estimates of chillers stock for the period between 2000 and 2020 by states, Australia as a whole and New Zealand are provided in Table 23 while Figure 37 shows the corresponding trend.
Table 23: Stock of chillers 2000-2020, by States, Australia as a whole and New Zealand (base sales scenario)
YEAR NSW & ACT NT QLD SA TAS VIC WA AUST NZ
2000 3,959 152 3,046 1,827 305 3,655 2,284 15,229 3,046 2001 4,175 161 3,212 1,927 321 3,854 2,409 16,059 3,212 2002 4,406 169 3,389 2,034 339 4,067 2,542 16,947 3,389 2003 4,652 179 3,578 2,147 358 4,294 2,684 17,892 3,578 2004 4,912 189 3,778 2,267 378 4,534 2,834 18,891 3,778 2005 5,185 199 3,988 2,393 399 4,786 2,991 19,942 3,988 2006 5,471 210 4,208 2,525 421 5,050 3,156 21,041 4,208 2007 5,768 222 4,437 2,662 444 5,324 3,328 22,185 4,437 2008 6,076 234 4,674 2,804 467 5,609 3,505 23,369 4,674 2009 6,393 246 4,918 2,951 492 5,901 3,688 24,589 4,918 2010 6,718 258 5,168 3,101 517 6,202 3,876 25,840 5,168 2011 7,049 271 5,423 3,254 542 6,507 4,067 27,113 5,423 2012 7,384 284 5,680 3,408 568 6,816 4,260 28,400 5,680 2013 7,719 297 5,938 3,563 594 7,125 4,453 29,688 5,938 2014 8,049 310 6,192 3,715 619 7,430 4,644 30,960 6,192 2015 8,373 322 6,440 3,864 644 7,729 4,830 32,202 6,440 2016 8,686 334 6,681 4,009 668 8,018 5,011 33,407 6,681 2017 8,994 346 6,919 4,151 692 8,302 5,189 34,594 6,919 2018 9,305 358 7,158 4,295 716 8,590 5,368 35,790 7,158 2019 9,626 370 7,405 4,443 740 8,886 5,553 37,023 7,405 2020 9,963 383 7,664 4,598 766 9,196 5,748 38,318 7,664

E3 Committee CBA: MEPS and Alternative Strategies for Chillers August 2007
A-21
Figure 37: Trend - Stock of chillers 2000 – 2020 by States, Australia as a whole and New Zealand (base sales scenario)
0
5,000
10,000
15,000
20,000
25,000
30,000
35,000
40,000
45,000
2000
2001
2002
2003
2004
2005
2006
2007
2008
2009
2010
2011
2012
2013
2014
2015
2016
2017
2018
2019
2020
Year
No
of U
nits
.
NSW & ACTNTQLDSATASVICWAAUSTNZ

E3 Committee CBA: MEPS and Alternative Strategies for Chillers August 2007
A-22
Appendix 5: Energy Prices and Factors
Table 24: Marginal Commercial Electricity Tariffs 2005-06
State c/kWh Commercial NSW 14.0 Victoria 16.0 Queensland 15.0 SA 16.0 WA 15.0 Tasmania 14.0 NT 17.0 ACT 14.9 Australia (weighted) 14.9 New Zealand 16.0
Source: Guide to Preparing Regulation Impact Statements for the Appliance and Equipment Energy Efficiency Program (NAEEEP)
Table 25: Avoided Marginal Costs of Electricity
State c/kWh Avoided Costs of Electricity NSW 9.1 Victoria 11.1 Queensland 9.8 SA 10.4 WA 9.1 Tasmania 10.4 NT 9.8 ACT 6.4 Australia (weighted) 10.4 New Zealand 9.7
Based on 65% of Marginal Tariff (Syneca 2006)

E3 Committee CBA: MEPS and Alternative Strategies for Chillers August 2007
A-23
Appendix 6: Calculation Methodology The following Appendix describes the assumptions, data sources and calculation steps and methodology for this RIS.
This methodology and the assumptions made are the basis of the Costs, Benefits and Impacts of the proposal. As such, careful scrutiny and feedback is sought from stakeholders in this consultative phase.
Power and Usage
Energy used by chillers is a function of average electrical input power, number of operating units and average number of hours of operation. In turn the GHG emission is a function of energy consumption and generation mix by type of technology.
The number of operating units is a function of existing stock, replacements and new sales. Estimates of stock and sales were made for all Australia and New Zealand as detailed in Appendix 4: Stock and Sales. Combination of running stock and new sales were subjected to a “survival function” that reflected the life span of typical chillers. These sales, in combination with the survival function, were multiplied by BAU and MEPS average power input figures and corresponding average number of hours of operation for each category.
It is worth noting that chillers are known to operate at variable loads throughout a year. Therefore, the energy performance of chillers is often measured at Integrated Part-Load Value (IPLV). The loading values that are generally used to measure energy performance are 100%, 75%, 50% and 25%.
The input power to a chiller is a function of the commonly used coefficient of performance (COP) of the chiller. The COP and cooling capacity in kW are the commonly used technical attributes of chillers. The input power in kW can be calculated as;
COP(kWr)Capacity Cooling(kW)Power Input =
The COP of a chiller varies by the value of its loading. Hence different values of COP, and consequently power input, need to be used for different IPLV loading values as above.
The industry consultation yielded estimated sets of net COPs under various IPLV loading conditions as above and estimated average times of operation, for current BAU operations and proposed MEPS requirements. The net IPLV COP is time weighted average of COPs at four IPLV loading intervals as above. This is illustrated as below;

E3 Committee CBA: MEPS and Alternative Strategies for Chillers August 2007
A-24
Table 26: Example of calculation of NET IPLV COP
IPLV Loading Intervals 100% 75% 50% 25% Proportional Operating Time 1% 42% 45% 12% Corresponding COP 4.20 5.00 6.00 7.00
68.500.7%1200.6%4500.5%4220.4%1COP IPLVNet =×+×+×+×=
The BAU and MEPS average cooling capacities, COPs and input power for IPLV loading intervals for each category of chillers are shown in Appendix 10: To determine the total energy consumption, these values were multiplied by their respective usage characteristics as applicable to different states and New Zealand.
In order to estimate energy performance under BAU and MEPS situations, industry sources provided standard values for hours of operation of average chillers under four IPLV loading intervals as shown in Table 27. The actual average operating hours under four IPLV loading intervals varies because of different weather conditions. As such the average operating hours have been estimated separately for each state and for New Zealand. While these estimates are based on average number heating, cooling and neutral days, industry sources were consulted to verify the validity of these estimates. The estimated usage, applied to different categories of chillers, in each state is shown in Table 27 for the base case scenario.
The values for low and high usage scenarios were calculated by reducing or increasing the portion of Off period by 20% and distributing the difference across four categories of IPLV loading intervals according to their proportional share in base usage scenario.
Table 28 and Table 29 show the operating hours for low and high usage scenarios respectively.
Table 27: Hours of Operation by IPLV loading intervals as percentage of total time (8,666 hours in a year) (Base Usage Scenario)
IPLV Loads NSW NT QLD SA TAS VIC WA NZ 100% 4.5% 7.0% 7.0% 4.0% 3.5% 4.0% 4.5% 4.0% 75% 16.0% 20.1% 20.1% 12.0% 9.8% 12.0% 16.0% 12.0% 50% 1.0% 1.5% 1.5% 1.2% 1.0% 1.2% 1.0% 1.2% 25% 0.5% 0.0% 0.0% 0.3% 0.3% 0.3% 0.5% 0.3% Off 78.0% 71.4% 71.4% 82.5% 85.4% 82.5% 78.0% 82.5%

E3 Committee CBA: MEPS and Alternative Strategies for Chillers August 2007
A-25
Table 28: Hours of Operation by IPLV loading intervals as percentage of total time (8,666 hours in a year) (Low Usage Scenario)
IPLV Loads NSW NT QLD SA TAS VIC WA NZ 100% 3.6% 5.6% 5.6% 3.2% 2.8% 3.2% 3.6% 3.2% 75% 12.8% 16.1% 16.1% 9.6% 7.8% 9.6% 12.8% 9.6% 50% 0.8% 1.2% 1.2% 1.0% 0.8% 1.0% 0.8% 1.0% 25% 0.4% 0.0% 0.0% 0.2% 0.2% 0.2% 0.4% 0.2% Off 82.4% 77.1% 77.1% 86.0% 88.3% 86.0% 82.4% 86.0%
Table 29: Hours of Operation by IPLV loading intervals as percentage of total time (8,666 hours in a year) (High Usage Scenario)
IPLV Loads NSW NT QLD SA TAS VIC WA NZ 100% 5.4% 8.4% 8.4% 4.8% 4.2% 4.8% 5.4% 4.8% 75% 19.2% 24.1% 24.1% 14.4% 11.8% 14.4% 19.2% 14.4% 50% 1.2% 1.8% 1.8% 1.4% 1.2% 1.4% 1.2% 1.4% 25% 0.6% 0.0% 0.0% 0.4% 0.4% 0.4% 0.6% 0.4% Off 73.6% 65.7% 65.7% 79.0% 82.5% 79.0% 73.6% 79.0%
Energy and Greenhouse
Generally the sum of direct and indirect energy consumption is used to provide the net energy consumption used for all subsequent calculations. However, operation of chillers does not affect energy usage by other appliances. Consequently the indirect energy resulting due to the operation of chillers is either none or negligible.
The GHG emissions were estimated by using the State energy calculations combined with the Greenhouse Gas Emissions Factors in Appendix 8.
Cost-Benefits
The NPV benefits are calculated for each State using the avoided costs of electricity as shown in Appendix 5: Energy Prices and Factors multiplied by the energy savings calculated earlier. The incremental costs are based upon industry information and shown in Table 7. These costs are multiplied by the sales of product to obtain the customer costs. The sum of these customer costs, the supplier costs and government costs provide the total costs for the MEPS option.
Sensitivity Scenarios
To test the sensitivity of the analysis outputs, scenarios were developed as follows: • Two sales scenarios were modelled. Base and Low Growth. • Three usage scenarios were modelled – high, base and low Usage • Several incremental cost scenarios were modelled as shown in Figure 23.
E3 Committee CBA: MEPS and Alternative Strategies for Chillers August 2007
A-26
Appendix 7: Australian ETS Provisional Benefits to Be Included in Future
The potential impact of an Australian emissions trading scheme (ETS) on the benefit-cost ratio is assessed in this appendix. On 3 June 2007, the Prime Minister announced that Australia will implement a domestic emissions trading system beginning no later than 2012, and that the Government will set a national emissions target in 2008. The ETS has the potential to increase the national benefits as a cost is imposed on greenhouse gas (GHG) emissions. Hence the CBA should take into account the increased benefits due to the avoided cost of carbon permits for electricity generators, which will result from the proposed MEPS reducing the consumption and generation of electricity at the margin.
These valuations are included as a trial in this CBA and will be included within the main analysis once the Australian Government has set out parameters for how the emissions trading scheme will operate and this CBA methodology has been trialled and reviewed.
A number of possible methodologies could be used to value the GHG emissions abatement, such as using a separate carbon price or using retail electricity tariffs that include the effects of the ETS. The most appropriate approach can be determined once the Government has made decisions on how the ETS will operate (which will clarify how a new MEPS and the ETS interact) and once modelling of future electricity prices under emissions trading is available.
In the interim, the MCE E3 Committee plans to use the valuation methodology discussed below, and to revisit the choice of methodology once more information is available. The approach essentially involves sensitivity testing of a range of plausible carbon prices.
The methodology values abatement at the shadow price of the carbon permit price on the basis that by introducing emissions trading the Government has placed a carbon constraint on the economy and created a market value for emission reductions (i.e., “commoditised” emissions). Abatement is also shown in tonnes of greenhouse gases for information. With an ETS operating in the economy, any new MEPS should have its abatement valued in terms of the counter-factual cost of achieving the same abatement through other measures in the ETS.
As this CBA is a partial equilibrium analysis, it values the costs and benefits of the proposed measure at the prevailing prices in the economy, assuming the impact of the measure has negligible impact on those prices. As already noted in Section 5.6, the MEPS will reduce the consumption of electricity at the margin and this reduction is valued at the avoided cost of electricity generation and transmission for the economy – hence it provides the basis of the national benefits.

E3 Committee CBA: MEPS and Alternative Strategies for Chillers August 2007
A-27
Similarly, a partial equilibrium analysis takes the ETS cap as given, assuming any new individual MEPS will have negligible impact on the carbon market and cap. Therefore the GHG emissions reduction is valued at the expected prevailing carbon permit price. This implicitly recognises that the emissions avoided through the MEPS will obviate the need for an equivalent amount of abatement elsewhere in the economy. Using the same approach as for the avoided cost of electricity generation and transmission, the avoided cost of carbon permits is added to the national benefits.
The carbon prices for sensitivity analysis are shown at $0, $10 and $20/t CO2-e from 2012 and Table 30 reports the effect of this on the CBA.
Although the future carbon price under the ETS is uncertain at present, emissions trading will mean the estimated benefits will always be higher than without emissions trading (i.e., the benefits will always be higher when the carbon price is above zero).
Table 30: Carbon Permit Sensitivity Analysis – Australia Base Sales Growth
$0/t CO2-e Carbon Permit Price
NPV Nil (0%)
NPV Low (5%)
NPV Med (7.5%)
NPV High (10%)
Total Costs $136,724,718 $69,988,540 $51,225,257 $38,005,174
Total Benefits $380,445,336 $166,580,217 $112,846,609 $77,583,503
Net Benefits $319,809,685 $129,907,721 $84,190,674 $55,095,030
Benefit-Cost Ratio 2.8 2.4 2.2 2.0
Cumulative Mt CO2-e Abatement (2012 -2020) 3.2
Potential Carbon Permit Avoided Costs Additional Avoided Carbon Costs @ $10/t CO2-e from 2012
$32,150,339 $13,611,754 $9,040,941 $6,082,468
Additional Avoided Carbon Costs @ $20/t CO2-e from 2012
$64,300,679 $27,223,509 $18,081,882 $12,164,937
Changes to Benefit-Cost Ratio
BCR with @ $10/t CO2-e from 2012 3.0 2.6 2.4 2.2
BCR with @ $20/t CO2-e from 2012 3.3 2.8 2.6 2.4
As the table shows, a potential carbon permit price of $10/t CO2-e would increase the BCR from 2.2 to 2.4; likewise the permit price of $20/t CO2-e would increase the BCR to 2.6, at a discount rate of 7.5%.

E3 Committee CBA: MEPS and Alternative Strategies for Chillers August 2007
A-28
Appendix 8: Greenhouse Gas Emissions Factors
Table 31: Projected Marginal Emissions Factors: Electricity by State 2000-2020
Region 2000 2001 2002 2003 2004 2005 2006 2007 2008 2009 2010 2011 2012 2013 2014 2015 2016 2017 2018 2019 2020 NSW+ ACT
0.950 0.950 0.958 1.018 1.027 1.021 1.031 1.039 1.018 0.987 0.975 0.963 0.965 0.945 0.961 0.919 0.910 0.883 0.888 0.881 0.866
VIC 0.988 0.988 0.992 1.122 1.128 1.106 1.117 1.130 1.130 1.094 1.075 1.086 1.105 1.085 1.112 1.048 1.023 0.992 0.995 0.965 0.936 Qld 1.053 1.053 1.035 1.021 0.991 1.020 0.994 1.022 0.979 0.935 0.935 0.929 0.932 0.901 0.929 0.912 0.901 0.894 0.874 0.864 0.869 SA 1.020 1.020 1.003 1.163 1.167 1.112 1.123 1.153 1.161 1.113 1.093 1.099 1.120 1.078 1.093 1.014 0.993 0.986 0.979 1.000 0.955 WA 1.040 1.040 0.996 1.038 1.029 0.906 0.884 0.868 0.885 0.890 0.894 0.830 0.826 0.823 0.838 0.845 0.855 0.817 0.804 0.808 0.810 NT 0.008 0.008 0.008 0.754 0.757 0.760 0.760 0.764 0.770 0.769 0.775 0.779 0.727 0.732 0.735 0.739 0.743 0.747 0.750 0.752 0.754 Tas 0.651 0.651 0.663 0.840 0.769 0.769 0.902 1.007 1.024 1.033 0.998 0.993 1.000 1.016 1.005 1.038 0.984 0.965 0.954 0.966 0.976 New Zealand
0.600 0.600 0.600 0.600 0.600 0.600 0.600 0.600 0.600 0.600 0.600 0.600 0.600 0.600 0.600 0.600 0.600 0.600 0.600 0.600 0.600
Source: www.greenhouse.gov.au/ggap/round3/emission-factors.html: see separate emissions factor file for each State. Regional weightings by GWA All values state-wide average kg CO2-e per kWh delivered, taking into account transmission and distribution losses (combustion emissions only).

E3 Committee CBA: MEPS and Alternative Strategies for Chillers August 2007
A-29
Appendix 9: Population and Household Numbers 2001 2002 2003 2004 2005 2006 2007 2008 2009 2010 2011 2012 2013 2014 2015 2016 2017 2018 2019 2020 NSW HH ('000) 2489.1 2523.5 2557.8 2591.9 2625.7 2659.6 2692.2 2724.6 2756.8 2789.2 2821.4 2852.1 2882.6 2912.7 2942.9 2972.5 3001.7 3030.3 3058.4 3086.0 Persons 6513.2 6566.2 6619.7 6673.5 6727.8 6782.6 6830.1 6878.0 6926.1 6974.6 7023.5 7067.8 7112.3 7157.1 7202.2 7247.6 7288.8 7330.3 7372.0 7413.9 VIC HH ('000) 1836.1 1859.4 1882.6 1905.5 1928.1 1950.6 1971.6 1992.4 2012.9 2033.6 2053.8 2072.6 2091.1 2109.3 2127.5 2144.9 2162.1 2178.7 2194.9 2210.7 Persons 4756.5 4786.0 4815.7 4845.6 4875.6 4905.9 4930.5 4955.1 4979.9 5004.9 5029.9 5051.2 5072.6 5094.1 5115.6 5137.3 5155.7 5174.2 5192.8 5211.4 QLD HH ('000) 1410.9 1443.6 1476.9 1510.1 1543.5 1577.3 1609.9 1642.8 1675.8 1709.3 1742.9 1775.2 1807.4 1839.6 1872 1904.2 1936.0 1967.7 1999.0 2030.1 Persons 3645.6 3705.5 3766.4 3828.3 3891.2 3955.1 4013.0 4071.8 4131.5 4192.0 4253.4 4310.6 4368.5 4427.3 4486.8 4547.1 4608.9 4671.6 4735.1 4799.5 SA HH ('000) 617.8 623.7 629.5 635.3 640.9 646.5 651.3 655.9 660.6 665.1 669.5 673.2 676.7 680.2 683.6 686.7 689.8 692.7 695.4 697.9 Persons 1502.4 1506.5 1510.7 1514.8 1519.0 1523.2 1525.5 1527.8 1530.1 1532.4 1534.7 1535.9 1537.1 1538.4 1539.6 1540.8 1541.0 1541.2 1541.5 1541.7 WA HH ('000) 750.3 767.1 784.0 801.1 818.1 835.4 852.0 868.8 885.3 902.0 918.8 934.6 950.4 966.1 981.9 997.5 1012.8 1028.1 1043.2 1058.2 Persons 1920.1 1948.7 1977.8 2007.2 2037.1 2067.5 2095.5 2123.8 2152.6 2181.7 2211.2 2238.8 2266.8 2295.2 2323.9 2352.9 2379.8 2407.0 2434.5 2462.4 TAS HH ('000) 192.2 193.4 194.6 195.8 196.9 198.0 198.7 199.4 200.1 200.7 201.3 201.5 201.6 201.8 201.8 201.7 201.6 201.3 201.0 200.5 Persons 470.3 469.2 468.2 467.1 466.1 465.0 463.3 461.6 459.9 458.2 456.5 454.3 452.2 450.0 447.9 445.8 443.1 440.5 437.8 435.2 NT HH ('000) 69.1 70.9 72.6 74.3 76.1 77.9 79.6 81.4 83.2 85.0 86.9 88.8 90.6 92.5 94.3 96.2 98.1 100 101.8 103.7 Persons 204.7 208.5 212.3 216.2 220.2 224.2 228.0 231.9 235.8 239.8 243.9 247.9 251.9 256.0 260.2 264.4 268.5 272.7 276.9 281.2 ACT HH ('000) 123.6 125.6 127.6 129.6 131.5 133.5 135.2 137 138.7 140.5 142.2 143.8 145.3 146.8 148.3 149.8 151.3 152.7 154.0 155.3 Persons 319.8 322.4 325.1 327.8 330.5 333.2 335.5 337.8 340.2 342.5 344.9 347.0 349.1 351.2 353.3 355.4 357.3 359.1 361.0 362.9 AUST HH ('000) 7489.1 7607.2 7725.6 7843.6 7960.8 8078.8 8190.5 8302.3 8413.4 8525.4 8636.8 8741.8 8845.7 8949 9052.3 9153.5 9253.4 9351.5 9447.7 9542.4 Persons 19333 19513 19696 19881 20068 20257 20421 20588 20756 20926 21098 21253 21411 21569 21729 21891 22043 22197 22352 22508 Persons/HH 2.58 2.57 2.55 2.53 2.52 2.51 2.49 2.48 2.47 2.45 2.44 2.43 2.42 2.41 2.40 2.39 2.38 2.37 2.37 2.36 NZ HH ('000) 1441.0 1461.8 1482.9 1504.3 1526.0 1548 1566.2 1584.6 1603.1 1622.0 1641 1659.0 1677.2 1695.6 1714.2 1733 1749.7 1766.5 1783.5 1800.7 Persons 3880.0 3924.8 3970.0 4015.8 4062.1 4109 4136.4 4164.0 4191.8 4219.8 4248 4273.9 4299.9 4326.1 4352.5 4379 4404.1 4429.3 4454.7 4480.2 Persons/HH 2.69 2.68 2.68 2.67 2.66 2.65 2.64 2.63 2.61 2.60 2.59 2.58 2.56 2.55 2.54 2.53 2.52 2.51 2.50 2.49 ANZ HH ('000) 8930 9069 9208 9348 9487 9627 9757 9887 10017 10147 10278 10401 10523 10645 10766 10887 11003 11118 11231 11343 Persons 23213 23438 23666 23896 24130 24366 24558 24752 24948 25146 25346 25527 25710 25895 26082 26270 26447 26626 26806 26988 Persons/HH 2.60 2.58 2.57 2.56 2.54 2.53 2.52 2.50 2.49 2.48 2.47 2.45 2.44 2.43 2.42 2.41 2.40 2.39 2.39 2.38
Source: ABS 3236.0 Household and Family Projections Australia 1996 to 2021; Statistics New Zealand

E3 Committee CBA: MEPS and Alternative Strategies for Chillers August 2007
A-30
Appendix 10: Cooling Capacity, BAU & MEPS COPs and Input Power by Chiller Categories
Chiller Category Average Cooling Capacity (kW)
IPLV Load Interval
BAU COP
BAU Power Input (kW)
MEPS COP
MEPS Power Input
(kW) 100% 2.20 60.00 2.20 60.00
75% 3.10 42.58 3.10 42.58
50% 3.50 37.71 3.50 37.71
25% 4.50 29.33 4.50 29.33
Air-Cooled < 350 kW 132
Net 3.44 38.38 3.44 38.38
100% 2.20 193.18 2.50 170.00
75% 3.10 137.10 3.50 121.43
50% 3.50 121.43 4.00 106.25
25% 4.50 94.44 5.00 85.00
Air-Cooled >350 - < 500 kW 425
Net 3.44 123.58 3.69 115.18
100% 2.20 277.27 2.50 244.00
75% 3.00 203.33 3.50 174.29
50% 3.60 169.44 4.00 152.50
25% 4.60 132.61 5.00 122.00
Air-Cooled >500 - < 700 kW 610
Net 3.45 176.61 3.90 156.61
100% 2.60 326.92 2.80 303.57
75% 3.50 242.86 3.80 223.68
50% 4.00 212.50 4.30 197.67
25% 5.40 157.41 5.80 146.55
Air-Cooled >700 - < 1000 kW 850
Net 3.94 215.52 4.26 199.76

E3 Committee CBA: MEPS and Alternative Strategies for Chillers August 2007
A-31
Chiller Category Average Cooling Capacity (kW)
IPLV Load Interval
BAU COP
BAU Power Input (kW)
MEPS COP
MEPS Power Input
(kW) 100% 2.70 537.04 2.80 517.86
75% 3.40 426.47 3.80 381.58
50% 4.30 337.21 4.30 337.21
25% 5.70 254.39 5.80 250.00
Air-Cooled >1000 1,450
Net 4.07 355.92 4.26 340.78
100% 3.60 36.67 3.60 36.67
75% 4.30 30.70 4.30 30.70
50% 5.15 25.63 5.15 25.63
25% 6.00 22.00 6.00 22.00
Water-Cooled < 350 kW 132
Net 4.88 27.05 5.68 23.23
100% 3.75 113.33 4.10 103.66
75% 4.50 94.44 5.00 85.00
50% 5.65 75.22 6.20 68.55
25% 6.50 65.38 7.10 59.86
Water-Cooled >350 - < 500 kW 425
Net 5.25 80.95 5.78 73.49
100% 4.30 141.86 5.90 103.39
75% 4.75 128.42 5.50 110.91
50% 5.80 105.17 6.70 91.04
25% 6.60 92.42 7.70 79.22
Water-Cooled >500 - < 700 kW 610
Net 5.44 112.13 6.31 96.70
100% 4.60 184.78 5.10 166.67
75% 5.15 165.05 5.70 149.12
50% 6.20 137.10 6.90 123.19
25% 7.00 121.43 7.90 107.59
Water-Cooled >700 - < 1000 kW 850
Net 5.84 145.57 6.50 130.81

E3 Committee CBA: MEPS and Alternative Strategies for Chillers August 2007
A-32
Chiller Category Average Cooling Capacity (kW)
IPLV Load Interval
BAU COP
BAU Power Input (kW)
MEPS COP
MEPS Power Input
(kW) 100% 5.10 284.31 5.70 254.39
75% 5.40 268.52 6.00 241.67
50% 6.50 223.08 7.20 201.39
25% 7.40 195.82 8.30 174.70
Water-Cooled >1000 - < 1500 kW 1,450
Net 6.13 236.44 6.81 212.83
100% 5.60 446.43 5.70 438.60
75% 5.70 438.60 6.00 416.67
50% 6.90 362.32 7.20 347.22
25% 7.90 316.46 8.30 301.20
Water-Cooled >1500 2,500
Net 6.45 387.72 6.81 366.95

E3 Committee CBA: MEPS and Alternative Strategies for Chillers August 2007
A-33
Appendix 11: Annual Benefit and Cost Data Table 32: Annual Consumer Energy, Benefits and Costs by State for Australia & New Zealand: Base Sales Scenario
Year Units 2000 2001 2002 2003 2004 2005 2006 2007 2008 2009 2010 2011 2012 2013 2014 2015 2016 2017 2018 2019 2020Australia BAU Energy use GWh/yr 3791 3930 4084 4254 4437 4634 4844 5065 5297 5538 5788 6044 6305 6569 6831 7089 7341 7592 7846 8110 8387 With-program energy use GWh/yr 3791 3930 4084 4254 4437 4634 4844 5065 5259 5462 5672 5887 6106 6326 6542 6753 6957 7158 7360 7570 7791 Energy savings GWh/yr 0 0 0 0 0 0 0 0 37 76 116 157 199 243 288 335 384 434 486 540 596 Value of energy saved $M 0.0 0.0 0.0 0.0 0.0 0.0 0.0 0.0 5.6 11.4 17.4 23.6 30.0 36.6 43.4 50.4 57.7 65.3 73.1 81.2 89.6 Emissions saved (marginal) ktCO2-e 0 0 0 0 0 0 0 0 38 75 113 152 194 232 281 315 356 393 438 482 525 Additional appliance cost $M 0.0 0.0 0.0 0.0 0.0 0.0 0.0 0.0 14.9 13.9 12.9 12.0 11.1 10.4 9.6 9.0 8.4 7.8 7.3 6.8 6.3 NSW&ACT BAU Energy use GWh/yr 998 1035 1075 1119 1168 1219 1274 1332 1393 1456 1522 1589 1658 1727 1796 1864 1930 1996 2063 2132 2205 With-program energy use GWh/yr 998 1035 1075 1119 1168 1219 1274 1332 1383 1437 1492 1548 1606 1663 1720 1776 1829 1882 1935 1990 2048 Energy savings GWh/yr 0 0 0 0 0 0 0 0 10 20 30 41 52 64 76 88 101 114 128 142 157 Value of energy saved $M 0.0 0.0 0.0 0.0 0.0 0.0 0.0 0.0 1.4 2.8 4.3 5.8 7.3 8.9 10.6 12.3 14.1 16.0 17.9 19.9 21.9 Emissions saved (marginal) ktCO2-e 0 0 0 0 0 0 0 0 10 20 30 40 50 60 73 81 92 101 113 125 136 Additional appliance cost $M 0.0 0.0 0.0 0.0 0.0 0.0 0.0 0.0 3.9 3.6 3.3 3.1 2.9 2.7 2.5 2.3 2.2 2.0 1.9 1.8 1.6 NT BAU Energy use GWh/yr 51 52 55 57 59 62 65 68 71 74 77 81 84 88 91 95 98 102 105 108 112 With-program energy use GWh/yr 51 52 55 57 59 62 65 68 70 73 76 79 82 85 87 90 93 96 98 101 104 Energy savings GWh/yr 0 0 0 0 0 0 0 0 1 1 2 2 3 3 4 4 5 6 7 7 8 Value of energy saved $M 0.0 0.0 0.0 0.0 0.0 0.0 0.0 0.0 0.1 0.2 0.3 0.4 0.5 0.6 0.7 0.8 0.9 1.0 1.1 1.2 1.4 Emissions saved (marginal) ktCO2-e 0 0 0 0 0 0 0 0 0 1 1 2 2 2 3 3 4 4 5 5 6 Additional appliance cost $M 0.0 0.0 0.0 0.0 0.0 0.0 0.0 0.0 0.1 0.1 0.1 0.1 0.1 0.1 0.1 0.1 0.1 0.1 0.1 0.1 0.1 QLD BAU Energy use GWh/yr 1012 1049 1091 1136 1186 1238 1295 1354 1416 1481 1547 1616 1686 1757 1827 1896 1963 2030 2098 2169 2243 With-program energy use GWh/yr 1012 1049 1091 1136 1186 1238 1295 1354 1406 1460 1516 1574 1633 1691 1749 1806 1860 1914 1968 2024 2083 Energy savings GWh/yr 0 0 0 0 0 0 0 0 10 20 31 42 53 65 77 90 103 116 130 145 160 Value of energy saved $M 0.0 0.0 0.0 0.0 0.0 0.0 0.0 0.0 1.5 3.1 4.7 6.3 8.0 9.8 11.6 13.5 15.4 17.5 19.5 21.7 24.0 Emissions saved (marginal) ktCO2-e 0 0 0 0 0 0 0 0 10 19 29 39 50 59 72 82 93 104 114 125 139 Additional appliance cost $M 0.0 0.0 0.0 0.0 0.0 0.0 0.0 0.0 3.0 2.8 2.6 2.4 2.2 2.1 1.9 1.8 1.7 1.6 1.5 1.4 1.3

E3 Committee CBA: MEPS and Alternative Strategies for Chillers August 2007
A-34
Year Units 2000 2001 2002 2003 2004 2005 2006 2007 2008 2009 2010 2011 2012 2013 2014 2015 2016 2017 2018 2019 2020SA BAU Energy use GWh/yr 368 381 396 413 430 450 470 491 514 537 562 586 612 637 663 688 712 737 761 787 814 With-program energy use GWh/yr 368 381 396 413 430 450 470 491 510 530 550 571 592 614 635 655 675 695 714 735 756 Energy savings GWh/yr 0 0 0 0 0 0 0 0 4 7 11 15 19 24 28 32 37 42 47 52 58 Value of energy saved $M 0.0 0.0 0.0 0.0 0.0 0.0 0.0 0.0 0.6 1.2 1.8 2.4 3.1 3.8 4.5 5.2 6.0 6.7 7.5 8.4 9.2 Emissions saved (marginal) ktCO2-e 0 0 0 0 0 0 0 0 4 8 12 17 22 25 31 33 37 41 46 52 55 Additional appliance cost $M 0.0 0.0 0.0 0.0 0.0 0.0 0.0 0.0 1.8 1.7 1.5 1.4 1.3 1.2 1.2 1.1 1.0 0.9 0.9 0.8 0.8 TAS BAU Energy use GWh/yr 51 53 55 57 60 63 65 68 72 75 78 82 85 89 92 96 99 103 106 110 113 With-program energy use GWh/yr 51 53 55 57 60 63 65 68 71 74 77 80 83 86 88 91 94 97 100 102 105 Energy savings GWh/yr 0 0 0 0 0 0 0 0 1 1 2 2 3 3 4 5 5 6 7 7 8 Value of energy saved $M 0.0 0.0 0.0 0.0 0.0 0.0 0.0 0.0 0.1 0.1 0.2 0.3 0.4 0.5 0.5 0.6 0.7 0.8 0.9 1.0 1.1 Emissions saved (marginal) ktCO2-e 0 0 0 0 0 0 0 0 1 1 2 2 3 3 4 5 5 6 6 7 8 Additional appliance cost $M 0.0 0.0 0.0 0.0 0.0 0.0 0.0 0.0 0.3 0.3 0.3 0.2 0.2 0.2 0.2 0.2 0.2 0.2 0.1 0.1 0.1 VIC BAU Energy use GWh/yr 735 762 792 825 861 899 940 983 1028 1075 1123 1173 1224 1275 1326 1376 1425 1473 1523 1574 1628 With-program energy use GWh/yr 735 762 792 825 861 899 940 983 1020 1060 1101 1142 1185 1228 1270 1311 1350 1389 1428 1469 1512 Energy savings GWh/yr 0 0 0 0 0 0 0 0 7 15 22 30 39 47 56 65 74 84 94 105 115 Value of energy saved $M 0.0 0.0 0.0 0.0 0.0 0.0 0.0 0.0 1.2 2.4 3.6 4.9 6.2 7.5 8.9 10.4 11.9 13.5 15.1 16.7 18.5 Emissions saved (marginal) ktCO2-e 0 0 0 0 0 0 0 0 8 16 24 33 43 51 62 68 76 83 94 101 108 Additional appliance cost $M 0.0 0.0 0.0 0.0 0.0 0.0 0.0 0.0 3.6 3.3 3.1 2.9 2.7 2.5 2.3 2.2 2.0 1.9 1.7 1.6 1.5 WA BAU Energy use GWh/yr 576 597 620 646 674 703 735 769 804 840 878 917 956 996 1036 1075 1113 1151 1190 1230 1272 With-program energy use GWh/yr 576 597 620 646 674 703 735 769 798 829 861 893 926 960 992 1024 1055 1086 1116 1148 1182 Energy savings GWh/yr 0 0 0 0 0 0 0 0 6 11 18 24 30 37 44 51 58 66 74 82 90 Value of energy saved $M 0.0 0.0 0.0 0.0 0.0 0.0 0.0 0.0 0.8 1.7 2.6 3.6 4.5 5.5 6.6 7.6 8.7 9.9 11.0 12.3 13.5 Emissions saved (marginal) ktCO2-e 0 0 0 0 0 0 0 0 5 10 16 20 25 30 37 43 50 54 59 66 73 Additional appliance cost $M 0.0 0.0 0.0 0.0 0.0 0.0 0.0 0.0 2.2 2.1 1.9 1.8 1.7 1.6 1.4 1.3 1.3 1.2 1.1 1.0 0.9 NZ BAU Energy use GWh/yr 613 635 660 688 717 749 783 819 856 895 936 977 1020 1062 1105 1146 1187 1228 1269 1312 1356 With-program energy use GWh/yr 613 635 660 688 717 749 783 819 850 883 917 952 987 1023 1058 1092 1125 1158 1190 1224 1260 Energy savings GWh/yr 0 0 0 0 0 0 0 0 6 12 19 25 32 39 47 54 62 70 79 87 96 Value of energy saved $M 0.0 0.0 0.0 0.0 0.0 0.0 0.0 0.0 1.0 2.0 3.0 4.1 5.1 6.3 7.5 8.7 9.9 11.2 12.6 14.0 15.4 Emissions saved (marginal) ktCO2-e 0 0 0 0 0 0 0 0 4 7 11 15 19 24 28 32 37 42 47 52 58 Additional appliance cost $M 0.0 0.0 0.0 0.0 0.0 0.0 0.0 0.0 3.5 3.2 3.0 2.8 2.6 2.4 2.2 2.1 1.9 1.8 1.7 1.6 1.5

E3 Committee CBA: MEPS and Alternative Strategies for Chillers August 2007
A-35
Table 33: Annual Consumer Energy, Benefits and Costs by State for Australia & New Zealand: Low Sales Scenario
Year Units 2000 2001 2002 2003 2004 2005 2006 2007 2008 2009 2010 2011 2012 2013 2014 2015 2016 2017 2018 2019 2020Australia BAU Energy use GWh/yr 3791 3930 4084 4254 4437 4634 4844 5065 5286 5506 5723 5934 6138 6330 6507 6665 6802 6920 7025 7121 7210 With-program energy use GWh/yr 3791 3930 4084 4254 4437 4634 4844 5065 5250 5433 5613 5788 5954 6109 6249 6369 6468 6549 6615 6673 6723 Energy savings GWh/yr 0 0 0 0 0 0 0 0 36 73 110 147 184 221 258 296 334 372 410 449 487 Value of energy saved $M 0.0 0.0 0.0 0.0 0.0 0.0 0.0 0.0 5.5 11.0 16.5 22.0 27.6 33.2 38.9 44.5 50.2 55.9 61.7 67.5 73.3 Emissions saved (marginal) ktCO2-e 0 0 0 0 0 0 0 0 37 72 107 142 179 210 251 278 310 337 369 400 429 Additional appliance cost $M 0.0 0.0 0.0 0.0 0.0 0.0 0.0 0.0 14.5 13.1 11.9 10.7 9.7 8.8 8.0 7.2 6.5 5.9 5.3 4.8 4.4 NSW&ACT BAU Energy use GWh/yr 998 1035 1075 1119 1168 1219 1274 1332 1390 1448 1505 1561 1614 1664 1711 1752 1788 1819 1847 1872 1896 With-program energy use GWh/yr 998 1035 1075 1119 1168 1219 1274 1332 1381 1429 1476 1522 1566 1606 1643 1675 1701 1722 1739 1754 1768 Energy savings GWh/yr 0 0 0 0 0 0 0 0 10 19 29 38 48 58 68 78 88 98 108 118 128 Value of energy saved $M 0.0 0.0 0.0 0.0 0.0 0.0 0.0 0.0 1.3 2.7 4.0 5.4 6.8 8.1 9.5 10.9 12.3 13.7 15.1 16.5 17.9 Emissions saved (marginal) ktCO2-e 0 0 0 0 0 0 0 0 10 19 28 37 47 55 65 71 80 86 96 104 111 Additional appliance cost $M 0.0 0.0 0.0 0.0 0.0 0.0 0.0 0.0 3.8 3.4 3.1 2.8 2.5 2.3 2.1 1.9 1.7 1.5 1.4 1.3 1.1 NT BAU Energy use GWh/yr 51 52 55 57 59 62 65 68 71 74 77 79 82 85 87 89 91 93 94 95 96 With-program energy use GWh/yr 51 52 55 57 59 62 65 68 70 73 75 77 80 82 84 85 86 88 88 89 90 Energy savings GWh/yr 0 0 0 0 0 0 0 0 0 1 1 2 2 3 3 4 4 5 5 6 7 Value of energy saved $M 0.0 0.0 0.0 0.0 0.0 0.0 0.0 0.0 0.1 0.2 0.2 0.3 0.4 0.5 0.6 0.7 0.8 0.8 0.9 1.0 1.1 Emissions saved (marginal) ktCO2-e 0 0 0 0 0 0 0 0 0 1 1 2 2 2 3 3 3 4 4 5 5 Additional appliance cost $M 0.0 0.0 0.0 0.0 0.0 0.0 0.0 0.0 0.1 0.1 0.1 0.1 0.1 0.1 0.1 0.1 0.1 0.1 0.1 0.0 0.0 QLD BAU Energy use GWh/yr 1012 1049 1091 1136 1186 1238 1295 1354 1413 1472 1530 1587 1641 1693 1740 1782 1819 1851 1879 1904 1928 With-program energy use GWh/yr 1012 1049 1091 1136 1186 1238 1295 1354 1403 1453 1501 1548 1592 1634 1671 1703 1730 1751 1769 1784 1798 Energy savings GWh/yr 0 0 0 0 0 0 0 0 10 20 29 39 49 59 69 79 89 100 110 120 131 Value of energy saved $M 0.0 0.0 0.0 0.0 0.0 0.0 0.0 0.0 1.5 2.9 4.4 5.9 7.4 8.9 10.4 11.9 13.4 15.0 16.5 18.0 19.6 Emissions saved (marginal) ktCO2-e 0 0 0 0 0 0 0 0 10 18 27 36 46 53 64 72 81 89 96 104 113 Additional appliance cost $M 0.0 0.0 0.0 0.0 0.0 0.0 0.0 0.0 2.9 2.6 2.4 2.1 1.9 1.8 1.6 1.4 1.3 1.2 1.1 1.0 0.9

E3 Committee CBA: MEPS and Alternative Strategies for Chillers August 2007
A-36
Year Units 2000 2001 2002 2003 2004 2005 2006 2007 2008 2009 2010 2011 2012 2013 2014 2015 2016 2017 2018 2019 2020SA BAU Energy use GWh/yr 368 381 396 413 430 450 470 491 513 534 555 576 596 614 631 647 660 671 682 691 700 With-program energy use GWh/yr 368 381 396 413 430 450 470 491 509 527 545 562 578 593 606 618 628 635 642 647 652 Energy savings GWh/yr 0 0 0 0 0 0 0 0 4 7 11 14 18 21 25 29 32 36 40 43 47 Value of energy saved $M 0.0 0.0 0.0 0.0 0.0 0.0 0.0 0.0 0.6 1.1 1.7 2.3 2.8 3.4 4.0 4.6 5.2 5.8 6.4 7.0 7.6 Emissions saved (marginal) ktCO2-e 0 0 0 0 0 0 0 0 4 8 12 16 20 23 27 29 32 36 39 43 45 Additional appliance cost $M 0.0 0.0 0.0 0.0 0.0 0.0 0.0 0.0 1.7 1.6 1.4 1.3 1.2 1.1 1.0 0.9 0.8 0.7 0.6 0.6 0.5 TAS BAU Energy use GWh/yr 51 53 55 57 60 63 65 68 71 74 77 80 83 86 88 90 92 94 95 96 97 With-program energy use GWh/yr 51 53 55 57 60 63 65 68 71 73 76 78 80 83 84 86 87 89 89 90 91 Energy savings GWh/yr 0 0 0 0 0 0 0 0 0 1 1 2 2 3 3 4 5 5 6 6 7 Value of energy saved $M 0.0 0.0 0.0 0.0 0.0 0.0 0.0 0.0 0.1 0.1 0.2 0.3 0.3 0.4 0.5 0.6 0.6 0.7 0.8 0.8 0.9 Emissions saved (marginal) ktCO2-e 0 0 0 0 0 0 0 0 1 1 1 2 2 3 4 4 4 5 5 6 6 Additional appliance cost $M 0.0 0.0 0.0 0.0 0.0 0.0 0.0 0.0 0.3 0.3 0.2 0.2 0.2 0.2 0.2 0.1 0.1 0.1 0.1 0.1 0.1 VIC BAU Energy use GWh/yr 735 762 792 825 861 899 940 983 1026 1068 1110 1152 1191 1228 1263 1293 1320 1343 1363 1382 1399 With-program energy use GWh/yr 735 762 792 825 861 899 940 983 1019 1054 1089 1123 1155 1186 1213 1236 1255 1271 1284 1295 1305 Energy savings GWh/yr 0 0 0 0 0 0 0 0 7 14 21 28 36 43 50 57 65 72 79 87 94 Value of energy saved $M 0.0 0.0 0.0 0.0 0.0 0.0 0.0 0.0 1.1 2.3 3.4 4.5 5.7 6.9 8.0 9.2 10.4 11.5 12.7 13.9 15.1 Emissions saved (marginal) ktCO2-e 0 0 0 0 0 0 0 0 8 15 23 31 39 46 56 60 66 72 79 84 88 Additional appliance cost $M 0.0 0.0 0.0 0.0 0.0 0.0 0.0 0.0 3.5 3.2 2.9 2.6 2.3 2.1 1.9 1.7 1.6 1.4 1.3 1.2 1.0 WA BAU Energy use GWh/yr 576 597 620 646 674 703 735 769 802 835 868 900 931 960 987 1011 1032 1050 1066 1080 1094 With-program energy use GWh/yr 576 597 620 646 674 703 735 769 797 824 852 878 903 927 948 966 981 993 1003 1012 1020 Energy savings GWh/yr 0 0 0 0 0 0 0 0 6 11 17 22 28 33 39 45 51 56 62 68 74 Value of energy saved $M 0.0 0.0 0.0 0.0 0.0 0.0 0.0 0.0 0.8 1.7 2.5 3.3 4.2 5.0 5.9 6.7 7.6 8.5 9.3 10.2 11.1 Emissions saved (marginal) ktCO2-e 0 0 0 0 0 0 0 0 5 10 15 18 23 28 33 38 43 46 50 55 60 Additional appliance cost $M 0.0 0.0 0.0 0.0 0.0 0.0 0.0 0.0 2.2 2.0 1.8 1.6 1.5 1.3 1.2 1.1 1.0 0.9 0.8 0.7 0.7 NZ BAU Energy use GWh/yr 613 635 660 688 717 749 783 819 855 890 925 960 993 1024 1052 1078 1100 1119 1136 1152 1166 With-program energy use GWh/yr 613 635 660 688 717 749 783 819 849 879 908 936 963 988 1011 1030 1046 1059 1070 1079 1087 Energy savings GWh/yr 0 0 0 0 0 0 0 0 6 12 18 24 30 36 42 48 54 60 66 72 79 Value of energy saved $M 0.0 0.0 0.0 0.0 0.0 0.0 0.0 0.0 0.9 1.9 2.8 3.8 4.7 5.7 6.7 7.6 8.6 9.6 10.6 11.6 12.6 Emissions saved (marginal) ktCO2-e 0 0 0 0 0 0 0 0 4 7 11 14 18 21 25 29 32 36 40 43 47 Additional appliance cost $M 0.0 0.0 0.0 0.0 0.0 0.0 0.0 0.0 3.4 3.1 2.8 2.5 2.3 2.0 1.8 1.7 1.5 1.4 1.2 1.1 1.0