propose hybrid knn-id3 for diabetes diagnosis system · international journal of scientific &...
TRANSCRIPT

International Journal of Scientific & Engineering Research, Volume 5, Issue 9, September-2014 1087 ISSN 2229-5518
IJSER © 2014 http://www.ijser.org
Propose Hybrid KNN-ID3 for Diabetes Diagnosis System
Abstract
This work presents a proposed Medical Diagnosis System of Diabetes aiming to
identify the correct diagnosis of Patient’s diabetes as quickly as possible and at as lower
cost as possible. The Proposal Diabetes Diagnosis System (DDS) has three subsequent
stages; the first stage is the construction of medical dataset (MD) with eight features
taken for 1000 patients and covering three classes (Diabetic, Non-Diabetic, and
Predicted- Diabetic). The second stage is the preprocessing of MD by removing
redundancy, generalize and normalize some of features’ values, and suggest fillings for
the missing values with K-Nearest Neighbor algorithm (KNN) instead of the traditional
filling method in which values are estimated based on experiences.
The third stage is the data mining- based machine learning, which introduces Interactive
Dichotomizer 3 (ID3) classifier; is employed to diagnose the condition of a patient from
his/her medical history. The outcome of implementing the proposal system showed that
the accuracy of the ID3 model has been found approximately (98.25%) in case of filling
missing values by KNN algorithm, where was less in case of filling missing values by
experience.
1. Introduction
In present era, Data Mining is becoming popular in healthcare field because there is a
need for efficient analytical methodology for detecting unknown and valuable
information in health data. In health industry, Data Mining provides several benefits such
as detection of the fraud in health insurance, availability of medical solution to the
patients at lower cost, detection of causes of diseases and identification of medical
Asst. Prof. Dr. Soukaena Hassan University of Technology Computer Science Dept.
Ahlam Rashid Karbat University of AI-Mustansiriya
College of Science Computer Science Dept.
Asst. Prof .Dr. Zaki .S. Towfik Dijli University College (DUC)
Computer Department [email protected]
IJSER
International Journal of Scientific & Engineering Research, Volume 5, Issue 9, September-2014 1088 ISSN 2229-5518
IJSER © 2014 http://www.ijser.org
treatment methods. It also helps the healthcare researchers make efficient healthcare
policies, constructing drug recommendation systems, developing health profiles of
individuals etc. [1]. Diabetes is an opportune disease which has large wealth of data
available and has with it huge complications. There is a need for a better and a more
accurate approach in the diagnosis of the disease. Data mining is the better approach,
since it is a process of extracting useful, hidden information from larger databases. There
are many data mining techniques available to do this process like association mining,
clustering, classification, predictive analysis… etc. [2].
Shaheen and khan (2009) [3], the study was designed an intelligent decision support
system IDSS to help the patients and health-care providers. The purpose is to provide 24-
hour adequate health-care services to the diabetes type2 patients remotely and provide
decision support service to the health-care providers. Periodically, updating the patient’s
record is also an important feature of the system. Slocum M. (2012) [4], they look at one
particular decision tree, ID3 algorithm and how it can be used with data mining for
medical research. The evaluation of the different types of decision trees along with
clustering algorithms to determine if there is a better approach for the medical industry
specifically for determination of the risk of heart disease. It using these algorithms is an
iterative process where processes are always being improved. Shukr (2013)[5], the
Iterative Dichotomiser3(ID3) algorithm was detect the classification of the cardiac
arrhythmia from a normal ECG signal based on wavelet decomposition, then this data
using as training input dataset for ID3 algorithm to learn and produce a decision tree
(classifier). Then this classifier is converted to a set of rules which were used to classify
five types of ECG arrhythmias including the normal case. Angeline and
Sivaprakasam(2013) [6], The negative impact of missing value imputation was addressed
and solution for improvement while evaluating the performance of KNN algorithm for
classification of Diabetes data.
A new Class-wise K Nearest Neighbor (CKNN), method for the Classification of
Diabetes Dataset. The Performance of classification measured with respect to sensitivity,
specificity and accuracy has been increased significantly in the case of proposed CKNN
algorithm.
IJSER
International Journal of Scientific & Engineering Research, Volume 5, Issue 9, September-2014 1089 ISSN 2229-5518
IJSER © 2014 http://www.ijser.org
2. General Description of the Proposal
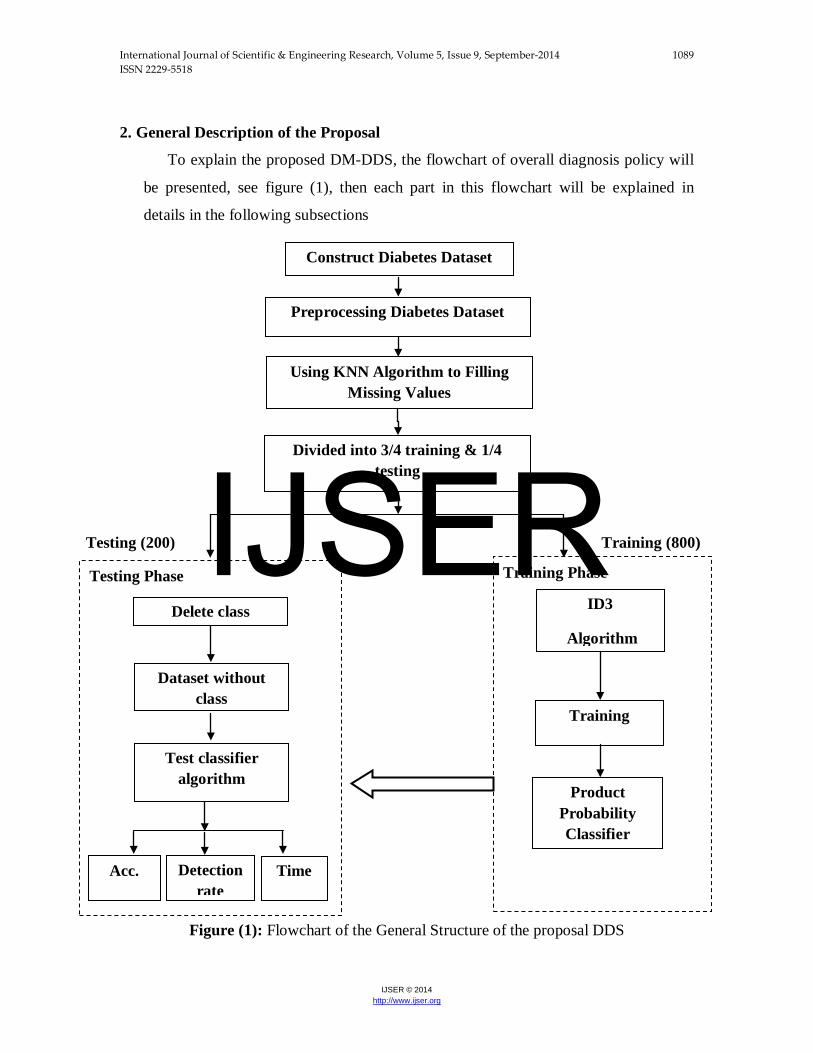
To explain the proposed DM-DDS, the flowchart of overall diagnosis policy will
be presented, see figure (1), then each part in this flowchart will be explained in
details in the following subsections
Figure (1): Flowchart of the General Structure of the proposal DDS
Construct Diabetes Dataset
Preprocessing Diabetes Dataset
Using KNN Algorithm to Filling Missing Values
Divided into 3/4 training & 1/4 testing
Testing (200) Training (800)
Testing Phase
Test classifier algorithm
Delete class
Dataset without class
Acc. Detection rate
Time
Training Phase
ID3
Algorithm
Training
Product Probability Classifier
IJSER
International Journal of Scientific & Engineering Research, Volume 5, Issue 9, September-2014 1090 ISSN 2229-5518
IJSER © 2014 http://www.ijser.org
3. Design and Implement the proposal
In implementing the algorithms of data mining, the K-Nearest Neighbor, and the
ID3, several stages have been conducted to see the end result of the process of
implementation of the algorithms.
3. 1. Construct Diabetes Dataset
The proposed DM-Based Diabetes Diagnosis System (DM-DDS) will be
explained in details. The proposed system is a supervised learning system. This system
aims to advance the prediction of patient’s diabetes class (Diabetic, Non-Diabetic, and
Predicted- Diabetic) using data mining techniques. The advantages of prediction arise
from reducing cost and time of diagnosis, and increasing the accuracy of prediction.
The proposal was applied on a constructed dataset of 1000 individuals’, from Baghdad
society, covering the three classes, before applying mining techniques there are some
preprocessing steps which were taken in account to prepare data for training and
testing, KNN is the critical preprocessing step which aim to fill the missing values
instead of guessing them by experience. The algorithm of data mining was applied in
this proposal ID3 classifier. The data are collected from Iraqi society. The data were
acquired from the laboratory of Medical City Hospital and (the Specializes Center for
Endocrinology and Diabetes-Al-Kindy Teaching Hospital). Patients' files are taken and
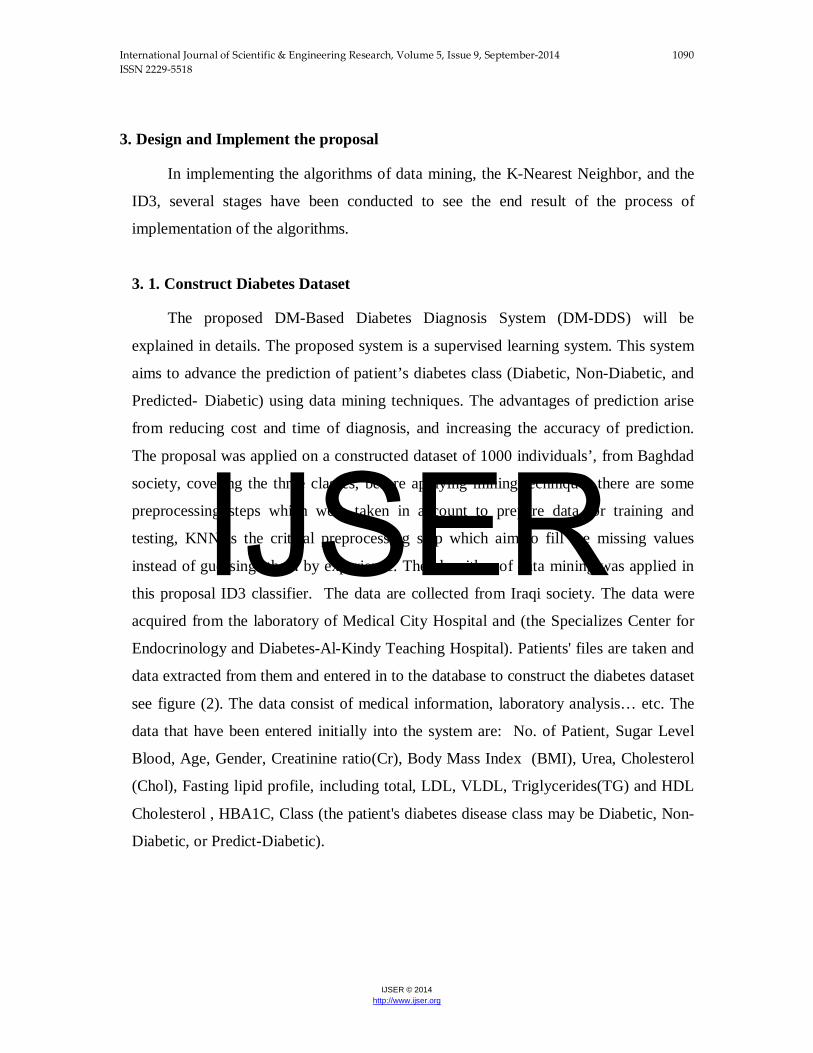
data extracted from them and entered in to the database to construct the diabetes dataset
see figure (2). The data consist of medical information, laboratory analysis… etc. The
data that have been entered initially into the system are: No. of Patient, Sugar Level
Blood, Age, Gender, Creatinine ratio(Cr), Body Mass Index (BMI), Urea, Cholesterol
(Chol), Fasting lipid profile, including total, LDL, VLDL, Triglycerides(TG) and HDL
Cholesterol , HBA1C, Class (the patient's diabetes disease class may be Diabetic, Non-
Diabetic, or Predict-Diabetic).
IJSER
International Journal of Scientific & Engineering Research, Volume 5, Issue 9, September-2014 1091 ISSN 2229-5518
IJSER © 2014 http://www.ijser.org
Figure (2): the dataset of the DDS
The main data preprocessing tasks done in the proposal are: Remove Redundancy,
Noisy Data, and Feature Selection. By feature selection process only eight out of the total
sixteen features were taken into account (Age, Gender, HBA1C, TG, Urea, Chol, HDL
and BMI), the less important features were ignored as their information gain is of no
crucial significance except for the Sugar Level Blood which was ruled out because it is
the decisive factor in diabetes diagnose. Missing Values, Also it’s noteworthy to mention
that the Hba1c values were found missing in some of the patients physical examinations.
Accordingly figures for the missing values were taken as estimated by the laboratory
experts. As the data was applied using algorithm. The accuracy was found very small. So
in the following section an explanation will be provided as to how to deal with missing
values using a proposed KNN to increase accuracy of diagnosis. The proposal will use
k-nearest neighbor algorithms to estimate and replace missing data. The main advantages
of this method are: a) it can estimate both qualitative attributes (the most frequent value
among the k nearest neighbors) and quantitative attributes (the mean of the k nearest
neighbors); b) It is not necessary to build a predictive model for each attribute with
missing data, although it does not build visible models. Efficiency is the biggest trouble
for this method. While the k-nearest neighbor algorithms look suitable for the most
similar instances, the whole dataset should be searched.
3.2 K-Nearest Neighbor Method
A technique that classifies each record in a dataset based on a combination of the
classes of the k record(s) most similar to it in a historical dataset (where k31) sometimes
called the k-nearest neighbor technique. It is a simple algorithm that stores all available
IJSER

International Journal of Scientific & Engineering Research, Volume 5, Issue 9, September-2014 1092 ISSN 2229-5518
IJSER © 2014 http://www.ijser.org
cases and classifies new cases based on a similarity measure (e.g., distance functions). The
KNN was used to determine the missing values and to avoid the bad impact of the
arbitrary speculations of the values. The imputations in the proposal begin with the
distance similarity measure as in Eq. (1).
D Eq.(1)
The proposal will use Euclidean distance as in Eq. (1).
Figure (3): the database filling of the missing value
The simple split partitions the data into two mutually exclusive subsets called a
training set and a testing set. It is common to designate 3/4 of the data as the training set
(800) patients and the remaining 1/4 as the test set (200) patients. The training set is used
by the inducer (model builder) and the built classifier is then tested on the testing set.
After preprocessing the dataset and critical features have been selected, the popular and
efficient DM classification algorithms, (ID3) classifier, will be used in the design of the
proposed model.
3.3 Decision Tree Classifier
A decision tree is a tree in which each branch node represents a choice between a
number of alternatives, and each leaf node represents a decision. Decision trees are
commonly used for gaining information for the purpose of decision-making.
IJSER
International Journal of Scientific & Engineering Research, Volume 5, Issue 9, September-2014 1093 ISSN 2229-5518
IJSER © 2014 http://www.ijser.org
A decision tree starts with a root node on which it is for users to take actions. From
this node, users split each node recursively according to decision tree learning
algorithm [7]. The final result is a tree with decision and leaf nodes. It can handle
both categorical and numerical data [7]. In short, the decision tree can be described
as:
• Rules for classifying data using attributes.
• It consists of decision nodes and leaf nodes.
• A decision node has two or more branches, each representing values for the
attribute tested.
• A leaf node attribute produces a homogeneous result (all in one class), which does
not require additional classification testing [8].
4.3.1 ID3 algorithm
The ID3 algorithm works by recursively applying the procedure below to each of
the subsets produced until “pure” or homogenous nodes are found, a pure node
contains elements of only one class. The algorithm starts with complete dataset of
training examples, these examples are given in attribute-value representation with
eight categorical attributes (Age, Gender, HBA1C, TG, Urea, Chol, HDL, BMI and
class attribute) see figure (3), these attributes are the input of the ID3 algorithm to
learn and produce the decision tree which will help determine the class of the new
samples, the diabetes class attribute can be one of three classes of diabetes. Those
three samples can be (diabetic(Y), non-diabetic (N) and predicted- diabetic (P)
attributes). To show how the ID3 algorithm works, following steps are listed, see
algorithm (1):
Algorithm (1): ID3(Examples, Target_attribute, Attributes) Input: Examples // are the training examples// ,Target_attribute // is the attribute whose value is to be predicted by the tree // , Attributes // is a list of other attributes that may be tested by the learned
decision tree// Output: decision tree that correctly classifies the given Examples Begin Create a Root node for the tree
IJSER
International Journal of Scientific & Engineering Research, Volume 5, Issue 9, September-2014 1094 ISSN 2229-5518
IJSER © 2014 http://www.ijser.org
A. Create a Root node for the tree with label equal to null
A tree node is represented by a user defined class object which contains three
members; Label, Attribute ( Label of an attribute and a list of possible values related
with an attribute) and Children. A Root node can be created by making a new instance
of class object as follows: Root = new TreeNodeDDS().
B. Get most common values of the class attribute if the attribute list is empty.
C. Select the best attribute to start as the root node
A decision tree was created depending on the best attribute that can divide the
training data so the depth of tree is decreased at the same time the data will be
classified correctly. To select the best attribute to branch, three factors will be
calculated:
C. 1. Entropy:
The amount of impurity of training dataset and it is calculated by using Eq.(2). The
entropy of Samples dataset is:
Entropy(S)= -Ppos log2 Ppos -Pneg log2 Pneg Eq.( 2)
If all Examples are positive, Return the single node tree Root, with label = Pos If all Examples are negative, Return the single node tree Root, with label = Neg. If all Examples are predictive, Return the single node tree Root, with label = pre. If Attributes is empty, then Return the single node tree Root, with label = most common value of the Target _attribute in the Examples. Else Begin
A = the attribute from Attributes that best classifies Examples The decision attribute for Root = A For each possible value, vi, of A do Add a new tree branch below Root, corresponding to the test A = vi Let Examplesvi be the subset of Examples that have value vi for A Add a sub tree ID3(Examplesvi , Target_attribute, Attributes – {A})) below this new branch
EndFor End Return Root End
IJSER
International Journal of Scientific & Engineering Research, Volume 5, Issue 9, September-2014 1095 ISSN 2229-5518
IJSER © 2014 http://www.ijser.org
C.2. Information gain:
Compute the information gain of each attribute in the Samples data table, and this will be
done through the steps below:
• It begins by dividing the Samples table according to each attribute as show in
Figure (3), so the best attribute can be calculated to start as the Root node, the
start will be with the first attribute Age and takes it separately with the class
attribute then divides it by each value into mini-tables. In a simplified form the
Age attributes.
• For each mini-table, compute the entropy by using Eq. (3).
Entropy(S) = ∑ −𝑝𝑖 .𝑐𝑖=1 log2 𝑝𝑖 Eq. (3)
• Calculate the information gain by using Eq. (4), the information gain will be
obtained for the remaining attributes, and the results were as follows:
Gain (S,A) = Entropy(s) - ∑ ⃓𝑆𝑣⃓⃓𝑆⃓
𝐸𝑛𝑡𝑟𝑜𝑝𝑦(𝑆𝑣)𝑉∊𝑉𝑎𝑙𝑢𝑒𝑠 (𝐴)
Eq.(4)
Where,
| | : is the Cardinality symbol.
Values(A) : is the set of all possible values for attribute A.
Sv : is the subset of S for which attribute A has value v.
Entropy(S) : is the entropy of the original collection S.
∑ ⃓𝑆𝑣⃓⃓𝑆⃓
𝐸𝑛𝑡𝑟𝑜𝑝𝑦(𝑆𝑣)𝑉∊𝑉𝑎𝑙𝑢𝑒𝑠 (𝐴)
:is the expected value of the entropy after
S is partitioned using attribute A.
The expected entropy described by this second term is simply the sum of the entropies of
each subset Sv weighted by the fraction of examples that belong to Sv. Gain(S, A) is
therefore the expected reduction in entropy caused by knowing the value of attribute A
[9].
IJSER
International Journal of Scientific & Engineering Research, Volume 5, Issue 9, September-2014 1096 ISSN 2229-5518
IJSER © 2014 http://www.ijser.org
C.3. Best attribute: The attribute which has the higher gain will be the best one, that will
best classify the training data, hence HBA1C is the best attribute because it has the
maximum information gain, and as a result it will be the root node of a decision tree,
it receives a set of attributes as input parameter and returns the best attribute which
had the maximum gain value.
Figure (4): the Dataset Partitions according to all Values within HBA1C
D. Iterate for each possible value (possible Value i )
In this example, for the case of (HBA1C>=6.5), there is only one class available
in the training dataset which is Yes, therefore a leaf node will be added with label=
Yes, Figure (4), if it has more than one class as in the case of (HBA1C>=5.7‐ <=6.4) and the case (HBA1C<=5.6) the attribute collection needs to be updated and add a sub
tree below the new branch by calling recursively the main steps of ID3 algorithm but
with new dataset and new attribute collection. So, one attribute is removed from a
collection of attributes, for example when an attribute has been selected, it should be
removed from the collection of unselected attributes. This algorithm receives two
IJSER
International Journal of Scientific & Engineering Research, Volume 5, Issue 9, September-2014 1097 ISSN 2229-5518
IJSER © 2014 http://www.ijser.org
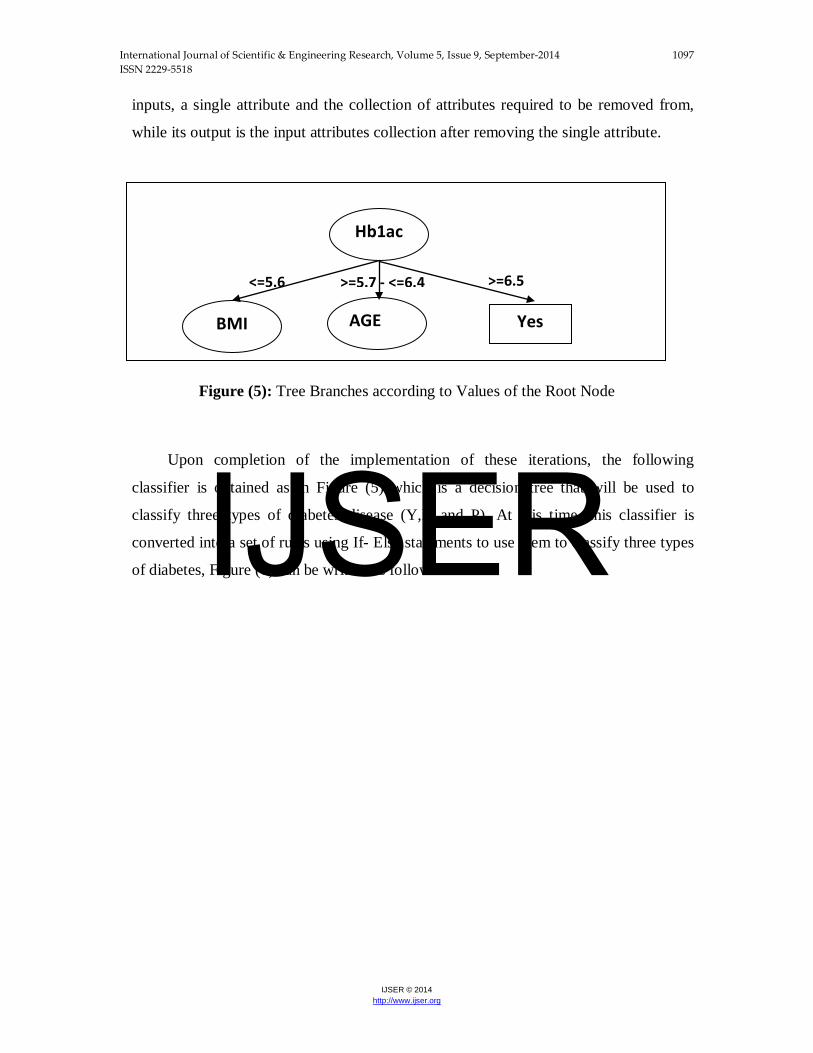
inputs, a single attribute and the collection of attributes required to be removed from,
while its output is the input attributes collection after removing the single attribute.
Figure (5): Tree Branches according to Values of the Root Node
Upon completion of the implementation of these iterations, the following
classifier is obtained as in Figure (5) which is a decision tree that will be used to
classify three types of diabetes disease (Y,N and P). At this time, this classifier is
converted into a set of rules using If- Else statements to use them to classify three types
of diabetes, Figure (6) can be written as follows:
>=6.5 <=5.6 >=5.7 - <=6.4
Yes
Hb1ac
BMI
AGE
IJSER
International Journal of Scientific & Engineering Research, Volume 5, Issue 9, September-2014 1098 ISSN 2229-5518
IJSER © 2014 http://www.ijser.org
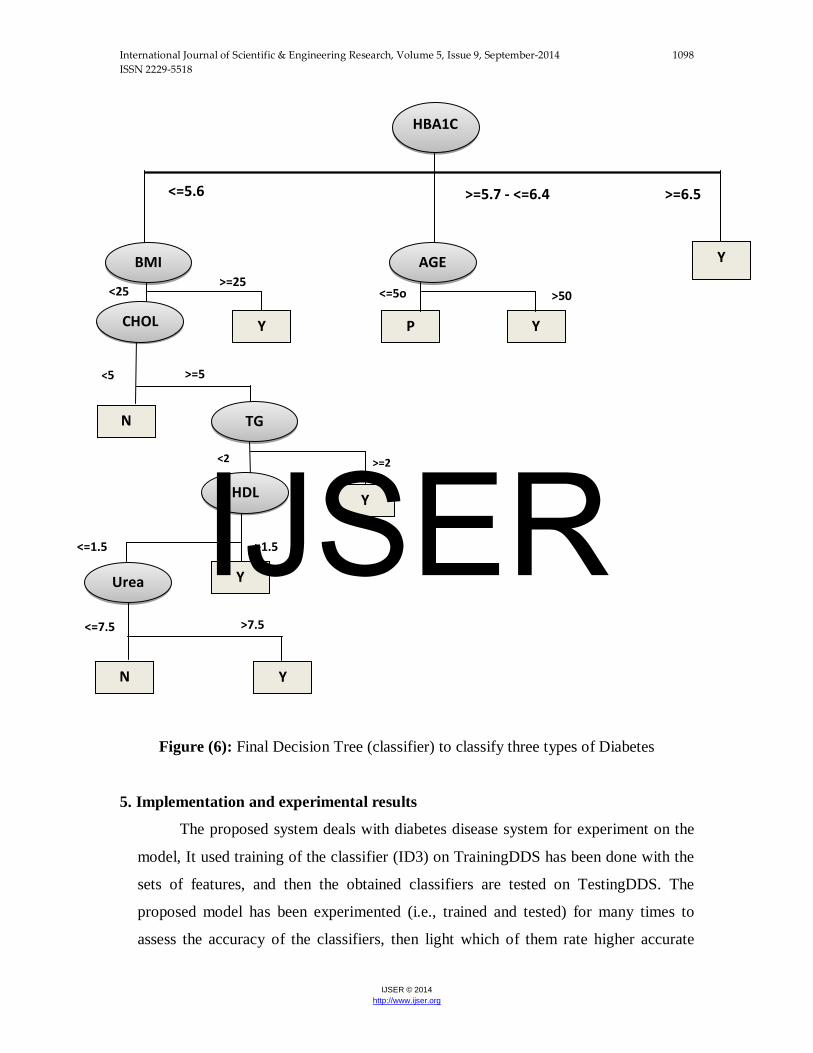
Figure (6): Final Decision Tree (classifier) to classify three types of Diabetes
5. Implementation and experimental results
The proposed system deals with diabetes disease system for experiment on the
model, It used training of the classifier (ID3) on TrainingDDS has been done with the
sets of features, and then the obtained classifiers are tested on TestingDDS. The
proposed model has been experimented (i.e., trained and tested) for many times to
assess the accuracy of the classifiers, then light which of them rate higher accurate
>=2
>7.5
N
Y
Y
Y
N
<2
<=1.5 >1.5
<=7.5
>=5
>50 <=5o >=25
<25
Y
Y
Y
P
>=6.5 >=5.7 - <=6.4 <=5.6
<5
HBA1C
BMI
AGE
CHOL
TG
HDL
Urea
IJSER
International Journal of Scientific & Engineering Research, Volume 5, Issue 9, September-2014 1099 ISSN 2229-5518
IJSER © 2014 http://www.ijser.org
results. This section will explain results according the standards evaluation measures
of classifications. The classification model has been constructed in each of these
experiments. Next, this model has been applied to the same TestingDDS, which has
been constructed, to assess the validation and accuracy of these constructed models on
the same testing dataset. The classification results are either;
1. TP -true positive answers denoting correct classifications of positive cases
(one of DDS).
2. TN -true negative answers denoting correct classifications of negative cases
(normal).
3. FP -false positive answers denoting incorrect classifications of negative cases
into class positive (misclassified records as one of DDS).
4. FN - false negative answers denoting incorrect classifications of positive cases
into class negative (misclassified records as normal).
5. Unknown1 (Predicted- Diabetic true positives Pr-p).
6. Unknown2 (Predicted- Diabetic true negatives Pr-n).
7. The DR is the ratio between the number of correctly classified records as TP and
the total number of intrusion records presented in TestingDDS dataset. It has
been computed using;
DR = 𝑻𝑷𝑻𝑷+𝑭𝑵+𝑼𝒏𝒌𝒏𝒐𝒘𝒏𝟐
Eq. (5)
8. False Alarm Rate (FAR) is the ratio between number of "normal" records
classified as intrusion (FP) and the total number of "normal" records presented in
TestingDDS dataset. It has been computed using;
FAR = 𝑭𝑷𝑻𝑵+𝑭𝑷+𝑼𝒏𝒌𝒏𝒐𝒘𝒏𝟏
Eq. (6)
9. The classification accuracy measures the proportion of correctly classified cases;
Acc. = 𝑻𝒑+𝑻𝑵+𝑻𝑷𝒓𝒆𝒅𝒊𝒄𝒕𝑻𝒑+𝑭𝒑+𝑻𝒏+𝑭𝒏+𝒖𝒏𝒌𝒏𝒐𝒘𝒏
Eq. (7)
Where, Tpredict is (pr-p) and unknown is (Pr-p+Pr-n)
IJSER
International Journal of Scientific & Engineering Research, Volume 5, Issue 9, September-2014 1100 ISSN 2229-5518
IJSER © 2014 http://www.ijser.org
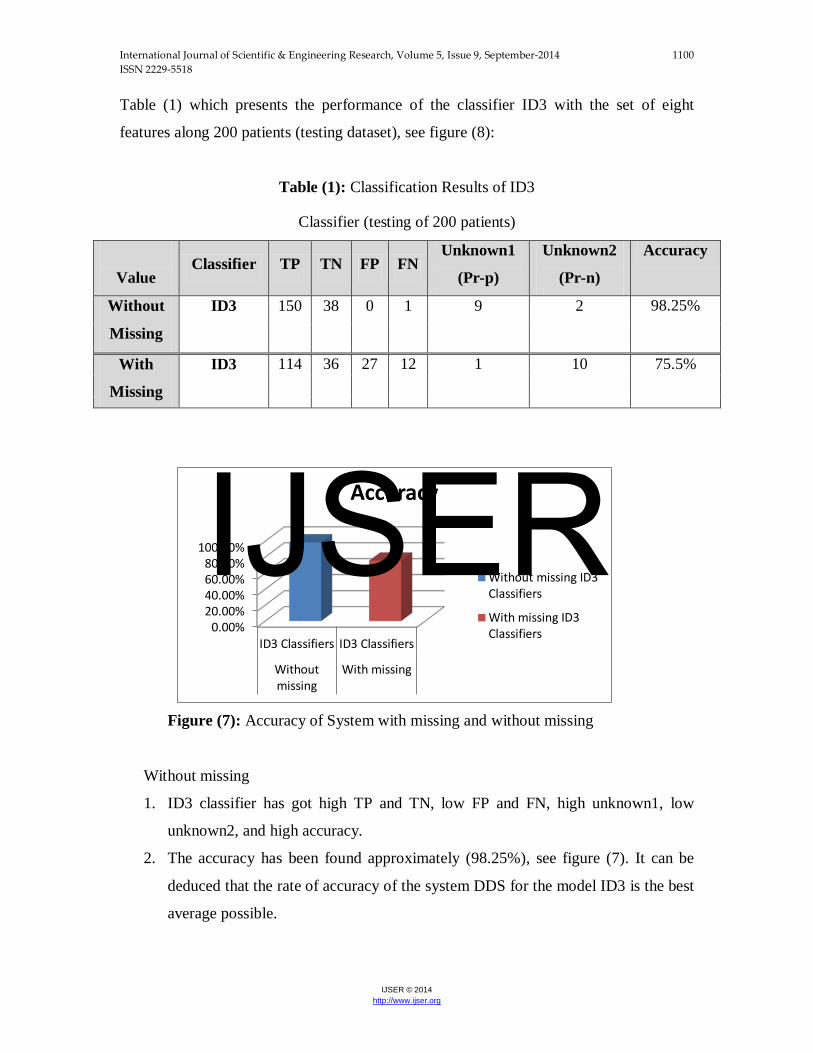
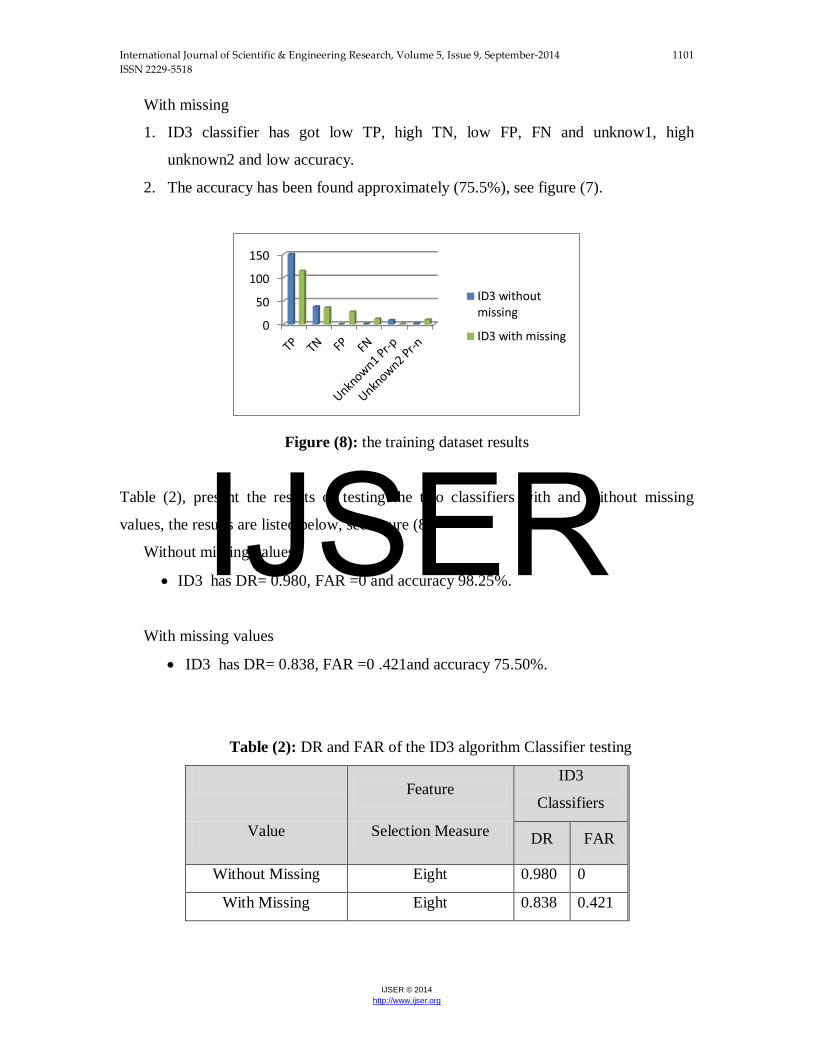
Table (1) which presents the performance of the classifier ID3 with the set of eight
features along 200 patients (testing dataset), see figure (8):
Table (1): Classification Results of ID3
Classifier (testing of 200 patients)
Value Classifier TP TN FP FN
Unknown1
(Pr-p)
Unknown2
(Pr-n)
Accuracy
Without
Missing
ID3 150 38 0 1 9 2 98.25%
With
Missing
ID3 114 36 27 12 1 10 75.5%
Figure (7): Accuracy of System with missing and without missing
Without missing
1. ID3 classifier has got high TP and TN, low FP and FN, high unknown1, low
unknown2, and high accuracy.
2. The accuracy has been found approximately (98.25%), see figure (7). It can be
deduced that the rate of accuracy of the system DDS for the model ID3 is the best
average possible.
0.00%20.00%40.00%60.00%80.00%
100.00%
ID3 Classifiers ID3 Classifiers
Withoutmissing
With missing
Accuracy
Without missing ID3Classifiers
With missing ID3Classifiers
IJSER
International Journal of Scientific & Engineering Research, Volume 5, Issue 9, September-2014 1101 ISSN 2229-5518
IJSER © 2014 http://www.ijser.org
With missing
1. ID3 classifier has got low TP, high TN, low FP, FN and unknow1, high
unknown2 and low accuracy.
2. The accuracy has been found approximately (75.5%), see figure (7).
Figure (8): the training dataset results
Table (2), present the results of testing the two classifiers with and without missing
values, the results are listed below, see figure (8):
Without missing values
• ID3 has DR= 0.980, FAR =0 and accuracy 98.25%.
With missing values
• ID3 has DR= 0.838, FAR =0 .421and accuracy 75.50%.
Table (2): DR and FAR of the ID3 algorithm Classifier testing
Feature
ID3
Classifiers
Value Selection Measure DR FAR
Without Missing Eight 0.980 0
With Missing Eight 0.838 0.421
0
50
100
150
ID3 withoutmissing
ID3 with missing
IJSER
International Journal of Scientific & Engineering Research, Volume 5, Issue 9, September-2014 1102 ISSN 2229-5518
IJSER © 2014 http://www.ijser.org
0:00:00
1:12:00
2:24:00
3:36:00Ti
me
Modules
ID3
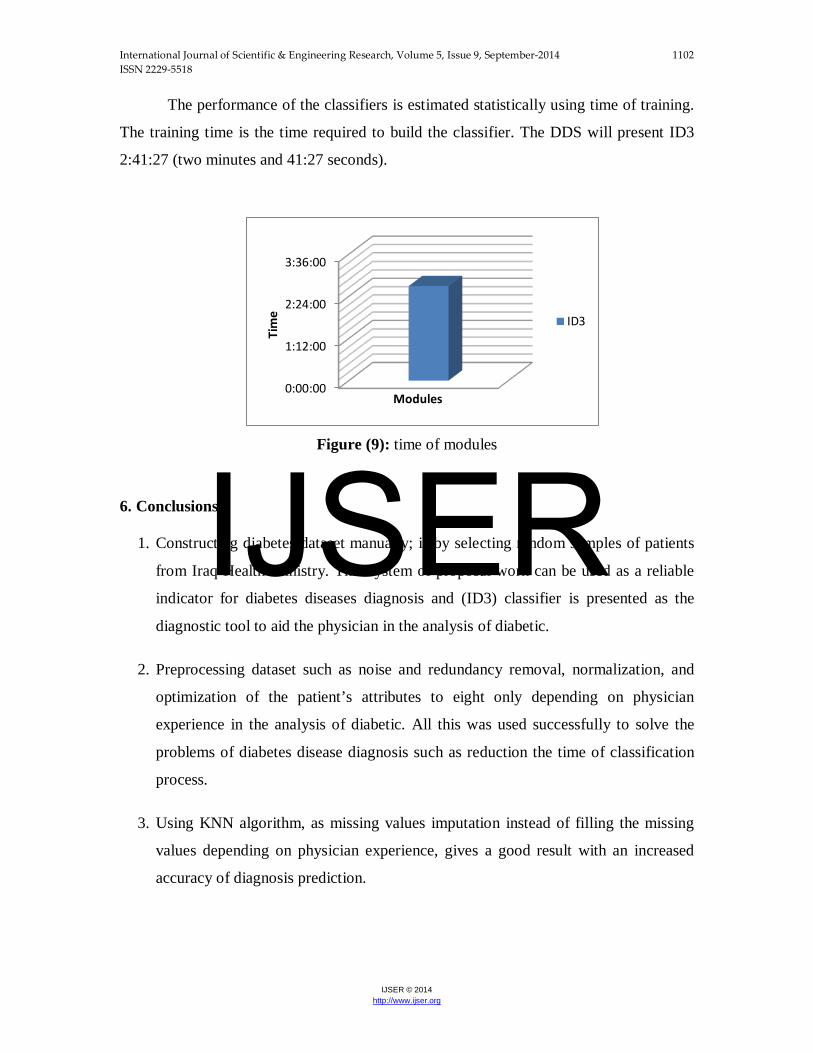
The performance of the classifiers is estimated statistically using time of training.
The training time is the time required to build the classifier. The DDS will present ID3
2:41:27 (two minutes and 41:27 seconds).
Figure (9): time of modules
6. Conclusions
1. Constructing diabetes dataset manually; is by selecting random samples of patients
from Iraq Health Ministry. This system of proposal work can be used as a reliable
indicator for diabetes diseases diagnosis and (ID3) classifier is presented as the
diagnostic tool to aid the physician in the analysis of diabetic.
2. Preprocessing dataset such as noise and redundancy removal, normalization, and
optimization of the patient’s attributes to eight only depending on physician
experience in the analysis of diabetic. All this was used successfully to solve the
problems of diabetes disease diagnosis such as reduction the time of classification
process.
3. Using KNN algorithm, as missing values imputation instead of filling the missing
values depending on physician experience, gives a good result with an increased
accuracy of diagnosis prediction.
IJSER
International Journal of Scientific & Engineering Research, Volume 5, Issue 9, September-2014 1103 ISSN 2229-5518
IJSER © 2014 http://www.ijser.org
4. The proposed system uses ID3 algorithms as a classification tool for diabetes
disease. It has been proved efficient, since ID3 gives optimized rules to classify
and diagnose the individual state as diabetic, non-diabetic or predicted with high
accuracy, see figure (7) and table (1).
5. Accurate prediction with the ID3 algorithm comes when all the independent
variables are statistically independent of each other. Accuracy with respect to the
rule based classification can be increased by using more rules for the
classification of the test data.
6. Diabetes is complicated to diagnose as many and diverse symptoms can be
important. The rule base for the prototype system was organized in frames and
templates (forms) with basic attributes. It provides a guideline which combined
with some additional rules would be very useful to predicate the diabetic.
7. The time needed for building the decision tree (training time) is estimated to be
2:41:27 (two minutes and 41:27 sec) in the case of ID3.
8. When the system was tested in Al- Kindy and Medical City Hospital, it was found
that the percentage of error is (<5%), and confirmed that the system was working
correctly. When a large number of patients were taken as an input to the system,
excellent results were provided.
9. Reduction of cost of patient management: These systems may definitely be
helpful in reduction of cost of patient management by avoiding unnecessary
investigations and patients follow up.
References
[1] Usama Fayyad, Gregory Piatetsky-Shapiro, and Padhraic Smyth “From Data
Mining to Knowledge Discovery in Databases” American Association for
Artificial Intelligence , 37-54- 1996.
IJSER
International Journal of Scientific & Engineering Research, Volume 5, Issue 9, September-2014 1104 ISSN 2229-5518
IJSER © 2014 http://www.ijser.org
[2] K.NALINI KUMARI &G.SUBBALAKSHMI “A SHORTEST PATH
IDENTIFICATION FOR FEATURE GENERATION AND EXTRACTION
FROM MEDLINE” - International Journal of Computers Electrical and
Advanced Communications Engineering Vol.1 (3), ISSN: 2250-2012.
[3] Asma Shaheen & Waqas Ahmad khan “Intelligent Decision Support System in
Diabetic eHealth Care“From the perspective of Elders Blekinge Institute of
Technology-Sweden Thesis MCS-2009
[4] Mary Slocum “DECISION MAKING USING ID3 ALGORITHM “ RIVIER
ACADEMIC JOURNAL, VOLUME 8, NUMBER 2, FALL 2012.
[5] Nidhal Hameed Shukr “Classification of Cardiac Arrhythmias using ID3
Classifier” Thesis MCS. 2013.
[6] Y. Angeline Christobel & P.Sivaprakasam ”A New Classwise k Nearest Neighbor
(CKNN) Method for the Classification of Diabetes Dataset” International
Journal of Engineering and Advanced Technology Volume-2, Issue-3, February
2013.
[7] Tom M. Mitchell, “Machine Learning”, McGraw-Hill, March , 1997. [8] Sin-Min Lee, SJSU, “ID3 Algorithm”, http://cs.sjsu.edu/~lee/cs157b/cs157b.html. [9] N.Suneetha, CH.V.M.K.Hari, V.Sunil Kumar, “Modified Gini Index Classification: A
Case Study Of Heart Disease Dataset”, (IJCSE) International Journal on Computer Science and Engineering, Vol. 02, No. 06, 2010.
IJSER