proposed catr + mact - e&e publishing -- the premier
TRANSCRIPT
Proposed CATR + MACT
Prepared for: American Coalition for Clean Coal Electricity
Draft May 2011

1 Draft: May 31, 2011 © 2011 NERA Economic Consulting
Outline
Glossary
Executive Summary
Methodology
Assumptions and Uncertainties
Energy Market Impacts
Economic Impacts
2 Draft: May 31, 2011 © 2011 NERA Economic Consulting
Glossary
Present value (PV) of costs – Present value, also known as present discounted value, is the value on a given
date of a future cost or series of future costs, discounted to reflect the time value of money and other factors such as investment risk. Present value calculations are widely used in business and economics to provide a means to compare costs at different times on a meaningful "like to like" basis
Annualized value (AV) of costs – Annualized value, also known as annualized net present value, is calculated
from a given present value as the average annual value in each future year taking into account the discount rate and the number of years over which costs are calculated. Annualized value calculations are widely used in business and economics to compare costs at different times on a meaningful “like to like” basis, particularly when two cost streams have different lifetimes.
2010 dollars – Constant value of money based on price levels in 2010 – Costs or prices reported in 2010 dollars for future years control for inflation between
2010 and future years, so any changes reflect real changes in market conditions
Henry Hub – Henry Hub is the pricing point for natural gas used by the New York Mercantile
Exchange (NYMEX) and widely used in the industry. It is a point on the natural gas pipeline system in Louisiana.

3 Draft: May 31, 2011 © 2011 NERA Economic Consulting
Summary of Key Results
Evaluated impacts of EPA’s Clean Air Transport Rule (CATR) and Utility Maximum Achievable Control Technology (MACT) proposals
Coal unit retirements would increase by about 48 GW
Electricity sector costs would increase by $184 billion (present value over 2011-2030 in 2010$) or $17.8 billion per year
– Includes coal unit compliance costs (including $72 billion in overnight capital costs), fuel price impacts, and costs of replacement energy and capacity
Coal-fired generation in 2016 would decrease by about 13% and electricity sector coal demand in 2016 would decrease by about 10%
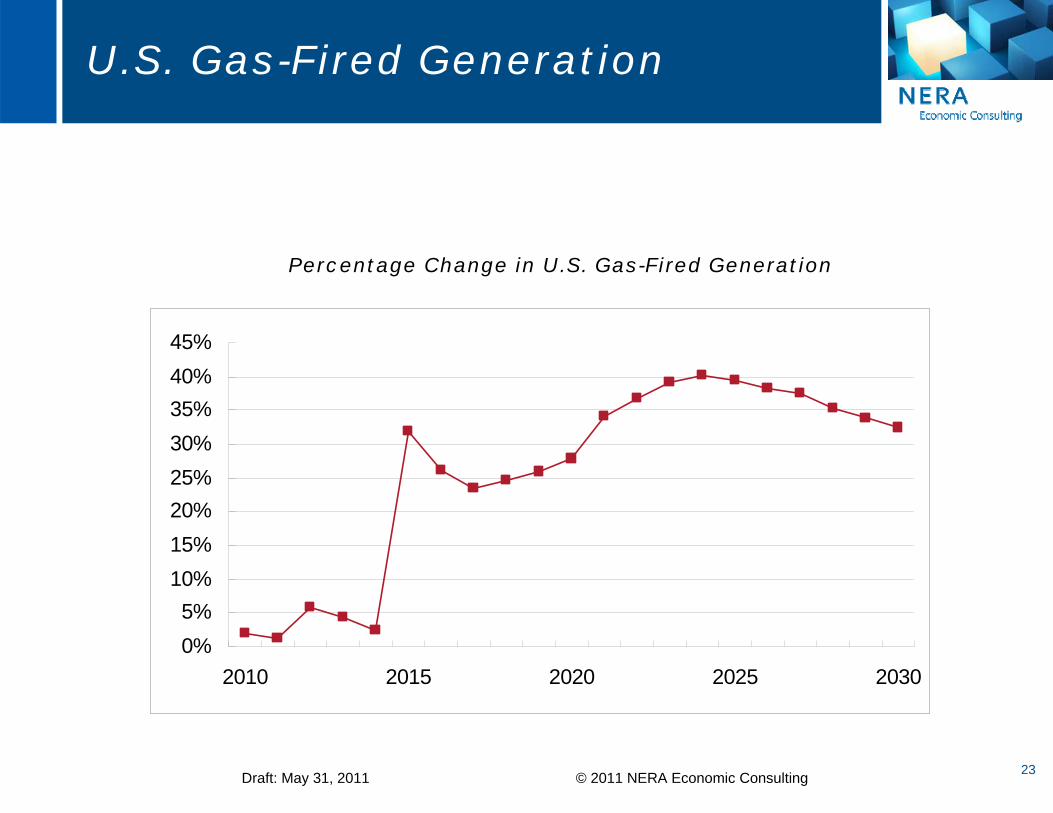
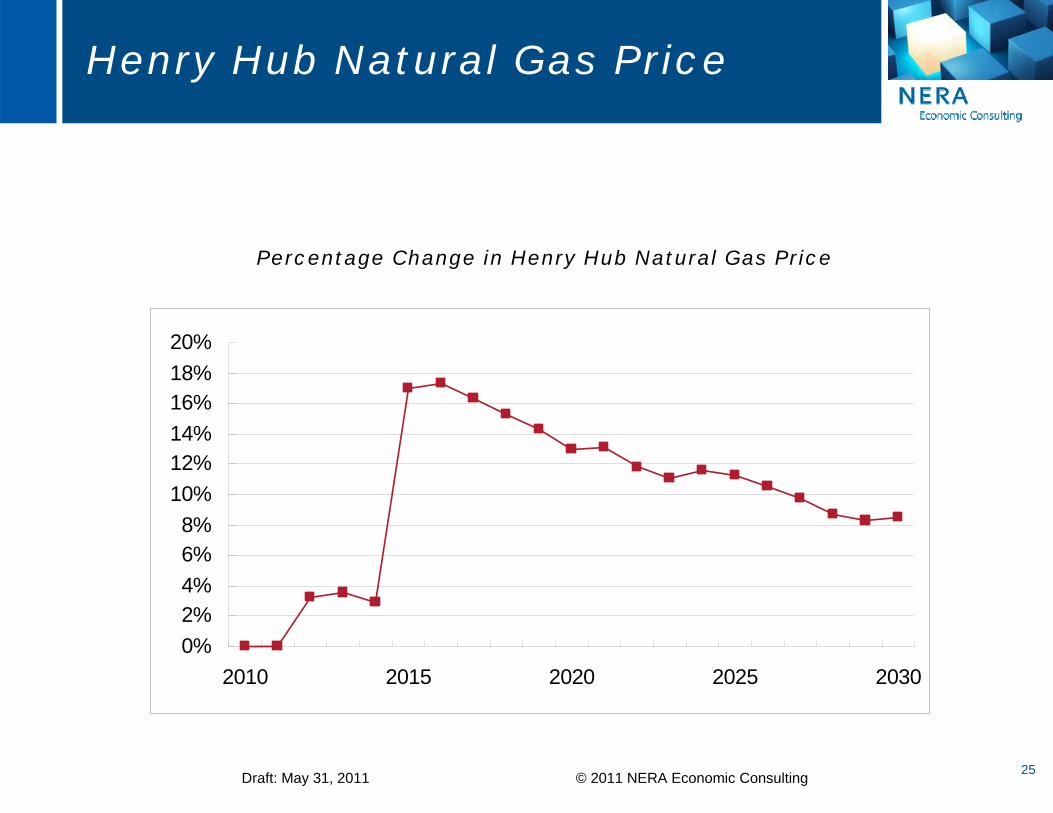
Natural gas-fired generation in 2016 would increase by about 26% and Henry Hub natural gas prices 2016 would increase by about 17%
– Increased natural gas prices would increase natural gas expenditures by residential, commercial, and industrial sectors by $85 billion (present value over 2011-2030 in 2010$) or $8.2 billion per year
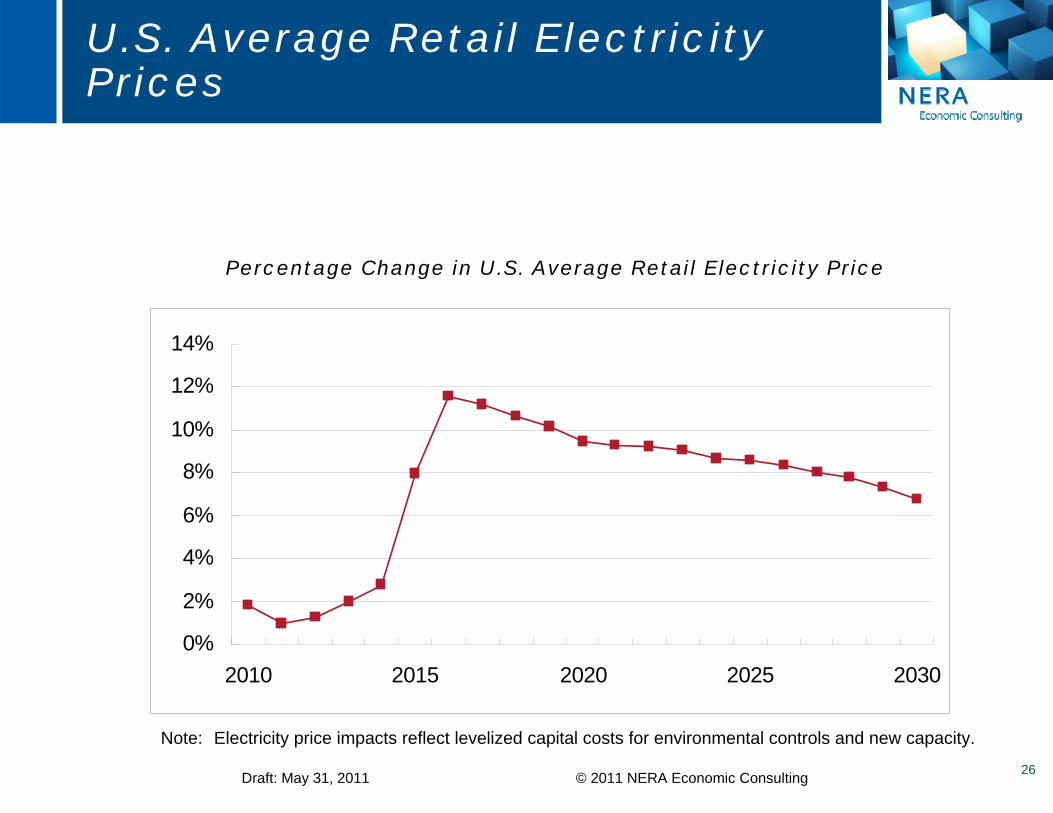
Average U.S. retail electricity prices in 2016 would increase by about 12%, with regional increases as much as about 24%
Net employment in the U.S. would be reduced by more than 1.4 million job-years over the 2013-2020 period, with sector losses outnumbering sector gains by more than 4 to 1.
4 Draft: May 31, 2011 © 2011 NERA Economic Consulting
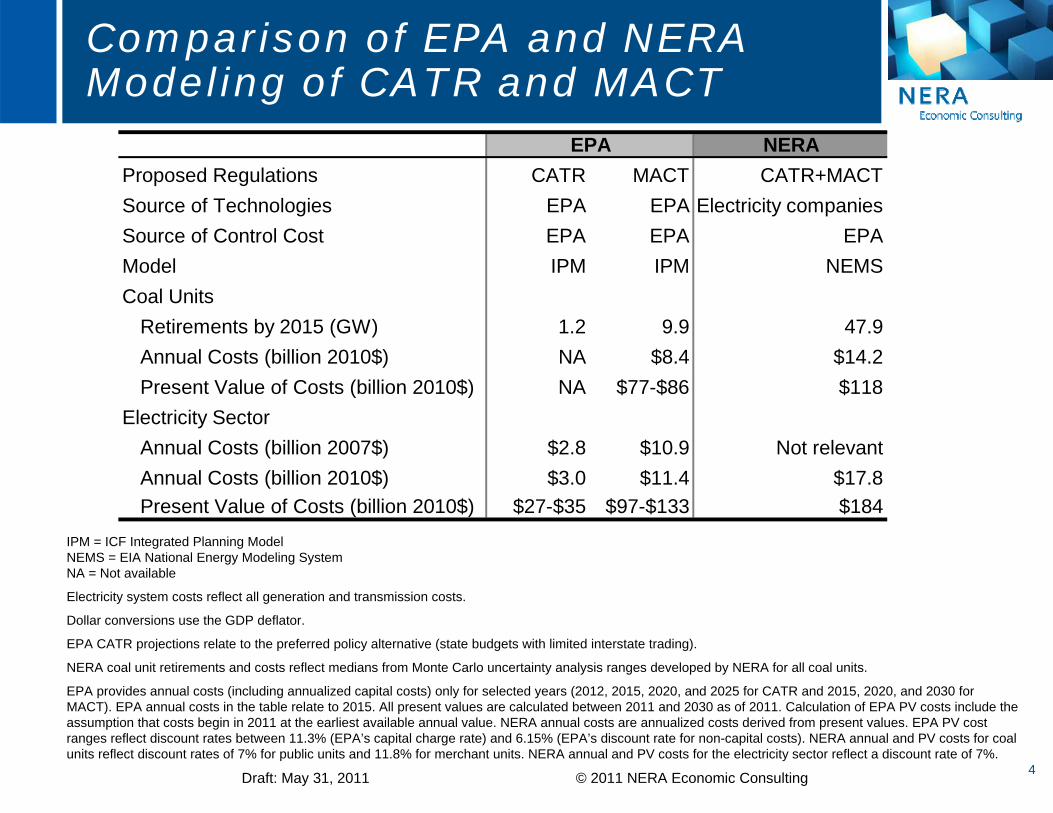
Comparison of EPA and NERA Modeling of CATR and MACT
IPM = ICF Integrated Planning Model NEMS = EIA National Energy Modeling System NA = Not available
Electricity system costs reflect all generation and transmission costs.
Dollar conversions use the GDP deflator.
EPA CATR projections relate to the preferred policy alternative (state budgets with limited interstate trading).
NERA coal unit retirements and costs reflect medians from Monte Carlo uncertainty analysis ranges developed by NERA for all coal units.
EPA provides annual costs (including annualized capital costs) only for selected years (2012, 2015, 2020, and 2025 for CATR and 2015, 2020, and 2030 for MACT). EPA annual costs in the table relate to 2015. All present values are calculated between 2011 and 2030 as of 2011. Calculation of EPA PV costs include the assumption that costs begin in 2011 at the earliest available annual value. NERA annual costs are annualized costs derived from present values. EPA PV cost ranges reflect discount rates between 11.3% (EPA’s capital charge rate) and 6.15% (EPA’s discount rate for non-capital costs). NERA annual and PV costs for coal units reflect discount rates of 7% for public units and 11.8% for merchant units. NERA annual and PV costs for the electricity sector reflect a discount rate of 7%.
EPA NERAProposed Regulations CATR MACT CATR+MACTSource of Technologies EPA EPA Electricity companiesSource of Control Cost EPA EPA EPAModel IPM IPM NEMSCoal Units
Retirements by 2015 (GW) 1.2 9.9 47.9Annual Costs (billion 2010$) NA $8.4 $14.2Present Value of Costs (billion 2010$) NA $77-$86 $118
Electricity SectorAnnual Costs (billion 2007$) $2.8 $10.9 Not relevantAnnual Costs (billion 2010$) $3.0 $11.4 $17.8Present Value of Costs (billion 2010$) $27-$35 $97-$133 $184
5 Draft: May 31, 2011 © 2011 NERA Economic Consulting
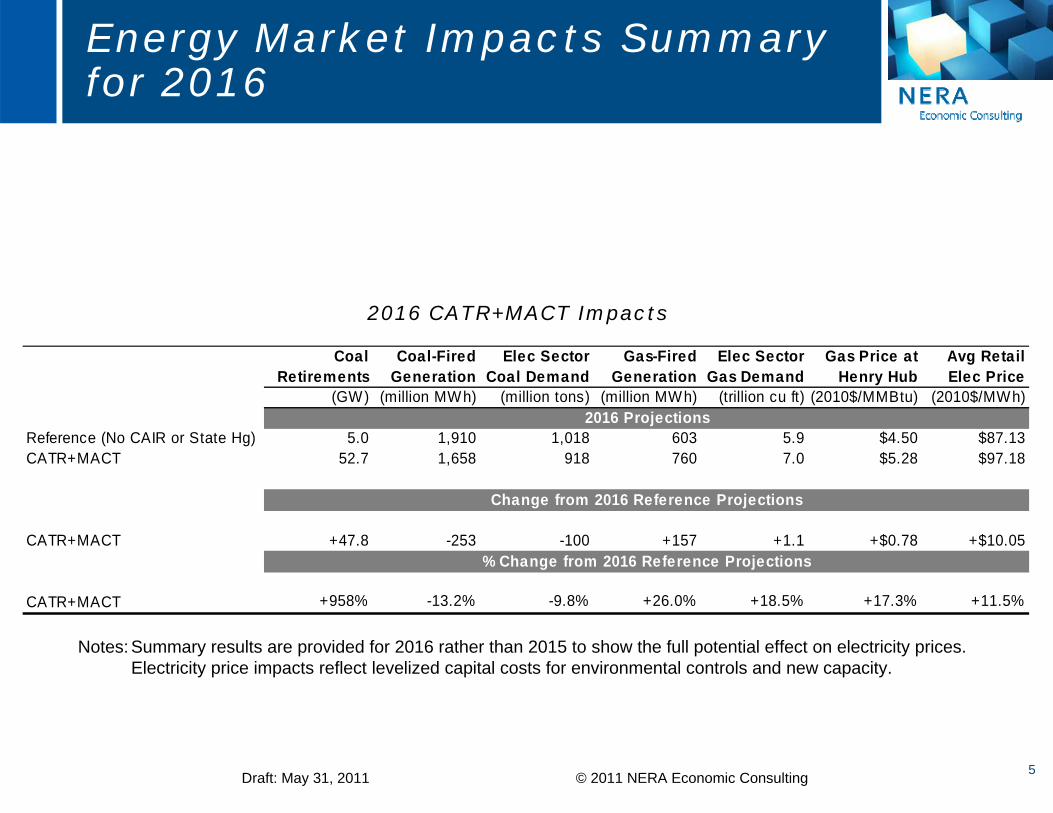
Energy Market Impacts Summary for 2016
Coal Retirements
Coal-Fired Generation
Elec Sector Coal Demand
Gas-Fired Generation
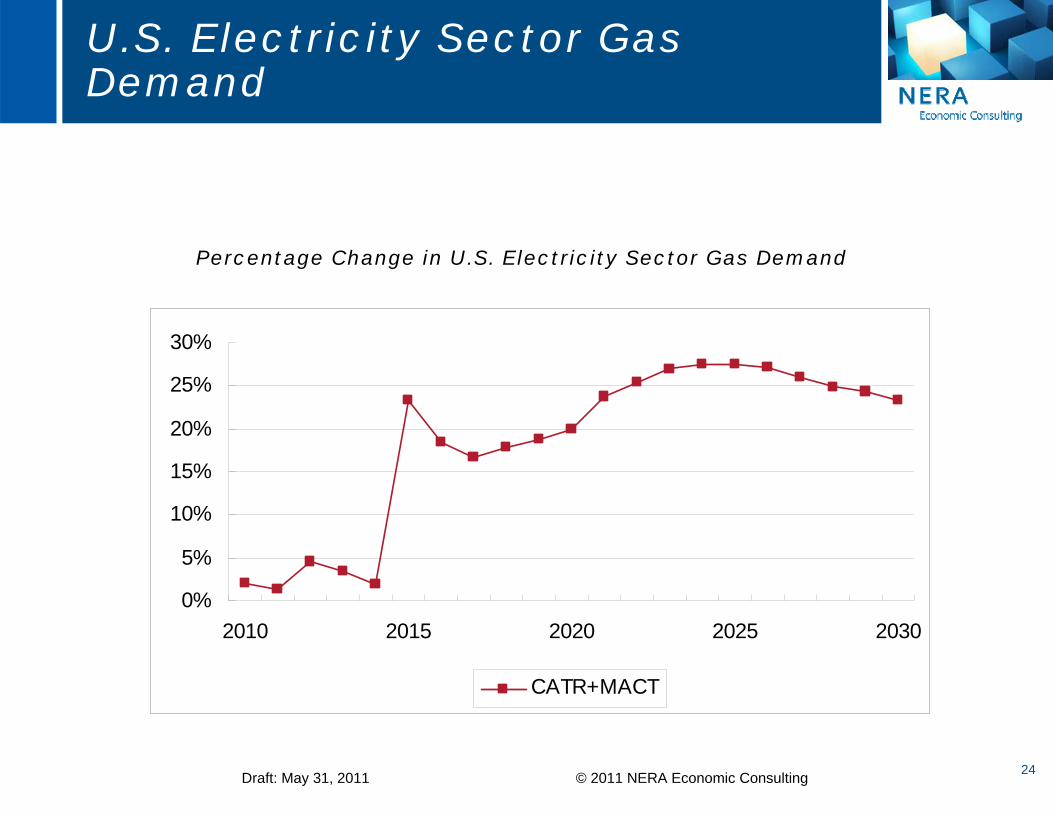
Elec Sector Gas Demand
Gas Price at Henry Hub
Avg Retail Elec Price
(GW) (million MWh) (million tons) (million MWh) (trillion cu ft) (2010$/MMBtu) (2010$/MWh)
Reference (No CAIR or State Hg) 5.0 1,910 1,018 603 5.9 $4.50 $87.13CATR+MACT 52.7 1,658 918 760 7.0 $5.28 $97.18
CATR+MACT +47.8 -253 -100 +157 +1.1 +$0.78 +$10.05
CATR+MACT +958% -13.2% -9.8% +26.0% +18.5% +17.3% +11.5%
Change from 2016 Reference Projections
% Change from 2016 Reference Projections
2016 Projections
Notes: Summary results are provided for 2016 rather than 2015 to show the full potential effect on electricity prices. Electricity price impacts reflect levelized capital costs for environmental controls and new capacity.
2016 CATR+MACT Impacts

Methodology
7 Draft: May 31, 2011 © 2011 NERA Economic Consulting
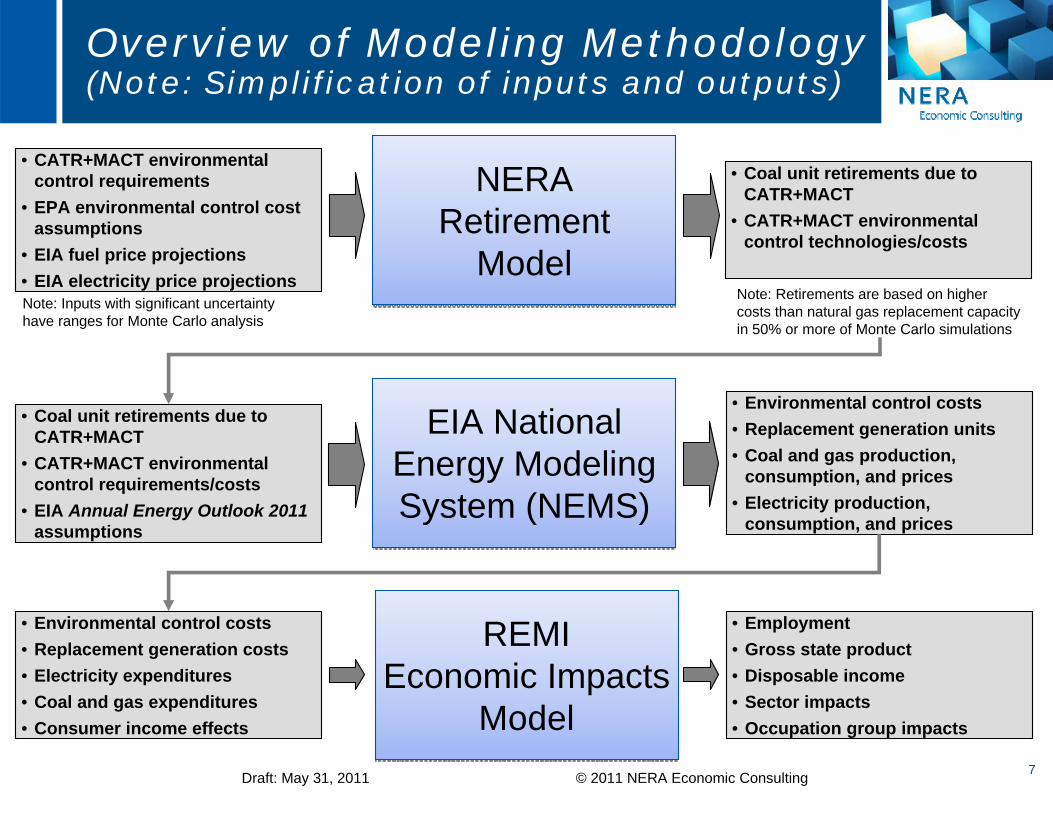
Overview of Modeling Methodology (Note: Simplification of inputs and outputs)
NERA Retirement
Model
NERA Retirement
Model
EIA National Energy Modeling System (NEMS)
EIA National Energy Modeling System (NEMS)
• CATR+MACT environmental control requirements
• EPA environmental control cost assumptions
• EIA fuel price projections • EIA electricity price projections
• Coal unit retirements due to CATR+MACT
• CATR+MACT environmental control technologies/costs
• Coal unit retirements due to CATR+MACT
• CATR+MACT environmental control requirements/costs
• EIA Annual Energy Outlook 2011 assumptions
• Environmental control costs • Replacement generation units • Coal and gas production,
consumption, and prices • Electricity production,
consumption, and prices
Note: Inputs with significant uncertainty have ranges for Monte Carlo analysis
Note: Retirements are based on higher costs than natural gas replacement capacity in 50% or more of Monte Carlo simulations
REMI Economic Impacts
Model
REMI Economic Impacts
Model
• Environmental control costs • Replacement generation costs • Electricity expenditures • Coal and gas expenditures • Consumer income effects
• Employment • Gross state product • Disposable income • Sector impacts • Occupation group impacts

8 Draft: May 31, 2011 © 2011 NERA Economic Consulting
Overview of Rationale for Models
NERA Retirement Model – Monte Carlo formulation allows for inclusion of uncertainty in key
parameters (e.g., fuel prices) and development of ranges of costs and retirements
NEMS – State-of-the-art model of the energy system – Used extensively by EIA and others – Not proprietary with NERA in-house modeling capability
REMI – State-of-the-art regional economic model – Ability to model impacts in individual states as well as U.S. – Used extensively by government agencies and others – Not proprietary with NERA in-house modeling capability

Assumptions and Uncertainties
10 Draft: May 31, 2011 © 2011 NERA Economic Consulting
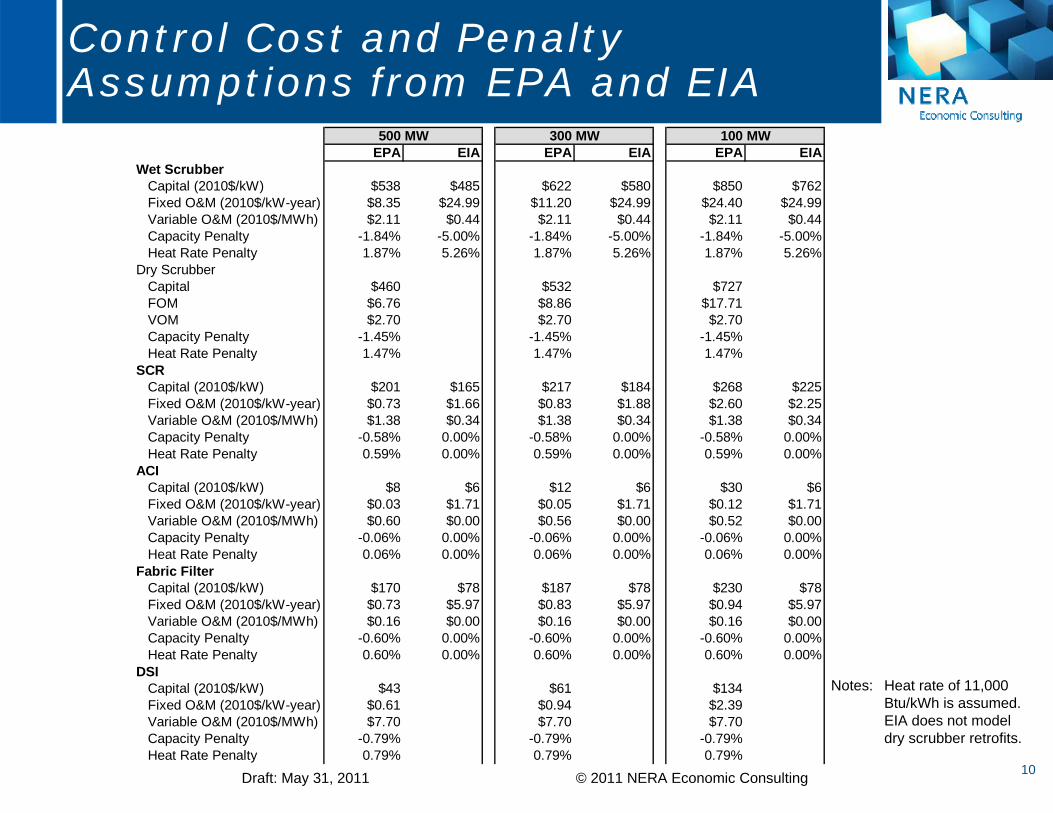
Control Cost and Penalty Assumptions from EPA and EIA
Notes: Heat rate of 11,000 Btu/kWh is assumed.
EIA does not model dry scrubber retrofits.
EPA EIA EPA EIA EPA EIAWet Scrubber
Capital (2010$/kW) $538 $485 $622 $580 $850 $762Fixed O&M (2010$/kW-year) $8.35 $24.99 $11.20 $24.99 $24.40 $24.99Variable O&M (2010$/MWh) $2.11 $0.44 $2.11 $0.44 $2.11 $0.44Capacity Penalty -1.84% -5.00% -1.84% -5.00% -1.84% -5.00%Heat Rate Penalty 1.87% 5.26% 1.87% 5.26% 1.87% 5.26%
Dry ScrubberCapital $460 $532 $727FOM $6.76 $8.86 $17.71VOM $2.70 $2.70 $2.70Capacity Penalty -1.45% -1.45% -1.45%Heat Rate Penalty 1.47% 1.47% 1.47%
SCRCapital (2010$/kW) $201 $165 $217 $184 $268 $225Fixed O&M (2010$/kW-year) $0.73 $1.66 $0.83 $1.88 $2.60 $2.25Variable O&M (2010$/MWh) $1.38 $0.34 $1.38 $0.34 $1.38 $0.34Capacity Penalty -0.58% 0.00% -0.58% 0.00% -0.58% 0.00%Heat Rate Penalty 0.59% 0.00% 0.59% 0.00% 0.59% 0.00%
ACICapital (2010$/kW) $8 $6 $12 $6 $30 $6Fixed O&M (2010$/kW-year) $0.03 $1.71 $0.05 $1.71 $0.12 $1.71Variable O&M (2010$/MWh) $0.60 $0.00 $0.56 $0.00 $0.52 $0.00Capacity Penalty -0.06% 0.00% -0.06% 0.00% -0.06% 0.00%Heat Rate Penalty 0.06% 0.00% 0.06% 0.00% 0.06% 0.00%
Fabric FilterCapital (2010$/kW) $170 $78 $187 $78 $230 $78Fixed O&M (2010$/kW-year) $0.73 $5.97 $0.83 $5.97 $0.94 $5.97Variable O&M (2010$/MWh) $0.16 $0.00 $0.16 $0.00 $0.16 $0.00Capacity Penalty -0.60% 0.00% -0.60% 0.00% -0.60% 0.00%Heat Rate Penalty 0.60% 0.00% 0.60% 0.00% 0.60% 0.00%
DSICapital (2010$/kW) $43 $61 $134Fixed O&M (2010$/kW-year) $0.61 $0.94 $2.39Variable O&M (2010$/MWh) $7.70 $7.70 $7.70Capacity Penalty -0.79% -0.79% -0.79%Heat Rate Penalty 0.79% 0.79% 0.79%
500 MW 300 MW 100 MW

11 Draft: May 31, 2011 © 2011 NERA Economic Consulting
Assumptions used for Annualization Period
Coal unit lifetime assumptions for annualizing the overnight capital costs of control technologies depend on unit age in 2015:
– Less than 45 years old: 20 years (NEMS baseline assumption)
– 45 to 54 years old: 15 years
– 55 years or older: 10 years
12 Draft: May 31, 2011 © 2011 NERA Economic Consulting
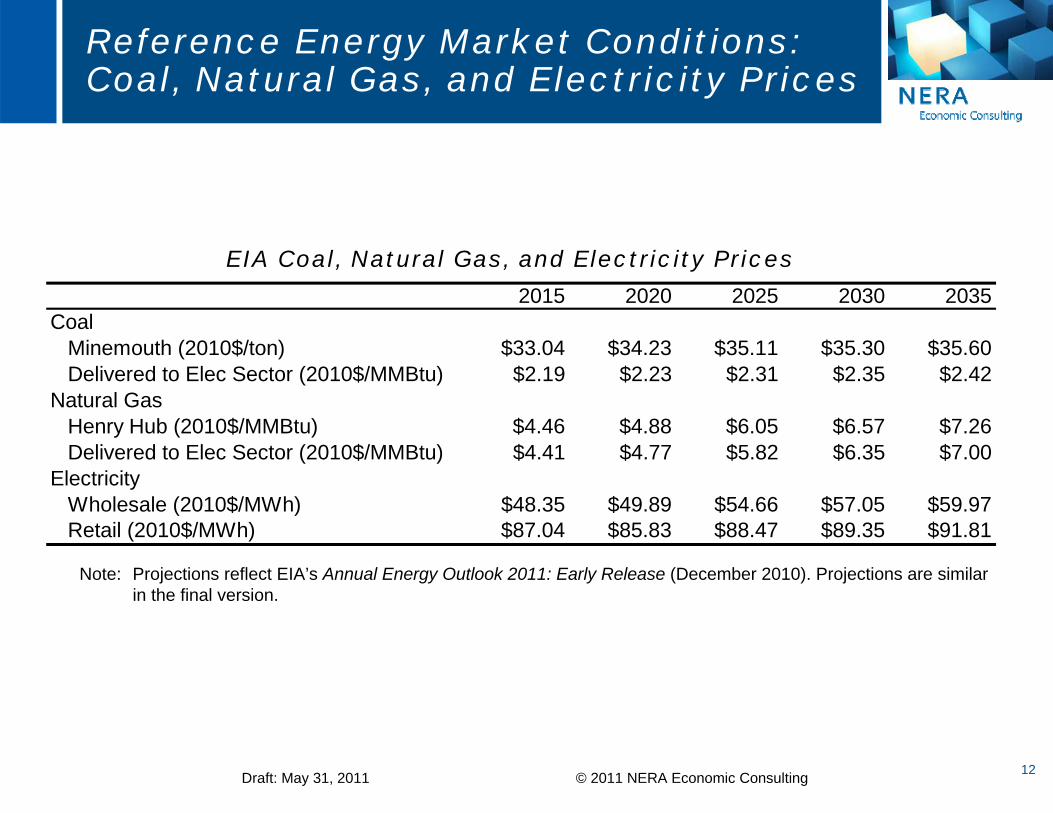
Reference Energy Market Conditions: Coal, Natural Gas, and Electricity Prices
EIA Coal, Natural Gas, and Electricity Prices 2015 2020 2025 2030 2035
CoalMinemouth (2010$/ton) $33.04 $34.23 $35.11 $35.30 $35.60Delivered to Elec Sector (2010$/MMBtu) $2.19 $2.23 $2.31 $2.35 $2.42
Natural GasHenry Hub (2010$/MMBtu) $4.46 $4.88 $6.05 $6.57 $7.26Delivered to Elec Sector (2010$/MMBtu) $4.41 $4.77 $5.82 $6.35 $7.00
ElectricityWholesale (2010$/MWh) $48.35 $49.89 $54.66 $57.05 $59.97Retail (2010$/MWh) $87.04 $85.83 $88.47 $89.35 $91.81
Note: Projections reflect EIA’s Annual Energy Outlook 2011: Early Release (December 2010). Projections are similar in the final version.
13 Draft: May 31, 2011 © 2011 NERA Economic Consulting
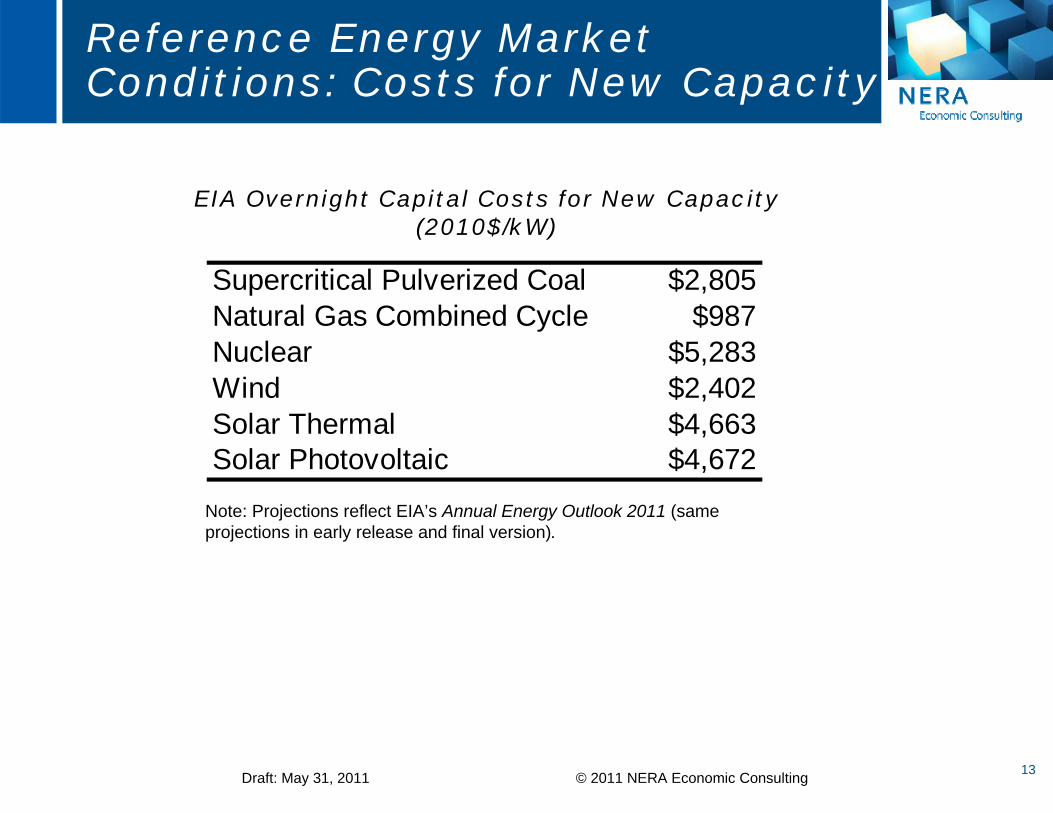
Reference Energy Market Conditions: Costs for New Capacity
EIA Overnight Capital Costs for New Capacity (2010$/kW)
Supercritical Pulverized Coal $2,805Natural Gas Combined Cycle $987Nuclear $5,283Wind $2,402Solar Thermal $4,663Solar Photovoltaic $4,672
Note: Projections reflect EIA’s Annual Energy Outlook 2011 (same projections in early release and final version).
14 Draft: May 31, 2011 © 2011 NERA Economic Consulting
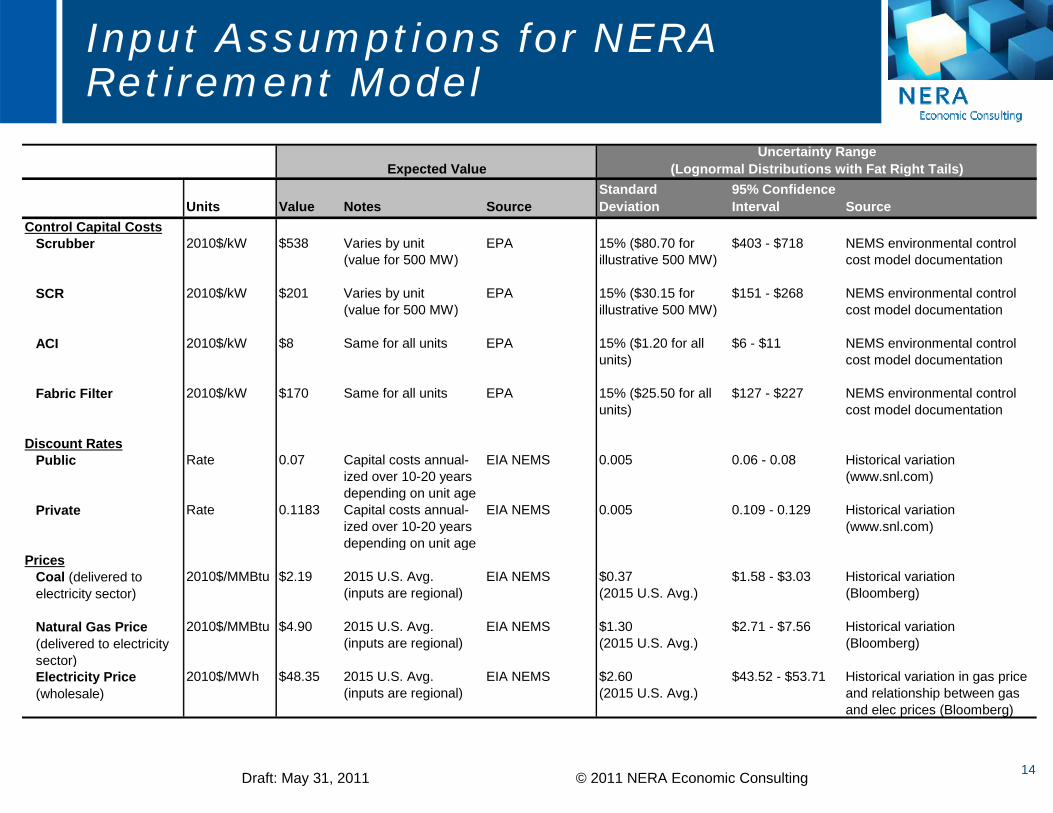
Input Assumptions for NERA Retirement Model
Units Value Notes SourceStandardDeviation
95% Confidence Interval Source
Control Capital CostsScrubber 2010$/kW $538 Varies by unit
(value for 500 MW)EPA 15% ($80.70 for
illustrative 500 MW)$403 - $718 NEMS environmental control
cost model documentation
SCR 2010$/kW $201 Varies by unit(value for 500 MW)
EPA 15% ($30.15 for illustrative 500 MW)
$151 - $268 NEMS environmental control cost model documentation
ACI 2010$/kW $8 Same for all units EPA 15% ($1.20 for all units)
$6 - $11 NEMS environmental control cost model documentation
Fabric Filter 2010$/kW $170 Same for all units EPA 15% ($25.50 for all units)
$127 - $227 NEMS environmental control cost model documentation
Discount RatesPublic Rate 0.07 Capital costs annual-
ized over 10-20 years depending on unit age
EIA NEMS 0.005 0.06 - 0.08 Historical variation (www.snl.com)
Private Rate 0.1183 Capital costs annual-ized over 10-20 years depending on unit age
EIA NEMS 0.005 0.109 - 0.129 Historical variation (www.snl.com)
PricesCoal (delivered to electricity sector)
2010$/MMBtu $2.19 2015 U.S. Avg.(inputs are regional)
EIA NEMS $0.37(2015 U.S. Avg.)
$1.58 - $3.03 Historical variation(Bloomberg)
Natural Gas Price (delivered to electricity sector)
2010$/MMBtu $4.90 2015 U.S. Avg.(inputs are regional)
EIA NEMS $1.30(2015 U.S. Avg.)
$2.71 - $7.56 Historical variation(Bloomberg)
Electricity Price (wholesale)
2010$/MWh $48.35 2015 U.S. Avg.(inputs are regional)
EIA NEMS $2.60(2015 U.S. Avg.)
$43.52 - $53.71 Historical variation in gas price and relationship between gas and elec prices (Bloomberg)
Expected ValueUncertainty Range
(Lognormal Distributions with Fat Right Tails)
Energy Market Impacts
16 Draft: May 31, 2011 © 2011 NERA Economic Consulting
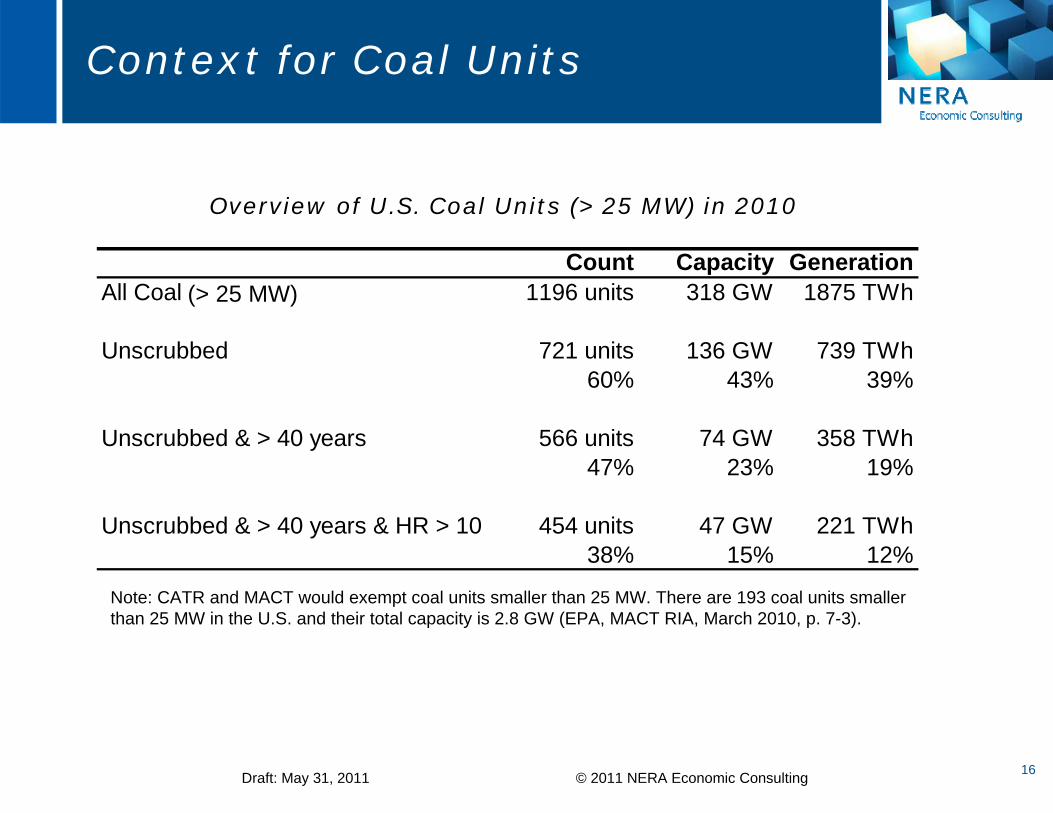
Context for Coal Units
Overview of U.S. Coal Units (> 25 MW) in 2010
Note: CATR and MACT would exempt coal units smaller than 25 MW. There are 193 coal units smaller than 25 MW in the U.S. and their total capacity is 2.8 GW (EPA, MACT RIA, March 2010, p. 7-3).
Count Capacity GenerationAll Coal 1196 units 318 GW 1875 TWh
Unscrubbed 721 units 136 GW 739 TWh60% 43% 39%
Unscrubbed & > 40 years 566 units 74 GW 358 TWh47% 23% 19%
Unscrubbed & > 40 years & HR > 10 454 units 47 GW 221 TWh38% 15% 12%
(> 25 MW)

17 Draft: May 31, 2011 © 2011 NERA Economic Consulting
CATR + MACT Control Retrofits (Net of Retirements)
162
21
108
23
39
0
176
21
135
35
47
0
181
63
182
260
239
20
0
50
100
150
200
250
300
350
WetScrubbers
DryScrubbers
SCR ACI FF DSI (e.g.,trona)
Cap
acity
(GW
)
2010 NEMS Reference 2015 NERA CATR+MACT 2015

18 Draft: May 31, 2011 © 2011 NERA Economic Consulting
Comparison of EPA and NERA Modeling of CATR and MACT
IPM = ICF Integrated Planning Model NEMS = EIA National Energy Modeling System NA = Not available
Electricity system costs reflect all generation and transmission costs.
Dollar conversions use the GDP deflator.
EPA CATR projections relate to the preferred policy alternative (state budgets with limited interstate trading).
NERA coal unit retirements and costs reflect medians from Monte Carlo uncertainty analysis ranges developed by NERA for all coal units.
EPA provides annual costs (including annualized capital costs) only for selected years (2012, 2015, 2020, and 2025 for CATR and 2015, 2020, and 2030 for MACT). EPA annual costs in the table relate to 2015. All present values are calculated between 2011 and 2030 as of 2011. Calculation of EPA PV costs include the assumption that costs begin in 2011 at the earliest available annual value. NERA annual costs are annualized costs derived from present values. EPA PV cost ranges reflect discount rates between 11.3% (EPA’s capital charge rate) and 6.15% (EPA’s discount rate for non-capital costs). NERA annual and PV costs for coal units reflect discount rates of 7% for public units and 11.8% for merchant units. NERA annual and PV costs for the electricity sector reflect a discount rate of 7%.
EPA NERAProposed Regulations CATR MACT CATR+MACTSource of Technologies EPA EPA Electricity companiesSource of Control Cost EPA EPA EPAModel IPM IPM NEMSCoal Units
Retirements by 2015 (GW) 1.2 9.9 47.9Annual Costs (billion 2010$) NA $8.4 $14.2Present Value of Costs (billion 2010$) NA $77-$86 $118
Electricity SectorAnnual Costs (billion 2007$) $2.8 $10.9 Not relevantAnnual Costs (billion 2010$) $3.0 $11.4 $17.8Present Value of Costs (billion 2010$) $27-$35 $97-$133 $184

19 Draft: May 31, 2011 © 2011 NERA Economic Consulting
Energy Market Impacts Summary for 2016
Coal Retirements
Coal-Fired Generation
Elec Sector Coal Demand
Gas-Fired Generation
Elec Sector Gas Demand
Gas Price at Henry Hub
Avg Retail Elec Price
(GW) (million MWh) (million tons) (million MWh) (trillion cu ft) (2010$/MMBtu) (2010$/MWh)
Reference (No CAIR or State Hg) 5.0 1,910 1,018 603 5.9 $4.50 $87.13CATR+MACT 52.7 1,658 918 760 7.0 $5.28 $97.18
CATR+MACT +47.8 -253 -100 +157 +1.1 +$0.78 +$10.05
CATR+MACT +958% -13.2% -9.8% +26.0% +18.5% +17.3% +11.5%
Change from 2016 Reference Projections
% Change from 2016 Reference Projections
2016 Projections
2016 CATR+MACT Impacts
Notes: Summary results are provided for 2016 rather than 2015 to show the full potential effect on electricity prices. Electricity price impacts reflect levelized capital costs for environmental controls and new capacity.

20 Draft: May 31, 2011 © 2011 NERA Economic Consulting
U.S. Cumulative Coal Plant Retirements
U.S. Cumulative Coal Plant Retirements (GW)
Note: Retirements are cumulative from 2010.
0
10
20
30
40
50
60
2010 2015 2020 2025 2030
Cum
ulat
ive
Coal
Ret
irem
ents
(G
W)
Reference (No CAIR or State Hg) CATR+MACT

21 Draft: May 31, 2011 © 2011 NERA Economic Consulting
U.S. Coal-Fired Generation
Percentage Change in U.S. Coal-Fired Generation
-20%-18%-16%-14%-12%-10%-8%-6%-4%-2%0%
2010 2015 2020 2025 2030
22 Draft: May 31, 2011 © 2011 NERA Economic Consulting
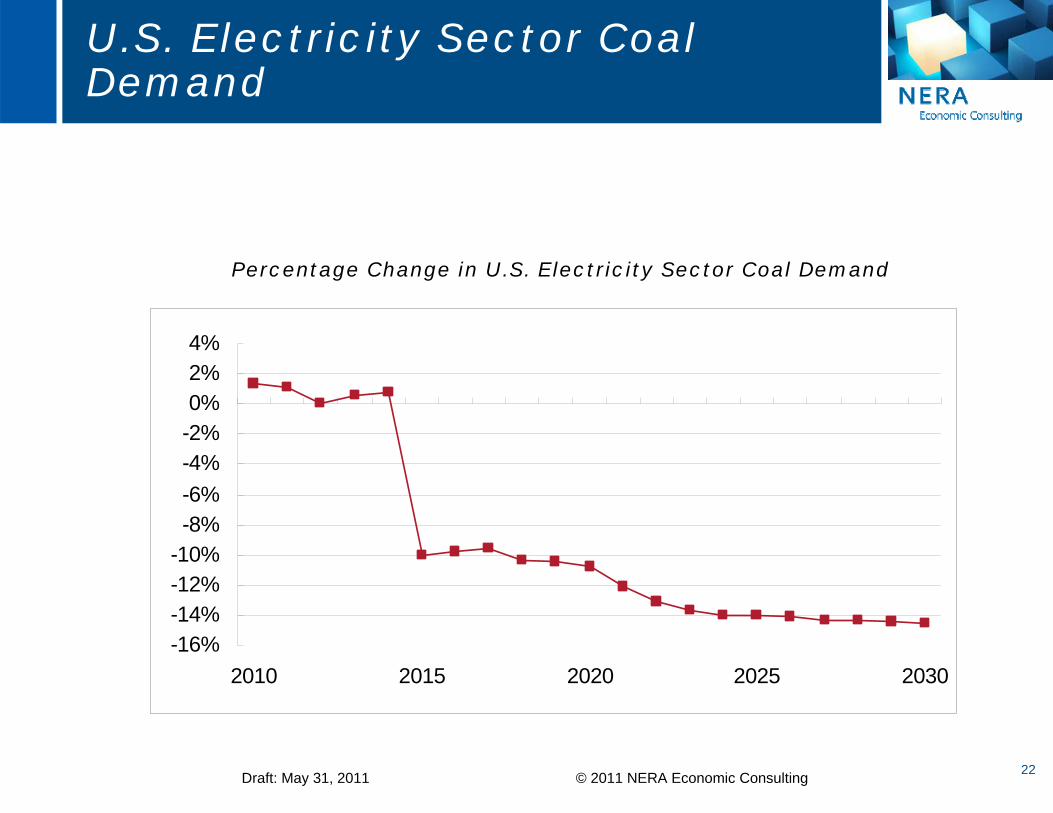
U.S. Electricity Sector Coal Demand
Percentage Change in U.S. Electricity Sector Coal Demand
-16%-14%-12%-10%-8%-6%-4%-2%0%2%4%
2010 2015 2020 2025 2030
23 Draft: May 31, 2011 © 2011 NERA Economic Consulting
U.S. Gas-Fired Generation
Percentage Change in U.S. Gas-Fired Generation
0%5%
10%15%20%25%30%35%40%45%
2010 2015 2020 2025 2030
24 Draft: May 31, 2011 © 2011 NERA Economic Consulting
U.S. Electricity Sector Gas Demand
Percentage Change in U.S. Electricity Sector Gas Demand
0%
5%
10%
15%
20%
25%
30%
2010 2015 2020 2025 2030
CATR+MACT
25 Draft: May 31, 2011 © 2011 NERA Economic Consulting
Henry Hub Natural Gas Price
Percentage Change in Henry Hub Natural Gas Price
0%2%4%6%8%
10%12%14%16%18%20%
2010 2015 2020 2025 2030
26 Draft: May 31, 2011 © 2011 NERA Economic Consulting
U.S. Average Retail Electricity Prices
Percentage Change in U.S. Average Retail Electricity Price
0%
2%
4%
6%
8%
10%
12%
14%
2010 2015 2020 2025 2030
Note: Electricity price impacts reflect levelized capital costs for environmental controls and new capacity.
27 Draft: May 31, 2011 © 2011 NERA Economic Consulting
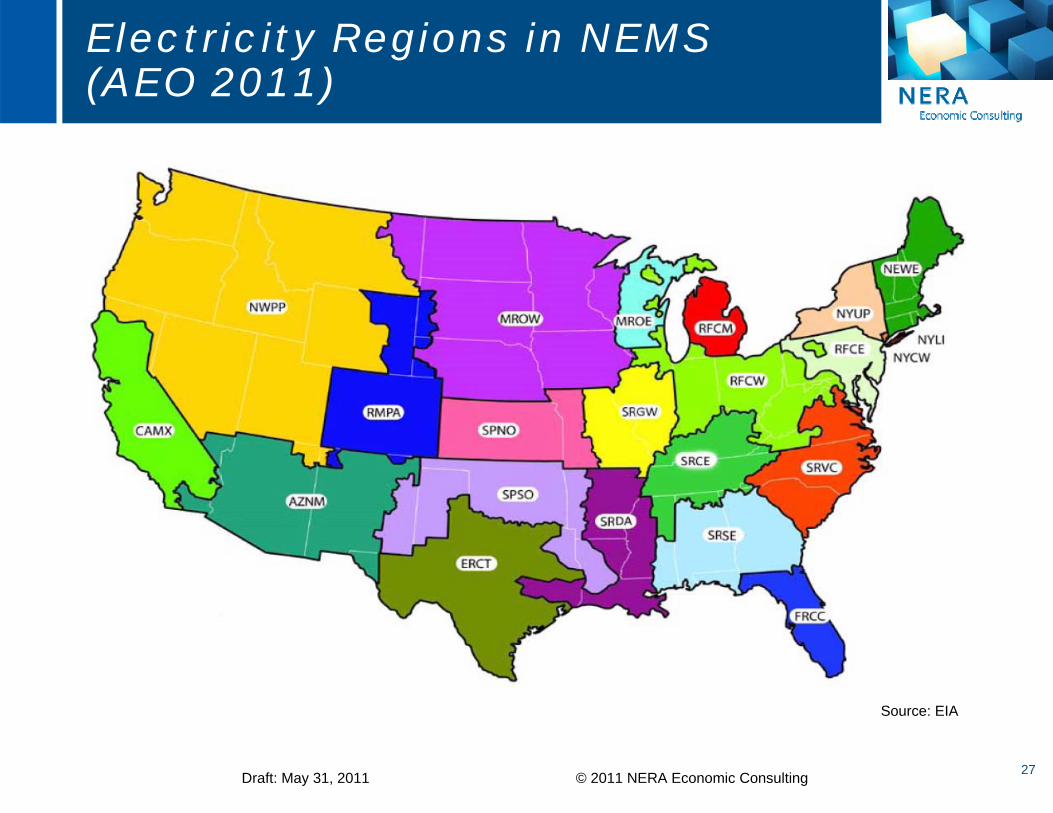
Electricity Regions in NEMS (AEO 2011)
Source: EIA

28 Draft: May 31, 2011 © 2011 NERA Economic Consulting
Regional Retail Electricity Prices
Percentage Change in Average Retail Electricity Prices 2016 2020 2025
US Average +11.5% +9.5% +8.5%
NEWE New England +7.5% +7.7% +5.4%NYCW NYC +5.5% +5.0% +7.6%NYLI NY Long Island +6.5% +4.8% +6.6%NYUP NY Upstate +8.0% +6.4% +8.1%RFCE Mid-Atlantic +17.1% +9.9% +7.8%SRVC VA & Carolinas +12.7% +9.9% +8.2%SRSE Southeast +14.5% +9.4% +9.8%FRCC Florida +8.8% +8.9% +8.5%RFCM Lower MI +20.5% +17.7% +13.4%RFCW OH, IN, & WV +12.9% +12.1% +11.9%SRCE KY & TN +23.5% +17.8% +13.3%MROE WI & Upper MI +21.7% +17.3% +12.6%MROW Upper Midwest +17.6% +14.1% +10.2%SRGW South IL & East MO +23.1% +18.8% +16.3%SPNO KS & West MO +12.8% +12.0% +14.6%SRDA AR, LA, & West MS +9.0% +8.0% +7.5%SPSO Oklahoma +15.8% +12.8% +10.9%ERCT Texas +12.1% +9.4% +9.5%RMPA CO & East WY +6.1% +7.3% +8.8%NWPP Northwest +2.0% +4.0% +7.9%AZNM AZ & NM +6.1% +5.2% +3.6%CAMX California +1.8% +1.9% +0.8%

29 Draft: May 31, 2011 © 2011 NERA Economic Consulting
Economic Impacts: U.S. Employment 2013-2020
Note: Negative employment impacts are the sums of employment impacts in sectors with net losses. Positive employment impacts are the sums of employment impacts in sectors with net gains.
U.S. Total 2013-2020:
Negative: -1.88 million
Positive: 0.45 million
Net: -1.44 million
-394 -396
-471
-163-139 -120 -107 -94
113 92 7424 26 33 38 46
-281 -304
-397
-139-113
-87 -69 -48
-600
-500
-400
-300
-200
-100
0
100
200
2013 2014 2015 2016 2017 2018 2019 2020
US E
mpl
oym
ent I
mpa
cts
(thou
sand
s of
jobs
)
Negative Positive Net