proposed method for groundwater vulnerability mapping in...
TRANSCRIPT

Proposed method for groundwater vulnerability mappingin carbonate (karstic) aquifers: the COP method
Application in two pilot sites in Southern Spain
J. M. Vıas · B. Andreo · M. J. Perles · F. Carrasco ·I. Vadillo · P. Jimenez
Abstract The ‘COP method’ has been developed for theassessment of intrinsic vulnerability of carbonate aquifersin the frame of the European COST Action 620. Thismethod uses the properties of overlying layers above thewater table (O factor), the concentration of flow (C fac-tor) and precipitation (P factor) over the aquifer, as theparameters to assess the intrinsic vulnerability of ground-water. This method considers karst characteristics, such asthe presence of swallow holes (C factor) and their catch-ment areas as well as karstic landforms, as factors whichdecrease the natural protection provided by overlying lay-ers (O factor). The P factor allows for consideration of thespatial and temporal variability of precipitation, which isconsidered the transport agent of contamination. Two car-bonate aquifers in the South of Spain, Sierra de Lıbar (aconduit flow system) and Torremolinos (a diffuse flow sys-tem), have been selected for the application and validationof the method and the results have been compared withthree methods widely applied in different aquifers aroundthe world (AVI, GOD and DRASTIC). Comparisons withthese methods and validation tools (hydrogeological dataand tracer test) show the advantages of the COP method inthe assessment of vulnerability of karstic groundwaters.
Resume La methode “COP” a ete developpeepour evaluer la vulnerabilite intrinseque des aquiferescarbonates dans le cadre du programme COST Action620 de l’Union Europeenne. Cette methode utilise lesproprietes des couches situees au dessus de la nappeaquifere (facteur O), la concentration de l’ecoulement(facteur C) et les precipitations (facteur P) au dessus
Received: 30 December 2005 / Accepted: 9 January 2006Published online: 11 February 2006
C© Springer-Verlag 2006
J. M. Vıas · M. J. PerlesDepartment of Geography, University of Malaga,Malaga 29071, Spain
B. Andreo (�) · F. Carrasco · I. Vadillo · P. JimenezDepartment of Geology, Faculty of Science,University of Malaga,Malaga 29071, Spaine-mail: [email protected].: +34-952132004Fax: +34-952132000
de l’aquifere, comme les parametres de l’evaluation dela vulnerabilite intrinseque des eaux souterraines. Cettemethode considere les caracteristiques du karst, comme lapresence de depressions en surface (facteur C) et l’etenduede leur bassin versant, ainsi que les formes du paysagekarstique, comme des facteurs qui diminuent la protec-tion naturelle apportee par les couches du dessus (facteurO). Le facteur P permet de considerer la variabilite spa-tiale et temporelle des precipitations, en tant qu’agent detransport de la contamination. Deux aquiferes carbonatesdu Sud de l’Espagne, la Sierra de Libar (un systeme aconduit) et Torremolinos (un systeme d’ecoulement dif-fus), ont ete selectionnes pour l’application et la validationde cette methode, et les resultats ont ete compares avectrois methodes assez utilisees sur d’autres aquiferes dansle monde (AVI, GOD et DRASTIC). Les comparaisonsavec ces trois methodes et les outils de validation (donneeshydrogeologues et tests de tracage) montrent les avantagesde la methode COP lors de l’evaluation de la vulnerabilitedes eaux souterraines karstiques.
Resumen El metodo COP ha sido desarrollado paraevaluar y cartografiar la vulnerabilidad intrınseca de losacuıferos carbonaticos en el marco de la Accion EuropeaCOST 620. El metodo utiliza los siguientes factores:capacidad de proteccion de la zona no saturada (O),concentracion de flujos en superficie (C) y precipitacion(P). El metodo COP tiene en cuenta caracterısticas talescomo la presencia de sumideros karsticos y su cuenca dealimentacion y formas exokarsticas, porque disminuyenla capacidad de proteccion natural del agua subterraneadada por las capas suprayacentes (factor O). El factor Ptiene en cuenta la variabilidad espacial y temporal de laprecipitacion, por ser el principal agente que transportalos contaminantes hasta el agua subterranea. El metodoCOP se ha aplicado en dos acuıferos del Sur de Espana,Sierra de Lıbar (acuıfero karstico de flujo por conductos)y Torremolinos (acuıfero fisurado de flujo difuso), y losresultados en ambos acuıferos han sido comparados con losresultados obtenidos mediante otros metodos ampliamenteutilizados en el mundo (DRASTIC, GOD y AVI). Lacomparacion realizada y las tecnicas de validacion (datoshidrogeologicos y ensayo de trazadores) ha permitidodeterminar las ventajas que supone utilizar el metodo COPen los acuıferos carbonaticos.
Hydrogeology Journal (2006) 14: 912–925 DOI 10.1007/s10040-006-0023-6

913
Keywords Vulnerability mapping . Carbonate aquifers .Karst . COP method . Southern Spain
Introduction
Since Margat (1968) and Albinet and Margat (1970)introduced the concept of the vulnerability of groundwaterto contamination, the international scientific communityhas shown an increasing interest in groundwater protection(Foster and Hirata 1988; Adams and Foster 1992; Drewand Hotzl 1999; Zwahlen 2004). Many methods have beenproposed for groundwater vulnerability mapping, includ-ing; DRASTIC (Aller et al. 1987), GOD (Foster 1987), AVI(Van Stempvoort et al. 1993), and SINTACS (Civita 1994).A thorough overview of existing methods is given in Vrbaand Zaporozec (1994) and in Gogu and Dassargues (2000).These methods have been mainly applied to groundwaterprotection in porous aquifers, except the EPIK (Doerfligerand Zwahlen 1998; Doerfliger et al. 1999) and PI (Gold-scheider et al. 2000) methods which were specificallydeveloped for the assessment of vulnerability in karsticareas.
World wide, groundwater from karst aquifers is con-sidered an important resource and is extensively used forwater supply. In Europe, carbonate terrains occupy 35% ofthe land-surface and in some countries karst groundwatercontributes up to 50% to the total drinking water supply;in many regions it is the only available fresh waterresource (European Commission 1995). Karst aquifers areparticularly vulnerable to contamination due to thin soils,flow concentration within the epikarst and concentratedrecharge via swallow holes. As a result, contaminants mayeasily reach the groundwater and be rapidly transported inkarst conduits over large distances (Goldscheider 2005).In karst aquifers, the residence time of contaminants isoften short and natural attenuation processes do not occureffectively. Recognising these issues, the DirectorateGeneral for Science, Research and Development of theEuropean Commission supported COST Action 620(COST is the acronym for “COoperation in Science andTechnology) which considered “Vulnerability and RiskMapping for the Protection of Carbonate (Karst) Aquifers”and ran between 1997 and 2003. This Action contributedto the development of the European Water Framework Di-rective 2000/60/EC for river basin management (EuropeanCommission 2000) and the Directive COM(2003)550(European Commission 2003) for protection of groundwa-ter from pollution (known as the Groundwater DaughterDirective).
Two classes of vulnerabilities have been distinguished(Daly et al. 2002): intrinsic and specific vulnerability.Intrinsic vulnerability is the susceptibility of ground-water to contaminants generated by human activitiesand takes into account the hydrogeological character-istics of an area, but is independent of the nature ofthe contaminant and the contamination scenario. Spe-cific vulnerability takes into account the physical-chemicalproperties of contaminants and their relationship to
the physical-chemical properties of the hydrogeologicalsystem.
In addition, according to the Origin-Pathway-Targetmodel (Daly et al. 2002), the target for vulnerabilitymapping may be either the groundwater resource orthe source of water (springs/pumping wells) used forwater supply. For resource vulnerability, the target isthe groundwater surface within the aquifer and only thevertical pathway through overlying layers is considered.For source vulnerability, water in wells or springs is thetarget; consequently, this includes additionally horizontalflow within the aquifer. A European Approach to vulner-ability mapping in karst aquifers has been developed inthe framework of COST Action 620, and considered fourfactors (Daly et al. 2002; Goldscheider and Popescu 2004):overlying layers (O factor), concentration of flow (Cfactor), precipitation regime (P factor) and karst networkdevelopment (K factor). Resource vulnerability maps maybe prepared by a combination of the O, C and P factorswhereas for source vulnerability maps, the addition of theK factor is required. Originally, Daly et al. (2002) devel-oped a conceptual framework but did not propose detailedguidelines, tables or formulae for vulnerability assessment.They highlighted the need for developing methods, whichfacilitated flexible application in different Europeanregions using available data and accommodating varyingclimatic conditions. Intrinsic vulnerability maps are usedas environmental management tools so must be capableof validation with natural or artificial tracers in order toensure that the conceptual understanding of prevailinghydrogeological conditions are valid (Bruyere et al. 2001;Jeannin et al. 2001; Goldscheider et al. 2001; Perrin et al.2004).
Conventional methods (i.e. DRASTIC, AVI, GOD, SIN-TACS) are able to distinguish degrees of vulnerability atregional scales where different lithologies exist (Vıas et al.2005), but they are much less effective at assessing vulnera-bility in carbonate aquifers as they do not take into accountthe peculiarities of karst. This paper proposes a new method(COP) that considers the special hydrogeological proper-ties of karst. The method can be applied in different cli-matic conditions and different types of carbonate aquifers(diffuse and conduit flow systems). In addition, the COPmethod uses variables, parameters and factors in line withthose proposed in the European Approach (Daly et al. 2002;Zwahlen 2004) and it can be applied using different levelsof available data. A quantification and category system foreach parameter has been established, using the combina-tion and weighting of variables. The proposed method hasbeen used to map the intrinsic vulnerability of two car-bonate aquifers in Southern Spain with differing climate,hydrogeology and geology. Both aquifers have been previ-ously investigated using other vulnerability mapping meth-ods (Longo et al. 2001; Brechenmacher 2002; Vıas et al.2005; Andreo et al. 2005) and some validation of the resultshas been carried out. Consequently, it is possible to com-pare results and to demonstrate the effectiveness of the COPmethod in karst areas, particularly within Mediterraneanaquifers.
Hydrogeology Journal (2006) 14: 912–925 DOI 10.1007/s10040-006-0023-6

914
Characteristics of the COP method
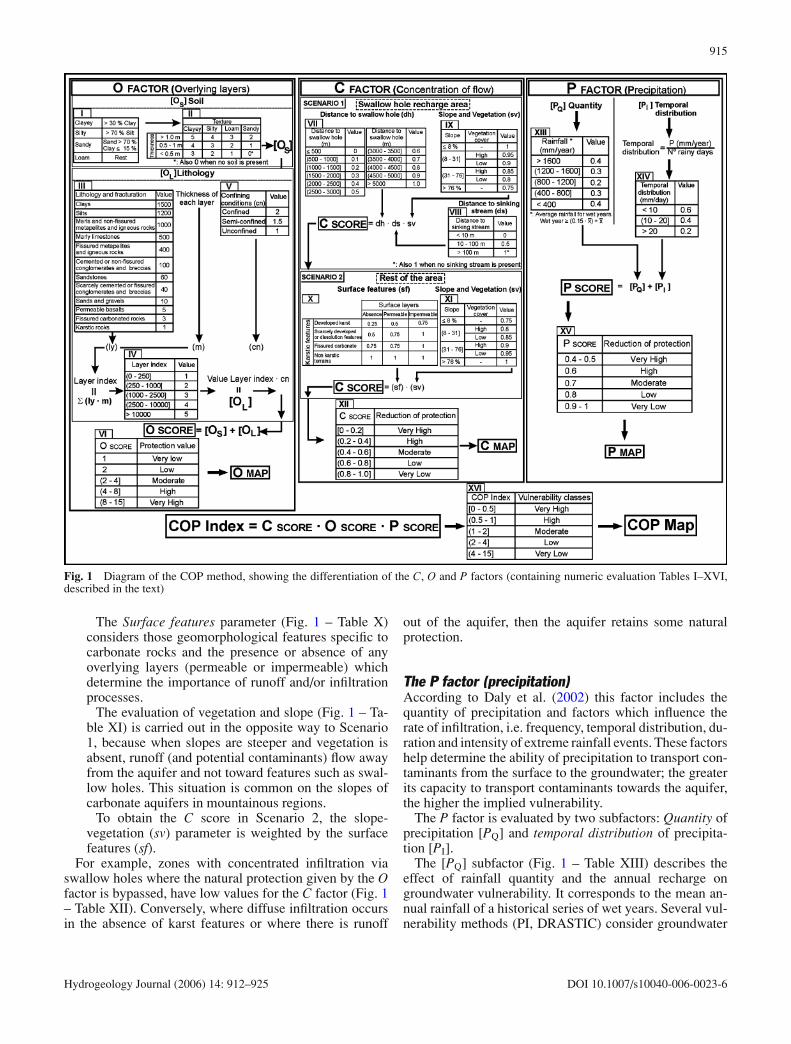
The COP acronym comes from the three initials of the fac-tors used: flow Concentration, Overlying layers and Pre-cipitation (Fig. 1). The conceptual basis of this method,according to the European Approach (Daly et al. 2002;Goldscheider and Popescu 2004), is to assess the naturalprotection of groundwater (O factor) determined by theproperties of overlying soils and the unsaturated zone, andalso to estimate how this protection can be modified by theinfiltration process – diffuse or concentrated – (C factor)and the climatic conditions (P factor – precipitation).
The O factor (overlying layers)The O factor considers the protection provided to theaquifer by the physical properties and thickness of thelayers above the saturated zone. Daly et al. (2002) pro-posed subdivision into four layers: topsoil, subsoil, non-karstic rocks and unsaturated karstic rocks. In the proposedCOP method only two layers with important hydrogeolog-ical roles are used in order to evaluate the O factor: Soils[OS] and the lithological layers of the unsaturated zone[OL].
The soil subfactor [OS] deals with the biologically ac-tive part of the subsurface, where attenuation processesoccur and as a consequence, when present, should betaken into account in vulnerability mapping. Several pa-rameters are considered in the evaluation of the soil sub-factor (Fig. 1 – Tables I and II): texture, grain size dis-tribution and thickness, the last being highly variable inMediterranean areas. The lithology subfactor [OL] reflectsthe attenuation capacity of each layer within the unsatu-rated zone. The assessment criteria for its quantificationare the type of rock (which determines its hydrogeologi-cal characteristics, mainly effective porosity and hydraulicconductivity) and the degree of fracturing (ly), the thick-ness of each layer (m) and any confining conditions (cn)(Fig. 1 – Tables III–V). Successive summing of the prod-ucts from the multiplication of thickness and lithology ofeach layer, yields an index which is associated with pro-tection (Layer index = ∑
(ly · m)). The concept of addinglayers is based on the AVI method (Van Stempvoort et al.1993 ) and PI method (Goldscheider et al. 2000).
The “cn” parameter is a weighting coefficient for the layerindex similar to the GOD method (Foster 1987) and the PImethod (Goldscheider et al. 2000). The values assignedto the “cn” parameter (Fig. 1 – Table V) give the highestprotection to the confined aquifer whereas an unconfinedaquifer is not affected by this parameter (cn = 1).
The attenuation capacity increases with the sum of theprotective layers. Thus, an O score is obtained by addingthe subfactors soil [OS] and lithology [OL] (Fig. 1 –Table VI), yielding a corresponding protection value. Thelowest values of the O factor (higher vulnerability) cor-respond to areas where carbonate materials outcrop andwhere the soil is poorly developed or absent. Moderate andHigh protection values (lower vulnerability), derived from
higher O scores, are representative of areas where the de-gree of protection is high, either due to the presence of soilor of low-permeability lithologies.
The C factor (flow concentration)The O factor describes the vulnerability of groundwa-ter from contamination where infiltration through the un-saturated zone is diffuse. The C factor is a modifier ofthe O factor (overlying layers) and represents the po-tential for water to bypass the protection provided bythe overlying layers (Daly et al. 2002). The C factorrepresents the degree to which precipitation at or nearaquifer outcrop is concentrated into a swallow hole, by-passing the unsaturated zone. This is based on the PImethod (Goldscheider et al. 2000) and the EPIK method(Doerfliger and Zwahlen 1998).
Two scenarios may be differentiated (Fig. 1):
Scenario 1: This describes the situation within a catch-ment covered by a low permeability layer, where sur-face runoff flows either into a swallow hole or an areaof concentrated infiltration such as the foot of a slope.That is when both allogenic and autogenic rechargewithin the catchment is concentrated into a karst fea-ture which results in the bypass of the unsaturated zone.The evaluation of the C factor in this scenario considersfour variables: the distance from the recharge area tothe swallow hole (dh) and to the sinking stream (ds),and the influence of slope (s) and vegetation (v). Thevulnerability of the aquifer reduces with increasing dis-tance between the recharge area and the swallow holeor the sinking stream (Fig. 1 – Tables VII and VIII).
The assessment of vegetation cover (v) considers thepercentage of catchment area cover that is most likelyto affect the infiltration-runoff regime (Fig. 1 – TableIX). Low vegetation cover is considered to be less than20–30% of a given surface area. Four ranges of topo-graphic slope (s) are positively correlated with runoff.The combination of slope and vegetation provide thevalue for the slope-vegetation parameter (sv) (Fig. 1 –Table IX). The values of “sv” show that when the slopeincreases and vegetation is scarce, the vulnerability in-creases giving values of “sv” close to 1. This meansthat recharge flows more easily to the swallow hole re-sulting in shorter travel times to the water table. The Cscore, under these recharge conditions, is obtained bymultiplying the values of the parameter for slope andvegetation (sv) by those for the distances from rechargearea to the swallow hole (dh) or the sinking stream(ds).
Scenario 2: This describes the situation in areas whereautogenic recharge occurs but not as concentrated in-filtration via a swallow hole or at the foot of a slope.The C score under this situation is evaluated by thecombination of only three variables: surface features(sf), slope (s) and vegetation (v).
Hydrogeology Journal (2006) 14: 912–925 DOI 10.1007/s10040-006-0023-6
915
Fig. 1 Diagram of the COP method, showing the differentiation of the C, O and P factors (containing numeric evaluation Tables I–XVI,described in the text)
The Surface features parameter (Fig. 1 – Table X)considers those geomorphological features specific tocarbonate rocks and the presence or absence of anyoverlying layers (permeable or impermeable) whichdetermine the importance of runoff and/or infiltrationprocesses.
The evaluation of vegetation and slope (Fig. 1 – Ta-ble XI) is carried out in the opposite way to Scenario1, because when slopes are steeper and vegetation isabsent, runoff (and potential contaminants) flow awayfrom the aquifer and not toward features such as swal-low holes. This situation is common on the slopes ofcarbonate aquifers in mountainous regions.
To obtain the C score in Scenario 2, the slope-vegetation (sv) parameter is weighted by the surfacefeatures (sf).
For example, zones with concentrated infiltration viaswallow holes where the natural protection given by the Ofactor is bypassed, have low values for the C factor (Fig. 1– Table XII). Conversely, where diffuse infiltration occursin the absence of karst features or where there is runoff
out of the aquifer, then the aquifer retains some naturalprotection.
The P factor (precipitation)According to Daly et al. (2002) this factor includes thequantity of precipitation and factors which influence therate of infiltration, i.e. frequency, temporal distribution, du-ration and intensity of extreme rainfall events. These factorshelp determine the ability of precipitation to transport con-taminants from the surface to the groundwater; the greaterits capacity to transport contaminants towards the aquifer,the higher the implied vulnerability.
The P factor is evaluated by two subfactors: Quantity ofprecipitation [PQ] and temporal distribution of precipita-tion [PI].
The [PQ] subfactor (Fig. 1 – Table XIII) describes theeffect of rainfall quantity and the annual recharge ongroundwater vulnerability. It corresponds to the mean an-nual rainfall of a historical series of wet years. Several vul-nerability methods (PI, DRASTIC) consider groundwater
Hydrogeology Journal (2006) 14: 912–925 DOI 10.1007/s10040-006-0023-6
916
protection to decrease (or vulnerability to increase)with increasing recharge as infiltration occurs morerapidly. Conversely, higher rates of recharge providehigher dilution and consequently the vulnerability de-creases. The SINTACS method (Civita 1994) proposesa reduction in vulnerability when recharge is higherthan 300–400 mm/year. In carbonate aquifers aroundthe Mediterranean, the annual average recharge rangesbetween 35 and 55% of annual precipitation (Lopez-Getaet al. 2004). Therefore it can be established that an increasein precipitation up to around 800–1,200 mm increases vul-nerability because the transit time for contaminants, fromthe surface to groundwater, is likely to be more importantthan the dilution process. When annual precipitation ex-ceeds 800–1,200 mm, the dilution of potential contaminantis likely to be the dominant process and consequently theprotection given by the O factor is less modified.
The [PI] subfactor concerns the temporal distribution ofprecipitation in a certain period of time and thus is indica-tive of the intensity of precipitation. This subfactor enablesa comparison to be made between zones within Europe,where rainfall and intensity conditions are highly variable.For example, in Mediterranean areas, precipitation is moreintense than in central and northern Europe. For the estima-tion of this subfactor, two variables are considered for a wetyear, the mean annual precipitation and the number of rainydays (Fig. 1 – Table XIV). It follows therefore, that valuesassigned to the [PI] subfactor are greater with higher totalsof annual precipitation and lower number of rainy days.This results in larger amounts of recharge that facilitatesrapid infiltration through fissures or karst conduits, thus in-creasing groundwater vulnerability. The greater the dailyrainfall, the greater the amounts of runoff towards swallowholes that favour concentrated infiltration. Where infiltra-tion is diffuse and slow, the [PI] sub-factor is low; usually insuch circumstances the volumes of recharge are relativelysmall.
Higher values of the P factor (Fig. 1 – Table XV) indicatea lower impact on the level of protection afforded by theO factor. However lower values indicate that precipitation,as a function of quantity and intensity, diminishes the pro-tection afforded by the O factor and increases groundwatervulnerability.
COP vulnerability indexThe factors of the COP method have been combined to eval-uate the intrinsic vulnerability of a groundwater resource,as proposed in the following formula:
COP Index = C · O · P
The final numerical representations of the C, O and P fac-tors (the C, O and P scores) are multiplied, because eachone is considered to impact on the assessment of vulnera-bility of karst aquifers.
Within the COP method, the values for the intrinsicvulnerability index range between 0 and 15 (Fig. 1 – Table
XVI). Following the proposal by Vrba and Zaporozec(1994), the values for this index are grouped into fivevulnerability classes (Very High, High, Moderate, Lowand Very Low vulnerability).
The COP index values are really a modification of thevalues for the O factor, consisting of a reclassificationof groups and their associated vulnerability. The extremeclasses of the O factor have been split and their values re-classified. The interval limits for the Very High and Highclasses are assigned mainly depending on the influence ofthe C factor on carbonate rocks, and to a lesser degree onthat of the P factor. Those of the Very Low class corre-spond to zones in which the C and P factors have littleinfluence on protection. The Moderate and Low classes re-fer to zones where potential protection is low to average, inwhich the C and P factors do not have a decisive influenceon vulnerability (which they do in the High and Very Highclasses).
Vulnerability mapping of pilot sites
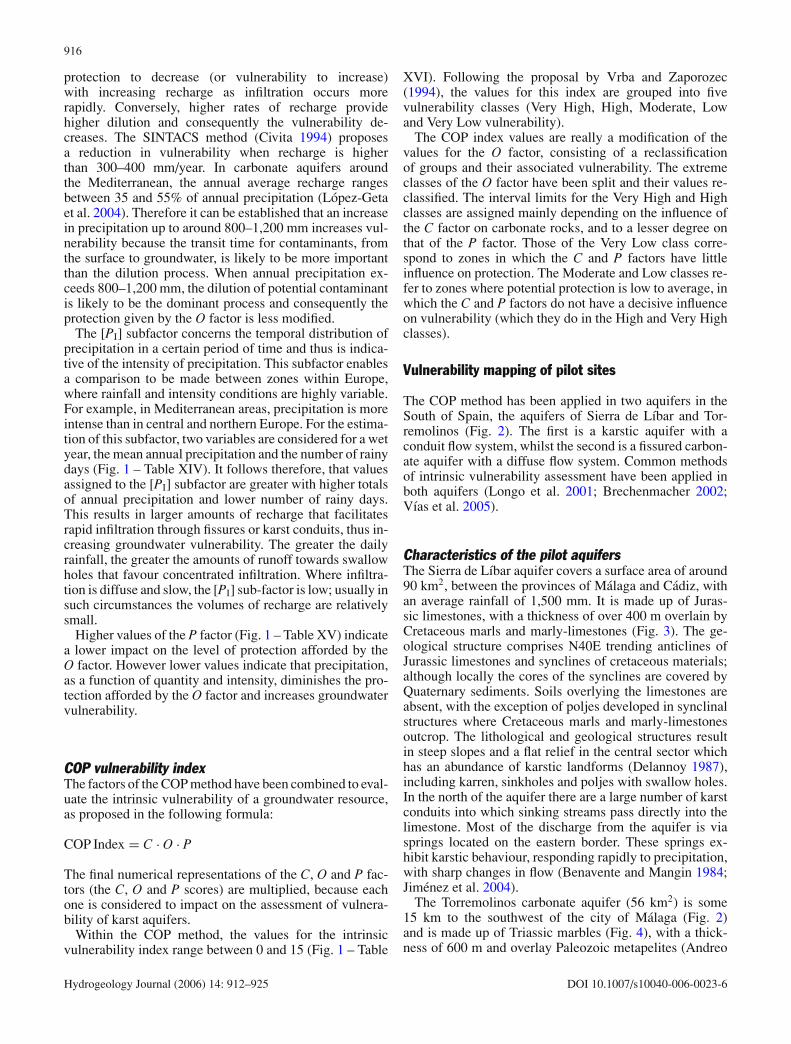
The COP method has been applied in two aquifers in theSouth of Spain, the aquifers of Sierra de Lıbar and Tor-remolinos (Fig. 2). The first is a karstic aquifer with aconduit flow system, whilst the second is a fissured carbon-ate aquifer with a diffuse flow system. Common methodsof intrinsic vulnerability assessment have been applied inboth aquifers (Longo et al. 2001; Brechenmacher 2002;Vıas et al. 2005).
Characteristics of the pilot aquifersThe Sierra de Lıbar aquifer covers a surface area of around90 km2, between the provinces of Malaga and Cadiz, withan average rainfall of 1,500 mm. It is made up of Juras-sic limestones, with a thickness of over 400 m overlain byCretaceous marls and marly-limestones (Fig. 3). The ge-ological structure comprises N40E trending anticlines ofJurassic limestones and synclines of cretaceous materials;although locally the cores of the synclines are covered byQuaternary sediments. Soils overlying the limestones areabsent, with the exception of poljes developed in synclinalstructures where Cretaceous marls and marly-limestonesoutcrop. The lithological and geological structures resultin steep slopes and a flat relief in the central sector whichhas an abundance of karstic landforms (Delannoy 1987),including karren, sinkholes and poljes with swallow holes.In the north of the aquifer there are a large number of karstconduits into which sinking streams pass directly into thelimestone. Most of the discharge from the aquifer is viasprings located on the eastern border. These springs ex-hibit karstic behaviour, responding rapidly to precipitation,with sharp changes in flow (Benavente and Mangin 1984;Jimenez et al. 2004).
The Torremolinos carbonate aquifer (56 km2) is some15 km to the southwest of the city of Malaga (Fig. 2)and is made up of Triassic marbles (Fig. 4), with a thick-ness of 600 m and overlay Paleozoic metapelites (Andreo
Hydrogeology Journal (2006) 14: 912–925 DOI 10.1007/s10040-006-0023-6
917
Fig. 2 Geographical locationof Sierra de Lıbar andTorremolinos aquifers
et al. 1997). The marbles form ESE-WNW trending iso-clinal folds, which have subsequently been subjected tofaulting. At the northern and eastern borders of the sys-tem, Neogene-Quaternary rocks overlay the marbles. Thepredominant soil types are antrosol, regosol and calcisol,overlaying Pliocene marls. These soils are less than 70 cmin thickness, whereas the leptosol which overlays the Tri-assic marbles, is less than 30 cm thick (ICONA 1991). Thetopography is very steep with the exception of northern andeastern parts of the aquifer region. The average rainfall is600 mm per year. Karstic morphologies are very scarce,with limited areas of karren and some small caves (Andreoet al. 1997). Hydrogeologically, the direction of ground-water flow is from West to East, where the main points ofnatural discharge (Torremolinos springs) are located. Hy-drograph analysis of these springs shows a system withdiffuse flow behaviour (Andreo et al. 1997; Andreo andCarrasco 1999).
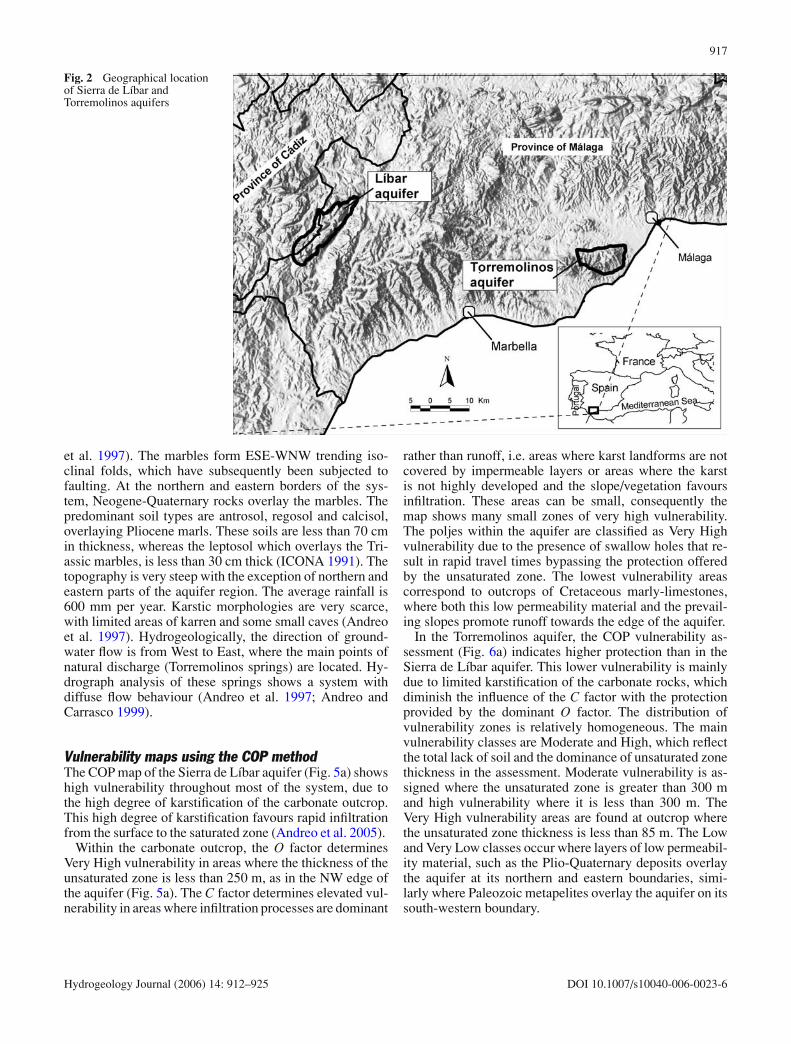
Vulnerability maps using the COP methodThe COP map of the Sierra de Lıbar aquifer (Fig. 5a) showshigh vulnerability throughout most of the system, due tothe high degree of karstification of the carbonate outcrop.This high degree of karstification favours rapid infiltrationfrom the surface to the saturated zone (Andreo et al. 2005).
Within the carbonate outcrop, the O factor determinesVery High vulnerability in areas where the thickness of theunsaturated zone is less than 250 m, as in the NW edge ofthe aquifer (Fig. 5a). The C factor determines elevated vul-nerability in areas where infiltration processes are dominant
rather than runoff, i.e. areas where karst landforms are notcovered by impermeable layers or areas where the karstis not highly developed and the slope/vegetation favoursinfiltration. These areas can be small, consequently themap shows many small zones of very high vulnerability.The poljes within the aquifer are classified as Very Highvulnerability due to the presence of swallow holes that re-sult in rapid travel times bypassing the protection offeredby the unsaturated zone. The lowest vulnerability areascorrespond to outcrops of Cretaceous marly-limestones,where both this low permeability material and the prevail-ing slopes promote runoff towards the edge of the aquifer.
In the Torremolinos aquifer, the COP vulnerability as-sessment (Fig. 6a) indicates higher protection than in theSierra de Lıbar aquifer. This lower vulnerability is mainlydue to limited karstification of the carbonate rocks, whichdiminish the influence of the C factor with the protectionprovided by the dominant O factor. The distribution ofvulnerability zones is relatively homogeneous. The mainvulnerability classes are Moderate and High, which reflectthe total lack of soil and the dominance of unsaturated zonethickness in the assessment. Moderate vulnerability is as-signed where the unsaturated zone is greater than 300 mand high vulnerability where it is less than 300 m. TheVery High vulnerability areas are found at outcrop wherethe unsaturated zone thickness is less than 85 m. The Lowand Very Low classes occur where layers of low permeabil-ity material, such as the Plio-Quaternary deposits overlaythe aquifer at its northern and eastern boundaries, simi-larly where Paleozoic metapelites overlay the aquifer on itssouth-western boundary.
Hydrogeology Journal (2006) 14: 912–925 DOI 10.1007/s10040-006-0023-6

918
Fig. 3 Map of Sierra de Lıbaraquifer (and adjacent area to thenorth west) showing the mainlithological, geomorphologicaland hydrogeological features
Vulnerability maps by other methodsFigures 5 and 6 show the results of several other methods ofvulnerability mapping in the two pilots aquifers, these areDRASTIC (Aller et al. 1987), GOD (Foster 1987) and AVI(Van Stempvoort et al. 1993). These methods have beensuccessfully used in many aquifers worldwide and theywere applied in this study in order to compare the resultsobtained with the COP method.
In the Sierra de Lıbar, the DRASTIC map (Fig. 5b) dis-plays High (but not Very High) vulnerability throughoutmost of the area, due to the scarcity of soils and the highlykarstified nature of the limestones and Moderate vulner-ability in the poljes. The GOD method (Fig. 5c) showsModerate vulnerability throughout most of the study area,where the highly karstified limestones outcrop, and Lowvulnerability in the poljes where Cretaceous marls appear,even when the swallow holes result in rapid infiltration of
stream flow. The AVI map (Fig. 5d) shows High vulner-ability in the majority of the aquifer, due to the high hy-draulic conductivity of the karstified limestones, and Lowvulnerability in the poljes. From this it is apparent that inkarstic aquifers such as the Sierra de Lıbar, conventionalmethods of vulnerability mapping do not adequately assessvulnerability, especially where poljes and swallow holesare prevalent.
In the Torremolinos aquifer (Fig. 6) all methods of vul-nerability assessment show a similar distribution of spatialvariability, i.e. Low vulnerability in areas overlain by thePliocene-Quaternary marls and Moderate to High vulnera-bility in areas of Triassic marbles (Longo et al. 2001; Vıaset al. 2005). The “High” and “Very High” degrees of vul-nerabilities obtained with all the methods, coincide withzones where the water table is closer to the ground surface.For all the methods, the parameters relating to lithology
Hydrogeology Journal (2006) 14: 912–925 DOI 10.1007/s10040-006-0023-6

919
Fig. 4 Map of Torremolinosaquifer showing the mainlithological and hydrogeologicalfeatures (after Andreo 1997).Legend: (1) Plio-Quaternarysediments, (2) Marbles, (3)Metapelites, (4) Unconformity,(5) Fault, (6) Strike-slip fault(7) Normal fault, (8) Reversedanticline, (9) Spring and itsreference, (10) Well, (11) Watertable, (12) Watercourse, (13)Possible transfer ofgroundwater, (14) urban areas
are most relevant, whilst the depth to the water table hasless influence. The “Moderate” vulnerability indicated bythe DRASTIC and GOD methods (Fig. 6b and c) coin-cides with that for the marbles. The AVI method (Fig. 6d)reports higher degrees of vulnerability than other meth-ods. However, the Very High vulnerability indicated in theareas of marble are not confirmed by the known charac-teristics of the aquifer (Andreo et al. 1997; Andreo andCarrasco 1999), namely a thick unsaturated zone and lowhydraulic conductivity which results in diffuse flow. TheTorremolinos aquifer shows diffuse flow behavior (Andreoet al. 1997; Andreo and Carrasco 1999) with rainfall infil-trating slowly because, whilst the marbles are highly frac-tured, they are poorly karstified.
Figure 7 is a histogram that allows comparison of theresults obtained from the four vulnerability mapping meth-ods used in both aquifers. Of the methods used, the COP
method provides the greater differentiation in vulnerabil-ity classes in both aquifers. This results from using factorsthat address not only lithology but also the influence ofkarst features on infiltration (diffuse or concentrated) aswell as rainfall distribution. In addition, the maps obtainedusing the COP method are in better agreement with currenthydrogeological understanding of the pilot aquifers.
Apart from the DRASTIC, GOD and AVI methods whichhave been applied by the current authors to both study areas,vulnerability studies have been carried out in the same areasby different workers. The other methods used were SIN-TACS (Longo et al. 2001), EPIK and PI (Brechenmacher2002; Vıas et al. 2005; Andreo et al. 2005). Each of thesestudies concluded that the COP method was the most ef-fective at assessing the prevailing vulnerability of theseaquifers based on actual hydrogeological understanding ofthe aquifers.
Hydrogeology Journal (2006) 14: 912–925 DOI 10.1007/s10040-006-0023-6
920
Fig. 5 Vulnerability classesobtained with the (a) COP, (b)DRASTIC, (c) GOD and (d)AVI methods, mapped for theSierra de Lıbar aquifer
Validation of intrinsic vulnerability maps
After vulnerability maps are produced, they should bevalidated in order to estimate the validity of the concep-tual understanding of prevailing hydrogeological condi-tions (Bruyere et al. 2001; Jeannin et al. 2001; Goldscheideret al. 2001; Perrin et al. 2004). Several tools can be usedfor the validation of vulnerability assessments (Zwahlen2004); these include hydrographs, chemographs and trac-ers (natural or artificial). Conservative tracers (i.e. isotopesof the water molecule) or near conservative ones (i.e. flu-orescent artificial tracers) are the most reliable. Some ofthese techniques have been used to validate the vulnerabil-ity maps of the pilot sites.
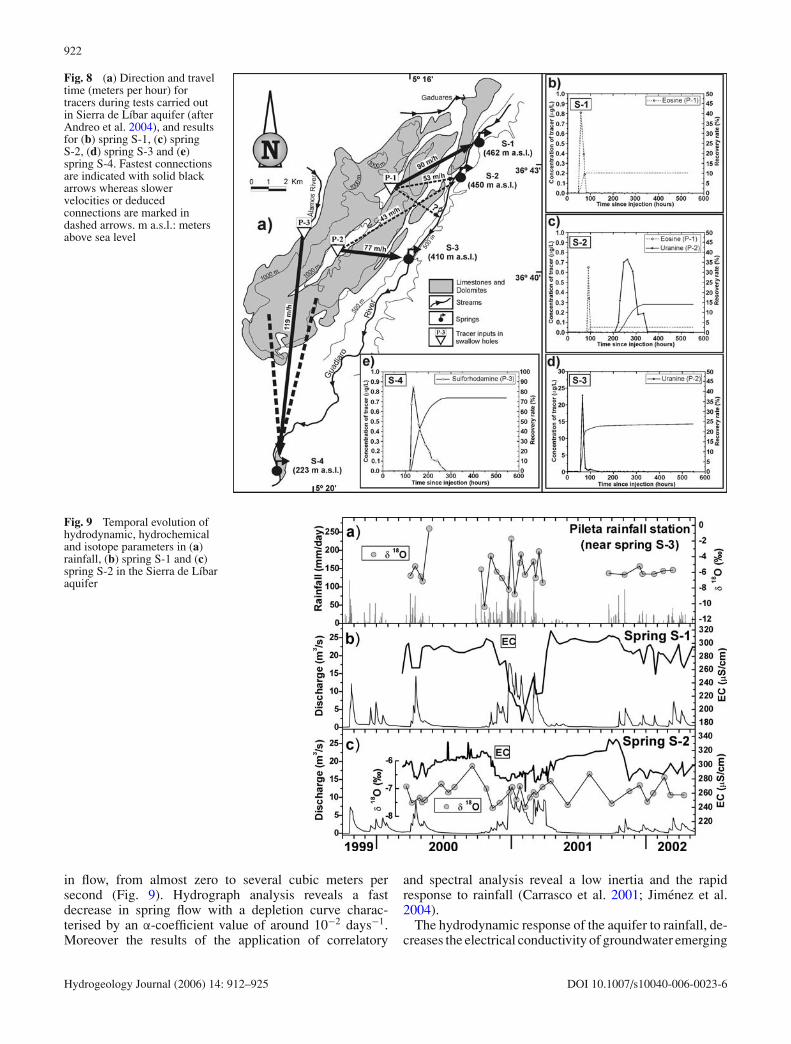
Sierra de Lıbar aquiferTracer tests have been carried out at the Sierra de Lıbarpilot site using artificial tracers (Eosine, Uranine andSulforhodamine-B) in order to validate the intrinsic vul-nerability maps (Andreo et al. 2004). The three tracers
were injected in three swallow holes (P-1, P-2 and P-3,respectively, in Fig. 8a) during a period of high water con-ditions, when sinking streams were active. The results showthe travel time of tracers from the injection point to arrivalat a principal spring to be 3–5 days (Fig. 8b–e) and, asa result, the travel time through the unsaturated zone canbe assumed to be less than 3 days. However the results ofthe tracer tests are only valid for contaminants entering theswallow holes used to inject tracer and not for the whole ofthe aquifer.
From the tests, flow velocities were calculated to behigher than 43 m/h (connection P-2 with spring S-2) witha maximum velocity of 119 m/h (connection P-3 withS-4). These data confirm the high vulnerability of theSierra de Lıbar aquifer, particularly when surface waterinfiltrates into swallow holes (injection points). Thesepoints correspond with the Very High vulnerability classused within the COP method (Fig. 5a).
In addition, the tracer tests also confirmed that if apotential conservative contaminant infiltrates into P-1 andP-2 swallow holes, then the springs S-1, S-2 and S-3 would
Hydrogeology Journal (2006) 14: 912–925 DOI 10.1007/s10040-006-0023-6

921
Fig. 6 Vulnerability classesobtained with the (a) COP, (b)DRASTIC, (c) GOD and (d)AVI methods, mapped for theTorremolinos aquifer
Fig. 7 Percentage surface areafor each vulnerability class inthe Sierra de Lıbar andTorremolinos aquifers usingdifferent methods of assessment
be affected (Fig. 8b–d). However, if contaminant infiltratesinto P-3, only the spring S-4 would be contaminated(Fig. 8e). So, the three swallow holes are highly vulnerableaccording to the vulnerability maps, but the impact of a con-taminant on a spring would depend on the location of theinjection point. The water quality of Guadiaro River wouldbe affected by a contaminant infiltrated into the Sierra deLıbar aquifer via any of the tested swallow holes. This em-phasises the usefulness of tracer tests as a tool to developbetter hydrogeological understanding of karst aquifers.
On the other hand, electrical conductivity (EC) which isindicative of the overall mineralisation of groundwater dis-charging from springs, as well as the isotopic signal of oxy-gen in rainfall and groundwater, are hydrochemical toolsfor the validation of vulnerability mapping. For that reasonthese parameters were monitored in the springs S-1 (EC),S-2 (EC and δ18O) and in the rainfall (δ18O) (see location inFig. 8a).
Recharge events reach the springs very quickly (lessthan 3–4 days after the rain) producing rapid increase
Hydrogeology Journal (2006) 14: 912–925 DOI 10.1007/s10040-006-0023-6
922
Fig. 8 (a) Direction and traveltime (meters per hour) fortracers during tests carried outin Sierra de Lıbar aquifer (afterAndreo et al. 2004), and resultsfor (b) spring S-1, (c) springS-2, (d) spring S-3 and (e)spring S-4. Fastest connectionsare indicated with solid blackarrows whereas slowervelocities or deducedconnections are marked indashed arrows. m a.s.l.: metersabove sea level
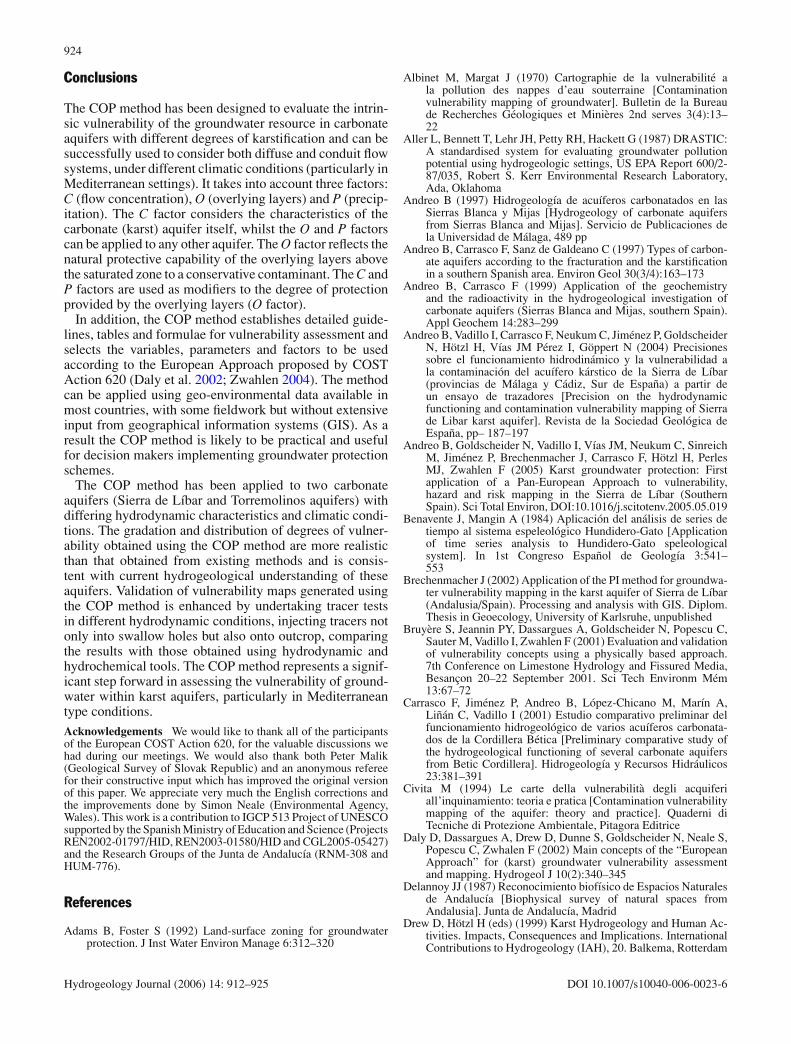
Fig. 9 Temporal evolution ofhydrodynamic, hydrochemicaland isotope parameters in (a)rainfall, (b) spring S-1 and (c)spring S-2 in the Sierra de Lıbaraquifer
in flow, from almost zero to several cubic meters persecond (Fig. 9). Hydrograph analysis reveals a fastdecrease in spring flow with a depletion curve charac-terised by an α-coefficient value of around 10−2 days−1.Moreover the results of the application of correlatory
and spectral analysis reveal a low inertia and the rapidresponse to rainfall (Carrasco et al. 2001; Jimenez et al.2004).
The hydrodynamic response of the aquifer to rainfall, de-creases the electrical conductivity of groundwater emerging
Hydrogeology Journal (2006) 14: 912–925 DOI 10.1007/s10040-006-0023-6

923
Fig. 10 Temporal evolution ofhydrodynamic andhydrochemical parameters in(a) rainfall in Benalmadenastation, located 6 km west of thesprings, (b) spring T-1 and (c)spring T-2 in the Torremolinosaquifer (from historic data)
from springs (Fig. 9) to between 50 µS/cm (Spring S-2)and 120 µS/cm (Spring S-1). Rapid reductions in electri-cal conductivity are detected after each recharge period;however the lowest values are recorded several weeks afterthe maximum flow rate. This suggests that transit times areshort due to the development of karstic drainage (conduitflow) within the calcareous rocks of the Sierra de Lıbaraquifer (Jimenez et al. 2004), although the influence ofrecharge in the aquifer is longer than was suggested by thetracer tests. These data demonstrate that the hydrochemicalresponse in the springs result from the whole of their catch-ment area and not simply from point sources (i.e. swallowhole); the spring catchments can be seen to integrate areasof the aquifer which have different vulnerability classes(not only Very High).
Analysis of the isotopic contents of the area’s rainwaterand groundwater from spring S-2 supports the observationsmade from analysing the hydrodynamic and hydrochem-ical responses of the aquifer (Jimenez et al. 2004). Theconservation of the rainfall signal within the hydrodynamicresponse of the aquifer, as observed at a spring, is indicativeof rapid infiltration of rainwater without significant mixingwith groundwater within the satured zone.
Artificial and natural tracers demonstrate the high vul-nerability of the Sierra de Lıbar karst aquifer, howevernatural tracers provide information on the entire systemand artificial tracers provide information only on selectedpoints. The high vulnerability of the Sierra de Libar aquifer,as assessed using the COP method, is consistent with ac-tual known episodes of groundwater contamination. Theseepisodes are normally short in time and are detected wherewater is abstracted from the aquifer to supply the village ofBenaojan (see Fig. 3).
Torremolinos aquiferNo tracer tests have been carried out in the Torremolinosaquifer, however data from natural tracers are available.Historical discharge data from the Torremolinos springs(T-1 and T-2 in Fig. 10) show an absence of sharp peaksin the hydrograph and high flows occurring severalmonths after periods of high rainfall. The spring dischargeresponds slowly to rainfall due to the great hydraulic inertiaof the system. The analysis of historical hydrographs showthat infiltration occurs slowly and that the springs mayremain in a state of depletion (α = 10−4 days−1) for severalyears (Andreo 1997). Correlatory and spectral analysiscorroborates the observation that the system possessesa high inertia. More recent recharge periods have notmodified the decreasing trend in the hydrograph due togroundwater abstraction. Electrical conductivity data fromthe springs show a narrow range of variation (Fig. 10b andc). Tritium data from the springs indicate that some of thegroundwater abstracted in the Torremolinos area during1994 originated from recharge which occurred in 1986(Andreo and Carrasco 1999).
Groundwater within the Torremolinos aquifer shows noevidence of contamination, despite extensive threat fromhuman activity across the whole of the aquifer outcrop(e.g. landfill, waste pipe lines in urban areas and petrolstations). The assessment of moderate vulnerability for theaquifer outcrop, arising from use of the COP method, issupported by independent lines of evidence as well as cur-rent knowledge of the aquifer’s behavior (Vıas et al. 2005).This moderate vulnerability is a result of: a thick unsat-urated zone, relatively low hydraulic conductivity, stronghydraulic inertia and therefore diffuse flow behavior.
Hydrogeology Journal (2006) 14: 912–925 DOI 10.1007/s10040-006-0023-6
924
Conclusions
The COP method has been designed to evaluate the intrin-sic vulnerability of the groundwater resource in carbonateaquifers with different degrees of karstification and can besuccessfully used to consider both diffuse and conduit flowsystems, under different climatic conditions (particularly inMediterranean settings). It takes into account three factors:C (flow concentration), O (overlying layers) and P (precip-itation). The C factor considers the characteristics of thecarbonate (karst) aquifer itself, whilst the O and P factorscan be applied to any other aquifer. The O factor reflects thenatural protective capability of the overlying layers abovethe saturated zone to a conservative contaminant. The C andP factors are used as modifiers to the degree of protectionprovided by the overlying layers (O factor).
In addition, the COP method establishes detailed guide-lines, tables and formulae for vulnerability assessment andselects the variables, parameters and factors to be usedaccording to the European Approach proposed by COSTAction 620 (Daly et al. 2002; Zwahlen 2004). The methodcan be applied using geo-environmental data available inmost countries, with some fieldwork but without extensiveinput from geographical information systems (GIS). As aresult the COP method is likely to be practical and usefulfor decision makers implementing groundwater protectionschemes.
The COP method has been applied to two carbonateaquifers (Sierra de Lıbar and Torremolinos aquifers) withdiffering hydrodynamic characteristics and climatic condi-tions. The gradation and distribution of degrees of vulner-ability obtained using the COP method are more realisticthan that obtained from existing methods and is consis-tent with current hydrogeological understanding of theseaquifers. Validation of vulnerability maps generated usingthe COP method is enhanced by undertaking tracer testsin different hydrodynamic conditions, injecting tracers notonly into swallow holes but also onto outcrop, comparingthe results with those obtained using hydrodynamic andhydrochemical tools. The COP method represents a signif-icant step forward in assessing the vulnerability of ground-water within karst aquifers, particularly in Mediterraneantype conditions.Acknowledgements We would like to thank all of the participantsof the European COST Action 620, for the valuable discussions wehad during our meetings. We would also thank both Peter Malik(Geological Survey of Slovak Republic) and an anonymous refereefor their constructive input which has improved the original versionof this paper. We appreciate very much the English corrections andthe improvements done by Simon Neale (Environmental Agency,Wales). This work is a contribution to IGCP 513 Project of UNESCOsupported by the Spanish Ministry of Education and Science (ProjectsREN2002-01797/HID, REN2003-01580/HID and CGL2005-05427)and the Research Groups of the Junta de Andalucıa (RNM-308 andHUM-776).
References
Adams B, Foster S (1992) Land-surface zoning for groundwaterprotection. J Inst Water Environ Manage 6:312–320
Albinet M, Margat J (1970) Cartographie de la vulnerabilite ala pollution des nappes d’eau souterraine [Contaminationvulnerability mapping of groundwater]. Bulletin de la Bureaude Recherches Geologiques et Minieres 2nd serves 3(4):13–22
Aller L, Bennett T, Lehr JH, Petty RH, Hackett G (1987) DRASTIC:A standardised system for evaluating groundwater pollutionpotential using hydrogeologic settings, US EPA Report 600/2-87/035, Robert S. Kerr Environmental Research Laboratory,Ada, Oklahoma
Andreo B (1997) Hidrogeologıa de acuıferos carbonatados en lasSierras Blanca y Mijas [Hydrogeology of carbonate aquifersfrom Sierras Blanca and Mijas]. Servicio de Publicaciones dela Universidad de Malaga, 489 pp
Andreo B, Carrasco F, Sanz de Galdeano C (1997) Types of carbon-ate aquifers according to the fracturation and the karstificationin a southern Spanish area. Environ Geol 30(3/4):163–173
Andreo B, Carrasco F (1999) Application of the geochemistryand the radioactivity in the hydrogeological investigation ofcarbonate aquifers (Sierras Blanca and Mijas, southern Spain).Appl Geochem 14:283–299
Andreo B, Vadillo I, Carrasco F, Neukum C, Jimenez P, GoldscheiderN, Hotzl H, Vıas JM Perez I, Goppert N (2004) Precisionessobre el funcionamiento hidrodinamico y la vulnerabilidad ala contaminacion del acuıfero karstico de la Sierra de Lıbar(provincias de Malaga y Cadiz, Sur de Espana) a partir deun ensayo de trazadores [Precision on the hydrodynamicfunctioning and contamination vulnerability mapping of Sierrade Libar karst aquifer]. Revista de la Sociedad Geologica deEspana, pp– 187–197
Andreo B, Goldscheider N, Vadillo I, Vıas JM, Neukum C, SinreichM, Jimenez P, Brechenmacher J, Carrasco F, Hotzl H, PerlesMJ, Zwahlen F (2005) Karst groundwater protection: Firstapplication of a Pan-European Approach to vulnerability,hazard and risk mapping in the Sierra de Lıbar (SouthernSpain). Sci Total Environ, DOI:10.1016/j.scitotenv.2005.05.019
Benavente J, Mangin A (1984) Aplicacion del analisis de series detiempo al sistema espeleologico Hundidero-Gato [Applicationof time series analysis to Hundidero-Gato speleologicalsystem]. In 1st Congreso Espanol de Geologıa 3:541–553
Brechenmacher J (2002) Application of the PI method for groundwa-ter vulnerability mapping in the karst aquifer of Sierra de Lıbar(Andalusia/Spain). Processing and analysis with GIS. Diplom.Thesis in Geoecology, University of Karlsruhe, unpublished
Bruyere S, Jeannin PY, Dassargues A, Goldscheider N, Popescu C,Sauter M, Vadillo I, Zwahlen F (2001) Evaluation and validationof vulnerability concepts using a physically based approach.7th Conference on Limestone Hydrology and Fissured Media,Besancon 20–22 September 2001. Sci Tech Environm Mem13:67–72
Carrasco F, Jimenez P, Andreo B, Lopez-Chicano M, Marın A,Linan C, Vadillo I (2001) Estudio comparativo preliminar delfuncionamiento hidrogeologico de varios acuıferos carbonata-dos de la Cordillera Betica [Preliminary comparative study ofthe hydrogeological functioning of several carbonate aquifersfrom Betic Cordillera]. Hidrogeologıa y Recursos Hidraulicos23:381–391
Civita M (1994) Le carte della vulnerabilita degli acquiferiall’inquinamiento: teoria e pratica [Contamination vulnerabilitymapping of the aquifer: theory and practice]. Quaderni diTecniche di Protezione Ambientale, Pitagora Editrice
Daly D, Dassargues A, Drew D, Dunne S, Goldscheider N, Neale S,Popescu C, Zwhalen F (2002) Main concepts of the “EuropeanApproach” for (karst) groundwater vulnerability assessmentand mapping. Hydrogeol J 10(2):340–345
Delannoy JJ (1987) Reconocimiento biofısico de Espacios Naturalesde Andalucıa [Biophysical survey of natural spaces fromAndalusia]. Junta de Andalucıa, Madrid
Drew D, Hotzl H (eds) (1999) Karst Hydrogeology and Human Ac-tivities. Impacts, Consequences and Implications. InternationalContributions to Hydrogeology (IAH), 20. Balkema, Rotterdam
Hydrogeology Journal (2006) 14: 912–925 DOI 10.1007/s10040-006-0023-6

925
Doerfliger N, Zwahlen F. (1998) Groundwater Vulnerability Map-ping in Karstic Regions (EPIK) – Application to GroundwaterProtection Zones. Swiss Agency for the Environment, Forestsand Landscape (SAEFL), Bern
Doerfliger N, Jeannin PY, Zwahlen F (1999) Water vulnerabilityassessment in karst environments: a new method of definingprotection areas using a multi-attribute approach and GIS tools(EPIK method). Environ Geol 39(2):165–176
European Commission (1995) Hydrogeological aspects of ground-water protection in karstic areas. Report EUR 16547 EN,Brussels
European Commission (2000) Directive 2000/60/EC. EuropeanWater Framework Directive for European water managementestablishing a framework for community action in the field ofwater policy
European Commission (2003) Directive 2003/0210/EC. EuropeanGroundwater Directive of the European Parliament and of theCouncil on the Protection of Groundwater Against Pollution
Foster S (1987) Fundamental concepts in aquifer vulnerability,pollution risk and protection strategy. In: Van DuijvenboodenW, Van Waegeningh HG (eds) Vulnerability of soil and ground-water to pollutants. Committee on Hydrological Research, TheHague, pp 69–86
Foster S, Hirata R (1988) Groundwater pollution risk assessment: amethodology using available data. WHO-PAHO-CEPIS, Lima
Gogu R, Dassargues A (2000) Current trends and future challengesin groundwater vulnerability assessment using overly and indexmethods. Environ Geol 39(6):549–559
Goldscheider N, Klute M, Sturm S, Hotzl H (2000) The PI method– a GIS- based approach to mapping groundwater vulnerabilitywith special consideration of karst aquifers. Zeitschrift furAngewandte Geologie 46(3):157–166
Goldscheider N, Hotzl H, Fries W, Jordan P (2001) Validation of avulnerability map (EPIK) with tracer tests. 7th Conference onLimestone Hydrology and Fissured Media, Besancon 20–22September 2001. Sci Tech Environm Mem 13:167–170
Goldscheider N (2005) Karst groundwater vulnerability mapping:application of a new method in the Swabian Alb, Germany.Hydrogeol J 13:555–564
Goldscheider N, Popescu C (2004) The European Approach.In: Zwahlen F (ed) Vulnerability and risk mapping for theprotection of carbonate (karst) aquifers. European Commission,Brussels, pp 17–21
ICONA (1991) Soil map and report of Andalusia. LUCDEMEproject Sheet 1066 (Coın) and 1067 (Malaga). ICONA, Madrid
Jeannin PY, Cornaton F, Zwahlen F, Perrochet P (2001) VULK: a toolfor intrinsic vulnerability assessment and validation. 7th Con-ference on Limestone Hydrology and Fissured Media, Besancon20–22 September 2001. Sci Tech Environm Mem 13:185–188
Jimenez P, Andreo B, Carrasco F (2004) Analisis de la descargadel sector nororiental de la Unidad Hidrogeologica de Lıbar(Provincias de Malaga y Cadiz, Sur de Espana) [Analysis of thedischarge in the NE sector of Sierra de Libar hydrogeologicalunit (Provinces of Malaga and Cadiz, S Spain)]. JornadasLuso-Espanolas As Aguas Subterraneas no sul da PenınsulaIberica [Portuguese-Spanish Congress on Groundwater in theSouth of Iberian Peninsula], Faro, Portugal, 106–117
Longo A, Andreo B, Carrasco F, Cucchi F, Vıas JM Jimenez P(2001) Comparison of two contamination vulnerability mapsobtained by the SINTACS method in two carbonate aquifers(S Spain). In: Proceedings of the 7th Conference on LimestoneHydrology and Fissured Media. Besancon, Francia, pp 233–236
Lopez-Geta JA, Andreo B, Vıas J, Duran JJ, Carrasco F, Jimenez P(2004) Aproximacion metodologica para evaluar la recarga enacuıferos carbonaticos [Methodological approach to evaluatethe recharge rate in carbonate aquifers]. International Congressof IAH, Zacatecas, Mexico
Margat J (1968) Vulnerabilite des nappes d’eau souterraine a la pol-lution [Contamination vulnerability mapping of groundwater].Bureau de Recherches Geologiques et Minieres, Orleans
Perrin J, Pochon A, Jeannin PY, Zwahlen F (2004) Vulnerabilityassessment in karstic areas: validation by field experiments.Environ Geol 46:237–245
Van Stempvoort D, Ewert L, Wassenaar L (1993) Aquifer vulnera-bility index (AVI): A GIS compatible method for groundwatervulnerability mapping. Can Water Res J 18:25–37
Vıas JM, Andreo B, Perles MJ, Carrasco F (2005) A comparativestudy of four schemes for groundwater vulnerability mapping ina diffuse flow carbonate aquifer under Mediterranean climaticconditions. Environ Geol 47:586–595
Vrba J, Zaporozec A (1994) Guidebook on mapping groundwatervulnerability. International Association of Hydrogeologists,Verlag, Heinz Heise
Zwahlen F (ed) (2004) Vulnerability and risk mapping for theprotection of carbonate (karst) aquifers, final report (COSTaction 620). European Commission, Brussels
Hydrogeology Journal (2006) 14: 912–925 DOI 10.1007/s10040-006-0023-6